Mesoscale eddies and submesoscale structures of Persian GulfWater off the Omani coast in spring 2011Pierre L’Hégaret1, Xavier Carton1, Stephanie Louazel2, and Guillaume Boutin1
1Laboratoire de Physique des Oceans/UMR6523, UBO, 6 avenue Le Gorgeu CS93837, 29238 Brest CEDEX 3, France2Service Hydrographique et Oceanographique de la Marine, 13 rue de Chatellier CS92803,29228 Brest CEDEX 2, Brest, France
Received: 8 October 2015 – Published in Ocean Sci. Discuss.: 13 November 2015Revised: 9 April 2016 – Accepted: 27 April 2016 – Published: 20 May 2016
Abstract. The Persian Gulf produces high-salinity water(Persian Gulf Water, PGW hereafter), which flows into theSea of Oman via the Strait of Hormuz. Beyond the Straitof Hormuz, the PGW cascades down the continental slopeand spreads in the Sea of Oman under the influence of theenergetic mesoscale eddies. The PGW outflow has differentthermohaline characteristics and pathways, depending on theseason. In spring 2011, the Phys-Indien experiment was car-ried out in the Arabian Sea and in the Sea of Oman. ThePhys-Indien 2011 measurements, as well as satellite obser-vations, are used here to characterize the circulation inducedby the eddy field and its impact on the PGW pathway andevolution.
During the spring intermonsoon, an anticyclonic eddy isoften observed at the mouth of the Sea of Oman. It creates afront between the eastern and western parts of the basin. Thisstructure was observed in 2011 during the Phys-Indien ex-periment. Two energetic eddies were also present along thesouthern Omani coast in the Arabian Sea. At their periph-eries, ribbons of freshwater and cold water were found dueto the stirring created by the eddies.
The PGW characteristics are strongly influenced by theseeddies. In the western Sea of Oman, in 2011, the PGW wasfragmented into filaments and submesoscale eddies. It alsorecirculated locally, thus creating salty layers with differentdensities. In the Arabian Sea, a highly saline submesoscalelens was recorded offshore. Its characteristics are analyzedhere and possible origins are proposed. The recurrence ofsuch lenses in the Arabian Sea is also briefly examined.
1 Introduction
The Indian Ocean, the third tropical basin in size, is boundedto the north by the Asian landmass. This landmass leads tothe existence of monsoons, which strongly influence the re-gional oceanic circulation. The northwestern part of the In-dian Ocean is comprised of different sub-basins, each withspecific geographic and climatic characteristics. This studyfocuses on two of them, the Sea of Oman (or Gulf of Oman)and the Arabian Sea (see Fig. 1). The Sea of Oman connectsthe Persian Gulf to the Arabian Sea; this sea deepens andwidens along its zonal axis, from the Strait of Hormuz to itsmouth, at Ra’s Al Hadd. The northwestern Arabian Sea hasa narrow continental shelf, which widens only from Ra’s AlHadd to Ra’s Madrakah along the Omani coast (see againFig. 1 for locations). The Arabian Sea is also crossed by theOwen Fracture Zone from northeast to southwest, with div-ing and rising of the seafloor along the fault.
The surface circulation around the Arabian Peninsula isforced by the atmospheric monsoon cycle. During the South-west monsoon, in summer, strong and steady southwesterlywinds run across the basin (see Findlater, 1969); they reversein winter, during the Northeast monsoon, with also steadybut weaker winds. The intermonsoons, in spring and fall, aremarked by a decrease in wind intensity and a loss of preferreddirection.
The upper ocean response is highly variable spatially andseasonally. In summer (winter), alongshore currents extendalong a “belt”, with a negative (positive) sea level anomalyalong the western and northern coasts. These anomalies growunder the influence of the monsoon wind stress, associated
Published by Copernicus Publications on behalf of the European Geosciences Union.
688 P. L’Hégaret: Mesoscale eddies and submesoscale structures of Persian Gulf Water
Figure 1. Topographic map of the Arabian Sea and Sea of Omanwith the locations of interest.
with upwellings (downwellings) (see Lee et al., 2000). Thesecurrents then destabilize to form meanders and mesoscale ed-dies with a radius comparable with or slightly larger than thefirst baroclinic radius of deformation (about 40 km in the re-gion; see Chelton et al., 1998). These eddies are known todominate the near-surface circulation offshore (see Fischeret al., 2002) and to induce horizontal transports. They havea vertical influence on the water masses at depth (see Bowerand Furey, 2012, and Carton et al., 2012). Other processescan lead to the formation of such eddies, depending on thelocation and the season. Al Saafani et al. (2007) identifiededdies in the Gulf of Aden generated by Rossby waves emit-ted from the Indian coast or amplified in the interior of thebasin. This mechanism is also present in the northern Ara-bian Sea, with Rossby waves being forced by wind and bycoastal Kelvin waves (see L’Hégaret et al., 2015).
Over the Persian Gulf, steady winds and solar heating leadto intense evaporation (see Privett, 1959; Meshal and Hassan,1986); this region also has little freshwater inflow (throughprecipitation and rivers; see Reynolds, 1993); the large deficitof precipitation (or river inflow) over evaporation results inthe formation of highly saline water in the Persian Gulf. Thiswater mass, called PGW (Persian Gulf Water), with salin-ity above 40 psu, flows into the Sea of Oman via the Straitof Hormuz. The density of the outflowing PGW varies sea-sonally, the densest water being formed in winter (Swift andBower, 2003). In the Sea of Oman, the PGW outflow equi-
librates around 250 m depth, mixing with the fresher IndianOcean Central Water (IOCW). Another salty water mass, theArabian Sea High Salinity Water (ASHSW), with salinityabove 36.6 psu, forms in the Arabian Sea in winter (see Ku-mar and Prasad, 1999) and occupies the upper part of thewater column.
In the past, a few dedicated cruises provided observationsto describe the PGW pathway out of the Persian Gulf and itsvariations in the Sea of Oman. The PGW outflow was usuallypresented as a southeastward flow along the coast of Oman(see Premchand et al., 1986). Indeed, in October–November1999, during the fall intermonsoon, the GOGP991 experi-ment at sea sampled the PGW outflow and identified it asa coastal flow, extending to the southern coast of Oman (seePous et al., 2004). During other seasons, the path of the PGWin the Gulf of Oman is less regular, as shown by observa-tions and by numerical modeling; also, PGW can exit in theform of short pulses (see Banse, 1997; Senjyu et al., 1998;Bower et al., 2000; Prasad et al., 2001; Thoppil and Hogan,2009; Wang et al., 2012; Wang et al., 2013). Recently, ARGOfloats (see Carton et al., 2012; L’Hégaret et al., 2013) andHYCOM numerical simulations (see L’Hégaret et al., 2015)confirmed that during other seasons, PGW can be expelledfrom the coast into the Sea of Oman. These ejections were re-lated to the presence of mesoscale eddies in the Sea of Oman,and especially to the presence of a dipole in spring; differentoffshore ejection mechanisms were identified. PGW ejectionwas also identified in response to tropical atmospheric cy-clones (in particular cyclone Gonu; Wang et al., 2012, 2013).
In spring 2011, the Phys-Indien experiment was carriedout around the Arabian Peninsula, recording the thermo-haline and dynamical characteristics of the upper ocean.Mesoscale surface eddies and submesoscale fragments ofPGW were sampled in the Sea of Oman and off Ra’s AlHadd, in the Arabian Sea.
The objective of this paper is twofold. First, it describesthe mesoscale surface eddies in spring 2011 and how theyadvect the surrounding water masses. Second, it presentsthe structure and possible recurrence of submesoscale PGWfragments, in particular those embedded in mesoscale eddies.To achieve these objectives, in situ data collected during thePhys-Indien experiment and satellite measurements are used.The altimetric data provide temporal continuity to study theevolution of the mesoscale features (but with a low spatialresolution). The in situ observations give a finer-scale, butinstantaneous, description of the eddies and water masses.
1.1 The Phys-Indien 2011 measurements
The Phys-Indien 2011 experiment measured the circulationand water masses in the sub-basins around the ArabianPeninsula, from the Red Sea to the Persian Gulf, starting
1GOGP99 for the Gulf of Oman – Persian Gulf experiment inOctober 1999
P. L’Hégaret: Mesoscale eddies and submesoscale structures of Persian Gulf Water 689
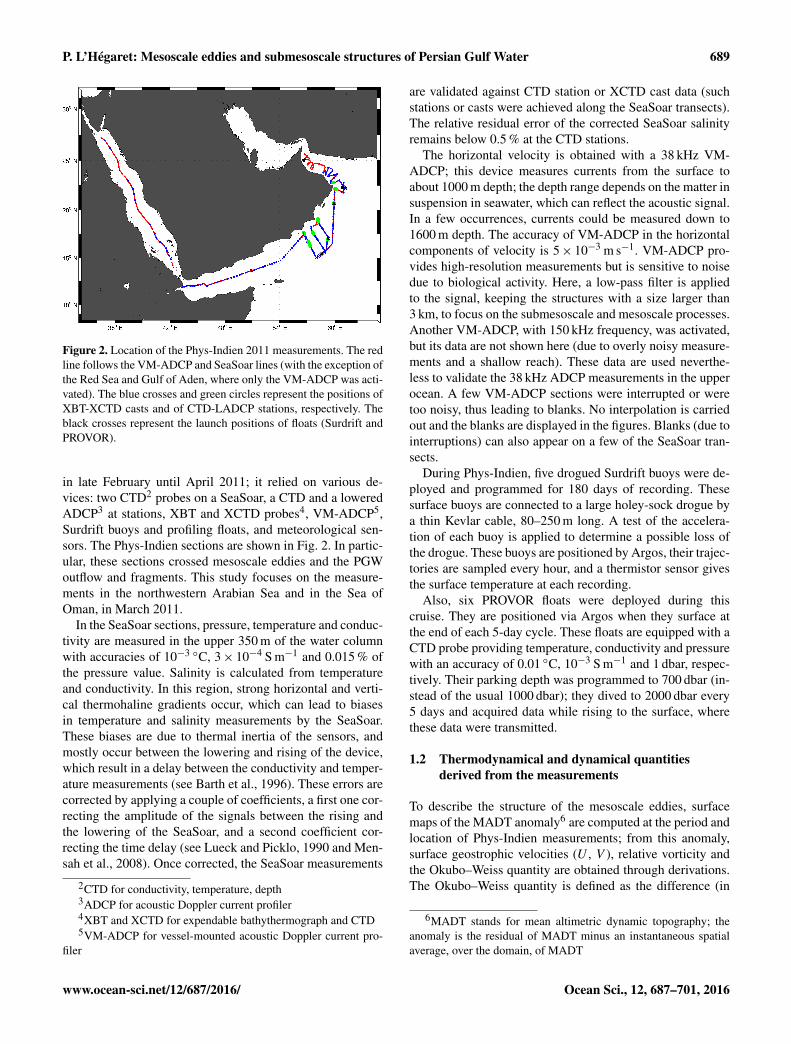
Figure 2. Location of the Phys-Indien 2011 measurements. The redline follows the VM-ADCP and SeaSoar lines (with the exception ofthe Red Sea and Gulf of Aden, where only the VM-ADCP was acti-vated). The blue crosses and green circles represent the positions ofXBT-XCTD casts and of CTD-LADCP stations, respectively. Theblack crosses represent the launch positions of floats (Surdrift andPROVOR).
in late February until April 2011; it relied on various de-vices: two CTD2 probes on a SeaSoar, a CTD and a loweredADCP3 at stations, XBT and XCTD probes4, VM-ADCP5,Surdrift buoys and profiling floats, and meteorological sen-sors. The Phys-Indien sections are shown in Fig. 2. In partic-ular, these sections crossed mesoscale eddies and the PGWoutflow and fragments. This study focuses on the measure-ments in the northwestern Arabian Sea and in the Sea ofOman, in March 2011.
In the SeaSoar sections, pressure, temperature and conduc-tivity are measured in the upper 350 m of the water columnwith accuracies of 10−3 ◦C, 3× 10⁻⁴ S m−1 and 0.015 % ofthe pressure value. Salinity is calculated from temperatureand conductivity. In this region, strong horizontal and verti-cal thermohaline gradients occur, which can lead to biasesin temperature and salinity measurements by the SeaSoar.These biases are due to thermal inertia of the sensors, andmostly occur between the lowering and rising of the device,which result in a delay between the conductivity and temper-ature measurements (see Barth et al., 1996). These errors arecorrected by applying a couple of coefficients, a first one cor-recting the amplitude of the signals between the rising andthe lowering of the SeaSoar, and a second coefficient cor-recting the time delay (see Lueck and Picklo, 1990 and Men-sah et al., 2008). Once corrected, the SeaSoar measurements
2CTD for conductivity, temperature, depth3ADCP for acoustic Doppler current profiler4XBT and XCTD for expendable bathythermograph and CTD5VM-ADCP for vessel-mounted acoustic Doppler current pro-
filer
are validated against CTD station or XCTD cast data (suchstations or casts were achieved along the SeaSoar transects).The relative residual error of the corrected SeaSoar salinityremains below 0.5 % at the CTD stations.
The horizontal velocity is obtained with a 38 kHz VM-ADCP; this device measures currents from the surface toabout 1000 m depth; the depth range depends on the matter insuspension in seawater, which can reflect the acoustic signal.In a few occurrences, currents could be measured down to1600 m depth. The accuracy of VM-ADCP in the horizontalcomponents of velocity is 5× 10⁻³ m s−1. VM-ADCP pro-vides high-resolution measurements but is sensitive to noisedue to biological activity. Here, a low-pass filter is appliedto the signal, keeping the structures with a size larger than3 km, to focus on the submesoscale and mesoscale processes.Another VM-ADCP, with 150 kHz frequency, was activated,but its data are not shown here (due to overly noisy measure-ments and a shallow reach). These data are used neverthe-less to validate the 38 kHz ADCP measurements in the upperocean. A few VM-ADCP sections were interrupted or weretoo noisy, thus leading to blanks. No interpolation is carriedout and the blanks are displayed in the figures. Blanks (due tointerruptions) can also appear on a few of the SeaSoar tran-sects.
During Phys-Indien, five drogued Surdrift buoys were de-ployed and programmed for 180 days of recording. Thesesurface buoys are connected to a large holey-sock drogue bya thin Kevlar cable, 80–250 m long. A test of the accelera-tion of each buoy is applied to determine a possible loss ofthe drogue. These buoys are positioned by Argos, their trajec-tories are sampled every hour, and a thermistor sensor givesthe surface temperature at each recording.
Also, six PROVOR floats were deployed during thiscruise. They are positioned via Argos when they surface atthe end of each 5-day cycle. These floats are equipped with aCTD probe providing temperature, conductivity and pressurewith an accuracy of 0.01 ◦C, 10−3 S m−1 and 1 dbar, respec-tively. Their parking depth was programmed to 700 dbar (in-stead of the usual 1000 dbar); they dived to 2000 dbar every5 days and acquired data while rising to the surface, wherethese data were transmitted.
1.2 Thermodynamical and dynamical quantitiesderived from the measurements
To describe the structure of the mesoscale eddies, surfacemaps of the MADT anomaly6 are computed at the period andlocation of Phys-Indien measurements; from this anomaly,surface geostrophic velocities (U , V ), relative vorticity andthe Okubo–Weiss quantity are obtained through derivations.The Okubo–Weiss quantity is defined as the difference (in
6MADT stands for mean altimetric dynamic topography; theanomaly is the residual of MADT minus an instantaneous spatialaverage, over the domain, of MADT
690 P. L’Hégaret: Mesoscale eddies and submesoscale structures of Persian Gulf Water
norm) between total deformation and relative vorticity
OW= σ 2strain+ σ
2shear−ω
2
with the shear, σshear =∂V
∂x+∂U
∂y
the strain σstrain =∂U
∂x−∂V
∂y
and the relative vorticity ω =∂V
∂x−∂U
∂y.
The Okubo–Weiss quantity is positive in regions where de-formation dominates rotation, and it is negative where vortic-ity dominates.
From the thermohaline data, density and spice (or spici-ness) are calculated along the sections. In situ density is ob-tained by an equation of state from IOC and IAPSO (2010).The density anomaly σ0 is displayed. Using T0, S0 and ρ0,the reference temperature, salinity and density, 20 ◦C, 37 psuand 998 kg m−3, spice γ is calculated via
γ = γ0 [1+α (T − T0)+β (S− S0)]
(according to the definition by Smith and Ferrari, 2009).Spice concentrations highlight here the submesoscale struc-tures at the periphery of the eddies. This variable shows amarked difference between the salty waters trapped insidethe mesoscale eddies and the fresher water patches surround-ing them. Using the slope of spice layers across isopycniclayers, their formation by the eddy shear and strain can bestudied.
Using velocities from the VM-ADCP measurements anddensity from the SeaSoar, a two-dimensional Ertel potentialvorticity (EPV; see Hoskins, 1974) can be calculated alongeach section:
EPV=(f +
∂Vg
∂x
)∂b
∂z−∂Vg
∂z
∂b
∂x,
with b =−(g
ρ0
)ρ the buoyancy. Its anomaly is
EPVA= EPV− f∂b
∂z.
Note that this calculation leads to some small-scale noisein the EPV anomaly due to the SeaSoar and VM-ADCP reso-lution; the figures presented in the text are slightly smoothedfor legibility.
2 Onset of the spring 2011 intermonsoon mesoscalesituation
The spring intermonsoon extends on average from Februaryto May in the Arabian Sea. During this period, the wind re-laxes between the two local maxima of the winter and sum-mer monsoons. In 2011, the wind stress curl off Ra’s Al Hadd
Figure 3. Maps of the MADT (altimetric) anomaly averaged over amonth, from November 2010 to June 2011. Anticyclone A1 formedand remained in the eastern Sea of Oman from December 2010 toApril 2011; anticyclone A2 formed from the coastal “belt” along theOmani coast in February 2011, intensifying during summer 2011;anticyclone A3 split from A1 in March 2011 and remained at themouth of the Sea of Oman; cyclone C1 formed and remained offRa’s Al Hadd in late 2010, intensifying until February 2011; cy-clone C2 formed in late 2011 and drifted southwestward.
changed sign from March to May. During this period, thewind work leads to a deepening of the surface eddies (seeL’Hégaret et al., 2015 and Vic et al., 2014).
In Fig. 3, the MADT anomaly is displayed over the Seaof Oman and the northwestern Arabian Sea from the wintermonsoon to the beginning of the summer monsoon (Novem-ber 2010 to June 2011). In November 2010, an alongshorecurrent, associated with a positive MADT anomaly, flowedalong the southern coast of Oman (the coastal “belt” of theMADT anomaly described in L’Hégaret et al., 2015); it isdriven by the Ekman currents. This current formed mean-ders in December 2010 and January 2011 along the coastof Oman. During these months, mesoscale cyclone C1 ex-ited the Sea of Oman and cyclone C2 propagated southwest-ward along the coast of Oman. Both the Owen fracture zoneand the coastal current can channel these cyclones along thecoast.
From December 2010 through February 2011, the positiveMADT anomaly in the Sea of Oman showed the onset of alarge anticyclonic eddy – A1. This anticyclone A1 was part
P. L’Hégaret: Mesoscale eddies and submesoscale structures of Persian Gulf Water 691
of a dipole recorded by ARGO floats, located nearly everyspring near Ra’s al Hamra (see L’Hégaret et al., 2013). Southof Ra’s Al Hadd, in the Arabian Sea, an alongshore meanderformed an anticyclone (A2), splitting apart the C1 and C2 cy-clones. The first cyclone (C1) remained east of Ra’s Al Hadduntil April; the second cyclone (C2) drifted southwestward,decreasing in intensity.
From March 2011 through May 2011, A1 split into twoanticyclones, A1 and A3. Thus during the Phys-Indien ex-periment three main vortices lined up along 61◦ E, south andnorth of Ra’s Al Hadd: the anticyclone at the mouth of theSea of Oman (A3), the cyclone at Ra’s al Hadd (C1) and theanticyclone south of it (A2).
In May–June 2011, with the onset of the summer mon-soon, the sea surface warmed up, cyclone C1 weakens, A2intensified in relation to the increasing negative wind stresscurl, and the alongshore current started to form with a nega-tive MADT anomaly in response to the onset of the summermonsoon.
The observed evolution of the structures in the region dur-ing spring 2011 corresponds on average to the usual springintermonsoon, with large structures dominating the surfacecirculation and a strong anticyclonic signature in the easternSea of Oman. The eddies influence the distribution of the seasurface temperature, intensifying the thermal front near Ra’sal Hadd (and, later on, advecting cold water offshore). Thefollowing section focuses on the dynamical structure of theseeddies and on their influence on the water masses at depth,as evidenced by the Phys-Indien experiment data.
3 Structure of mesoscale eddies and their relation tothe PGW distribution
This section focuses on the vertical characteristics of the ed-dies presented earlier and on their relations to the PGW out-flow structure, using the Phys-Indien experiment data. In or-der to understand the relation between the vertical and hori-zontal structures, Fig. 4 displays surface fields derived fromthe MADT. The relative vorticity, Okubo–Weiss parameterand geostrophic velocities are calculated through derivations.
The relative vorticity field at the surface (upper right inFig. 4) provides information on the horizontal extent and po-larity of the eddies. The most intense features were A1 andC2 in the Arabian Sea, with radii of 80 km. In the Sea ofOman, a train of eddies is found with alternating cyclonesand anticyclones, with radii half the size of their ArabianSea’s counterparts, that is, about 40 km.
The Okubo–Weiss parameter distribution at the surfaceshows that the structures are dominated by high concentra-tions of vorticity, and thus are robust when exposed to exter-nal strain or shear. C1 and A2 stand out as robust vorticesin the bottom left panel (Fig. 4), as well as A1. Furthermore,this Okubo–Weiss parameter indicates the location where de-
Figure 4. Maps of the surface fields averaged from 16 to 30 March2011, during the measurements south of Ra’s Al Hadd (AS sec-tion), in the lens off Ra’s Al Hadd (lens section), and across the Seaof Oman (SO section). Fields are ADT anomaly (top, left), rela-tive vorticity (top, right), Okubo–Weiss criterion (bottom, left), andgeostrophic velocity (bottom, right).
formation dominates, that is, around C1, but also between A1and the Omani coast, and north of A3 near the Iranian coast.
The bottom right panel of Fig. 4 displays the geostrophicvelocity intensity and direction at the surface. The most en-ergetic currents are observed around C1, A2 and along thecoastal “belt”. In Bower and Furey (2012), Carton et al.(2012) and L’Hégaret et al. (2013), correlations are foundbetween the surface circulation induced by the eddies andthe structure of the salty outflows from the Red Sea and thePersian Gulf. The velocity map gives a first glimpse of thepathway of the PGW: in the western Sea of Oman, the watermass equilibrated and flowed along the southern coast; then,it was ejected northward from the coast at Ra’s Al Hamra,under the influence of A1. It flowed along the Iranian coast,eastward then southward (rotating around A1 and A3), andfinally it recirculated around C1 before either escaping off-shore in the Arabian Sea or flowing southwestward aroundA2 and C2.
Superimposed on these maps, the positions of three sec-tions of interest are indicated. The first section focuses on theSea of Oman (SO section), the second one on the ArabianSea (AS section), and the last one crosses a submesoscale
692 P. L’Hégaret: Mesoscale eddies and submesoscale structures of Persian Gulf Water
lens of PGW off Ra’s Al Hadd (lens section). These verticalsections present velocities measured with the VM-ADCP, theErtel potential vorticity field, density and spice (see Sect. 2for computation).
3.1 Sea of Oman
From 22 to 30 March the Phys-Indien experiment performedcross sections in the Sea of Oman. A composite section(SO section) crossing this basin zonally is presented and de-scribed here.
As observed in the surface maps (Fig. 4) of the MADTanomaly and even more in surface velocity, the SO sectioncrossed eddies with alternate polarities. The upper panel ofFig. 5 is a VM-ADCP velocity section showing an anticy-clone between 56 and 57.8◦ E, a cyclone between 57.8 and58.8◦ E and the A1 anticyclone from 58.8 and 60◦ E, the lat-ter not sampled across its center. The density section of Fig. 5is coherent with the eddy dynamical signatures, showing alowering of the isopycnals below the anticyclones and a ris-ing below the cyclone. The EPV anomaly field, though noisy,shows the structure of the eddies in the upper 100–150 m, butalso a strong signature below 150 m depth.
The eddies are surface intensified in temperature and salin-ity anomalies, down to 200–300 m depth, but their dynamicalinfluence reaches more deeply. Tilts of the velocity field arefound below the central cyclone at 58◦ E and also at 57.5◦ E.These tilts are colocalized with a spreading of the isopyc-nals indicated by grey and green crosses in the density panelFig. 5. The spice section (see below) will identify the struc-tures associated with these tilts.
The spice section (bottom panel, Fig. 5) is an efficientmarker of the PGW structure. The first noticeable feature at100 m depth is the strong gradient of spice across 58.8◦ E (theblue line), at the western edge of anticyclone A1. West of thisline, several patches of PGW are marked by high spice con-centrations, with two lenses at 58 and at 57.5◦ E (green andgrey lines); east of 58.8◦ E, no such patch is observed. Theselenses are correlated in position with negative anomalies inthe EPV anomaly field. The circulation at the PGW depthfrom 58 to 59◦ E was northward with a recirculation aroundA1 and A3; this corresponds to the ejection of PGW fromthe Omani coast near Ra’s Al Hamra. Below the surface, thissection also shows filaments of IOCW (with weaker spice)wrapping around the PGW patches.
3.2 Arabian Sea
The Arabian Sea (AS) section studied here is located southof Ra’s Al Hadd, from 16 to 22◦ N almost along 60◦ E; it wascarried out from 16 to 19 March 2011.
The surface fields from Fig. 4 indicate that the AS sectioncrossed, from south to north, cyclone C2, the core of anticy-clone A1 and the western edge of cyclone C1, thus, between19 and 20.5◦ N a region dominated by vorticity concentra-
57.5 58 58.5 59 59.5
Longitude (°E)
-350
-300
-250
-200
-150
-100
-50
Dep
th (
m)
Velocity across the section
-80
-60
-40
-20
0
20
40
60
80
cm.s
-1
Figure 5. SO sections of the eddies, south of Ra’s Al Hadd fromthe surface down to 350 m depth. Measurements and derived quan-tities are VM-ADCP velocities, positive towards the north; the Ertelpotential vorticity anomaly is derived from VM-ADCP and SeaSoarfields; σ0 potential density and spice. Profiles sampled in Fig. 7. Toppanel: brown circle: cascading PGW outflow; grey cross: 57.5◦ Elens; green cross: 58◦ E lens; blue diamond: profile out of the saltyoutflow.
P. L’Hégaret: Mesoscale eddies and submesoscale structures of Persian Gulf Water 693
17 18 19 20 21 22
Latitude (°N)
-350
-300
-250
-200
-150
-100
-50
Dep
th (
m)
Velocity across the section
-60
-40
-20
0
20
40
60
cm.s
-1
Figure 6. AS sections of the eddies, south of Ra’s Al Hadd fromthe surface down to 350 m depth. Measurements and derived quan-tities are VM-ADCP velocities, positive towards the north; the Ertelpotential vorticity anomaly is derived from VM-ADCP and SeaSoarfields; σ0 potential density and spice. Profiles sampled in Fig. 8: yel-low diamond: salty injection around anticyclone A2; cyan diamond:fresh injection around anticyclone A2; red circle: inside anticycloneA2; blue circle: inside cyclone C1.
tions, and north of 20.5◦ N by deformation. Both the velocityhorizontal map and the vertical section show the intensityof A2 and C1, with currents above 80 cm s−1 (upper panel,Fig. 6). Furthermore, they indicate that the eddy velocitiesremained noticeable below 600 m depth, with values above10 cm s−1 (not shown). The density section exhibits intenselowering and rising of the isopycnals, below C1 and A2. Inthe EPV anomaly section, anticyclone A2 is clearly identi-fied, with a negative core between 50 and 150 m depth.
The spice section (bottom panel of Fig. 6) displays lessturbulence than that in the Sea of Oman; nevertheless, a fewstructures are of interest. Below the surface, isopycnal spac-ing is observed at 18.8◦ N at 160 m depth (yellow line), re-lated to a spicier structure, characteristic of a PGW lens, witha diameter of 40 km. Also, less spicy water wraps and flowsupward along the eddies, as noted at 19.4◦ N (cyan line). ThePGW containing eddies stirs and advects upward IOCW.
In the Sea of Oman, the outflowing PGW is subject tostrong mixing, and is fragmented, with detached lenses atdepth and more isolated patches above. In the Arabian Sea,the eddies can advect PGW in their core. Water masses attheir rim undergo a strong deformation. The following sec-tions focus on PGW recording during the experiment, itspathway, structure and evolution.
4 PGW characteristics, pathways and submesoscalestructures
Table 1 indicates the peak thermohaline values of the PGW(from climatology) as it flows out of the Strait of Hormuz.The highest densities (above 26.6 kg m−3) are found fromJanuary to May, with a salinity well above 38 psu. Thisdensity decreases below 26 kg m−3 in late summer (July–August) and early winter (October–November) as the out-flow becomes fresher. The value of the PGW density is thushighly seasonal.
4.1 Sea of Oman
The upper panels from Fig. 7 present the thermohaline char-acteristics at different locations. All the profiles indicatesalinity above 37.8 psu, except for the profile at the west-ern edge of A1 (blue crosses). All of them peak in salinityat σ0 = 26.3–26.4 kg m−3, characteristic of PGW. A secondpeak in salinity is found at σ0 = 25.8 kg m−3, rarely above37 psu; it can be observed in the grey profile (located in thespice section: bottom panel of Fig. 5). This more dilute PGWis well marked in the blue profile; it a priori originated fromthe outflow during a previous season, and must have recircu-lated at the western end of the Sea of Oman, as observed in anumerical simulation (L’Hégaret et al., 2015).
The coastal outflow of PGW appears on the brown and redprofiles (upper panels of Fig. 7). They display wide peaksat σ0 = 26.3–26.4 kg m−3 at 37.9 psu. To the south, a thin-
694 P. L’Hégaret: Mesoscale eddies and submesoscale structures of Persian Gulf Water
Table 1. Maximal PGW density and associated salinity and temperature, before cascading in the Sea of Oman for each month extracted fromthe GDEM climatology.
Figure 7. Potential temperature over salinity profiles (right) and their locations of interest (left); in the western Sea of Oman (top) and easternSea of Oman (bottom). Top panel: blue diamond: profile out of the salty outflow; green cross: 58◦ E lens; yellow circle: southern profile inthe PGW outflow along the coastal slope; grey cross: 57.5◦ E lens; red circle: northern profile in the PGW outflow along the coastal slope;brown circle: cascading PGW outflow. Bottom panel: yellow circle: profile inside anticyclone A3; blue diamond: low spice profile, observedin the periphery of A3; green diamond: high spice profile, observed in the periphery of A3; cyan cross: at the periphery of anticyclones A1and A3; red circle: profile inside anticyclone A1.
P. L’Hégaret: Mesoscale eddies and submesoscale structures of Persian Gulf Water 695
Figure 8. Potential temperature over salinity profiles (right) in the western Arabian Sea at various locations of interest (left). From northto south: yellow diamond: salty injection around anticyclone A2; cyan diamond: fresh injection around anticyclone A2; red circle: insideanticyclone A2; blue circle: inside cyclone C1; green cross: inside the lens off Ra’s Al Hadd.
ner salinity peak corresponds to PGW mixing with IOCW;a peak of lighter PGW is observed at σ0 = 25.8 kg m−3 withsalinity at 37.2 psu. Both profiles across the PGW lenses peakin salinity at σ0 = 26.4 kg m−3, as the core of these structuresis preserved from dilution.
Above the lens at 57.5◦ E, a patch of PGW at σ0 =
25.8 kg m−3 with salinity of 37.2 psu is found. The lens at57.5◦ E (grey profile) had a diameter of 15 km, a height of50 m, and advecting diluted PGW above it, while the lens at58◦ E (green profile) had a diameter of 25 km and a heightof 100 m. The first one must have formed earlier, probably inearly winter, recirculating and slowly eroding in the westernSea of Oman, whereas the second must have formed later.
The bottom panels of Fig. 7 present thermohaline pro-files in the eastern Sea of Oman. The red and yellow pro-files show the different characteristics of the PGW trappedin anticyclones A1 and A3. Anticyclone A3 was formed be-tween February and March 2011 and had only one extremumof PGW salinity at σ0 = 25.8 kg m−3 (see Fig. 3). Anticy-clone A1 formed in December 2010, and enclosed two PGWmaxima (see red profile): the first maximum correspondsto waters denser than those recorded in the western Sea ofOman, below σ0 = 26.6 kg m−3; the second maximum wasmore diluted, at σ0 = 25.6 kg m−3, and was lighter than thatobserved in A3. Thus, during its formation, anticyclone A1enclosed two PGW patches from different seasons.
4.2 Arabian Sea
Figure 8 presents thermohaline profiles in the Arabian Sea.Cyclone C1 (blue profile) formed at the same period asanticyclone A1, in December 2010 or early January 2011(see Fig. 3). Similarly, it shows a peak of PGW at σ0 =
26.6 kg m−3, slightly more diluted, 0.2 psu, below A1 as itlay downstream.
Anticyclone A2 (red profile in Fig. 8) formed 1 monthlater, between January and February 2011. Inside it, the PGWpeak was less marked and wider: this water mass mixedwith the surrounding IOCW. The density ranged from 26 to26.3 kg m−3, indicating PGW flowing out of the Persian Gulffrom early 2010 or late summer 2010.
The cyan and yellow profiles in Fig. 8 focus on the layerswrapping around anticyclone A2 and located at its southernedge. The cyan profile indicates that IOCW, with salinity be-low 35.8 psu, in the density range of the PGW, was advectedand tilted around the eddy rim. The yellow profile crossedPGW just below the thermocline (see density density sec-tion, Fig. 6); the salinity peak is found at 25.5 kg m−3. Thislight PGW is comparable to that observed in the core of A3(see bottom panel Fig. 7, yellow profile) but with a weakersalinity; thus, it formed farther from the Sea of Oman. ThisPGW was advected around A2, also with a tilted structure.
4.3 Submesoscale lens off Ra’s Al Hadd
The lens section displayed in Fig. 4 corresponds to the mea-surements performed between 19 and 20 March 2011. Thissection extended between anticyclone A3 and cyclone C1and recorded a submesoscale lens of PGW. The surface fieldsindicate westward geostrophic velocities, above 0.4 m s−1, ina region dominated by deformation.
The velocity section (Fig. 9, top) shows the westward ve-locities from the surface down to 200 m depth, intensifyingup to 0.8 m s−1 near cyclone C1. Between 22.1 and 22.4◦ N,and 250 and 400 m depth, an anticyclonic motion is observedin the zonal velocity section with a speed of about 0.2 cm s−1,
696 P. L’Hégaret: Mesoscale eddies and submesoscale structures of Persian Gulf Water
Figure 9. Sections across the lens off Ra’s Al Hadd, from the sur-face down to 350 m depth. Measurements and derived quantities areVM-ADCP velocities, positive towards the north; the Ertel potentialvorticity anomaly is derived from VM-ADCP and SeaSoar fields;σ0 potential density and spice. The green cross profile from Fig. 8is taken in the core of this lens.
but this signal is strongly dominated by the velocity of thesurface eddy. This anticyclonic structure is also shown inthe EPV anomaly field (Fig. 9) by the negative core around300 m depth and by the spacing of the isopycnals.
The spice section (bottom panel of Fig. 9) confirms thepresence of a lens-shaped structure between 250 and 350 mdepth, with a diameter of 25 km, and the green profile ofFig. 8 crossing the center of the lens indicates a temperatureof 19 ◦C and salinity above 37.3 psu at its center; the densityis σ0 = 26.6 kg m−3.
In a perpendicular cross section (not presented here), thelens had a diameter of 33 km; this shows that this lens waselliptical, as confirmed by a third section. The total salt andheat content, inside the 36.6 psu (or 18 ◦C) contour, was2.59×1012 kg and 6.54×10¹⁹ J, and the lens volumic trans-port (across the section) was above 0.4 Sv. The spice sectionalso displays a layer of IOCW above the lens at 22.1◦ N.
The peak salinity above 37.3 psu is observed only in theSea of Oman in this period; this density corresponds to PGWthat flowed out of the Strait of Hormuz in early 2011; there-fore, this lens likely formed in the Sea of Oman.
In L’Hégaret et al. (2015), several mechanisms leading tothe formation of eddies containing PGW were listed. Here,two possible mechanisms are assessed. In winter, lee eddiesform downstream of Ra’s Al Hamra; these eddies retain high-salinity water in their core before eroding for 3 months. Thismechanism is observed in a high-resolution HYCOM sim-ulation, where lee eddies are the only structures retainingsalinity above 37 psu in the Arabian Sea and possessing astrong altimetric signature. In the MADT anomaly maps be-tween January and March 2011, no such signature was ob-served; this renders these mechanisms rather unlikely here.
The other mechanism for the formation of this lens in theSea of Oman would be the ejection of PGW fragments fromthe coastal outflow under the action of mesoscale eddies.This can occur near Ra’s al Hamra in late winter or earlyspring, or south of Ra’s Al Hadd. In the Sea of Oman, themaximal deformation affecting the PGW outflow occurrednear Ra’s Al Hamra. This mechanism implies that the PGWlens would have drifted about 600 km, around anticycloneA2. The anticyclone velocity was at least 0.4 m s−1 at thedepth of the outflow; therefore, the lens would have taken15 days to travel this distance; this would lead to a lens for-mation in early March, coherent with the PGW density inthe core of the lens. Another possible formation site is southof Ra’s Al Hadd. Cyclone C1 would have ejected the lensand advected it. With a velocity of about 0.6 m s−1, it wouldhave taken 10 days between ejection and the Phys-Indienmeasurements. Nevertheless, the salinity and density of thelens were higher than those of the PGW outflow near Ra’sAl Hadd. Therefore, lens formation near Ra’s al Hamra wasmore likely.
During the Phys-Indien 2011 experiment, two deepdrogued Surdrift floats and three ARGO floats were seededin this submesoscale lens. The Surdrift floats allow hourlytracking of the lens, and the ARGO floats record temperatureand salinity with a surfacing every 5 days. All these floatsfollowed a northwestward trajectory for the first 4 days ofmeasurements. After this period, the three ARGO floats were
P. L’Hégaret: Mesoscale eddies and submesoscale structures of Persian Gulf Water 697
Figure 10. ARGO floats 2901370 (top) and 2901387 (bottom), trajectories (left) and salinity sections (right) in the eastern and westernSea of Oman. Float 2901370 (up) enters the Sea of Oman with anticyclonic loops, is stopped by the front in March 2011 and then loopedcyclonically until late May 2011, between A1 and A3. Float 2901387 looped cyclonically from March to May 2011 before moving northwest.Patches of salty PGW are observed, with the strongest in July, when the float is found near the position of cascading PGW.
ejected, as revealed by their recorded salinity; so were thesurdrifts, which then followed anticyclone A3, north of Ra’sAl Hadd. One Surdrift buoy lost its drogue and performed in-ertial loops. This inability to track the lens for long durationsunderlines the strong deformation that it was subjected to.
The deformation of a lens by external shear or strain wasstudied by Ruddick (1987): as strain increases, the lens be-comes more elliptical and unsteady, before either breaking upor readjusting. And indeed, this submesoscale lens off Ra’sAl Hadd was elliptical and embedded in a strong deforma-tion field due to the strong mesoscale eddies in its vicinity.Walsh (1995) studied the deformation of a lens in a uniformlarge-scale shear in a model. With q the potential vorticity ofthe lens, S the external shear, and a and b the long and shortaxes of the ellipse, the theoretical lateral deformation of theeddy is
a− b
a+ b=
158S
q,
with a = 33 km and b = 20 km; S = 0.1q. The potential vor-ticity of the lens was about 8× 10⁻⁵ s−1, leading to S ∼10−5 s−1. At the depth of the lens, the mesoscale eddies ve-
locities and radius gave a measured shear of∂V
∂r∼V
R∼
0.5
50× 103 ∼ 10−5 s−1, the same magnitude as calculated with
the Walsh (1995) model.
4.4 Recurrence of PGW lenses
Numerous ARGO floats (with WHOI numbers 2901370 and2901387, displayed in Fig. 10, or WHOI numbers 1901187,1901202 and 6900902) sampled PGW in the Sea of Oman.Until the early summer monsoon, localized patches of PGWwith salinity above 37.2 psu, temperature around 20 ◦C andσ0 ≈ 26.5 kg m−3 are observed, with a spacing of the isopy-cnals above and below them. These patches are found eitheroff Ra’s Al Hadd or off the Sea of Oman.
In June 2011, anticyclone A3 was advected northwardas the summer monsoon began, thus reducing the deforma-tion field off Ra’s Al Hamra. To break the PGW outflowinto lenses and filaments, Vic et al. (2015), using a high-resolution numerical model, showed that a strong shear andstrain is necessary. Thus fewer submesoscale PGW struc-tures are expected to be observed during the summer mon-soon (when the deformation field is less intense), but due toa lack of regular observations at the depth of PGW. Note thatanother possible mechanism for PGW outflow breaking isbaroclinic instability, which depends on the vertical shear of
698 P. L’Hégaret: Mesoscale eddies and submesoscale structures of Persian Gulf Water
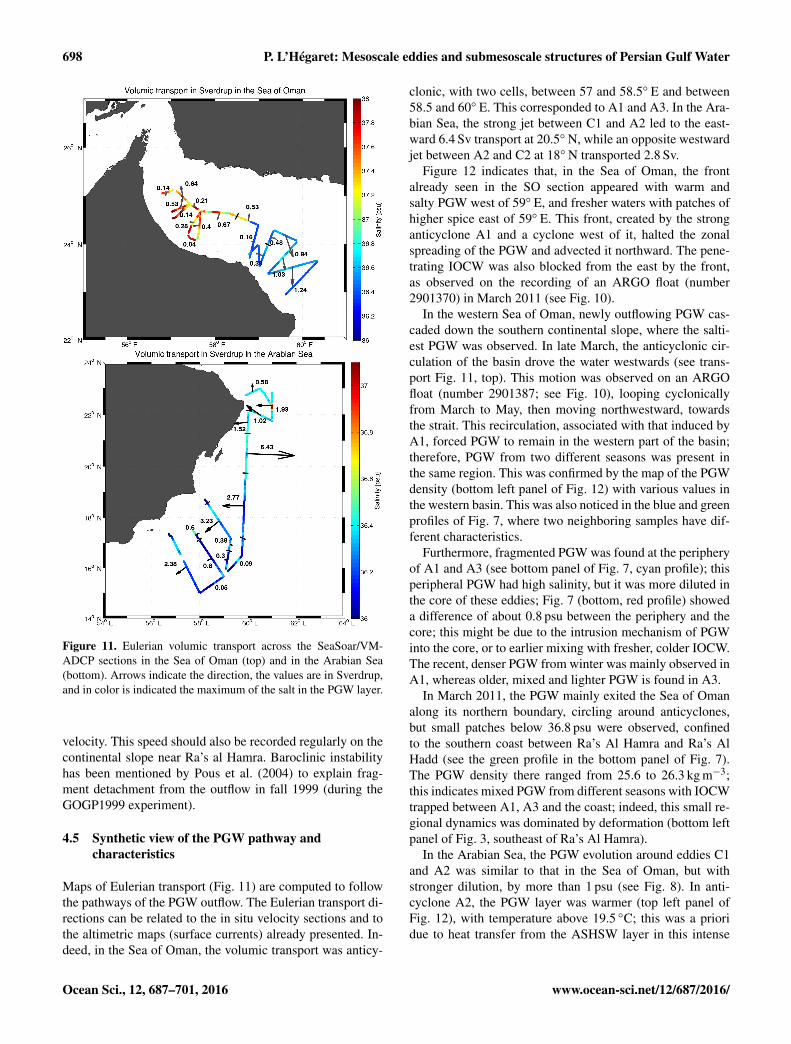
Figure 11. Eulerian volumic transport across the SeaSoar/VM-ADCP sections in the Sea of Oman (top) and in the Arabian Sea(bottom). Arrows indicate the direction, the values are in Sverdrup,and in color is indicated the maximum of the salt in the PGW layer.
velocity. This speed should also be recorded regularly on thecontinental slope near Ra’s al Hamra. Baroclinic instabilityhas been mentioned by Pous et al. (2004) to explain frag-ment detachment from the outflow in fall 1999 (during theGOGP1999 experiment).
4.5 Synthetic view of the PGW pathway andcharacteristics
Maps of Eulerian transport (Fig. 11) are computed to followthe pathways of the PGW outflow. The Eulerian transport di-rections can be related to the in situ velocity sections and tothe altimetric maps (surface currents) already presented. In-deed, in the Sea of Oman, the volumic transport was anticy-
clonic, with two cells, between 57 and 58.5◦ E and between58.5 and 60◦ E. This corresponded to A1 and A3. In the Ara-bian Sea, the strong jet between C1 and A2 led to the east-ward 6.4 Sv transport at 20.5◦ N, while an opposite westwardjet between A2 and C2 at 18◦ N transported 2.8 Sv.
Figure 12 indicates that, in the Sea of Oman, the frontalready seen in the SO section appeared with warm andsalty PGW west of 59◦ E, and fresher waters with patches ofhigher spice east of 59◦ E. This front, created by the stronganticyclone A1 and a cyclone west of it, halted the zonalspreading of the PGW and advected it northward. The pene-trating IOCW was also blocked from the east by the front,as observed on the recording of an ARGO float (number2901370) in March 2011 (see Fig. 10).
In the western Sea of Oman, newly outflowing PGW cas-caded down the southern continental slope, where the salti-est PGW was observed. In late March, the anticyclonic cir-culation of the basin drove the water westwards (see trans-port Fig. 11, top). This motion was observed on an ARGOfloat (number 2901387; see Fig. 10), looping cyclonicallyfrom March to May, then moving northwestward, towardsthe strait. This recirculation, associated with that induced byA1, forced PGW to remain in the western part of the basin;therefore, PGW from two different seasons was present inthe same region. This was confirmed by the map of the PGWdensity (bottom left panel of Fig. 12) with various values inthe western basin. This was also noticed in the blue and greenprofiles of Fig. 7, where two neighboring samples have dif-ferent characteristics.
Furthermore, fragmented PGW was found at the peripheryof A1 and A3 (see bottom panel of Fig. 7, cyan profile); thisperipheral PGW had high salinity, but it was more diluted inthe core of these eddies; Fig. 7 (bottom, red profile) showeda difference of about 0.8 psu between the periphery and thecore; this might be due to the intrusion mechanism of PGWinto the core, or to earlier mixing with fresher, colder IOCW.The recent, denser PGW from winter was mainly observed inA1, whereas older, mixed and lighter PGW is found in A3.
In March 2011, the PGW mainly exited the Sea of Omanalong its northern boundary, circling around anticyclones,but small patches below 36.8 psu were observed, confinedto the southern coast between Ra’s Al Hamra and Ra’s AlHadd (see the green profile in the bottom panel of Fig. 7).The PGW density there ranged from 25.6 to 26.3 kg m−3;this indicates mixed PGW from different seasons with IOCWtrapped between A1, A3 and the coast; indeed, this small re-gional dynamics was dominated by deformation (bottom leftpanel of Fig. 3, southeast of Ra’s Al Hamra).
In the Arabian Sea, the PGW evolution around eddies C1and A2 was similar to that in the Sea of Oman, but withstronger dilution, by more than 1 psu (see Fig. 8). In anti-cyclone A2, the PGW layer was warmer (top left panel ofFig. 12), with temperature above 19.5 ◦C; this was a prioridue to heat transfer from the ASHSW layer in this intense
P. L’Hégaret: Mesoscale eddies and submesoscale structures of Persian Gulf Water 699
Figure 12. Maximal thermohaline characteristics of the Persian Gulf Water (from the SeaSoar measurements, for σ0 between 26 and 26.7).The variables are temperature (top, left), salinity (top, right), σ0 at the maximal salinity depth (bottom, left), and spice at the same depth(bottom, right).
eddy. South of 18◦ N, the PGW was strongly diluted andmixed with the IOCW.
Both in the Arabian Sea and in the Sea of Oman, layersof colder and fresher IOCW were wrapped around the strongmesoscale eddies, and around the submesoscale lens (cyanprofile, bottom panel of Fig. 8). These structures presentedno front in density but a marked one in spice (see Fig. 6).Smith and Ferrari (2009) suggested that these filaments couldresult from the stirring by the mesoscale eddies. The slope
of the fresher injections around anticyclone A2 (on the ASsection in Fig. 6) are compared with the f/N ratio and withthe strain over shear ratio induced by the eddies.
The isospice slope varies from 3×10⁻³ to 4×10⁻³,−f/Nfrom 6× 10⁻³ to 7× 10⁻³, and −(dU/dx)/(dU/dz) from3×10−3 to 4×10⁻³. This suggests that stirring could producethese tilted layers. Furthermore, the presence of these colderand fresher injections below warmer and saltier PGW couldfavor double diffusion.
700 P. L’Hégaret: Mesoscale eddies and submesoscale structures of Persian Gulf Water
5 Discussion and conclusion
The Phys-Indien experiment took place in March 2011,in the Arabian Sea and in the Sea of Oman, during thespring intermonsoon. The surface dynamics was dominatedby mesoscale eddies along the western coast of the ArabianSea. A strong mesoscale anticyclone was observed in theeastern part of the Sea of Oman, characteristic of the springintermonsoon. These eddies are observed in the monthly sea-level climatologies from satellite altimetry with the samesizes, but with a stronger intensity in 2011, in particular thecyclone south of Ra’s Al Hadd. Nevertheless, the eddies fromMarch 2011 showed surface velocities comparable in inten-sity to the HYCOM model used in L’Hégaret et al. (2015).
Vertical sections of velocities, obtained with a VM-ADCP,showed that these energetic mesoscale eddies have a deepdynamical influence; they tilt the water masses around them(IOCW and PGW). Inside the cores of these eddies, these wa-ter masses retain the thermohaline characteristics they had atthe time of their trapping. PGW filaments wrapping aroundthese eddies are subject to mixing. Besides, tilted layers, pri-marily of cold and fresh IOCW, are observed around the ed-dies; this can induce mixing and dilution of the highly salinewaters.
In the western Sea of Oman, the PGW outflow appearsfragmented, forming small eddies, filaments and a few iso-lated patches. Two layers of PGW, with different densities,from the winter monsoon and earlier mixed PGW, were ob-served at the same location, due to the anticyclonic recircu-lation of PGW in the western basin. The PGW outflow wasnot observed in the measurements along the coast betweenRa’s Al Hamra and Ra’s al Hadd, with the exception of afew small coastal patches; most PGW was advected north,around anticyclones A1 and A3, slowly diluting along itspathway, with a salinity below 37 psu. A similar situation wasobserved in the HYCOM simulation from L’Hégaret et al.(2015) (Figs. 21 and 22) with an ejection at Ra’s Al Hamrawith a difference of 0.6 psu between the front of the ejectionand the surrounding waters, comparable to the observationsfrom the SeaSoar. Also, a coastal branch of PGW was foundin the model between Ra’s Al Hadd and Ra’s Al Hamra, withsalinity up to 36.8 psu, as observed in the profiles from March2011.
A submesoscale lens recorded off Ra’s Al Hadd possessedstrong salinity (over 37 psu) and temperature, characteristicof the winter monsoon. Different hypotheses were proposedfor its formation; most likely, this lens can have been formedby the fragmentation of the PGW outflow, by the mesoscaleeddies, at Ra’s Al Hamra, 15 days before the sampling ofthe lens. This submesoscale lens was located between twomesoscale eddies during the Phys-Indien experiment, andhad an elliptical structure. These mesoscale eddies deformedthe lens, making it unsteady, and float trajectories suggestthat it rapidly disappeared afterwards. The shear and strain
of the mesoscale eddies that contributed to form the lensesalso led to their disappearance.
Thus, spring presents favorable conditions for PGW lensdetection, with their ejection from the coastal outflow, andtheir advection around mesoscale eddies. During the sum-mer monsoon, the PGW outflow is expelled by the Ra’s AlHadd jet, an intense mesoscale dipole, which may form butalso disrupt PGW lenses. In March 2014, a second Phys-Indien experiment took place around the Arabian Peninsula;the comparison between the results of the two experimentswill be the subject of a forthcoming study.
Acknowledgements. Pierre L’Hégaret thanks DGA (French Min-istry of Defence) and the Brittany region for his PhD grant. XavierCarton acknowledges support from ANR DGA under the Synbiosproject of the Astrid program. The authors are grateful to thetwo anonymous referees whose suggestions and remarks greatlyimproved the contents of this paper.
Edited by: P. Chapman
References
Al Saafani, M., Shenoi, S., Shankar, D., Aparna, M., Kurian, J., Du-rand, F., and Vinayachandran, P.: Westward movement of eddiesinto the Gulf of Aden from the Arabian Sea, J. Geophys. Res.-Oceans, 112, C11004, doi:10.1029/2006JC004020, 2007.
Banse, K.: Irregular flow of Persian (Arabian) Gulf water to theArabian sea, J. Marine Res., 55, 1049–1067, 1997.
Barth, J. A., O’Malley, R. T., Fleischbein, J., Smith, R. L., andHuyer, A.: SeaSoar and CTD observations during coastal jet sep-aration cruise W9408A, August to September 1994, Tech. rep.,College of Oceanic and Atmospheric Sciences, Corvallis, OR,USA, 1996.
Bower, A. S. and Furey, H. H.: Mesoscale eddies in the Gulf ofAden and their impact on the spreading of Red Sea Outflow Wa-ter, Prog. Oceanogr., 96, 14–39, 2012.
Bower, A. S., Hunt, H. D., and Price, J. F.: Character and dynam-ics of the Red Sea and Persian Gulf outflows, J. Geophys. Res.-Oceans, 105, 6387–6414, 2000.
Carton, X., L’Hegaret, P., and Baraille, R.: Mesoscale variability ofwater masses in the Arabian Sea as revealed by ARGO floats,Ocean Sci., 8, 227–248, doi:10.5194/os-8-227-2012, 2012.
Chelton, D. B., Deszoeke, R. A., Schlax, M. G., El Naggar, K.,and Siwertz, N.: Geographical variability of the first baroclinicRossby radius of deformation, J. Phys. Oceanogr., 28, 433–460,1998.
Findlater, J.: A major low-level air current near the Indian Oceanduring the northern summer, Q. J. Roy. Meteor. Soc., 95, 362–380, 1969.
Fischer, A. S., Weller, R. A., Rudnick, D. L., Eriksen, C. C.,Lee, C. M., Brink, K. H., Fox, C. A., and Leben, R. R.: Mesoscaleeddies, coastal upwelling, and the upper-ocean heat budget in theArabian Sea, Deep-Sea Res. Pt. II, 49, 2231–2264, 2002.
Hoskins, B.: The role of potential vorticity in symmetric stabilityand instability, Q. J. Roy. Meteor. Soc., 100, 480–482, 1974.
P. L’Hégaret: Mesoscale eddies and submesoscale structures of Persian Gulf Water 701
IOC, SCOR and IAPSO: The international thermodynamic equationof seawater – 2010: calculation and use of thermodynamic prop-erties, Intergovernmental Oceanographic Commission, Manualsand Guides No. 56, UNESCO (English), 196 pp., 2010.
Kumar, S. P. and Prasad, T.: Formation and spreading of ArabianSea high-salinity water mass, J. Geophys. Res.-Oceans, 104,1455–1464, 1999.
Lee, C. M., Jones, B. H., Brink, K. H., and Fischer, A. S.: Theupper-ocean response to monsoonal forcing in the Arabian Sea:seasonal and spatial variability, Deep-Sea Res. Pt. II, 47, 1177–1226, 2000.
L’Hégaret, P., Lacour, L., Carton, X., Roullet, G., Baraille, R., andCorréard, S.: A seasonal dipolar eddy near Ras Al Hamra (Sea ofOman), Ocean Dynam., 63, 633–659, 2013.
L’Hégaret, P., Duarte, R., Carton, X., Vic, C., Ciani, D., Baraille, R.,and Corréard, S.: Mesoscale variability in the Arabian Sea fromHYCOM model results and observations: impact on the PersianGulf Water path, Ocean Sci., 11, 667–693, doi:10.5194/os-11-667-2015, 2015.
Lueck, R. G. and Picklo, J. J.: Thermal inertia of conductivity cells:observations with a Sea-Bird cell, J. Atmos. Ocean. Tech., 7,756–768, 1990.
Mensah, V., Le Menn, M., and Morel, Y.: Thermal mass correctionfor the evaluation of salinity, J. Atmos. Ocean. Technol., 26, 665–672, 2008.
Meshal, A. and Hassan, H.: Evaporation from the coastal water ofthe central part of the Gulf, Arab Gulf Journal of Scientific Re-search, 4, 649–655, 1986.
Pous, S., Carton, X., and Lazure, P.: Hydrology and circulationin the Strait of Hormuz and the Gulf of Oman results fromthe GOGP99 experiment: 2. Gulf of Oman, J. Geophys. Res.-Oceans, 109, doi:10.1029/2003JC002146, 2004.
Prasad, T., Ikeda, M., and Kumar, S. P.: Seasonal spreading of thePersian Gulf Water mass in the Arabian Sea, J. Geophys. Res.-Oceans, 106, 17059–17071, 2001.
Premchand, K., Sastry, J., and Murty, C.: Watermass structurein the western Indian Ocean: Part II, The spreading andtransformation of the Persian Gulf Water, Mausam, 37, 179,doi:10.1029/2000JC000480, 1986.
Privett, D.: Monthly charts of evaporation from the N. Indian Ocean(including the Red Sea and the Persian Gulf), Q. J. Roy. Meteor.Soc., 85, 424–428, 1959.
Reynolds, R. M.: Physical oceanography of the Gulf, Strait of Hor-muz, and the Gulf of Oman results from the Mt Mitchell expedi-tion, Mar. Pollut. Bull., 27, 35–59, 1993.
Ruddick, B. R.: Anticyclonic Lenses in Large-Scale Strain andShear, J. Phys. Oceanogr., 17, 741–749, doi::10.1175/1520-0485(1987)017<0741:ALILSS>2.0.CO;2, 1987.
Senjyu, T., Ishimaru, T., Matsuyama, M., and Koike, Y.: High salin-ity lens from the Strait of Hormuz, in: Offshore Environment ofthe ROPME Sea Area after the War-Related Oil Spill, Terra Sci-entific Publishing Company, Tokyo, 35–48, 1998.
Smith, K. S. and Ferrari, R.: The production and dissipation of com-pensated thermohaline variance by mesoscale stirring, J. Phys.Oceanogr., 39, 2477–2501, 2009.
Swift, S. A. and Bower, A. S.: Formation and circulation of densewater in the Persian/Arabian Gulf, J. Geophys. Res.-Oceans, 108,3004, doi:10.1029/2002JC001360, 2003.
Thoppil, P. G. and Hogan, P. J.: On the mechanisms of episodicsalinity outflow events in the Strait of Hormuz, J. Phys.Oceanogr., 39, 1340–1360, 2009.
Vic, C., Roullet, G., Carton, X., and Capet, X.: Mesoscale dynamicsin the Arabian Sea and a focus on the Great Whirl life cycle: anumerical investigation using ROMS, J. Geophys. Res.-Oceans,119, 6422–6443, 2014.
Vic, C., Roullet, G., Capet, X., Carton, X., Molemaker, M., andGula, J.: Eddy-topography interactions and the fate of the Per-sian Gulf Outflow, J. Geophys. Res.-Oceans, 120, 6700–6717,doi:10.1002/2015JC011033, 2015.
Walsh, D.: A model of a mesoscale lens in large-scale shear – PartI: Linear calculations, J. Phys. Oceanogr., 25, 735–746, 1995.
Wang, Z., DiMarco, S. F., Stössel, M. M., Zhang, X., Howard,M. K., and du Vall, K.: Oscillation responses to tropical CycloneGonu in northern Arabian Sea from a moored observing system,Deep Sea Res. Pt. I, 64, 129–145, 2012.
Wang, Z., DiMarco, S. F., Jochens, A. E., and Ingle, S.: High salinityevents in the northern Arabian Sea and Sea of Oman, Deep SeaRes. Pt. I, 74, 14–24, 2013.


![Mesoscale circulation determines broad spatio-temporal ... · the formation and shedding of mesoscale eddies throughout the year displace the EAC separa- tion latitude [21, 22], and](https://static.documents.pub/doc/80x56/5d5b165c88c993133a8b74da/mesoscale-circulation-determines-broad-spatio-temporal-the-formation-and.jpg)


