Mesoscale Modelling Benchmarking Exercise: Initial Results Andrea N. Hahmann [email protected], DTU Wind Energy, Denmark Bjarke Tobias Olsen, Anna Maria Sempreviva, Hans E. Jørgensen, Jake Badger
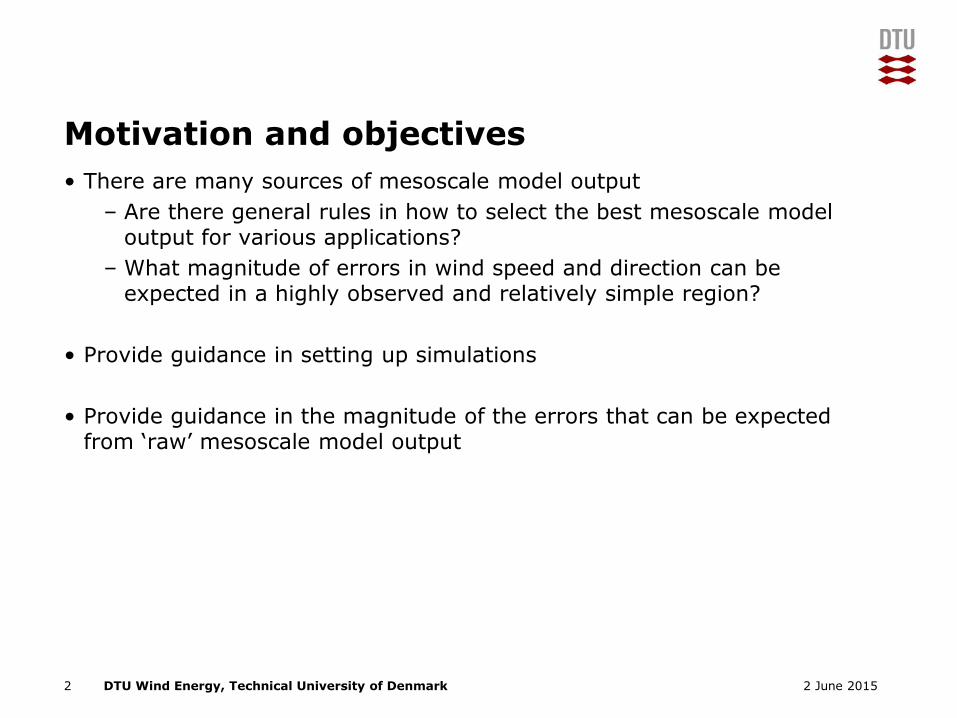
• There are many sources of mesoscale model output
– Are there general rules in how to select the best mesoscale model output for various applications?
– What magnitude of errors in wind speed and direction can be expected in a highly observed and relatively simple region?
• Provide guidance in setting up simulations
• Provide guidance in the magnitude of the errors that can be expected from ‘raw’ mesoscale model output
2 2 June 2015
DTU Wind Energy, Technical University of Denmark
Outline
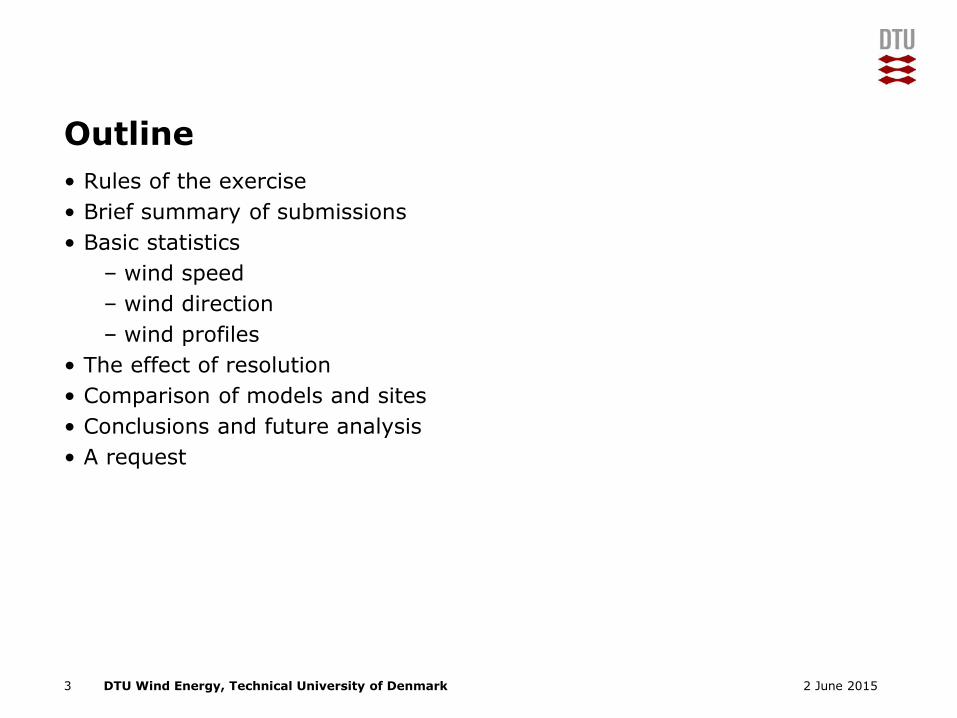
• Rules of the exercise
• Brief summary of submissions
• Basic statistics
– wind speed
– wind direction
– wind profiles
• The effect of resolution
• Comparison of models and sites
• Conclusions and future analysis
• A request
3 2 June 2015
DTU Wind Energy, Technical University of Denmark
Rules of the Exercise
• Many thanks to EWEA for handling the data submission!!
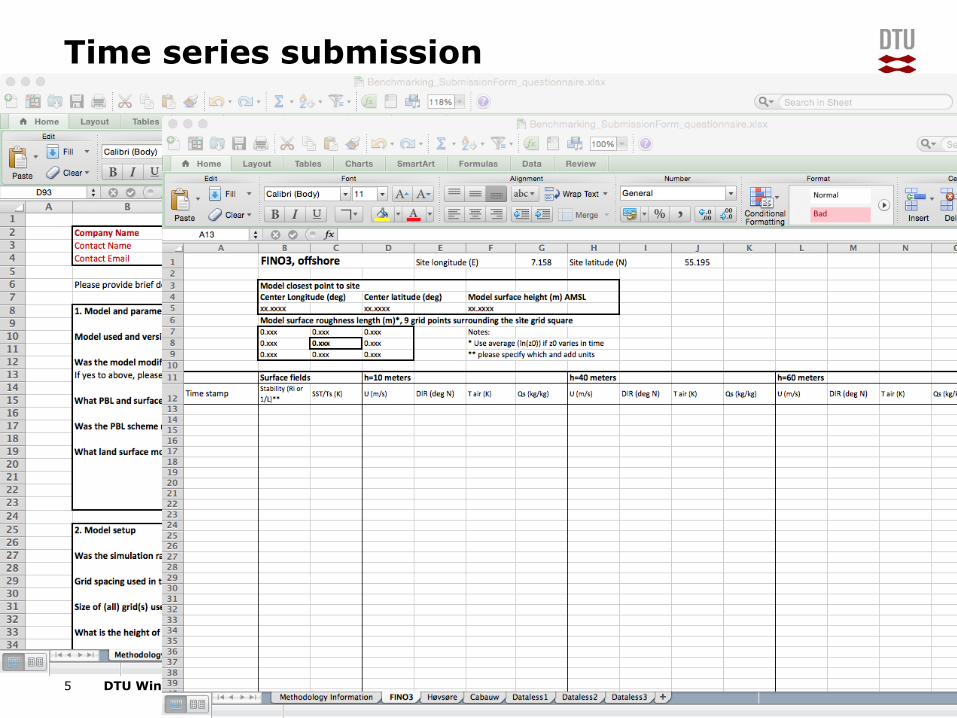
• Provide time series of raw mesoscale model output for 6 sites in Northern Europe:
– Fino3, DE – offshore
– Høvsøre, DK – coastal land
– Cabauw, NL – land
– 3 dataless sites: offshore, coastal (water based) and land
• Each entry: Hourly data, year 2011, wind speed and direction, temperatures and humidity, surface fluxes
• Several vertical levels (10-200 meters AGL)
• Many other metadata requested; examples:
– model name and version
– horizontal and vertical resolution
– forcing, surface roughness, etc
4 2 June 2015
DTU Wind Energy, Technical University of Denmark
Time series submission
5 2 June 2015
DTU Wind Energy, Technical University of Denmark
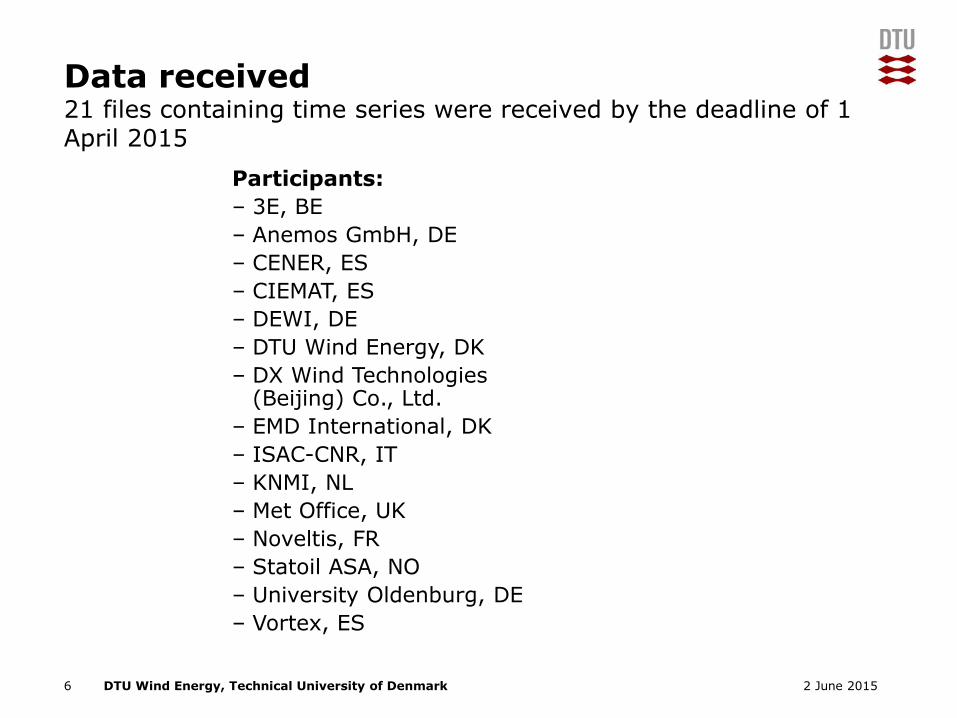
Data received 21 files containing time series were received by the deadline of 1 April 2015
6 2 June 2015
Participants:
– 3E, BE
– Anemos GmbH, DE
– CENER, ES
– CIEMAT, ES
– DEWI, DE
– DTU Wind Energy, DK
– DX Wind Technologies (Beijing) Co., Ltd.
– EMD International, DK
– ISAC-CNR, IT
– KNMI, NL
– Met Office, UK
– Noveltis, FR
– Statoil ASA, NO
– University Oldenburg, DE
– Vortex, ES
DTU Wind Energy, Technical University of Denmark
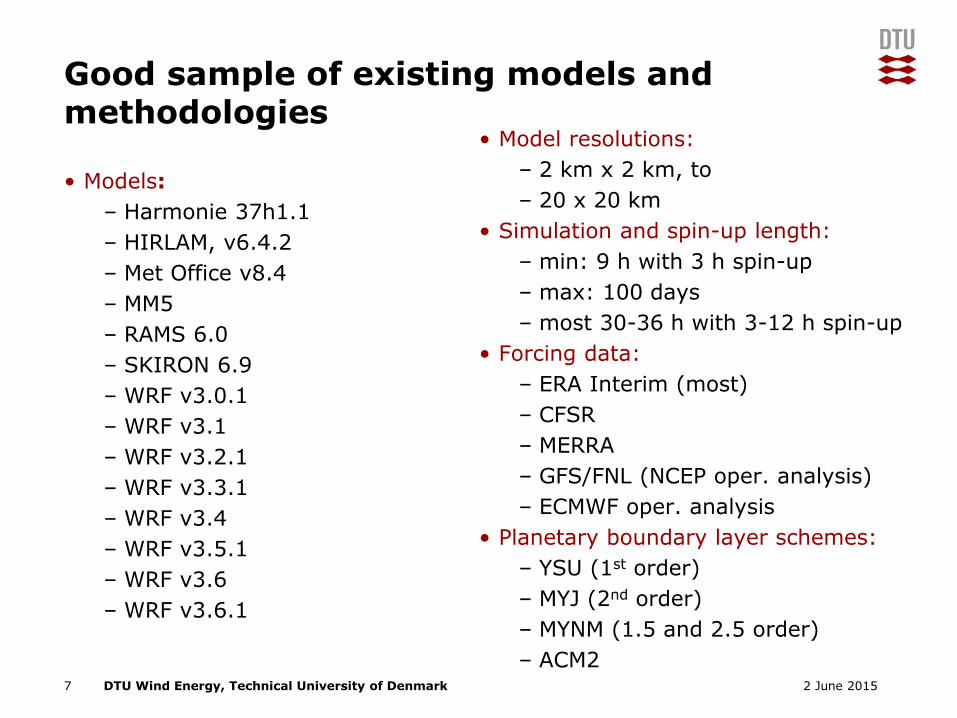
Good sample of existing models and methodologies
• Model resolutions:
– 2 km x 2 km, to
– 20 x 20 km
• Simulation and spin-up length:
– min: 9 h with 3 h spin-up
– max: 100 days
– most 30-36 h with 3-12 h spin-up
• Forcing data:
– ERA Interim (most)
– CFSR
– MERRA
– GFS/FNL (NCEP oper. analysis)
– ECMWF oper. analysis
• Planetary boundary layer schemes:
– YSU (1st order)
– MYJ (2nd order)
– MYNM (1.5 and 2.5 order)
– ACM27 2 June 2015
• Models:
– Harmonie 37h1.1
– HIRLAM, v6.4.2
– Met Office v8.4
– MM5
– RAMS 6.0
– SKIRON 6.9
– WRF v3.0.1
– WRF v3.1
– WRF v3.2.1
– WRF v3.3.1
– WRF v3.4
– WRF v3.5.1
– WRF v3.6
– WRF v3.6.1
DTU Wind Energy, Technical University of Denmark8 2 June 2015
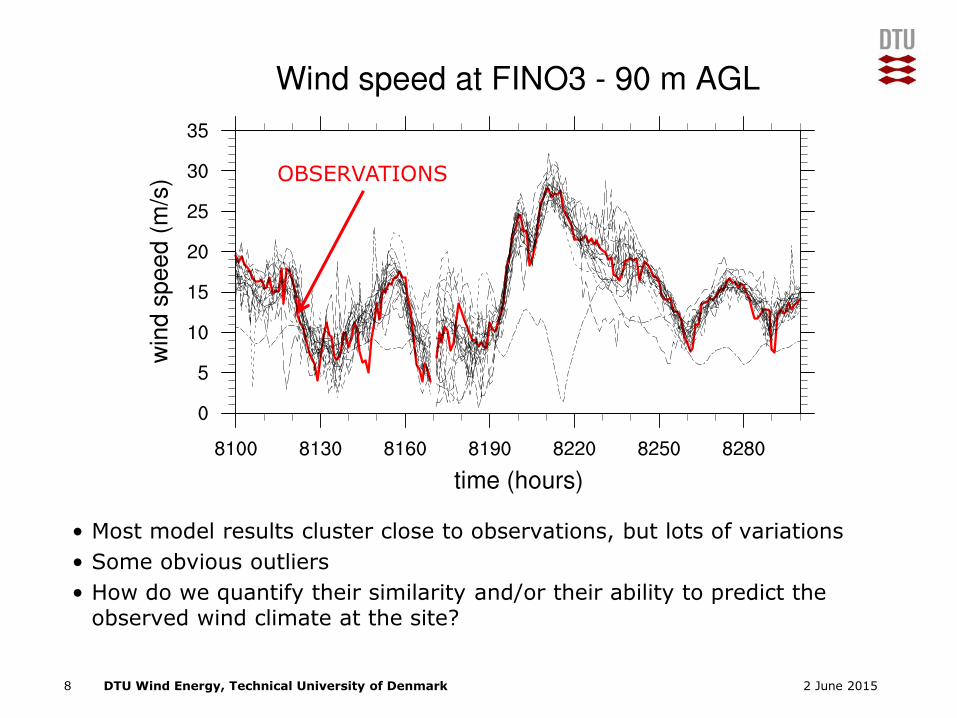
OBSERVATIONS
• Most model results cluster close to observations, but lots of variations
• Some obvious outliers
• How do we quantify their similarity and/or their ability to predict the observed wind climate at the site?
DTU Wind Energy, Technical University of Denmark
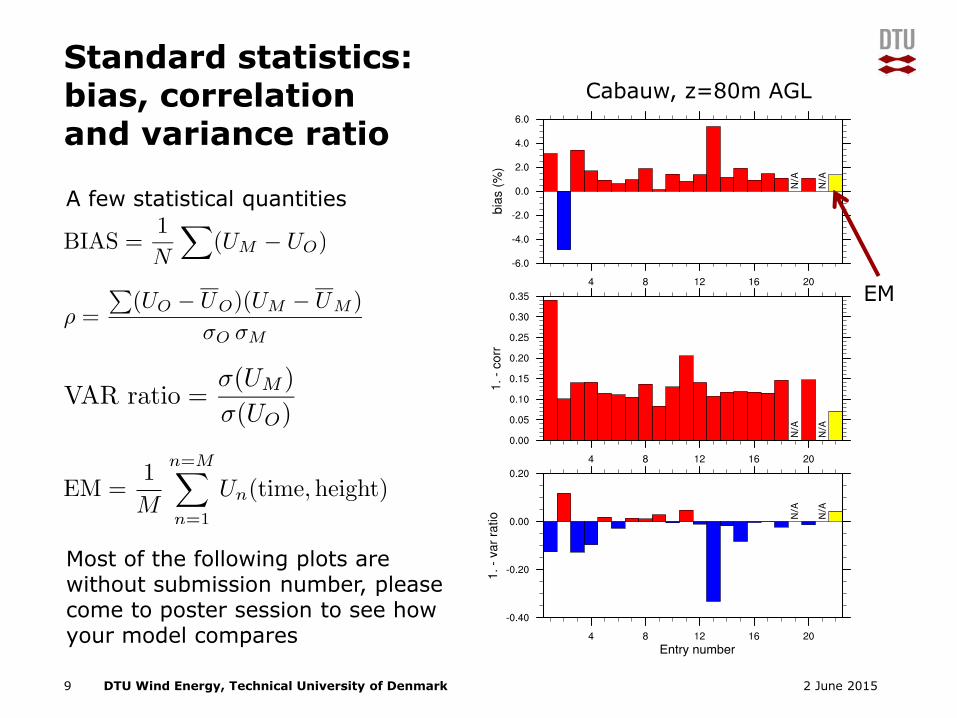
Standard statistics:bias, correlation and variance ratio
9 2 June 2015
EM
Most of the following plots are without submission number, please come to poster session to see how your model compares
A few statistical quantities
Cabauw, z=80m AGL
DTU Wind Energy, Technical University of Denmark
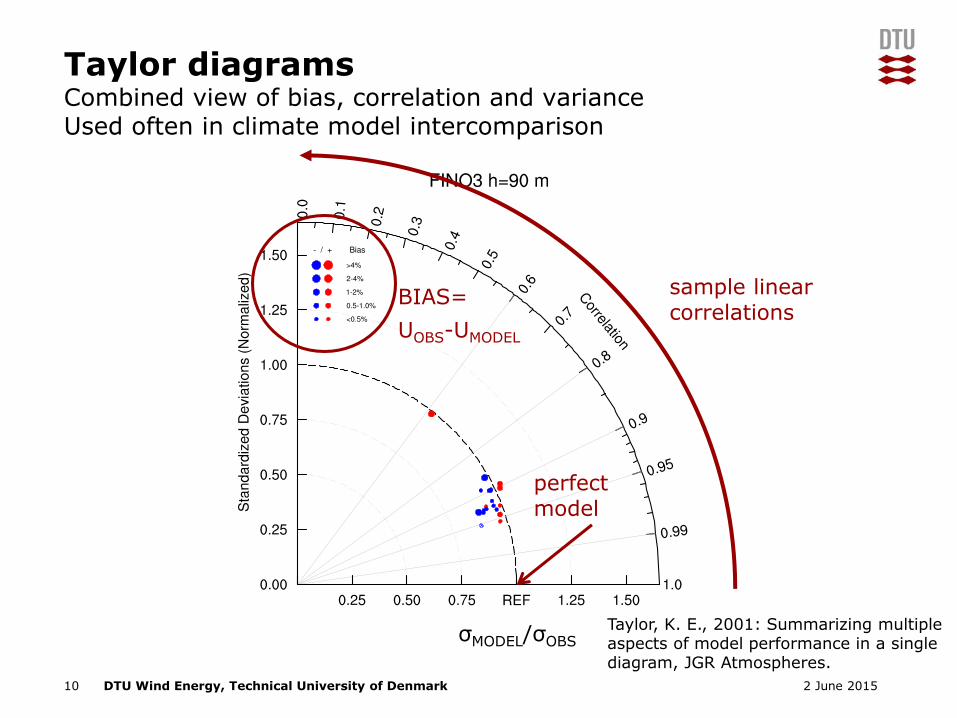
σMODEL/σOBS
BIAS=
UOBS-UMODEL
perfect model
sample linear correlations
10 2 June 2015
Taylor diagramsCombined view of bias, correlation and varianceUsed often in climate model intercomparison
Taylor, K. E., 2001: Summarizing multiple aspects of model performance in a single diagram, JGR Atmospheres.
DTU Wind Energy, Technical University of Denmark11 2 June 2015
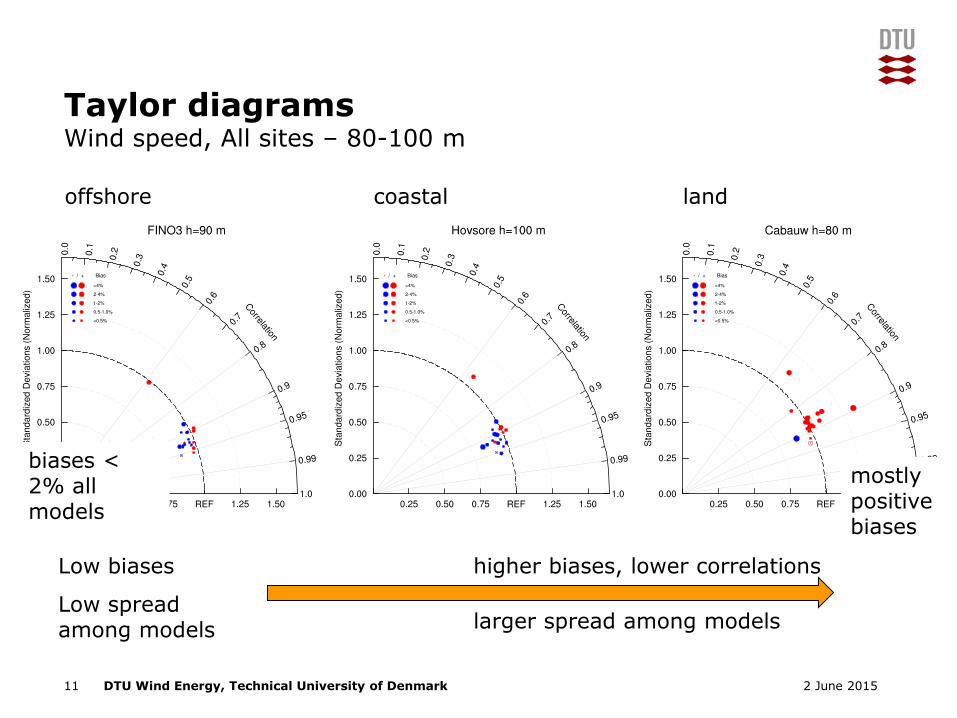
Taylor diagramsWind speed, All sites – 80-100 m
Low biases
Low spread among models
higher biases, lower correlations
larger spread among models
offshore coastal land
mostly positive biases
biases < 2% all models
DTU Wind Energy, Technical University of Denmark
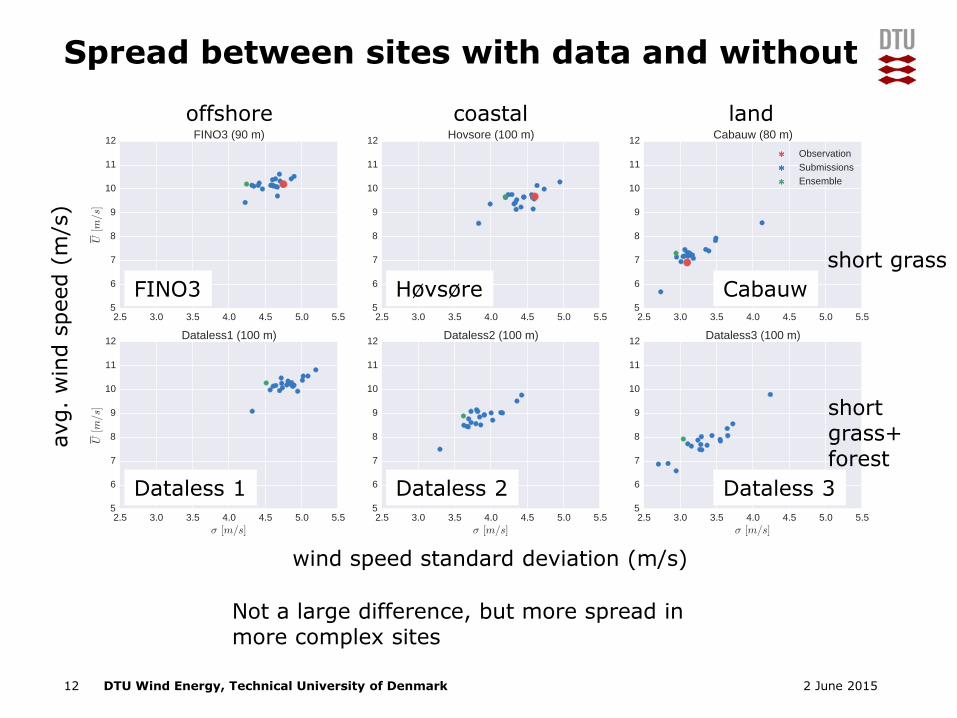
Spread between sites with data and without
12 2 June 2015
offshore coastal land
avg.
win
d s
peed (
m/s
)
wind speed standard deviation (m/s)
short grass
short grass+ forest
Not a large difference, but more spread in more complex sites
FINO3 Høvsøre Cabauw
Dataless 1 Dataless 2 Dataless 3
DTU Wind Energy, Technical University of Denmark13 2 June 2015
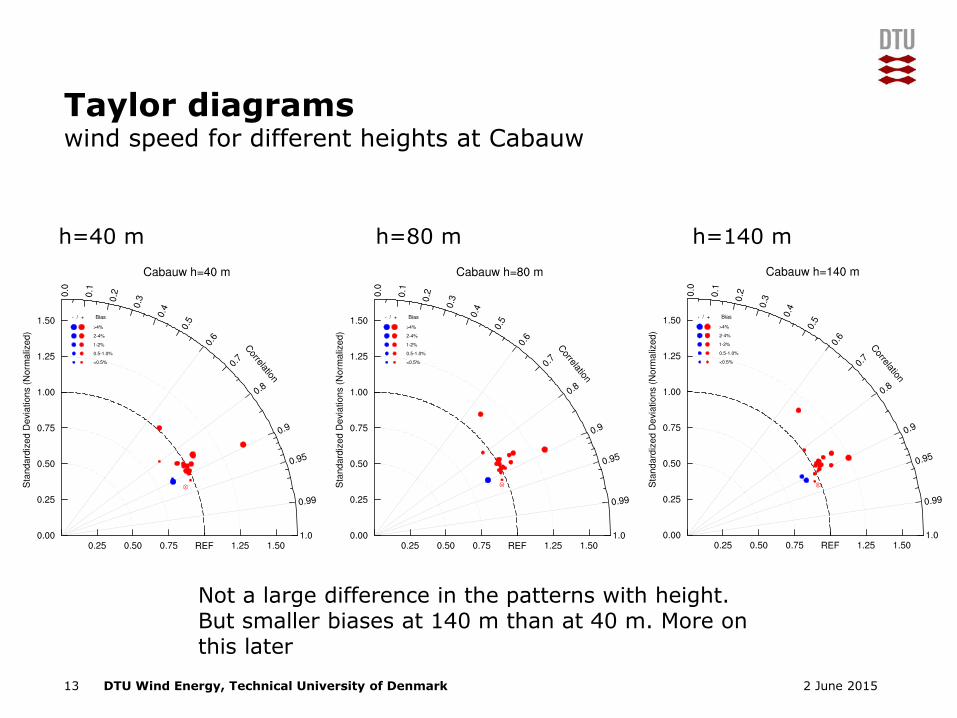
Taylor diagramswind speed for different heights at Cabauw
Not a large difference in the patterns with height. But smaller biases at 140 m than at 40 m. More on this later
h=40 m h=80 m h=140 m
DTU Wind Energy, Technical University of Denmark
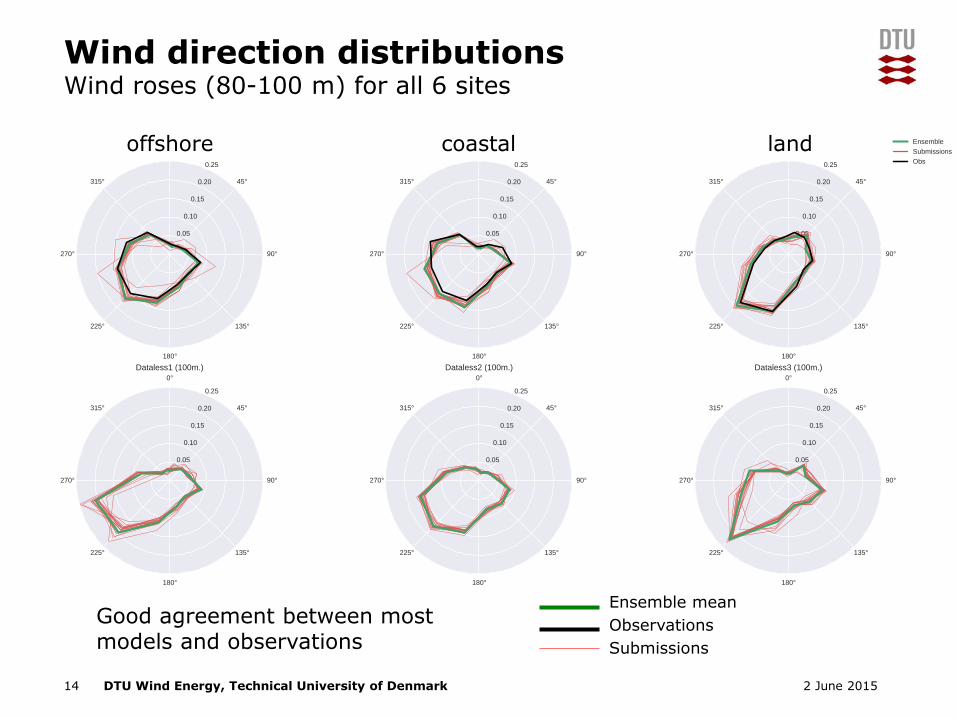
Wind direction distributionsWind roses (80-100 m) for all 6 sites
14 2 June 2015
Ensemble mean
Observations
Submissions
offshore coastal land
Good agreement between most models and observations
DTU Wind Energy, Technical University of Denmark
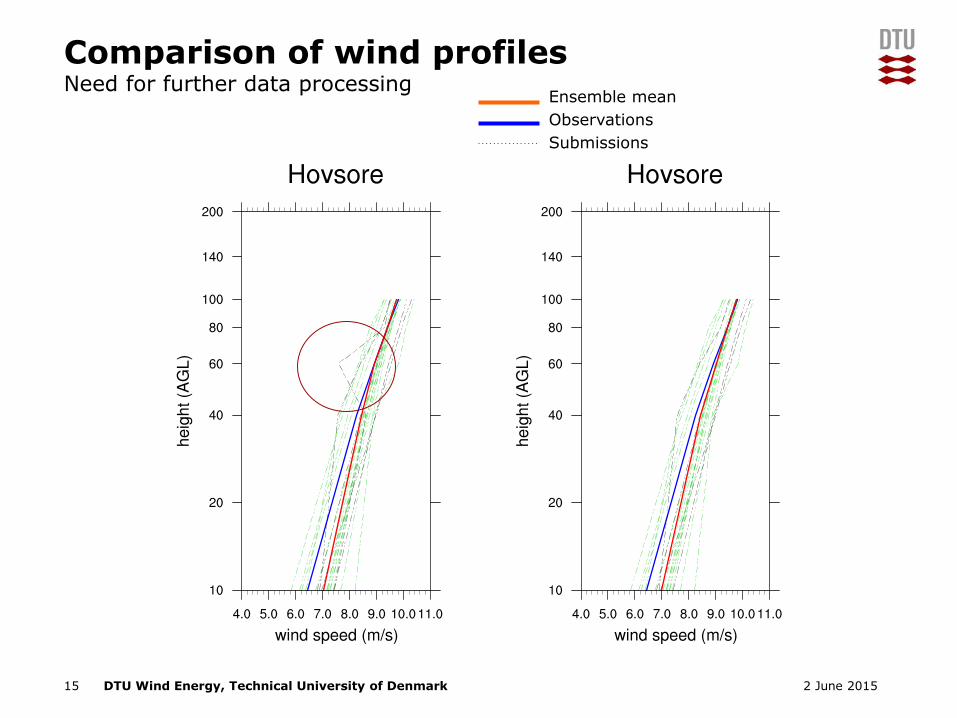
Comparison of wind profilesNeed for further data processing
15 2 June 2015
Ensemble mean
Observations
Submissions
DTU Wind Energy, Technical University of Denmark16 2 June 2015
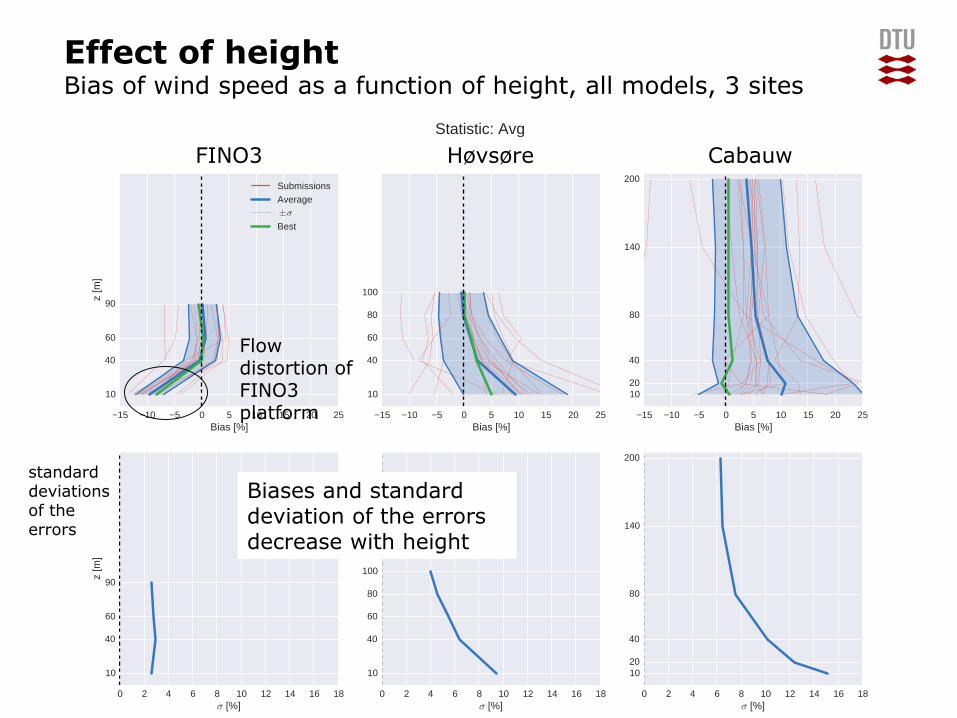
Effect of heightBias of wind speed as a function of height, all models, 3 sites
FINO3 Høvsøre Cabauw
standard deviations of the errors
Flow distortion of FINO3 platform
Biases and standard deviation of the errors decrease with height
DTU Wind Energy, Technical University of Denmark
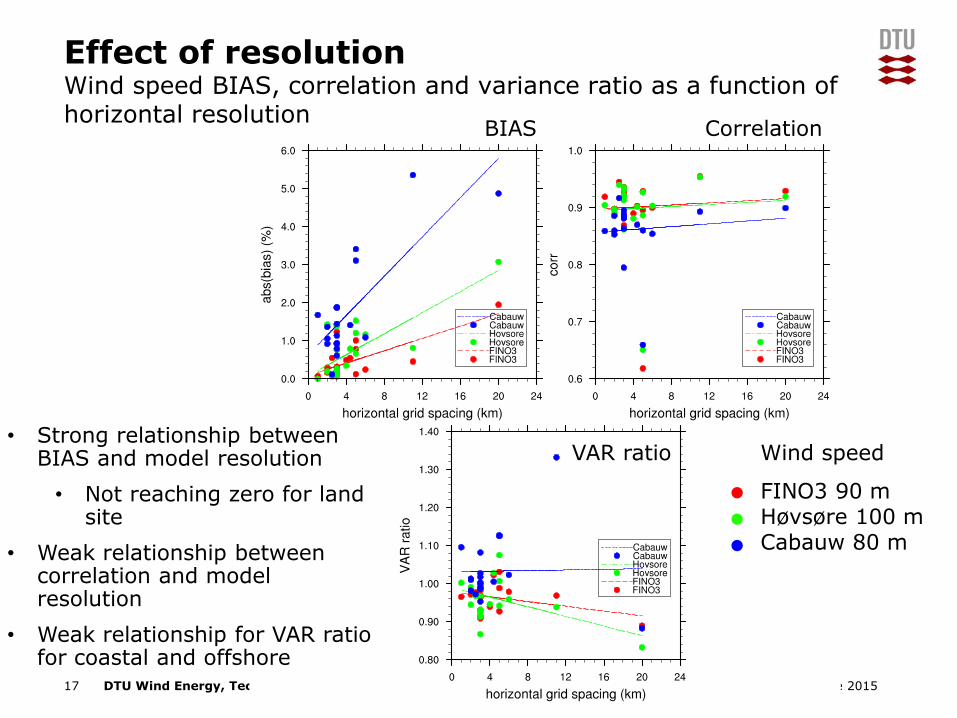
Effect of resolutionWind speed BIAS, correlation and variance ratio as a function of horizontal resolution
17 2 June 2015
Wind speed
FINO3 90 m Høvsøre 100 m Cabauw 80 m
BIAS Correlation
VAR ratio• Strong relationship between
BIAS and model resolution
• Not reaching zero for land site
• Weak relationship between correlation and model resolution
• Weak relationship for VAR ratio for coastal and offshore
DTU Wind Energy, Technical University of Denmark
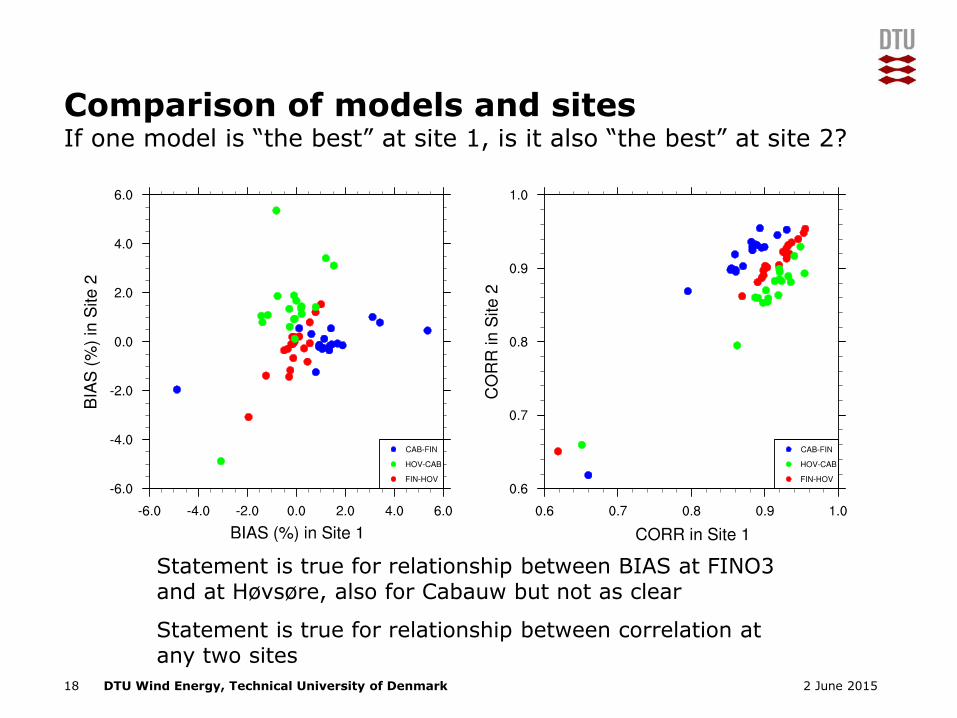
Comparison of models and sitesIf one model is “the best” at site 1, is it also “the best” at site 2?
18 2 June 2015
Statement is true for relationship between BIAS at FINO3 and at Høvsøre, also for Cabauw but not as clear
Statement is true for relationship between correlation at any two sites
DTU Wind Energy, Technical University of Denmark19 2 June 2015
Comparison of models and sitesIf one model is “the best” at site 1, is it also “the best” at site 2?
MAE = mean absolute error for all three sites
DTU Wind Energy, Technical University of Denmark
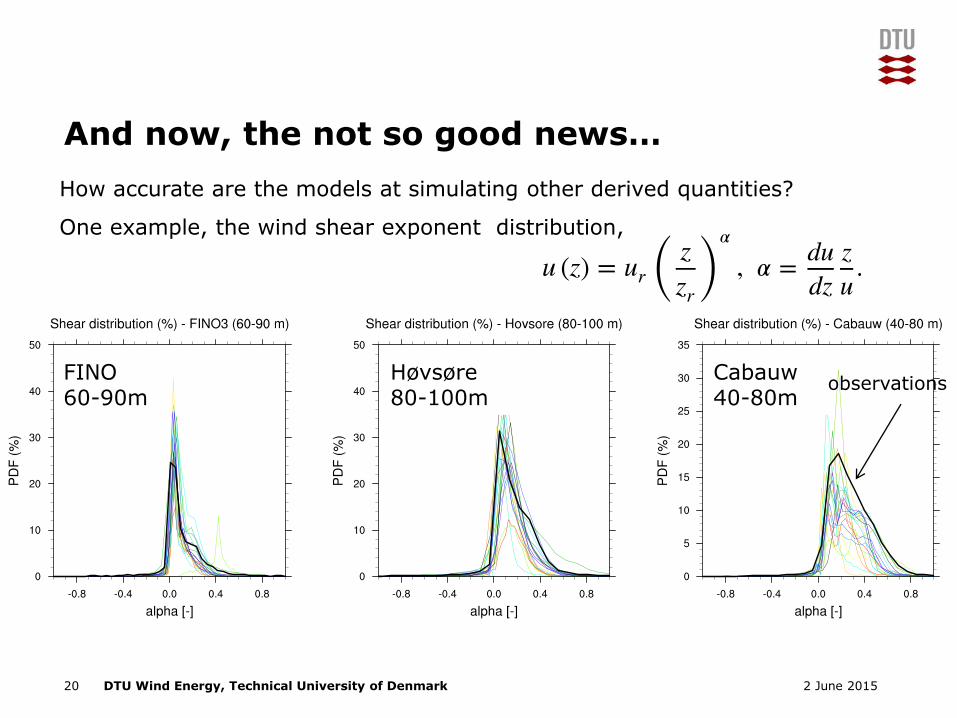
FINO 60-90m
Høvsøre 80-100m
Cabauw 40-80m
How accurate are the models at simulating other derived quantities?
One example, the wind shear exponent distribution,
And now, the not so good news…
20 2 June 2015
observations
DTU Wind Energy, Technical University of Denmark
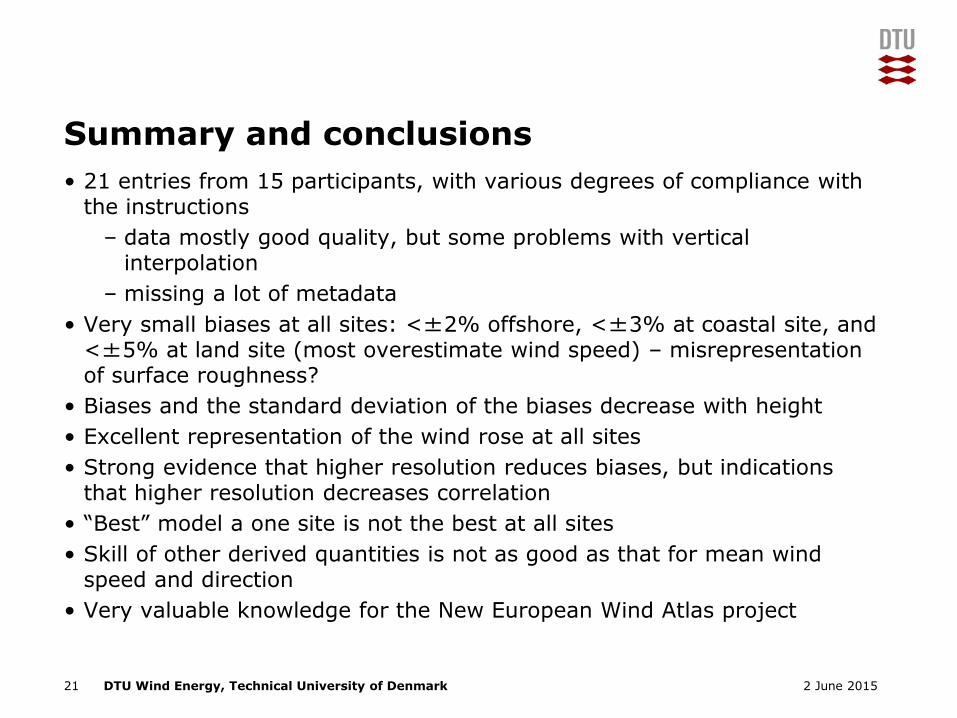
Summary and conclusions
• 21 entries from 15 participants, with various degrees of compliance with the instructions
– data mostly good quality, but some problems with vertical interpolation
– missing a lot of metadata
• Very small biases at all sites: <±2% offshore, <±3% at coastal site, and <±5% at land site (most overestimate wind speed) – misrepresentation of surface roughness?
• Biases and the standard deviation of the biases decrease with height
• Excellent representation of the wind rose at all sites
• Strong evidence that higher resolution reduces biases, but indications that higher resolution decreases correlation
• “Best” model a one site is not the best at all sites
• Skill of other derived quantities is not as good as that for mean wind speed and direction
• Very valuable knowledge for the New European Wind Atlas project
21 2 June 2015
DTU Wind Energy, Technical University of Denmark
Future work
• Missing statistics
– Include time series from raw reanalysis data
– Explore the relationships as a function of model and their parameterizations
– Explore the relationships as a function of other parameters, e.g. surface roughness and stability
– Quantify the directional statistics
– Compute the wind speed spectra as a function of resolution and model
• Input time series into the annual energy production for a given site
• Other suggestions?
22 2 June 2015
DTU Wind Energy, Technical University of Denmark
A request
• If your company/research institute has not participated, please do. There is still time
– Plan to make a more detailed presentation at EWEA 2015 in Paris
– More robust results with more varied submissions and detailed metadata
• If you have made a submission, please consider revising your metadata. The more accurate it is, the more we can learn from the exercise
• Thanks to all that have participated!!!
23 2 June 2015
DTU Wind Energy, Technical University of Denmark
A request
• If your company/research institute has not participated, please do. There is still time
– Plan to make a more detailed presentation at EWEA 2015 in Paris
– More robust results with more varied submissions and detailed metadata
• If you have made a submission, please consider revising your metadata. The more accurate it is, the more we can learn from the exercise