143 Australian Meteorological and Oceanographic Journal 62 (2012) 143–156 Mesoscale modelling of two ‘drying events’: governing processes and implications for fire danger (Manuscript received February 2012; revised August 2012) Rachel L. Badlan 1 , Todd P. Lane 1 , Graham A. Mills 2 and Simon Caine 1 1 School of Earth Sciences, The University of Melbourne, Parkville, Victoria 2 Bureau of Meteorology, Melbourne, Victoria Introduction Bushfires are a major hazard for the Australian community. Events like Ash Wednesday (1983) and Black Saturday (2009) are significant for their associated fatalities, infrastructure loss and extreme fire danger rating, both occurring during periods of heatwaves and having ‘catastrophic’ fire danger ratings (VBRC 2010). Such destructive bushfires are usually associated with extreme meteorological conditions, so- called fire weather, and increasing our understanding of the dynamics of these conditions and the background environment supporting them could improve forecasting methods and allow better planning for future events. In Victoria, the typical pattern for fire weather days is associated with the passage of a cold front, with the pre- frontal air being warm and dry. The pressure gradient ahead of the front is strong and is associated with high wind speeds. The passing of the front is also associated with a change of wind direction, as the meridional wind component changes from northerly to southerly, bringing cooler conditions. Sudden changes of direction can cause significant changes to the fire fronts, endangering firefighters on the ground. It is not only the synoptic-scale conditions that create the fire weather hazard, but rapid temporal and spatial variations in fire danger can play an important role. Rapid reductions in relative humidity, so-called ‘drying events’, are one such important phenomenon. Mills (2008 a, b) describes large-scale descent and the formation of ‘dry slots’ as one important cause of drying events. Sharples et al. (2010) explain the importance of terrain-induced flows, such as downslope winds or föhns, in causing rapid drying accompanied by increases in wind speed and temperature. To illustrate the potential importance of changes in relative humidity, temperature and wind speed, consider the McArthur Forest Fire Danger Index (FFDI). This is the index commonly used to evaluate fire danger in Australia and is defined as FFDI = 2.0 × exp[−0.450 + 0.987 × ln(D) − 0.0345H + 0.0338T + 0.0234V ] ...(1) where D is a drought factor (with a value ranging from 0 (moist) to 10 (dry)), H is the relative humidity in %, T is the screen-level air temperature in ˚C, and V is the 10-m wind speed in the open in km h −1 (McArthur 1967; Luke and McArthur 1978; Noble et al. 1980). The drought factor represents the moisture of the fuel and is based partly on the soil moisture deficit (Dowdy et al. 2009). The FFDI is a simple empirical measure to determine the level of fire danger. It does however have an exponential dependence on temperature, wind speed, and relative humidity and appropriate perturbations in these quantities can have a significant affect on its magnitude. The FFDI categories and values range from ‘low’ (0-11), through ‘high’ Corresponding author address: Rachel Badlan, The University of Melbourne, Parkville, Victoria. Email: [email protected]This study uses mesoscale modelling to examine the processes underlying two ‘drying events’ and their implications for fire danger. Both events occurred in Gippsland, Victoria, Australia, in the lee of the Great Dividing Range, and the role of terrain-induced flows in causing the events is one underlying focus. The Weath- er Research and Forecasting (WRF) model is used in a nested configuration; the highest resolution domain has horizontal grid spacing equal to 1.5 km. The WRF model simulations identify that the first event (29 December 2001) is caused by a regime transition from blocked to unblocked flow, with the cross-mountain flow bringing warmer and drier conditions. The second event (29 May 2007) is related to enhanced downslope flow. Simulations of both events also elucidate important mesoscale processes, namely ‘streamers’ and lee waves, that cause significant per- turbations in the fire danger in the lee of the mountains.
Transcript
143
Australian Meteorological and Oceanographic Journal 62 (2012) 143–156
Mesoscale modelling of two ‘drying events’:governing processes and implications for
fire danger
(Manuscript received February 2012; revised August 2012)
Rachel L. Badlan1, Todd P. Lane1, Graham A. Mills2 and Simon Caine1
1School of Earth Sciences, The University of Melbourne, Parkville, Victoria2Bureau of Meteorology, Melbourne, Victoria
Introduction
Bushfires are a major hazard for the Australian community. Events like Ash Wednesday (1983) and Black Saturday (2009) are significant for their associated fatalities, infrastructure loss and extreme fire danger rating, both occurring during periods of heatwaves and having ‘catastrophic’ fire danger ratings (VBRC 2010). Such destructive bushfires are usually associated with extreme meteorological conditions, so-called fire weather, and increasing our understanding of the dynamics of these conditions and the background environment supporting them could improve forecasting methods and allow better planning for future events. In Victoria, the typical pattern for fire weather days is associated with the passage of a cold front, with the pre-frontal air being warm and dry. The pressure gradient ahead of the front is strong and is associated with high wind speeds. The passing of the front is also associated with a change of wind direction, as the meridional wind component changes from northerly to southerly, bringing cooler conditions. Sudden changes of direction can cause significant changes to the fire fronts, endangering firefighters on the ground. It is not only the synoptic-scale conditions that create the fire weather hazard, but rapid temporal and spatial variations in fire danger can play an important role. Rapid
reductions in relative humidity, so-called ‘drying events’, are one such important phenomenon. Mills (2008 a, b) describes large-scale descent and the formation of ‘dry slots’ as one important cause of drying events. Sharples et al. (2010) explain the importance of terrain-induced flows, such as downslope winds or föhns, in causing rapid drying accompanied by increases in wind speed and temperature. To illustrate the potential importance of changes in relative humidity, temperature and wind speed, consider the McArthur Forest Fire Danger Index (FFDI). This is the index commonly used to evaluate fire danger in Australia and is defined as
where D is a drought factor (with a value ranging from 0 (moist) to 10 (dry)), H is the relative humidity in %, T is the screen-level air temperature in ˚C, and V is the 10-m wind speed in the open in km h−1 (McArthur 1967; Luke and McArthur 1978; Noble et al. 1980). The drought factor represents the moisture of the fuel and is based partly on the soil moisture deficit (Dowdy et al. 2009). The FFDI is a simple empirical measure to determine the level of fire danger. It does however have an exponential dependence on temperature, wind speed, and relative humidity and appropriate perturbations in these quantities can have a significant affect on its magnitude. The FFDI categories and values range from ‘low’ (0-11), through ‘high’ Corresponding author address: Rachel Badlan, The University of
This study uses mesoscale modelling to examine the processes underlying two ‘drying events’ and their implications for fire danger. Both events occurred in Gippsland, Victoria, Australia, in the lee of the Great Dividing Range, and the role of terrain-induced flows in causing the events is one underlying focus. The Weath-er Research and Forecasting (WRF) model is used in a nested configuration; the highest resolution domain has horizontal grid spacing equal to 1.5 km. The WRF model simulations identify that the first event (29 December 2001) is caused by a regime transition from blocked to unblocked flow, with the cross-mountain flow bringing warmer and drier conditions. The second event (29 May 2007) is related to enhanced downslope flow. Simulations of both events also elucidate important mesoscale processes, namely ‘streamers’ and lee waves, that cause significant per-turbations in the fire danger in the lee of the mountains.
144 Australian Meteorological and Oceanographic Journal 62:3 September 2012
(12-24) to ‘extreme’ (75-99) and the newly added category of ‘catastrophic’ (100+). The Black Friday fires (1939) led to the development of the FFDI in the 1960s and were rated at 100. Ash Wednesday and Black Saturday had ratings well above this value. This study examines two observed drying events and uses mesoscale modelling to explore their underlying processes.
Both events occurred in the lee of the Great Dividing Range (GDR) in Gippsland, Victoria (see Fig. 1). In addition to the coastal influence from the sea breezes along the Gippsland coast, fronts often pass over the GDR, creating conditions of strong cross-mountain flow in the north or northwesterly pre-frontal airstream. Both cases occurred in pre-frontal conditions and feature rapid reductions in relative humidity within one hour. The first event was on 29 December 2001 when the automatic weather station (AWS) located at Latrobe Valley (station number: 85280) recorded a reduction in relative humidity of approximately 40 per cent shortly after midday. The second case was at East Sale on 29 May 2007, when the relative humidity fell by approximately twenty per cent in the late morning. Previous work examining the interaction of terrain and fire weather, such as Sharples (2009) found that such terrain can modify conditions leading to föhn effects and mountain waves contributing to elevated local fire danger.
29 December 2001, Latrobe Valley
Shortly after 1200 Australian Eastern Daylight Time (AEDT; UTC+11) on 29 December 2001, the AWS at Latrobe Valley recorded a notable reduction in surface relative humidity from approximately 60 per cent to twenty per cent within an hour (Fig. 2(e)). This drying event is the focus of this section.
Observations and analysisOn 29 December 2001 the eastern part of Victoria was characterised by a pre-frontal airstream (Fig. 3), with the pressure implying northwesterly geostrophic flow. The front arrived around 2000 AEDT 29 December, bringing southwesterly winds and precipitation to Gippsland. The drying event occurred about eight hours before the front’s arrival, suggesting that the processes governing the drying were isolated to the pre-frontal airstream. The conditions at Latrobe Valley AWS featured a gradual increase in 2-m temperature from 15 ˚C at 0800 AEDT to approximately 30 ˚C at 1300 AEDT (Fig. 2(a)). The 10-m wind speed was between 2 and 4 m s−1 throughout the morning, with an east-northeasterly direction that was almost orthogonal to the geostrophic flow implied by Fig. 3. The surface water vapour mixing ratio increased slightly from approximately 9 to 12 g kg−1 during the morning, but the relative humidity decreased during that time because of the increase in temperature. At 1200 AEDT the wind direction changed within a period of about fifteen minutes to be from the west-northwest and there was an increase in wind speed of more than 5 m s−1; the 10-m wind exceeded 8 m s−1 after 1300 AEDT. Accompanying this change was a reduction in water vapour mixing ratio from 12 to 6 g kg−1. There was no notable change to the temperature tendency around this time, i.e. it continued to gradually increase, and the relative humidity dropped from approximately 60 per cent to twenty per cent within one hour, mostly due to the reduction in mixing ratio. This notable reduction in relative humidity and
Fig. 1. Location of the stations used in this study. Model terrain height is represented by green shading, with height in metres.
Fig. 2. Time series of (a) 2-metre temperature, (b) mixing ra-tio, (c) 10-metre wind speed and (d) wind direction, (e) relative humidity and (f) FFDI for 0800–1400 AEDT 29 December 2001 at Latrobe Valley using half-hourly AWS data (solid) and 15-minute WRF data (dashed).
Badlan et al: Mesoscale modelling of two ‘drying events’: governing processes and implications for fire danger 145
concurrent increase in wind speed characterises the drying event. After the drying event (not shown) the northwesterly flow persisted until the passage of the southwesterly change accompanying the front at approximately 2000 AEDT. There was no precipitation and little cloud cover during the day, but the front caused some precipitation that evening. For further information and discussion of this event, see Huang and Mills (2006). The importance of the drying event for fire danger is elucidated by Fig. 2(f), which shows the FFDI (Eqn. 1) calculated from the AWS data using the Bureau of Meteorology’s daily drought factor of 6.0. The FFDI is negligibly small for most of the morning of 29 December. However, the drying event causes the FFDI to increase to approximately eighteen by 1300 AEDT. This increase changes the nominal fire danger rating from ‘low-to-moderate’ to ‘high’. Thus, this drying event causes significant changes in fire danger within a period of about an hour.
Numerical modellingThe 29 December drying event is investigated using a simulation from the Weather Research and Forecasting (WRF) model (Skamarock et al. 2008). Here version 3.1.1 of the WRF Advanced Research core (WRF-ARW) is used. WRF is a compressible, non-hydrostatic model that can be utilised for idealised or realistic applications, uses a terrain-following vertical coordinate based on hydrostatic pressure, and contains a variety of physical parameterisations. For this study the nesting capability of WRF is used to focus on the region of interest at relatively high horizontal resolution. Four two-way nested model domains are used with horizontal grid spacing of 40.5 km (d01), 13.5 km (d02), 4.5 km (d03), and 1.5 km (d04); see Fig. 4 for the locations of these domains. The highest resolution domain (d04) has lateral dimensions equal to 679 × 373 grid points (approximately 1020 × 560 km). Each domain uses the same vertical grid with 64 vertical levels. The model top is located at 5 hPa, and there are twenty-four levels in the lowest 2 km of the atmosphere. The model time steps are 60, 20, 6.66, 2.22 seconds for d01 to d04, respectively. The model parameterises planetary boundary layer physics and vertical mixing at all vertical levels using the Mellor-Yamada-Janjic prognostic turbulent kinetic energy scheme (Janjic 1994). The Rapid Radiative Transfer Model (RRTM) longwave (Mlawer et al. 1997) and Dudhia (1989) shortwave schemes are used along with the 5-layer thermal diffusion surface scheme. The Lin et al. (1983) microphysics scheme is used and the model parameterises cumulus convection on the two coarsest domains using the Kain-Fritsch scheme (Kain and Fritsch 1990, 1993). The model is initialised at 0000 UTC (1100 AEDT) 28 December 2001. Initial conditions are provided by European Centre for Medium-Range Weather Forecast Reanalysis Data (ERA-Interim—Dee et al. 2011), which also provides the boundary conditions for the outermost model domain (d01) at 6-hour intervals. Sea surface temperature (SST) is
interpolated from the ERA-Interim data, with SST remaining fixed for the entire simulation. Preliminary experiments were also performed using the National Centers for Environmental Prediction Global Forecast System (NCEP-GFS) operational analysis as initial and boundary conditions (not shown); simulations using those data did not compare as favourably to the surface observations as those considered here. Specifically, the simulation initialised with NCEP-GFS did not produce the same pattern of lee-side warming and drying as observed by AWS data. For this reason, only the ERA-Interim results are reported here. Figure 2 shows time series from the WRF model simulation at the nearest grid point to the Latrobe Valley AWS. Only the highest resolution domain (d04) is used for grid point extraction for observation comparison throughout this report. The results from the WRF model show good similarity to the AWS observations. In particular, the 2-m temperature (Fig. 2(a)) is within 1 ˚C of the observations for the entire morning; after 1100 AEDT the model is approximately one degree warmer than observed, although this error increases in magnitude after 1200 AEDT to be approximately 2 ˚C too cold. The wind speed and direction are well represented
Fig. 3. MSLP Analysis for 29 December 2001, courtesy Bureau of Meteorology archive.
Fig. 4. The four WRF domains, d01–d04, used in both case studies. Latitude and longitude are shown by dotted lines.
146 Australian Meteorological and Oceanographic Journal 62:3 September 2012
by the model prior to 1100 AEDT, but the simulated mixing ratio is a few g kg−1 too large and accordingly the relative humidity is about ten per cent too high. At approximately 1130 AEDT the model produces a notable drying event that has many of the characteristics of the observed event, albeit approximately 30 minutes too early. The simulated drying event at 1130 AEDT is characterised by a change in wind speed and direction similar to that observed, except the simulated increase in wind speed occurs slightly more rapidly than observed (Fig. 2(c–d)). The simulated mixing ratio reduces by 5 g kg–1—this change is close to the observed reduction (6 g kg−1), however because the simulated mixing ratio was too high in the morning the simulated post-drying-event mixing ratio is approximately 3 g kg−1 too high. The relative humidity reduced from 80 per cent to 40 per cent during the drying event; the reduction in humidity is similar to that observed, but because of the aforementioned moist bias in mixing ratio and cool
temperature bias, the simulated post-drying-event relative humidity does not achieve the very dry conditions that were observed. These errors are further amplified in the calculation of FFDI and although the simulated event causes a rapid increase in FFDI, the increase is not as large as observed. The errors in simulated surface water vapour mixing ratio shown in Fig. 2 are further explored by comparing the 1100 AEDT (0000 UTC) 29 December 2001 sounding at Melbourne Airport with an equivalent profile from the WRF model (Fig. 5). The model is too moist below approximately 2 km, but in closer agreement with the observations above that altitude. The nature of the model simulation is that important land-surface properties are defined in an imperfect way. Specifically, soil moisture and surface properties (e.g. albedo, vegetation, etc.) are determined from a climatological database. Thus, the errors in surface relative humidity are likely related to the representation of land-surface properties with the spatial pattern of soil moisture (in particular) poorly represented in the WRF simulation. The localisation of the errors in mixing ratio below the nominal boundary-layer depth (2 km) is consistent with the errors being of surface origin. It is beyond the scope of this study to correct these errors, which at the very least would require mesoscale assimilation of soil moisture and a more sophisticated land surface scheme. Nonetheless, for this case the errors in mixing ratio are unlikely to have a large impact on the dynamics, with the bias affecting the magnitude of the FFDI but not the processes that control its spatial and temporal variability. To explore the vertical structure of the flow that influences Latrobe Valley, a cross-section of potential temperature and mixing ratio along a northwest-to-southeast transect passing through the Latrobe Valley is shown in Fig. 6. The two times are just before the drying event occurs (1100 AEDT Fig. 6(a–b)) and afterwards (at 1315 AEDT Fig. 6(c–d)). At 1100 AEDT the potential temperature identifies a shallow mixed layer approximately 500 m deep, overlaid by an inversion at approximately 500 m above ground level (AGL) and weaker stability between the inversion and 2 km AGL. The largest values of water vapour mixing ratio are confined below 500 m. The isentropes identify ascent of air over the upwind slopes, strong and localised descent immediately downstream of the highest terrain, and a well-defined hydraulic jump feature just downstream of Latrobe Valley. This jump is reminiscent of similar features identified in idealised studies of downslope flows (e.g. Durran 1986). Between the highest terrain and the hydraulic jump, the mixing ratio is reduced considerably, influenced by descent and mixing of dry air from aloft. This drying in the immediate lee of the highest terrain occurs concurrently with the onset of northwesterly flow in this region (Fig. 7(a)); prior to 1100 AEDT the flow on the southeast side of the terrain had a southeasterly component (not shown). Indeed, further to the southeast of Latrobe Valley (and southeast of the hydraulic jump shown in Fig. 6(a)) the surface wind maintains an easterly component.
Fig. 5. Vertical profile of mixing ratio in g kg-1 from the sounding at Melbourne Airport (solid line) and from WRF output (dashed line) at 1100 AEDT 29 December 2001.
Badlan et al: Mesoscale modelling of two ‘drying events’: governing processes and implications for fire danger 147
At 1330 AEDT the cross-mountain (downslope) flow has fully developed and extends downwind of the GDR to the coastline (Fig. 7(b)). The wind speed shows considerable increases of 3–4 ms−1 on the lee slope compared to the upwind slope, and these increases are manifest as ‘streamers’ of local wind-speed maxima and minima aligned with the direction of the flow. The streamers are approximately 20 km apart and therefore reasonably well resolved by the 1.5 km model grid. Coinciding with the development of the cross-mountain flow, the mixed layer has deepened to be at least 1 km deep (Fig. 6(c)) and the hydraulic jump has moved further downstream (approximately 50–100 km southeast of Latrobe Valley). Between the terrain and the hydraulic jump, the descending flow has also caused a band of increased surface temperature about 3 ̊ C greater than the surroundings (not shown). With the downstream progression of the hydraulic jump, the width of the region of low mixing ratio has expanded to be almost 100 km wide (Fig. 6(d)) and the isopleths suggest descent and mixing of air from above 1 km AGL.
Calculation of the FFDI from the model fields illustrates the influence of the diurnal heating and onset of the downslope flow on the fire danger. A horizontally uniform drought factor, D=6.0, was used; the drought values used for these studies are uniform values provided daily by the Bureau of Meteorology. At 1100 AEDT (Fig. 8(a)) the FFDI is reasonably uniform with values less than ten almost everywhere (except to the northwest of the domain) with no significant cross-mountain gradient. As the daytime temperature increases the FFDI increases across the domain, but also develops a cross-mountain gradient, with larger values on the lee slope. In the vicinity of Latrobe Valley the FFDI exceeds fifteen and immediately to the east of Latrobe Valley exist localised regions of FFDI that exceed twenty-five. The lee-side increase in FFDI is a combined response to the lee-side drying, warming, and the enhanced downslope flow. The localised regions of enhanced FFDI are caused by the streamers of enhanced wind speed identified in Fig. 7(b) and actually exceed the maximum FFDI observed at Latrobe Valley (cf. Fig. 2).
Fig. 6. Cross-section of potential temperature (0.5 K intervals) at (a) 1100 AEDT and (c) 1315 AEDT 29 December 2001 from WRF. The same cross-section of water vapour mixing ratio (shaded with 0.5 g kg-1 contours) at (b) 1100 AEDT and (d) 1315. The cross-section is aligned from northwest (left) to southeast (right), passing through Latrobe Valley. The horizontal distance is displayed as the distance towards the northwest from Latrobe Valley, and (a) and (c) have different vertical axes compared to (b) and (d). The thick black lines indicate the model orography.
148 Australian Meteorological and Oceanographic Journal 62:3 September 2012
DiscussionThe evolution of the flow near Latrobe Valley on 29 December 2001, i.e. the development of enhanced downslope flow and the associated onset of the drying event, can be explained by the diurnal variation in conditions upstream of the GDR. Specifically, we consider the variation in the non-dimensional mountain height,
h=Nhˆ —,U
where N is the Brunt-Väisälä frequency, h is the terrain height, and U is the cross-mountain wind speed. As shown by Smolarkiewicz and Rotunno (1989) and Smith (1989) the characteristics of flow over isolated obstacles is controlled, in
part, by ĥ. In particular, when ĥ << 1 the upstream flow will pass over the terrain and generate gravity waves, and when ĥ >> 1 the upstream flow is blocked, passes around (instead of over) the terrain, and lee vortices or flow reversals can occur. The non-dimensional mountain height is calculated from the model solution at the upstream location (see Fig. 1) approximately 200 km upstream of the GDR using h = 1500 m and vertical averages of N and U over the lowest 1500 m; at 0900 AEDT ĥ = 3.0, at 1100 AEDT ĥ = 0.98, and at 1300 AEDT ĥ = 0.21. These values are consistent with the evolution of the simulated flow. Specifically, in the early morning (not shown) the low-level flow is sufficiently stable that the flow is blocked, the wind upstream of the terrain is diverted predominantly towards the southwest,
Fig. 7. Horizontal cross-section of 10-m winds in m s-1 for (a) 1100 AEDT and (b) 1330 AEDT 29 December 2001 from WRF. Wind vectors are also overlain. The thin black lines indicate the model orography.
Fig. 8. Horizontal cross-section of FFDI from WRF for (a) 1100 AEDT and (b) 1330 AEDT 29 December 2001. The thick black lines indicate the model orography.
Badlan et al: Mesoscale modelling of two ‘drying events’: governing processes and implications for fire danger 149
consistent with established theory of blocked flow in the presence of rotation (e.g. Pierrehumbert and Wyman 1985). At this time the flow on the southeast side of the GDR has an easterly component, consistent with lee-side flow reversals described in Smolarkiewicz and Rotunno (1989). By 1100 AEDT (Fig. 6(a) and 7(a)) surface heating has reduced the upstream stability, ĥ has decreased to intermediate values, and the flow is in a partially blocked regime. The incident northerly / northwesterly flow is deflected towards the right, while some air passes over the terrain leading to enhanced downslope flow, steepened isentropes and mixing in the lee, and the initiation of the surface drying event. As the diurnal heating reduces the upstream stability further at 1330 AEDT (Fig. 6(c)) and ĥ decreases, most of the air passes over the terrain leading to further enhanced downslope flow (Fig. 7(b)), reduced blocking, and enhanced gravity wave activity over the terrain. The WRF simulation of the 29 December 2001 drying event elucidates two important aspects of the terrain-induced flow that are important for fire weather. First, the diurnal heating and associated boundary-layer evolution induces a flow regime transition. The transition from blocked to unblocked flow occurs near midday as the stability upwind of the terrain reduces. The result is enhanced downslope flow, as well as descent and mixing of drier air from aloft leading to an abrupt change in the surface conditions. The increase in wind speed and the reduction in relative humidity leads to a broad increase in FFDI on the lee slope. Secondly, as the downslope flow evolves it produces organised streamers aligned with the cross-mountain flow. These (wind) streamers cause localised variations in FFDI, including large-amplitude waves and their troughs with dimensions of order 20 km. Thus, the mesoscale variations in the lee flow are able to cause mesoscale enhancements in fire danger.
29 May 2007, East Sale
At around 1100 Australian Eastern Standard Time (AEST = UTC + 10 hours) on 29 May 2007 the East Sale AWS (station number: 85072) recorded a rapid increase in temperature of approximately 5 ˚C and a reduction in relative humidity of approximately twenty per cent. This drying event was originally described by Sharples et al. (2010), who concluded that a föhn was its likely cause, and is the focus of this section.
Observations and AnalysesThe synoptic flow on 29 May 2007 was dominated by a deep low to the southwest of Victoria, with accompanying cold and warm fronts, and a broad high in the Tasman Sea (Fig. 9). Over most of Victoria there was a strong pressure gradient and northwesterly geostrophic flow; this flow was directed perpendicular to the GDR thereby possessing a strong cross-mountain component. This surface wind direction is typical of pre-frontal airstreams in this region and commonly occurs in the winter months when the frontal systems infiltrate further north into the interior of the
continent (a similar pattern is produced by summertime cold fronts, albeit restricted to the largest events such as Black Saturday). During these cooler conditions the mixed layer tends to be fairly shallow, so the hypothesis for this case is that the drying event is not connected to a dry intrusion, it is in fact a localised, terrain-induced flow. The AWS data at East Sale (Fig. 10) indicates that the drying event begins at 1100 AEST and is characterised
Fig. 9. MSLP Analysis for 29 May 2007, courtesy Bureau of Meteorology archive.
Fig. 10. Time series of (a) 2-metre temperature, (b) mix-ing ratio, (c) 10-metre wind speed and (d) direction, (e) relative humidity and (f) FFDI (with a corrected val-ue for WRF shown in red) for 1000–2000 AEST 29 May 2007 from the East Sale AWS half-hourly data (solid line) and WRF 15-minute data (dashed line).
150 Australian Meteorological and Oceanographic Journal 62:3 September 2012
by an abrupt increase in temperature of about 5 ˚C, an enhancement in 10-m wind speed from about 4 m s−1 to 10 m s−1 , a shift in wind direction to be within 10˚ of northerly, and a reduction in water vapour mixing ratio of a few g kg−1. The warming and reduction in mixing ratio during this drying event led to a reduction in relative humidity of about twenty per cent (from about 60 per cent to about 40 per cent), and the conditions persisted for about six hours until a wind change occurred at approximately 1700 AEST. The northerly winds (with their slight easterly component) in the lee of the GDR are consistent with the poleward deflection of the (north-westerly) cross-mountain winds by the lee trough. Despite occurring in May, this drying event caused a rapid increase in FFDI from pre-event values of approximately
Fig. 11. Vertical profiles at the upstream location using LAPS forecasts at 1300 AEST 29 May 2007, (a) potential temperature, θ, (K), (b) wind direction (˚), and (c) wind speed (m s-1). The 15-hour forecast is shown by the solid lines and the 27-hour forecast by the dotted lines.
Fig. 12. (a) Cross-section showing isopleths of potential temperature (θ), (b) cross-section of vertical velocity with negative values dashed and the zero contour re-moved and (c) FFDI values for Victoria. All figures are shown at 1300 AEST using LAPS 27-hour forecast for 29 May 2007. The cross-sections in (a)–(b) are shown in (c) by a solid black line; the distances are relative to Latrobe Valley indicated by a red cross. The dashed lines in (c) indicate the model orography.
Fig. 13. Vertical profile at the upstream location for (a) N (s-1), (b) Scorer parameter l2 (km-2) and (c) critical hori-zontal wavelength (km) using LAPS forecasts at 1300 AEST 29 May 2007. The 15-hour forecast is shown by the solid lines and the 27-hour forecast by the dot-ted lines. Gaps in the 27-hour forecast profiles result from imaginary solutions.
Fig. 14. Visible satellite image (MODIS) of Victoria and southern New South Wales at 1005 AEST, 29 May 2007.
Badlan et al: Mesoscale modelling of two ‘drying events’: governing processes and implications for fire danger 151
two to exceed ten shortly after 1100 AEDT. (Here FFDI is calculated with a drought index value of D=7.9). The maximum FFDI of thirteen occurred at around 1400 AEDT, which corresponds to ‘High’ fire danger. This peak (and the enhanced values during the day) were caused by the combined effect of the warming, drying and enhanced wind speed accompanying the event. The Australian Bureau of Meteorology’s Limited Area Prediction System (LAPS, Puri et al. 1998) is used to provide information about the upstream and broader-scale conditions (unfortunately LAPS data were unavailable for the December 2001 event). The LAPS model is a hydrostatic regional numerical weather prediction and data assimilation system. It has 0.125˚ horizontal resolution and 29 vertical (σ) levels. Data for two forecasts, one initialised at 2200 AEST (1200 UTC) 28 May 2007 and another initialised at 1000 AEST (0000 UTC) 28 May 2007 are examined here; these two forecasts were initialised approximately 15-hours and 27-hours before the event, respectively. Vertical profiles of potential temperature, wind speed and direction from LAPS at 1300 AEST 29 May 2007 at the upstream location (Fig. 1, approximately 325 km northwest of East Sale) are shown in Fig. 11. Both forecasts show very similar conditions near the surface with the largest differences in the wind speed and direction above 8 km. Fig. 11(a) shows that the tropopause is located at approximately 12 km. An important feature of the upstream conditions, illustrated in Fig. 11(b), is that the wind in the troposphere shows little variation in its direction. Near the surface the wind is from 345˚ and above 1 km the wind is from 320˚. Therefore, the majority of the flow is perpendicular to the southwest-northeast orientation of the GDR upstream of East Sale. The wind speed (Fig. 11(c)) features a shear layer in the lowest two kilometres, relatively uniform speeds of approximately 30 m s−1 throughout most of the troposphere and a 40 m s−1 jet centred on the tropopause. Figure 12(a–b) shows a northwest-to-southeast cross-section passing through East Sale of the LAPS (27-hour) forecast at 1300 AEST 29 May 2007. The cross-section shows evidence of cross-mountain flow with wavelike perturbations of potential temperature (Fig. 12(a)) and vertical velocity (Fig. 12(b)) above the GDR. In particular, the vertical velocity (calculated from omega) is consistent with a vertically propagating mountain wave, with upstream tilted phase structures. The near-surface flow on the lee slope features strong descent, accompanied by warming of about 3–4 ˚C and a reduction in stability; the upstream structures in potential temperature are indicative of partial blocking. The LAPS terrain has a maximum height of approximately 1 km. Figure 11(c) shows the mean upstream wind speed below 1 km to be approximately 20 m s−1 and the upstream Brunt-Väisälä frequency below ridge height is approximately 0.01 s−1 (Fig. 13(a)); therefore, the non-dimensional mountain height is approximately 0.5. The LAPS simulated flow, featuring a combination of gravity waves and nonlinearities near the surface, is consistent with ĥ = 0.5
(e.g. Smolarkiewicz and Rotunno 1989), albeit restricted to the hydrostatic response. As with Sharples et al. (2010) the FFDI is also calculated (using a drought factor of 7.9) from the LAPS forecast at 1300 AEST (Fig. 12(c)). There are two regions of high FFDI, to the northwest of the GDR and in its lee. Over the terrain the FFDI is low due to the reduced surface temperatures.
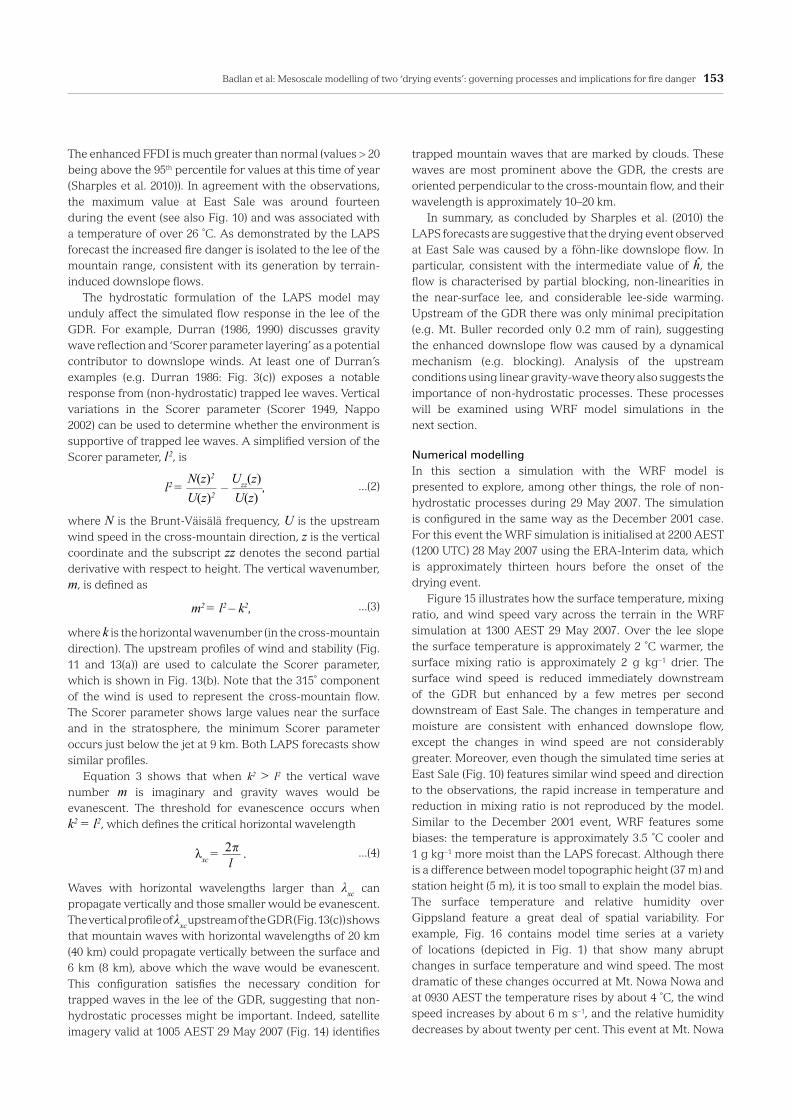
Fig. 15. 2-metre temperature in K (top), surface mixing ra-tio in g kg-1 (middle), and 10 metre wind in m s-1 (bottom) from WRF at 1300 AEST 29 May 2007. Quantities are along a north-to-south oriented line passing through East Sale. The thick black lines indicate the model orography. Distance is relative to East Sale.
152 Australian Meteorological and Oceanographic Journal 62:3 September 2012
Fig. 16. Time series of (a) 10-metre wind (m s-1), (b) surface mixing ratio (g kg-1), (c) relative humidity (%), and (d) 2-metre temperature (˚C) at four locations within the WRF simulation: Mt. Moornapa, Mt. Nowa Nowa, Orbost, and East Sale from 0700–2000 AEST 29 May 2007.
Badlan et al: Mesoscale modelling of two ‘drying events’: governing processes and implications for fire danger 153
The enhanced FFDI is much greater than normal (values > 20 being above the 95th percentile for values at this time of year (Sharples et al. 2010)). In agreement with the observations, the maximum value at East Sale was around fourteen during the event (see also Fig. 10) and was associated with a temperature of over 26 ˚C. As demonstrated by the LAPS forecast the increased fire danger is isolated to the lee of the mountain range, consistent with its generation by terrain-induced downslope flows. The hydrostatic formulation of the LAPS model may unduly affect the simulated flow response in the lee of the GDR. For example, Durran (1986, 1990) discusses gravity wave reflection and ‘Scorer parameter layering’ as a potential contributor to downslope winds. At least one of Durran’s examples (e.g. Durran 1986: Fig. 3(c)) exposes a notable response from (non-hydrostatic) trapped lee waves. Vertical variations in the Scorer parameter (Scorer 1949, Nappo 2002) can be used to determine whether the environment is supportive of trapped lee waves. A simplified version of the Scorer parameter, l2, is
...(2)l2 = — – —, N(z)2
U(z)2
Uzz(z)U(z)
where N is the Brunt-Väisälä frequency, U is the upstream wind speed in the cross-mountain direction, z is the vertical coordinate and the subscript zz denotes the second partial derivative with respect to height. The vertical wavenumber, m, is defined as
...(3)m2 = l2 – k2,
where k is the horizontal wavenumber (in the cross-mountain direction). The upstream profiles of wind and stability (Fig. 11 and 13(a)) are used to calculate the Scorer parameter, which is shown in Fig. 13(b). Note that the 315˚ component of the wind is used to represent the cross-mountain flow. The Scorer parameter shows large values near the surface and in the stratosphere, the minimum Scorer parameter occurs just below the jet at 9 km. Both LAPS forecasts show similar profiles. Equation 3 shows that when k2 > l2 the vertical wave number m is imaginary and gravity waves would be evanescent. The threshold for evanescence occurs when k2 = l2, which defines the critical horizontal wavelength
...(4)λхс = — . 2�
l
Waves with horizontal wavelengths larger than λxc can propagate vertically and those smaller would be evanescent. The vertical profile of λxc upstream of the GDR (Fig. 13(c)) shows that mountain waves with horizontal wavelengths of 20 km (40 km) could propagate vertically between the surface and 6 km (8 km), above which the wave would be evanescent. This configuration satisfies the necessary condition for trapped waves in the lee of the GDR, suggesting that non-hydrostatic processes might be important. Indeed, satellite imagery valid at 1005 AEST 29 May 2007 (Fig. 14) identifies
trapped mountain waves that are marked by clouds. These waves are most prominent above the GDR, the crests are oriented perpendicular to the cross-mountain flow, and their wavelength is approximately 10–20 km. In summary, as concluded by Sharples et al. (2010) the LAPS forecasts are suggestive that the drying event observed at East Sale was caused by a föhn-like downslope flow. In particular, consistent with the intermediate value of ĥ, the flow is characterised by partial blocking, non-linearities in the near-surface lee, and considerable lee-side warming. Upstream of the GDR there was only minimal precipitation (e.g. Mt. Buller recorded only 0.2 mm of rain), suggesting the enhanced downslope flow was caused by a dynamical mechanism (e.g. blocking). Analysis of the upstream conditions using linear gravity-wave theory also suggests the importance of non-hydrostatic processes. These processes will be examined using WRF model simulations in the next section.
Numerical modellingIn this section a simulation with the WRF model is presented to explore, among other things, the role of non-hydrostatic processes during 29 May 2007. The simulation is configured in the same way as the December 2001 case. For this event the WRF simulation is initialised at 2200 AEST (1200 UTC) 28 May 2007 using the ERA-Interim data, which is approximately thirteen hours before the onset of the drying event. Figure 15 illustrates how the surface temperature, mixing ratio, and wind speed vary across the terrain in the WRF simulation at 1300 AEST 29 May 2007. Over the lee slope the surface temperature is approximately 2 ˚C warmer, the surface mixing ratio is approximately 2 g kg−1 drier. The surface wind speed is reduced immediately downstream of the GDR but enhanced by a few metres per second downstream of East Sale. The changes in temperature and moisture are consistent with enhanced downslope flow, except the changes in wind speed are not considerably greater. Moreover, even though the simulated time series at East Sale (Fig. 10) features similar wind speed and direction to the observations, the rapid increase in temperature and reduction in mixing ratio is not reproduced by the model. Similar to the December 2001 event, WRF features some biases: the temperature is approximately 3.5 ˚C cooler and 1 g kg−1 more moist than the LAPS forecast. Although there is a difference between model topographic height (37 m) and station height (5 m), it is too small to explain the model bias.The surface temperature and relative humidity over Gippsland feature a great deal of spatial variability. For example, Fig. 16 contains model time series at a variety of locations (depicted in Fig. 1) that show many abrupt changes in surface temperature and wind speed. The most dramatic of these changes occurred at Mt. Nowa Nowa and at 0930 AEST the temperature rises by about 4 ˚C, the wind speed increases by about 6 m s−1, and the relative humidity decreases by about twenty per cent. This event at Mt. Nowa
154 Australian Meteorological and Oceanographic Journal 62:3 September 2012
Nowa possesses similar characteristics to the observed drying event at East Sale, albeit approximately 90 km away. Part of the spatial variability in surface characteristics in the lee of the GDR is related to the trapped gravity waves produced in the simulation (Fig. 17). The vertical velocity (Fig. 17(b)) illustrates that the waves are trapped between the surface and approximately 8 km above mean sea level (AMSL), with maximum amplitudes at around 4 km AMSL. The potential temperature (Fig. 17(a)) illustrates that vertical displacement amplitudes are at least 500 m. The horizontal wavelength of the simulated waves is approximately 15 km; this simulated wavelength is in agreement with the analysis of the upstream conditions from LAPS using the Scorer parameter considered earlier. The orientation of the simulated waves (not shown) and their wavelength (Fig. 17) is also consistent with those waves identified in the satellite image (Fig. 14). Figure 17(a) shows some evidence of features normally associated with enhanced downslope flow. In particular, there is a well-defined region of descent approximately 100 km upstream of East Sale followed by trapped waves, similar to Durran’s (1990) regime with a ‘stationary jump’. As described by Durran, the reflection of wave energy plays an important role in the enhanced surface flow.
In the region below the trapped waves, including about 10–40 km upstream of East Sale, the near-surface isentropes have descended from their upstream location and the result is enhanced surface temperatures in this region. Nonetheless, despite reproducing the characteristics of the satellite-observed trapped mountain waves, the simulation does fail to produce the rapid change in surface characteristics (viz. the drying event) at East Sale. It does however, produce similar features elsewhere in the lee. Figure 18 shows a similar cross-section to Fig. 17, except passing through Mt. Nowa Nowa at 1000 AEST, i.e. just after the rapid change in surface properties simulated at Mt. Nowa Nowa. This cross-section shows features more consistent with enhanced downslope flow. There is well-defined descent from the peak of the GDR (at about 2 km AMSL) until it reaches a hydraulic jump-like feature near Mt. Nowa Nowa (Fig. 18(a)). A strong signal in vertical velocity exists within the jump at about 2 km AMSL where the upward velocity of 5.57 m s−1 changes to a downward velocity of 3.75 m s−1 within a distance of approximately 5 km (Fig. 18(b)). The jump-like feature remains approximately stationary for the next few hours and its location is probably important in defining the characteristics of this localised drying event. Recently Doyle et al. (2011) conducted a suite of numerical experiments of enhanced downslope flow using different numerical models and ultimately concluded that such flows had low predictability. In a similar regime to that considered here, Doyle et al. showed that there was a broad range of model outcomes, including hydraulic jumps, trapped waves, and low-level wave breaking. Moreover, Watson and Lane (2012) have shown that in flows that feature curved mountain ridges, the flow regime can vary from a linear to a nonlinear regime along the ridge. These properties of downslope flows make their simulation challenging and provides some explanation for the differences between the model and the surface observations.
DiscussionThe observations, LAPS forecasts and model simulation have determined that this event is composed of two main processes: (1) the warming and drying occurring in the lee due to the föhn-like wind caused by partial upstream blocking and wave amplification; and (2) the modulation of the surface flow over the lee slope by trapped mountain waves. The WRF-model simulation reproduced the important features of this event, although the simulated drying event was displaced in time (two hours early) and space (90 km to the northeast). Trapped mountain waves cause surface perturbations in wind speed, temperature, and relative humidity due to a combination of the wave-induced wind perturbations and the vertical displacements. Such waves are nominally stationary, and therefore the perturbations can be persistent (e.g. a few hours). Thus, the perturbations caused by such
Fig. 17. Cross-section from WRF of (a) potential temperature in K and (b) vertical velocity with solid lines repre-senting positive values and negative dashed (0.75 m s-1 contour intervals, with the zero contour removed) at 1300 AEST 29 May 2007. The cross-section is from northwest to southeast, passing through East Sale; distance is measured relative to East Sale. The thick black lines indicate the model orography.
Badlan et al: Mesoscale modelling of two ‘drying events’: governing processes and implications for fire danger 155
waves can have importance influences on the fire danger. To demonstrate this process, the FFDI is calculated from the WRF simulation and shown in Fig. 19. (To calculate the FFDI, the WRF output is first corrected for the biases in temperature (-3.5 ˚C) and mixing ratio (1 g kg−1) described earlier, and from now on referred to as the corrected FFDI.) The corrected FFDI demonstrates predominantly higher values in the lee of the GDR compared to upstream. The FFDI in the lee is also strongly modulated by the trapped
lee waves, and the variations in wind speed make the largest contribution to these variations (not shown). Variations in the FFDI from wave crest-to-trough are from approximately five to fifteen. Thus, there are considerable local enhancements in fire danger due to mountain waves. Despite the corrected FFDI at East Sale being less than the observed value (due to the lack of abrupt drying and warming), simulated values of FFDI elsewhere exceed the observed value in a few locations. There are also many localised regions with FFDI values as large as those observed at East Sale. The waves modulate the increased fire danger in the lee of the GDR (caused by downslope warming and drying) and create localised regions of enhanced fire danger. These localised ‘hot spots’ of increased fire danger vary on scales of about 10 km. The wave crests are approximately steady, but the specific locations of these enhanced regions would be difficult to predict and make direct comparisons to observations challenging. However, despite these challenges, forecasting the presence of ‘hot spots’ within a region (even if they are displaced slightly) is valuable.
Summary and Conclusions
This study has examined two observed ‘drying events’ using a nested version of the WRF model. In both cases, the highest-resolution WRF model domain had horizontal grid spacing equal to 1.5 km. Even though there were some differences between the observed and simulated flow, the WRF model was able to elucidate the important processes governing the drying events. These included a regime transition from blocked to unblocked flow due to diurnal heating and the onset of enhanced downslope flow caused by partial blocking upstream. These drying events both resulted in rapid changes in fire danger (quantified using the FFDI). The WRF simulations also demonstrated two processes responsible for localised enhancements in fire danger. The first was the generation of streamers of high wind speed in the lee of the Great Dividing Range. These form as the flow is funnelled and partially blocked by the prominent peaks along the range. The second process was trapped mountain waves that were shown to strongly modulate the FFDI in the lee of the mountains. The localised enhancements caused by these processes caused the FFDI to vary from values nominally categorised as ‘low’ to ‘high’ (29 May 2007) or ‘high’ to ‘very high’ (29 December 2001) over as little as 10 to 20 km in the horizontal. While no fire was associated with either event, understanding the governing processes is particularly important. Drying events have serious implications for containment of existing fires, and increase the potential for new fires to ignite by increasing fire danger through stronger wind gusts, drier fuels, and warmer air. Fires also occur in the cooler months (not just in the summer) as prescribed burns are carried out when the main threat of bushfires has passed and before the vegetation and atmospheric conditions become too moist. Drying events in
Fig. 18. As for Fig. 17, except at 1000 AEST 29 May 2007 and the cross-section passes through Mt. Nowa Nowa, with distance measured relative to Mt. Nowa Nowa. The thick black lines indicate the model orography.
Fig. 19. Corrected FFDI values 1300 AEST 29 May 2007 from WRF. The thin black lines indicate the model orography.
156 Australian Meteorological and Oceanographic Journal 62:3 September 2012
the cooler months can affect these burns and, with half of all fires in Victoria being controlled burns, there is a great need and benefit in understanding the dynamics of cooler season conditions. The amount of acreage undergoing land and fuel management is set to increase with the 2009 Victorian Bushfires Royal Commission recommending that a minimum of five per cent of public land undergo prescribed burning (Recommendation 56, VBRC 2010). Increased prescribed burning arguably places increased responsibility on those agencies making forecasts of fire weather conditions. As well as identifying the processes responsible for these localised enhancements in fire danger, this study has illustrated the potential for using high-resolution numerical weather prediction for identifying the mesoscale variability in fire danger. This has important applications for weather prediction on fire days and for planning prescribed burns. Importantly, the mountain wave processes and streamers are unable to be properly resolved by the current configurations of weather prediction models used operationally in Australia, but future increases in resolution should permit this. The opportunities presented by the ongoing development of the Australian Community Climate and Earth System Simulator (ACCESS) hold much promise for better fire weather prediction.
Acknowledgments
We thank Jason Sharples for useful discussions. This work was funded by the Australian Research Council (ARC) Discovery Project Scheme (DP1093148), and TPL is supported by an ARC Future Fellowship (FT0990892). ECMWF ERA-Interim data used in these studies have been obtained from the ECMWF Data Server. Computing facilities were provided by the Victorian Partnership for Advanced Computing (VPAC) and the National Computational Infrastructure (NCI) facility; this work also benefitted from computational support provided by the ARC Centre of Excellence for Climate System Science (CE110001028).
S., Andrae, U., Balmaseda, M.A., Balsamo, G., Bauer, P., Bechtold, P., Beljaars, A.C.M., van de Berg, L., Bidlot, J., Bormann, N., Delsol, C., Dragani, R., Fuentes, M., Geer, A.J., Haimberger, L., Healy, S.B., Hersbach, H., Hólm, E.V., Isaksen, L., Kållberg, P., Köhler, M., Mat-ricardi, M., McNally, A.P., Monge-Sanz, B.M., Morcrette, J.-J., Park, B.-K., Peubey, C., de Rosnay, P., Tavolato, C., Thépaut, J.-N. and Vitart, F. 2011. The ERA-Interim reanalysis: configuration and performance of the data assimilation system. Q. J. R. Meteorol. Soc., 137, 553–597. doi: 10.1002/qj.828.
Dowdy, A.J., Mills, G.A., Finkele, K. and de Groot, W. 2009. Australian fire weather as represented by the McArthur Forest Fire Danger In-dex and the Canadian Forest Fire Weather Index. CAWCR Technical Report No. 10. Australia. Centre for Australian Weather and Climate Research.
Doyle, J.D., Gaberšek, S., Jiang, Q., Bernardet, L., Brown, J.M., Dörn-brack, A., Filaus, E., Grubišic’, V., Kirshbaum, D.J., Knoth, O., Koch, S., Schmidli, J., Stiperski, I., Vosper, S., and Zhong, S. 2100. An intercomparison of T-REX mountain-wave simulations and implica-
tions for mesoscale predictability. Mon. Wea. Rev., 139, 2811-31.Dudhia, J. 1989. Numerical study of convection observed during the win-
ter monsoon experiment using a mesoscale two-dimensional model. J. Atmos. Sci., 46, 3077-3107.
Durran, D.R. 1986. Another look at downslope windstorms. Part I: On the development of analogs to supercritical flow in an indefinitely deep continuously stratified fluid. J. Atmos. Sci., 93, 2527-43.
Durran, D.R. 1990. Mountain waves and downslope winds. Atmospheric Processes over Complex Terrain, B. Blumen Ed., American Meteoro-logical Society, Boston, 59-81.
Huang, X. and Mills, G.A. 2006. Objective identification of wind change timing from single station observations. BMRC Research Report No. 120, Bur. Met. Australia.
Janjic, Z.I. 1994. The step-mountain eta coordinate model: further devel-opments of the convection, viscous sublayer and turbulence closure schemes. Mon. Wea. Rev., 122, 927-45.
Kain, J.S. and Fritsch, J.M. 1990. A one-dimensional entraining / detrain-ing plume model and its application in convective parameterization. J. Atmos. Sci., 47, 2784-2802.
Kain, J.S. and Fritsch, J.M. 1993. Convective parametrization for meso-scale models: The Kain-Fritsch scheme. The representation of cumu-lus convection in numerical models, K.A. Emanuel and D.J. Raymond, Eds., Amer. Meteor. Soc., 246 pp.
Lin, Y-L, Farley, R.D. and Orville, H.D. 1983. Bulk parameterization of the snow field in a cloud model. J. Clim. Appl. Meteor., 22, 1065-92.
Luke, R.H. and McArthur A.G. 1978. Bushfires in Australia. Australian Government Publishing Service, Canberra, Australia. 359pp.
McArthur, A.G. 1967: Fire behaviour in eucalypt forests. Comm. Aust. For. Timb. Bur. Leaflet No. 107., 107, 25pp.
Mills, G.A., 2008a. Abrupt surface drying and fire weather. Part 1: over-view and case study of the South Australian fires of 11 January 2005. Aust. Meteorol. Mag. 57, 299-309.
Mills, G.A. 2008b. Abrupt surface drying and fire weather. Part 2: a pre-liminary synoptic climatology in the forested areas of southern Aus-tralia. Aust. Meteorol. Mag. 57, 311-28.
Mlawer, E.J., Taubman S.J., Brown P.D., Iacono M.J. and Clough S.A. 1997. Radiative transfer for inhomogeneous atmosphere: RRTM, a validated correlated-k model for the longwave. J. Geophys. Res. 102 (D14), 16663-82.
Noble I.R., Bary G.A.V. and Gill A.M. 1980. McArthur’s fire-danger meters expressed as equations. Aust. J. Ecol. 5, 201-3.
Pierrehumbert, R.T. and Wyman B. 1985. Upstream Effects of Mesoscale Mountains. J. Atmos. Sci., 42, 977-1003.
Puri K., Dietachmeyer G.S., Mills G.A., Davidson N.E., Bowen R.A. and Logan L.W. 1998. The new BMRC Limited Area Prediction System, LAPS. Aust. Meteorol. Mag., 47, 203-23.
Scorer, R.S. 1949. Theory of waves in the lee of mountains. Q. J. R. Meteorol. Soc., 75, 41-56.
Sharples, J.J. 2009. An overview of mountain meteorological effects rele-vant to fire behaviour and bushfire risk. Int. J. Wildland Fire, 18, 737-54.
Sharples, J.J., Mills, G.A., McRae, R.H.D., and Weber, R.O. 2010. Foehn-like winds and elevated fire danger conditions in southeastern Austra-lia. J. Appl. Meteorol. Clim., 49, 1067-95.
Skamarock, W. C., Klemp, J. B., Dudhia, J., Gill, D. O., Barker, D. M., Duda, M., Huang, X.-Y., Wang, W. and Powers, J. G. 2008. A Description of the Advanced Research WRF Version 3. Available from: http://www.wrf-model.org/wrfadmin/publications.php.
Smith, R.B. 1989. Hydrostatic airflow over mountains, Advances in Geo-physics, 31, 1-41, Academic Press, New York.
Smolarkiewicz, P.K. and Rotunno, R. 1989. Low Froude number flow past three-dimensional obstacles. Part I: Baroclinically generated lee vorti-ces. J. Atmos. Sci., 46, 1154-64.
VBRC, 2010. 2009 Victorian Bushfires Royal Commission, VBRC Final Re-port Recommendations. Available from http://www.royalcommission.vic.gov.au/Home
Watson, C. and Lane, T.P. 2012. Sensitivities of orographic precipitation to terrain geometry and upstream conditions in idealized simulations. J. Atmos. Sci., 69, 1208-31.