Page 1
University of Connecticut University of Connecticut
OpenCommons@UConn OpenCommons@UConn
Honors Scholar Theses Honors Scholar Program
Spring 5-1-2021
Meta-Network Analysis of Complex Construction Systems: Meta-Network Analysis of Complex Construction Systems:
Improving Project Efficiency Using Novel Computer-Based Improving Project Efficiency Using Novel Computer-Based
Analytic Methodology Analytic Methodology
Ethan Cummiskey [email protected]
Follow this and additional works at: https://opencommons.uconn.edu/srhonors_theses
Part of the Civil Engineering Commons, and the Construction Engineering and Management
Commons
Recommended Citation Recommended Citation Cummiskey, Ethan, "Meta-Network Analysis of Complex Construction Systems: Improving Project Efficiency Using Novel Computer-Based Analytic Methodology" (2021). Honors Scholar Theses. 785. https://opencommons.uconn.edu/srhonors_theses/785
Page 2
1
Meta-Network Analysis of Complex Construction Systems:
Improving Project Efficiency Using Novel Computer-Based
Analytic Methodology
Ethan Cummiskey
Page 3
2
Abstract
The objective of this study is to build upon the framework of a meta-network approach to assessing
vulnerabilities in construction projects. By viewing these complex environments as configurations
of various nodes and links, it is possible to show the relationship between each entity in the project
and the overall completion that is achieved from these connections. To expand upon previous
studies, the vulnerabilities measured from this approach will be used to optimize the current
network to eliminate any shortcoming in the project model. By investigating the congruence of
different agents on the project, resources and informational nodes can be supplied through different
project simulations to increase project completion by eliminating any potential vulnerabilities. The
application of this optimization is shown through a case study related to an excavation project of
the University of Connecticut’s Athletic District Development Project. This framework is applied
to the dynamic interactions of this study and used to reduce any uncertainty that stems from
inefficient resource distribution throughout the project. The application of this optimization model
creates a useful tool for the construction management industry to plan projects and eliminate
potential errors in scheduling and resource distribution from the earliest stages of a project’s life
cycle.
Page 4
3
Table of Contents
Abstract ........................................................................................................................................... 2
Table of Contents ............................................................................................................................ 3
1. Introduction: ................................................................................................................................ 4
2. Abstraction of Meta-Network ..................................................................................................... 5
3. Conceptual Framework ............................................................................................................... 6
4. Methodology ............................................................................................................................... 6
4.1 Data Collection ...................................................................................................................... 7
4.2 Pre-processing ....................................................................................................................... 7
4.3 Meta network Development .................................................................................................. 7
4.3.1 ORA Network Software ................................................................................................. 7
4.3.2. MATLAB Software ....................................................................................................... 8
5. Data Analysis ............................................................................................................................ 10
5. Findings..................................................................................................................................... 11
5.1. Meta-Network Knowledge Congruence ......................................................................... 11
5.2. Meta-Network Resource Congruence ............................................................................ 13
5.3. Meta-Network Power and Workload Congruence ......................................................... 14
5.4. MATLAB Model Testing ............................................................................................... 15
5.5. Case Study: Simulation Network ....................................................................................... 19
5.5.1. Model Formulation ...................................................................................................... 19
5.5.2. Simulation Model Knowledge Congruence ................................................................ 19
5.5.3. Simulation Model Resource Congruence .................................................................... 20
5.5.4. Simulation Model Power and Workload Congruence ................................................. 21
6. Discussions ............................................................................................................................... 21
7. Research Limitations ............................................................................................................... 23
8. Conclusion ................................................................................................................................ 25
9. Acknowledgements ................................................................................................................... 25
References: .................................................................................................................................... 26
Page 5
4
1. Introduction:
Construction projects are complex systems with hundreds of consecutive moving parts that all rely
on direct communication and resource allocation. It is very difficult to stay under budget and ahead
of schedule with the amount of work that is required to be completed. According to a 2016 study
conducted by the consulting firm McKinsey & Company, about 80% of completed construction
projects finish over budget, and take 20% longer than originally scheduled (Callinan, 2018). This
is because there are many unintended circumstances (e.g. incorrect resource distributions from
construction deliveries, insufficient labor forces for certain tasks due to the misinformation about
the scope of work, or scheduling errors from the progression of a project in the wake of earlier
delays) that can result from the unequal distribution of available resources. Many of the existing
studies do not capture the dynamic interaction and interdependencies between various entities in
the assessment of performance or highlight the individual vulnerabilities that appear in a
construction project (Zhu et al., 2016). This lack of relevant studies leads to the improper
assessment of a project’s budget and resource allocation.
Due to the inability of data and techniques in typical cost estimating methods, it is
important to refine the method of quantifying projects in the planning stages (El-sawalhi &
Shehatto, 2016). The on-site planning issues discussed above can be avoided with proper planning
and a good understanding of each job that needs to be completed. Highlighting specific
vulnerabilities using a meta-network structure in a project’s plan will serve to solve any scheduling
issues that would arise in later stages of the project. By spending more time on the preconstruction
process before going to site, a project’s budget is better defined with less room for error throughout
the entire project duration (Zhu et al., 2016). To capture the complexity and provide key insights
into the inter-dependencies of different construction project related factors, this study has
examined construction projects as a meta-network. Meta-networks are “complex systems
composed of interconnected human agents, information, resources, and tasks” (Zhu et al., 2016).
Each network uses a linking system to connect the individual nodes and show the respective
interaction between them (Zhu et al., 2016).
Studies investigating the performance capabilities of construction projects through
advanced planning strategies are often limiting. Most studies analyze costs in construction projects
using a network structure that quantifies the use of resources in a project through architectural
factors or the costs of certain elements on previous projects (e.g. El-sawalhi & Shehatto, 2016;
Emsley et al., 2002). Though these studies mentioned above created a better idea of
conceptualizing each section of a project, there is no change that is made to optimize a project
during the planning stage. Even in current studies that specialize in the creation of meta-networks
to highlight specific vulnerabilities in a project (e.g. Zhu et al. 2016), there are no attempts in a
strategy that eliminates these vulnerabilities. These complex construction projects contain several
levels of uncertainty due to the variability of the project environment on a day-to-day basis. Project
vulnerability is shown through the interaction of different entities on a project, while the planning
process in these environments seeks to eliminate these shortcomings. Because a framework of
predictive assessment has been developed from previous studies to show these dynamic
interactions (e.g. Zhu et al., 2016), there is opportunity to build upon this model and add
optimization strategies that add further security to this approach in the early planning stages of a
construction project.
To build upon the current model which emphasizes the importance of construction
vulnerability, optimization of the project structure based on these vulnerabilities is the next step to
Page 6
5
continue to analyze this framework. This study will employ a similar use of meta-networks to
highlight a project’s deficiencies as per Zhu et al., 2016 and apply the missing component of
making efficient changes to this model as a result. These changes are a critical aspect of the
development of this planning method and will shift this analysis method into a functional tool that
can be applied from within construction management firms. Having an effective method to remove
vulnerabilities from a project will reduce the potential for any scheduling or budgeting errors
discussed above that could increase the overall costs of the project. This proposed tool will convert
project vulnerability identification into a project optimization that shows its deficiencies and allow
for changes to be tested in the early planning stages of the project.
2. Abstraction of Meta-Network
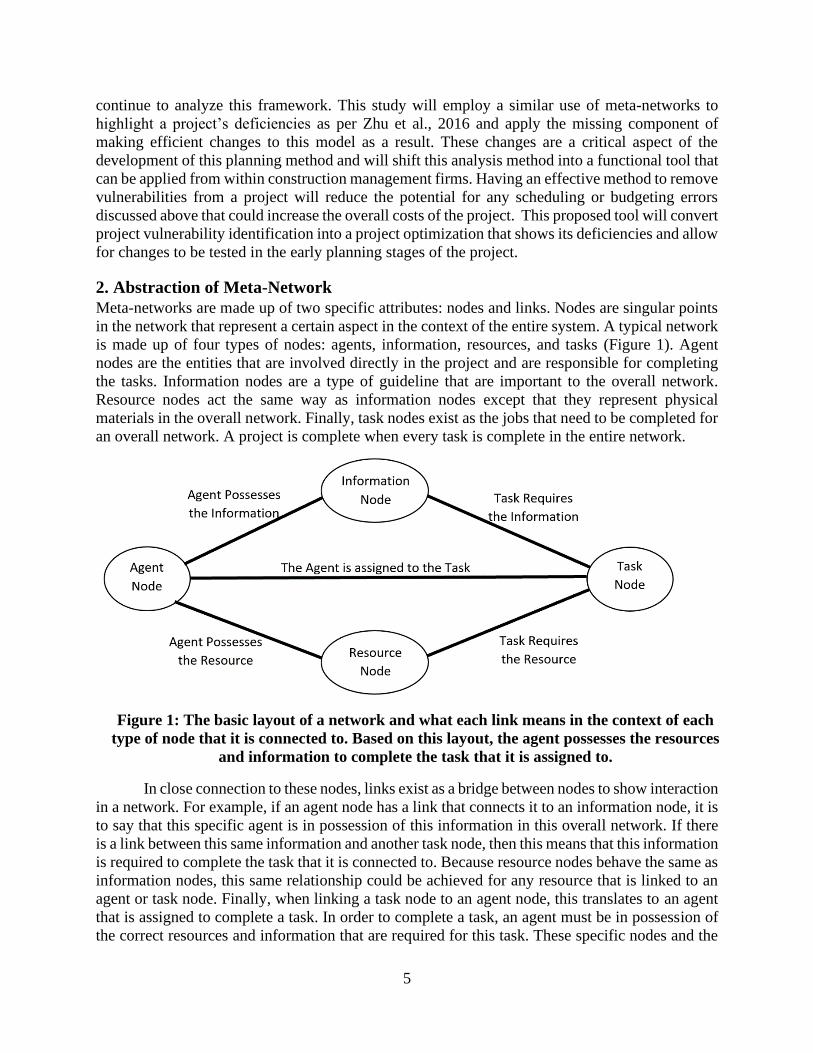
Meta-networks are made up of two specific attributes: nodes and links. Nodes are singular points
in the network that represent a certain aspect in the context of the entire system. A typical network
is made up of four types of nodes: agents, information, resources, and tasks (Figure 1). Agent
nodes are the entities that are involved directly in the project and are responsible for completing
the tasks. Information nodes are a type of guideline that are important to the overall network.
Resource nodes act the same way as information nodes except that they represent physical
materials in the overall network. Finally, task nodes exist as the jobs that need to be completed for
an overall network. A project is complete when every task is complete in the entire network.
In close connection to these nodes, links exist as a bridge between nodes to show interaction
in a network. For example, if an agent node has a link that connects it to an information node, it is
to say that this specific agent is in possession of this information in this overall network. If there
is a link between this same information and another task node, then this means that this information
is required to complete the task that it is connected to. Because resource nodes behave the same as
information nodes, this same relationship could be achieved for any resource that is linked to an
agent or task node. Finally, when linking a task node to an agent node, this translates to an agent
that is assigned to complete a task. In order to complete a task, an agent must be in possession of
the correct resources and information that are required for this task. These specific nodes and the
Figure 1: The basic layout of a network and what each link means in the context of each
type of node that it is connected to. Based on this layout, the agent possesses the resources
and information to complete the task that it is assigned to.
Page 7
6
links between them can be integrated into any project to perform a meta-network analysis. By
combining all the nodes of each type, a nodeset can be created which is the culmination of each
node type in a collective group. These nodesets are used to be compared to each other in the actual
meta-network analysis in which each individual node of one type is compared to each node in the
nodesets of other types. A basic example of a small network is seen below in which each node can
be readily seen as well as the links that are used to relate each type of node together.
3. Conceptual Framework
In a construction project, the interactions among different types of nodes can be shown in several
different types of relationships. This direct translation can be seen by first analyzing the context of
the four node types in a construction project. An agent node is a member of the project that will
be hired by the management company to complete the project, such as the general contractor, or a
more specialized role of an excavator operator. An information node is a document that is
important to the development of the project. This can be seen in documents such as the
architectural plans or the general site codes that may be required for a certain part of the project.
Resource nodes are similar rationalized in this regard except they are more physical than the
previously mentioned informational nodes. Resource nodes are equipment and material on a
construction site, ranging from an excavator itself, or pipes that could be necessary for a plumbing
task. Finally, a task node in the context of a construction network is an objective of the construction
project that must be completed, such as the construction of a piping system.
In addition to this analysis, the interconnected relationships of the nodes from the use of
links must be considered in the context of a construction network as well. First and foremost agent-
information relationship is viewed to be the information that a worker has in their job on site, such
as a pipe installer possessing the septic plan of the site. Similarly, an agent-resource interaction
applies a similar reasoning but with a physical resource being possessed (e.g. the pipe installer
possessing pipes and fill material). This relationship reverses when considering a task-information
relationship on site. This connection refers to the informational requirements for an objective on
the construction site, such as a soil bearing report (the information) being required to install the
foundation of a structure (the task). This is once again applied with a similar logic to a resource-
task link in which a certain material or piece of construction equipment is required for a task on-
site (an excavator is necessary for the digging of pipe trenches). The most important interaction in
this model is the agent-task link that signifies the workers that are assigned to the specific
construction task. This is what connects the information and resources that are possessed by the
agents, to the specific requirements in each task. When a pipe installer is assigned to the
construction task of installing a septic system, the goal is for this agent to possess the resources
and information necessary to complete this task. Any task that is not fulfilled through the resources
and information provided by one or several agents, will be a vulnerability in the model. This logic
can be applied to the entire network to show the efficiency of the entire project and highlight any
deficiencies in the current model.
4. Methodology
The methodology proposed in this study primarily included three steps: (1) Data Collection, (2)
Pre-processing and (3) Meta-network development. Details of these steps are provided below.
Page 8
7
4.1 Data Collection
Data was collected from the Volume 4 of the University of Connecticut Athletic District
Development Project as prepared by Newman Architects, PC (Newman Architects, 2019). This
volume of the project’s specifications focuses on the earthwork, exterior improvements, and
utilities work that must be completed. It covers a range of tasks that control the scope of the project,
from rock excavation and site clearing to granite curbing and storm utility drainage piping.
Each section has a list of tasks, each with parameters of what must be accomplished with
guidelines that each task must conform to. The entire volume begins by establishing the required
information that is necessary for the section’s task, including the geotechnical codes used, the state
building codes required, and the necessary site information that was gathered for construction.
Furthermore, the agents that are involved in this volume are mentioned as well to show the scope
of people that will be involved with the project. Following this, the document is broken up by task
that is required for the project. From within these specific sections, the scope of work is shown in
form of a list of requirements for each task, complete with directions of what resources will be
used and who will be involved. From here, it is possible to categorize each task, agent, information,
and resource and group them to form the model that will be used for this analysis. These provisions
contain all of the information necessary to construct this model and serve as an accurate
representation of the work that is required for this project. Due to the layout of these specifications,
it is possible to recreate this analysis with any other volume of the project and create a meta-
network that shows the full scope of work.
4.2 Pre-processing
Pre-processing was conducted to reduce computational complexity and errors in the subsequent
meta-network development step. Whenever there was a task that appeared multiple times
throughout the document, it is only represented as a single task, and not represented twice as it
appears in the construction documents. For example, the “trench excavation” task appears several
times throughout the construction document with regards to the requirements for each trench and
the resources necessary for construction. In order to reduce complexity, trench excavation was
considered a singular task, but as more sections mention certain nuances of construction regarding
this task, the quantity of required information and material resources were increased. This will
allow the meta-network outputs to show the broader base of requirements that are needed to
complete a single, albeit more involved, task in the scope of the project.
4.3 Meta network Development
4.3.1 ORA Network Software
To accomplish the analysis of a construction model, the meta-network software ORA is used. This
software was created in a joint venture between the CASOS Center at Carnegie Mellon University
and Netanomics in order to rationalize these networks and provide analytical data (Altman et al.,
2019).
From each nodeset, a network can be created based on the interaction of two different sets
of data represented through a matrix structure, with one nodeset representing the rows of the matrix
while the other represents the column structure. For the interaction of agents and information
nodesets in an ORA Matrix, there is a row for each agent in the project, and a column for each
piece of information available in the project. In each cell of the matrix, there is a value that can be
changed to represent if the respective agent node and infomation node are related. If the
corresponding value is 1, the respective agent node possesses that specific information, and if the
Page 9
8
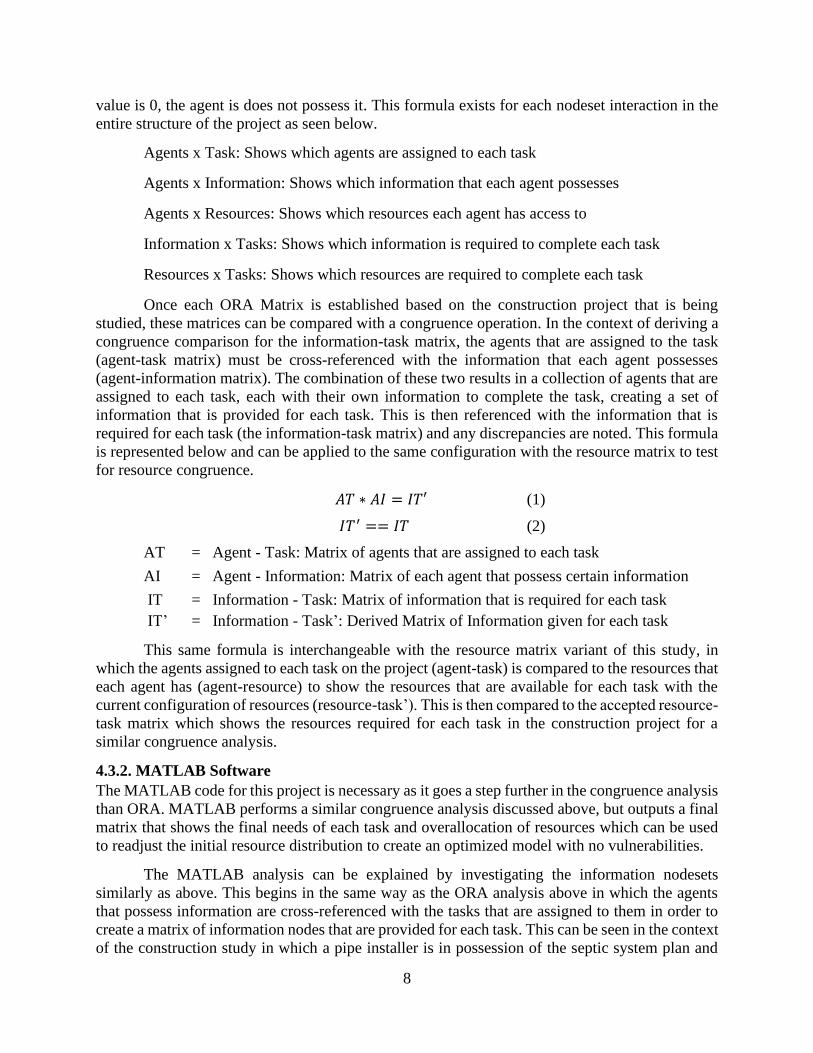
value is 0, the agent is does not possess it. This formula exists for each nodeset interaction in the
entire structure of the project as seen below.
Agents x Task: Shows which agents are assigned to each task
Agents x Information: Shows which information that each agent possesses
Agents x Resources: Shows which resources each agent has access to
Information x Tasks: Shows which information is required to complete each task
Resources x Tasks: Shows which resources are required to complete each task
Once each ORA Matrix is established based on the construction project that is being
studied, these matrices can be compared with a congruence operation. In the context of deriving a
congruence comparison for the information-task matrix, the agents that are assigned to the task
(agent-task matrix) must be cross-referenced with the information that each agent possesses
(agent-information matrix). The combination of these two results in a collection of agents that are
assigned to each task, each with their own information to complete the task, creating a set of
information that is provided for each task. This is then referenced with the information that is
required for each task (the information-task matrix) and any discrepancies are noted. This formula
is represented below and can be applied to the same configuration with the resource matrix to test
for resource congruence.
𝐴𝑇 ∗ 𝐴𝐼 = 𝐼𝑇′ (1)
𝐼𝑇′ == 𝐼𝑇 (2)
AT = Agent - Task: Matrix of agents that are assigned to each task
AI = Agent - Information: Matrix of each agent that possess certain information
IT = Information - Task: Matrix of information that is required for each task
IT’ = Information - Task’: Derived Matrix of Information given for each task
This same formula is interchangeable with the resource matrix variant of this study, in
which the agents assigned to each task on the project (agent-task) is compared to the resources that
each agent has (agent-resource) to show the resources that are available for each task with the
current configuration of resources (resource-task’). This is then compared to the accepted resource-
task matrix which shows the resources required for each task in the construction project for a
similar congruence analysis.
4.3.2. MATLAB Software
The MATLAB code for this project is necessary as it goes a step further in the congruence analysis
than ORA. MATLAB performs a similar congruence analysis discussed above, but outputs a final
matrix that shows the final needs of each task and overallocation of resources which can be used
to readjust the initial resource distribution to create an optimized model with no vulnerabilities.
The MATLAB analysis can be explained by investigating the information nodesets
similarly as above. This begins in the same way as the ORA analysis above in which the agents
that possess information are cross-referenced with the tasks that are assigned to them in order to
create a matrix of information nodes that are provided for each task. This can be seen in the context
of the construction study in which a pipe installer is in possession of the septic system plan and
Page 10
9
the site grading plan, both of which are information nodes. The pipe installer would be checked to
see if it is assigned to complete a task such as installing pipes on site for this project. Because the
pipe installer possesses these information nodes, it is considered that the installing pipes task now
has these information nodes at its disposal to complete it.
Following this step, the task that has the information nodes supplied to it through the agent-
task relationship is then compared to the required information nodes for that task. Once the
required matrix is subtracted from the required matrix, it is possible to see which exact
informational nodes for the task are underequipped over overequipped. In the context of the pipe
installing example, because both the septic system plan and site grading plan are necessary for the
pipe installation task to be completed, when these two matrices are subtracted from each other,
there would be no remainder in the final matrix. A similar conceptual example of this relationship
can be seen below in Figure 2, where two agents are assigned to complete task 1, and their
collective information possession is able to complete the task:
The resulting MATLAB matrix is the basis that is used to compare the efficiency of each
task and eventually make changes to the overall model. In this final matrix, any value of -1 in a
task column states that there is an information node, corresponding to the specific row that is not
supplied to this task. If there is a value of 0 in the column, all needs are settled for the specific
information node in the context of this task. When there is a positive number in the task column,
this means that there is more than one instance of the informational node being applied to that
specific task, due to multiple agents possessing the same informational node, and also being
assigned to this specific task.
While testing the congruence of each nodeset in the construction project, it is also worth
running different simulations and again measuring the entire network. A simulation is a change
that is made to the model to see the effect of this on the meta-network. An example of this could
be altering the model to remove any information or research need for a project and using the ORA
analysis to show how this affects the rest of the data. This idea is important for the model as it
shows how alterations can be made to make the entire project more efficient. By showing the
changes that can be made, in a further stage the overall cost or schedule could be examined as well
Figure 2: A visual example of the MATLAB code as seen in a small network of six
agents and three types of information. Only the first operation for the first task
column is shown.
Page 11
10
to show the effect this has on the logistics of the project. Simulations are useful to test different
ideas and “what if” scenarios that develop a deeper understanding of the model.
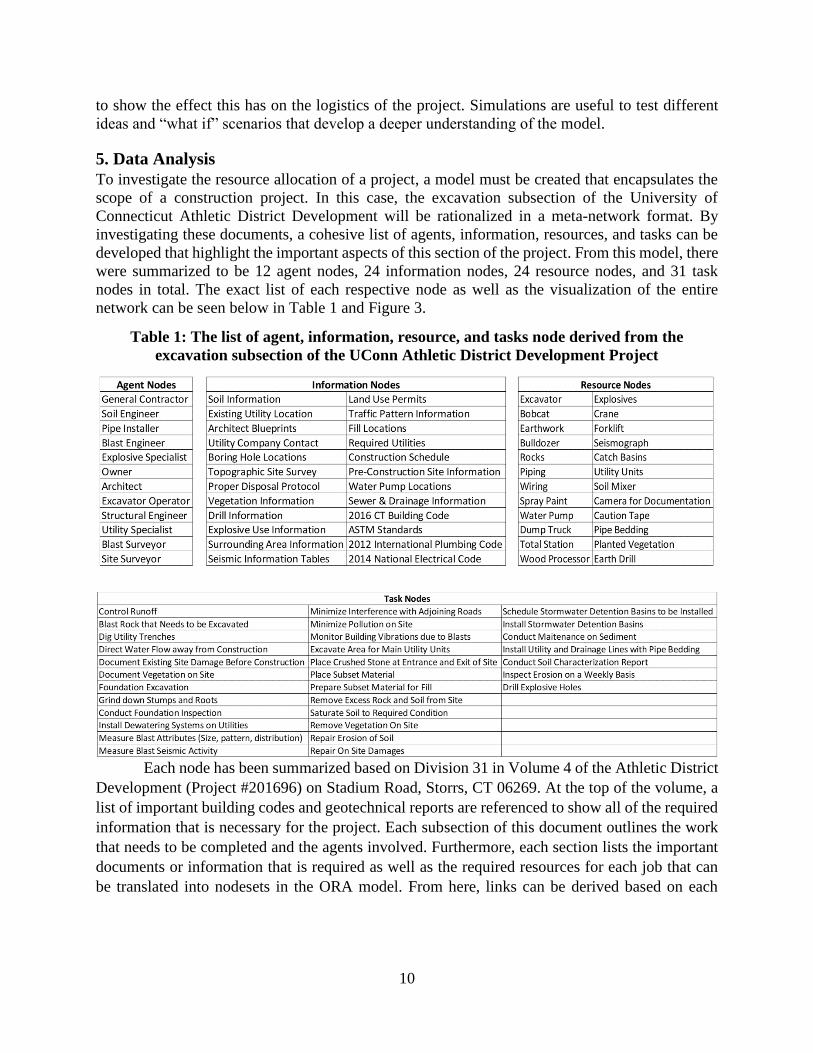
5. Data Analysis
To investigate the resource allocation of a project, a model must be created that encapsulates the
scope of a construction project. In this case, the excavation subsection of the University of
Connecticut Athletic District Development will be rationalized in a meta-network format. By
investigating these documents, a cohesive list of agents, information, resources, and tasks can be
developed that highlight the important aspects of this section of the project. From this model, there
were summarized to be 12 agent nodes, 24 information nodes, 24 resource nodes, and 31 task
nodes in total. The exact list of each respective node as well as the visualization of the entire
network can be seen below in Table 1 and Figure 3.
Table 1: The list of agent, information, resource, and tasks node derived from the
excavation subsection of the UConn Athletic District Development Project
Each node has been summarized based on Division 31 in Volume 4 of the Athletic District
Development (Project #201696) on Stadium Road, Storrs, CT 06269. At the top of the volume, a
list of important building codes and geotechnical reports are referenced to show all of the required
information that is necessary for the project. Each subsection of this document outlines the work
that needs to be completed and the agents involved. Furthermore, each section lists the important
documents or information that is required as well as the required resources for each job that can
be translated into nodesets in the ORA model. From here, links can be derived based on each
Page 12
11
node’s interaction with each other in the construction documents. These documents and its
interpretation give way to the resulting analysis in the next section.
5. Findings
5.1. Meta-Network Knowledge Congruence
When using ORA to analyze all these networks on a meta-network level analysis, there are many
comparisons that can be made to show the needs of certain tasks in terms of information or
resources. When examining knowledge requirements, the table of task-information needs is
investigated as seen in Table 2.
Table 2: The top 10 tasks that lack the information nodes to be completed based on
congruence.
Rank Tasks Congruence Value
1 Saturate Soil to Required Condition 0.500
2 Grind Down Stumps and Roots 0.400
3 Blast Rock that Needs to be Excavated 0.385
4 Direct Water Flow away from Construction 0.286
5 Remove Vegetation on Site 0.200
6 Measure Blast Attributes (Size, pattern, etc.) 0.167
7 Prepare Subset Material for Fill 0.167
8 Dig Utility Trenches 0.133
9 Install Stormwater Detention Basins 0.125
10 Place Subset Material 0.125
Figure 3: The visualization of the total construction meta-network with all available
links
Page 13
12
This metric shows the calculation of the amount of knowledge nodes that are lacking over the total
knowledge required for the task. In this table, there are five tasks that are more than one standard
deviation above the mean for knowledge (as seen in the red text) that is not supplied to a task, such
as “Saturate Soil to Required Condition” and “Grind down Stumps and Roots”. Though these
possess the highest values, this is because the task is so simple, it is only missing one knowledge
node out of the two it requires, making it seem like it is at a severe knowledge deficit. On the other
hand, tasks such as “Blast Rock that Needs to be Excavated” is more complex and this high value
of need means that there are several nodes missing. Upon further investigation, this task is missing
the “existing utility location” information node as well as the “land use permit” information which
means that both the blast engineer and explosive specialist agents will have to be informed of the
specific land use that is available and the existing location of the utilities before blasting the rock.
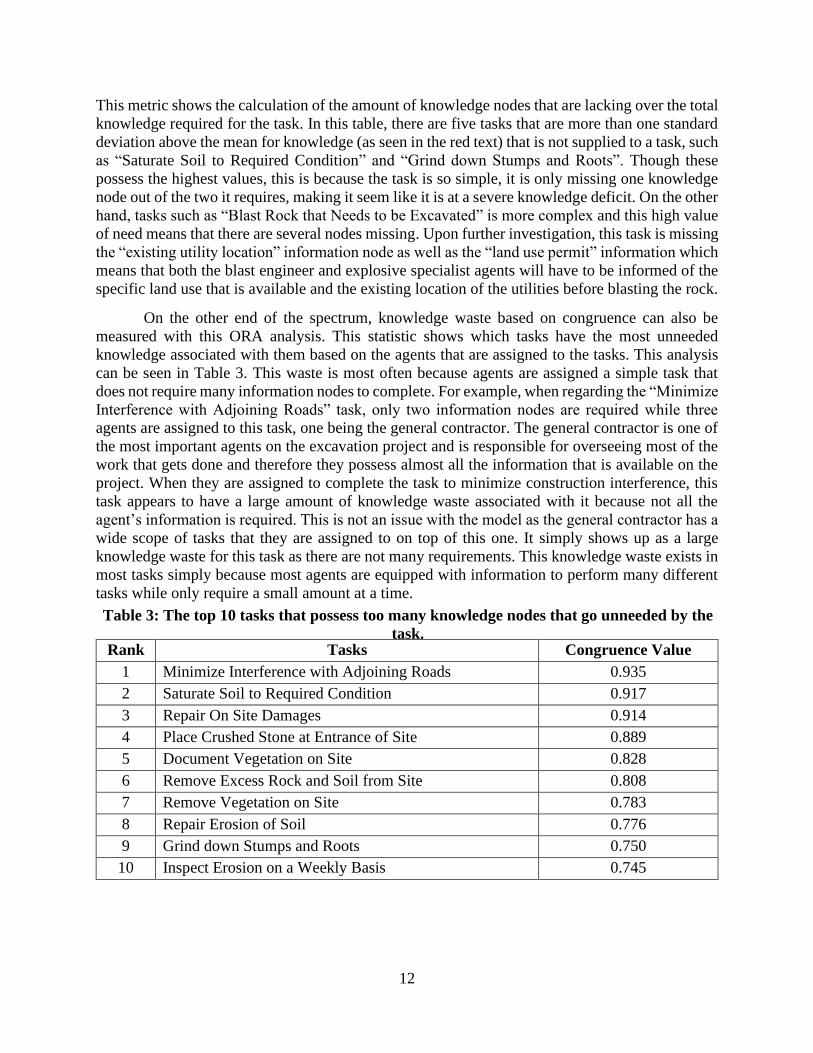
On the other end of the spectrum, knowledge waste based on congruence can also be
measured with this ORA analysis. This statistic shows which tasks have the most unneeded
knowledge associated with them based on the agents that are assigned to the tasks. This analysis
can be seen in Table 3. This waste is most often because agents are assigned a simple task that
does not require many information nodes to complete. For example, when regarding the “Minimize
Interference with Adjoining Roads” task, only two information nodes are required while three
agents are assigned to this task, one being the general contractor. The general contractor is one of
the most important agents on the excavation project and is responsible for overseeing most of the
work that gets done and therefore they possess almost all the information that is available on the
project. When they are assigned to complete the task to minimize construction interference, this
task appears to have a large amount of knowledge waste associated with it because not all the
agent’s information is required. This is not an issue with the model as the general contractor has a
wide scope of tasks that they are assigned to on top of this one. It simply shows up as a large
knowledge waste for this task as there are not many requirements. This knowledge waste exists in
most tasks simply because most agents are equipped with information to perform many different
tasks while only require a small amount at a time.
Rank Tasks Congruence Value
1 Minimize Interference with Adjoining Roads 0.935
2 Saturate Soil to Required Condition 0.917
3 Repair On Site Damages 0.914
4 Place Crushed Stone at Entrance of Site 0.889
5 Document Vegetation on Site 0.828
6 Remove Excess Rock and Soil from Site 0.808
7 Remove Vegetation on Site 0.783
8 Repair Erosion of Soil 0.776
9 Grind down Stumps and Roots 0.750
10 Inspect Erosion on a Weekly Basis 0.745
Table 3: The top 10 tasks that possess too many knowledge nodes that go unneeded by the
task.
Page 14
13
5.2. Meta-Network Resource Congruence
Congruence can also be used to examine the resource needs of each task based on the agents that
are assigned to it. This concept behaves the same way that the information needs do in which the
agent x resource network (AR) is multiplied by the agent x task network (AT) to receive a new
version of the resource x task network (RT’). This new network which was derived is compared
to the actual resource x task network (RT) and any discrepancies where resources are required in
RT but not provided by RT’ are provided as data towards the resource needs section of the analysis.
This data can be seen in Table 4 below:
Rank Tasks Congruence Value
1 Place Crushed Stone at Entrance of Site 1
2 Place Subset Material 0.800
3 Document Vegetation on Site 0.500
4 Minimize Pollution on Site 0.500
5 Remove Vegetation On Site 0.500
6 Control Runoff 0.400
7 Direct Water Flow away from Construction 0.333
8 Minimize Interference with Adjoining Roads 0.333
9 Schedule Stormwater Detention Basins to be Installed 0.333
10 Blast Rock that Needs to be Excavated 0.286
Based on this data, the top task in this table is not provided any of the resources that are required
to complete it because it has a value of 1. This is because in this case study, there is no direct
reference to the process of moving any stone to the entrance and exit of the site, just the task that
this must be completed. Therefore, it is a shortcoming of the model that there is no agent in charge
of a soil mover such as a dump truck or scraper. Most sites, including this one, would have one
and this process would not be missing these resources. The only agent assigned to this task is the
excavator operator which can acquire the rocks and soil to move but does not have the potential to
shift a large quantity over a long distance at the risk of being too unproductive. Similar to the task
information waste highlighted before, the task resource waste can also be cataloged based on the
congruence of each nodeset. This is shown in Table 5.
Rank Tasks Congruence Value
1 Place Crushed Stone at Entrance of Site 1
2 Minimize Pollution on Site 0.966
3 Measure Blast Seismic Activity 0.964
4 Monitor Building Vibrations due to Blasts 0.964
5 Measure Blast Attributes (Size, pattern, etc.) 0.960
6 Place Subset Material 0.917
7 Remove Excess Rock and Soil from Site 0.879
Table 4: The top 10 tasks that lack the resource nodes to be completed.
Table 5: The top 10 tasks that possess the most unneeded resources
Page 15
14
8 Grind down Stumps and Roots 0.867
9 Saturate Soil to Required Condition 0.867
10 Control Runoff 0.865
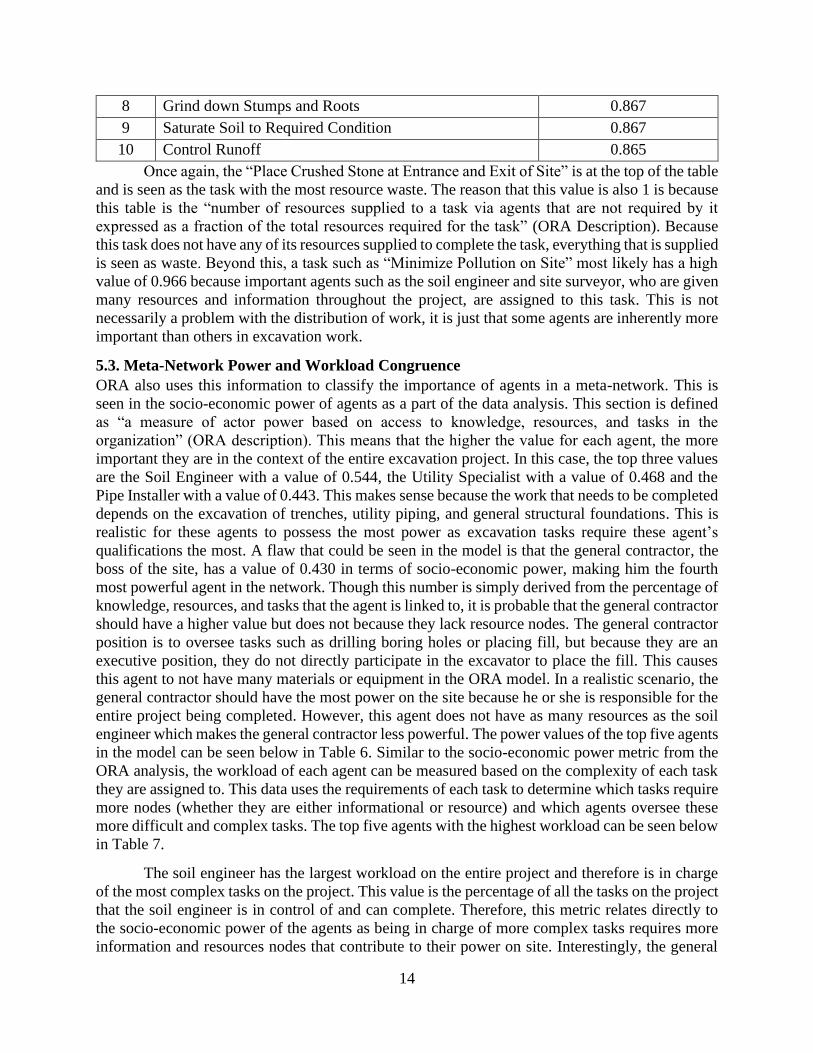
Once again, the “Place Crushed Stone at Entrance and Exit of Site” is at the top of the table
and is seen as the task with the most resource waste. The reason that this value is also 1 is because
this table is the “number of resources supplied to a task via agents that are not required by it
expressed as a fraction of the total resources required for the task” (ORA Description). Because
this task does not have any of its resources supplied to complete the task, everything that is supplied
is seen as waste. Beyond this, a task such as “Minimize Pollution on Site” most likely has a high
value of 0.966 because important agents such as the soil engineer and site surveyor, who are given
many resources and information throughout the project, are assigned to this task. This is not
necessarily a problem with the distribution of work, it is just that some agents are inherently more
important than others in excavation work.
5.3. Meta-Network Power and Workload Congruence
ORA also uses this information to classify the importance of agents in a meta-network. This is
seen in the socio-economic power of agents as a part of the data analysis. This section is defined
as “a measure of actor power based on access to knowledge, resources, and tasks in the
organization” (ORA description). This means that the higher the value for each agent, the more
important they are in the context of the entire excavation project. In this case, the top three values
are the Soil Engineer with a value of 0.544, the Utility Specialist with a value of 0.468 and the
Pipe Installer with a value of 0.443. This makes sense because the work that needs to be completed
depends on the excavation of trenches, utility piping, and general structural foundations. This is
realistic for these agents to possess the most power as excavation tasks require these agent’s
qualifications the most. A flaw that could be seen in the model is that the general contractor, the
boss of the site, has a value of 0.430 in terms of socio-economic power, making him the fourth
most powerful agent in the network. Though this number is simply derived from the percentage of
knowledge, resources, and tasks that the agent is linked to, it is probable that the general contractor
should have a higher value but does not because they lack resource nodes. The general contractor
position is to oversee tasks such as drilling boring holes or placing fill, but because they are an
executive position, they do not directly participate in the excavator to place the fill. This causes
this agent to not have many materials or equipment in the ORA model. In a realistic scenario, the
general contractor should have the most power on the site because he or she is responsible for the
entire project being completed. However, this agent does not have as many resources as the soil
engineer which makes the general contractor less powerful. The power values of the top five agents
in the model can be seen below in Table 6. Similar to the socio-economic power metric from the
ORA analysis, the workload of each agent can be measured based on the complexity of each task
they are assigned to. This data uses the requirements of each task to determine which tasks require
more nodes (whether they are either informational or resource) and which agents oversee these
more difficult and complex tasks. The top five agents with the highest workload can be seen below
in Table 7.
The soil engineer has the largest workload on the entire project and therefore is in charge
of the most complex tasks on the project. This value is the percentage of all the tasks on the project
that the soil engineer is in control of and can complete. Therefore, this metric relates directly to
the socio-economic power of the agents as being in charge of more complex tasks requires more
information and resources nodes that contribute to their power on site. Interestingly, the general
Page 16
15
contractor is ranked number 7 in the actual workload of the project while being ranked number 4
in the socio-economic power. This is most likely because while the general contractor possesses
many information and resource nodes, of the complex tasks that they are assigned to complete,
they cannot complete them as they do not meet the requirements. This makes sense in the context
of the excavation construction project as the general contractor is meant as a supervisor that
possesses the information but not the physical resources to do the job, even if they have their hand
in many different tasks in the project.
Table 6: The 5 agents with the highest Socio-Economic power in the excavation model
Table 7: The five agents that have the highest workload on the entire project
Rank Agents Workload Value
1 Soil Engineer 0.380
2 Utility Specialist 0.277
3 Site Surveyor 0.225
4 Pipe Installer 0.202
5 Structural Engineer 0.170
5.4. MATLAB Model Testing
Beyond looking at the data from the ORA congruence reports alone, the MATLAB code is useful
in determining the specific information and resource needs and wastes for each task on the project.
By importing the matrices for each part of the network based on the various nodeset interactions,
two final matrices can be generated for the reported information and resource distribution of the
meta-network. Though congruence values show the under or over-allocation of various resources
for tasks on the project, MATLAB is able to highlight specific deficiencies using its matrix
structure. Each task can be connected to a value that represents the saturation level of that task and
shows specific sections of need or waster for the project. When a value in a task column is below
0, this means that there is not enough of information to complete a current task as it stands on the
project. These are the most critical sections of the MATLAB analysis as it representations
information or resources that are not provided. Any number above zero on the other hands
represents an excess in resources or information due to the agents that are assigned to this part of
the project. Based on the legend given above in the research methodology for the MATLAB code,
Tables 8 and 9 can be analyzed to find where the exact needs and wastes for each task can be
found.
Rank Agents Power Value (0-1)
1 Soil Engineer 0.544
2 Utility Specialist 0.468
3 Pipe Installer 0.443
4 General Contractor 0.430
5 Site Surveyor 0.418
Page 17
16
Tab
le 8: T
he In
form
atio
n x
Task
Tab
le that sh
ow
s wh
ich in
form
atio
n is d
eficient o
r in ex
cess for
each
task
Page 18
17
Tab
le 9: T
he R
esou
rce x T
ask
Tab
le that sh
ow
s wh
ich reso
urces a
re d
eficient o
r in ex
cess for ea
ch
task
Page 19
18
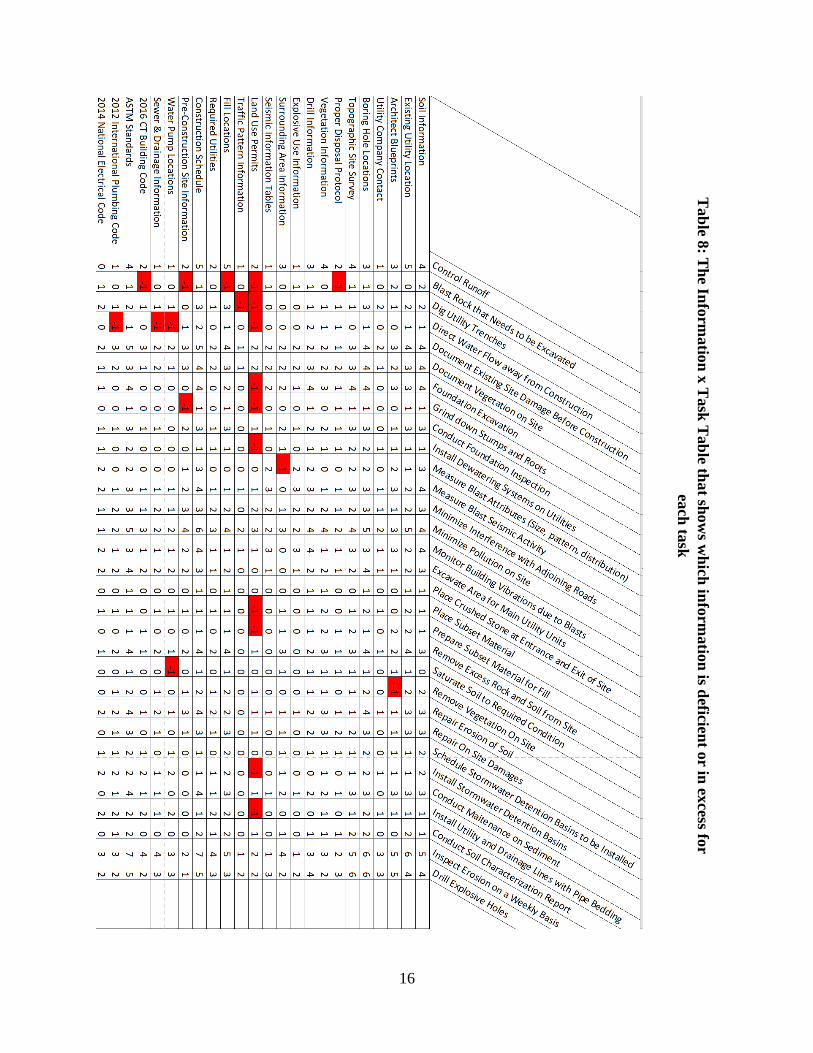
From these two tables, the values that are lacking in certain information are highlighted in
red to show the deficiencies more clearly. By using the data acquired from the MATLAB code in
Table 8, it is possible to see that exact nodes that are missing for the “Blast Rock that Needs to be
Excavated” task. In this case, 5 informational nodes are hindering the task from being completed.
This agrees with the ORA analysis that states that 38.5% of the required information nodes are
satisfied as 13 nodes are required to complete this task. By knowing which nodes are missing, the
deficiencies can be traced back to which agents are assigned to this task and see how these issues
can be addressed. This task could also be completed by assigning another agent to the task to fill
in these gaps. By showing what is missing from each task, the project’s issues can be highlighted
and addressed in a case-by-case basis.
This same type of analysis can be applied to the resource needs as the specific deficiencies
in each task can be seen using the MATLAB results. Once again, we can see the exact nodes that
are preventing each task from being completed based on the resource requirements. For example,
by examining the “Place Subset Material Task” in Table 9, there are four resource nodes that are
not met as a requirement for the task. Because the percentage of nodes that are needed for this task
as seen in Table 5 is 0.8, this means that only 1 out of the 5 requirements are met for this task.
Because there is a large percentage of resources that are unavailable for this task, it is most likely
worth it from a project perspective to introduce another agent that can contribute to the task. For
tasks that are missing a smaller number of resource requirements such as the “Repair Erosion of
Soil” task, because it is only missing one node to be completed, it would be easier to just assign
this resource to one of the agents that is already involved in the project. Making this determination
early on is beneficial to the entire project as the deficiencies can be measured in a pre-construction
phase so that time and budget is not wasted later when it would be more costly.
Beyond examining the information and resource nodes that are missing from each task
from the tables generated from MATLAB, it is also possible to notice when a certain node in a
task is oversaturated with resources or information. This could be useful in determining when an
agent might not even be required for a task at all if too many nodes are provided. As discussed
before, when a number in the MATLAB tables are greater than 0, this means that more than one
agent that is assigned to a task possess that certain information or resource node. Some of these
agents might not require these nodes and should be evaluated on a case-by-case basis. This can be
seen in the “Control Runoff” task in the resource requirements for each task in Table 9. The
“Caution Tape” resource has a value of 5 which means that at least 5 agents are assigned to the
task that possess this resource. The only way to see if this is a clear example of waste is to examine
the rest of the tasks in regard to caution tape. The mean of the caution tape value for all tasks is
3.16 which means that on average, there are at least 3 caution tapes in excess on each task. This
shows that this resource is oversaturated and should be reevaluated on who should possess this
resource. The optimal value in this chart is 0 as this means that the node that is required is either
satisfied the perfect amount by an agent or not provided at all if it is not required. By performing
this analysis with the different information and resource nodes that are distributed throughout the
project, costs can be cut by more efficiently controlling which agents will possess which nodes.
Page 20
19
5.5. Case Study: Simulation Network
The ORA and MATLAB results discussed above are the basis of the analysis that are completed
in previous studies (e.g. Zhu 2016). From these results, it is possible to create amendments to the
initial planning model through the ways of resource and information distribution in order to
eliminate vulnerabilities in the construction project. By reassessing each agent and providing them
with the required information and resource nodes for each task, these vulnerabilities will be closed,
and the project will be better planned in the earliest stages of the project’s timeline. In order to
show the results of this, simulation is conducted by modifying the current model derived from the
UConn Athletic District Development Project so that each agent possesses the required node
resources to accomplish the tasks. This will show the effectiveness of this study to eliminate
vulnerabilities in a project plan and propose a more organized project approach.
5.5.1. Model Formulation
Because each nodeset that was prepared based on UConn’s ADD Excavation Construction
Documents had need deficiencies in both the information and resource nodes, a simulation of the
model can be performed by erasing all the needs in the project and analyzing these results. This is
done by examining the nodes that are missing from each task based on Tables 8 & 9 and cross-
referencing them with the agents that are assigned to each task. From this point, each agent should
then be given the information and resources that are required to complete this task. This is then
repeated for every task that is lacking some node and preventing it from being completed.
Following this, a new analysis can be performed with ORA that show how the rest of the model is
affected.
5.5.2. Simulation Model Knowledge Congruence
The first metric to analyze from this simulation is the information waste in each task. Measuring
the needs is not required as it is a value of 0 for every task as everything is correctly fulfilled. The
10 tasks with the most informational waste can be seen below in Table 8:.
Rank Tasks Congruence Value
1 Minimize Interference with Adjoining Roads 0.929
2 Place Crushed Stone at Entrance of Site 0.889
3 Repair On-Site Damages 0.889
4 Saturate Soil to Required Condition 0.882
5 Document Vegetation on Site 0.853
6 Remove Excess Rock and Soil from Site 0.851
7 Repair Erosion of Soil 0.803
8 Inspect Erosion on a Weekly Basis 0.741
9 Remove Vegetation on Site 0.730
10 Document Existing Site Damage before Construction 0.716
The mean of all the tasks for the informational waste is now 0.639. This means that over
half the informational nodes that are assigned to each task are completely wasteful. The top task,
“Minimize Interference with Adjoining Roads” has a value of 0.929 which means that over 9/10ths
Table 6: The 10 tasks with the highest informational waste in the simulated model
Page 21
20
of the information given for this task is wasteful and does not contribute to the task. This means
that there are either too many inherent agents assigned to this task, or a certain agent that is
involved is also involved with many other tasks and therefore possesses many information nodes.
The latter option is more plausible as in this case, the general contractor is assigned to this task
and because this agent is involved with many tasks, he or she has then been assigned many more
informational nodes to eliminate the needs on the project. This then produces a large amount of
waste on simple tasks that might not require many nodes to begin with but have an important agent
assigned to it.
5.5.3. Simulation Model Resource Congruence
The resource wastes can also be analyzed in a similar way using the simulation. Once again, as all
the needs have been removed, every value for this section equals zero so the waste is the only
important metric worth investigating. The list of resource wastes for each task can be seen below
in Table 9.
Rank Tasks Congruence Value
1 Measure Blast Attributes (Size, pattern, etc.) 0.925
2 Measure Blast Seismic Activity 0.925
3 Monitor Building Vibrations due to Blasts 0.925
4 Remove Excess Rock and Soil from Site 0.894
5 Grind down Stumps and Roots 0.889
6 Saturate Soil to Required Condition 0.889
7 Document Vegetation on Site 0.883
8 Minimize Pollution on Site 0.859
9 Drill Explosive Holes 0.833
10 Document Existing Site Damage before Construction 0.818
Table 9 once again shows a very high percentage of values that show a high amount of
waste in each task. This is expected from this simulation as every agent now has the resources to
complete every task. This seems to be even higher than the informational wastes as the top 10
values do not drop below 80% which shows that the resources are even more distributed to each
agent. This does not make sense in the context of the construction problem as distributing resources
this way leaves many instances that do not make sense. For example, for there to be no needs on
the project in this method, agents such as the soil engineer or general contractor will have to be in
possession of the excavator or dump truck when in reality, these resources would only belong to
the drivers of these equipment. This shows that this method of simulation, though removing all the
waste, is not realistic as these resources would never be provided to these specific agents. A more
accurate way of removing waste therefore is to assign more agents to tasks, not distribute
information and resources more widely. This leads into the idea that the best way to remove needs
on a project is to better distribute the agents assigned to each task. Though this would increase the
workload per person, it would make for a more realistic worksite that can accomplish all of the
tasks without having an unrealistic assortment of resources per agent.
Table 7: The top 10 tasks with the most resource waste on the project
Page 22
21
5.5.4. Simulation Model Power and Workload Congruence
This uneven distribution of resources can be fully noticed when examining the socio-economic
power of each agent under this simulated excavation model. The power of each agent depends on
the amount of information, resource, and task nodes that they are in possession of in the ORA
model. The top agents with the most socio-economic power can be seen in Table 10. As seen
above, every single value for the top 10 agents seems to be relatively similar and within one
standard deviation of the mean of 0.481. The values are very close together as now that every agent
is in possession of so many more information and resource nodes, the lines are blurred of which
agent is more powerful than another. The order is roughly the same as the original model discussed
above, but every agent has at least 20% more power due to this addition. This is once again
unrealistic as a more accurate way to show the correct distribution of power is to add more agents
once again to the model that possess the correct amount of information for their abilities. This will
lead to less overall waste in the model and a more accurate simulation in the context of the actual
problem.
Rank Tasks Power Value (0-1)
1 Soil Engineer 0.646
2 Utility Specialist 0.608
3 Pipe Installer 0.595
4 Excavator Operator 0.582
5 Site Surveyor 0.570
6 General Contractor 0.557
7 Blast Surveyor 0.443
8 Blast Engineer 0.430
9 Explosive Specialist 0.430
10 Structural Engineer 0.430
6. Discussions
Based on the results of this study of optimizing a construction project planning structure through
the use of a meta-network, there are several implications of this work that are important for the
construction industry itself. As of present, it is common for construction projects to adopt more
typical project planning methods (e.g. Gantt Charts, CPM) that still pose a planning risk to some
projects as these do not account for intricate project delays between tasks. This method of
constructing a project meta-network model in the planning stages of the construction process will
allow companies to highlight their specific vulnerabilities while amending their plan to prevent
any lack of productivity. This industry-level framework to optimize the project planning approach
will be discussed as follows.
Firstly, resource waste is sometimes a subjective piece of information on the project, while
resource needs take a more objective approach. For example, as seen during the simulation model
of need optimization, there is no longer any cases of tasks that have a resource deficiency in the
project, yet the amount of waste in information and resources is greatly increased, especially in
Table 8: The top 10 agents with the highest socio-economic power
Page 23
22
sections of the project that are relatively simple in the scope of the excavation operation.
Companies typically attempt to eliminate any extraneous material or personnel in their project to
save on labor. However, in this study’s structure, this is not always an issue as certain tasks often
require the input of larger agents on the project that involve themselves with many aspects of the
site, and therefore possess information relating to many different activities. Though this could
show as waste, it is not a true reflection of oversaturation in the model, and could be a positive
aspect as in construction, as it is beneficial for multiple agents to possess the same information as
a cross-reference for a singular task. A resource or information need is the only aspect of a project
that objectively must be satisfied, as a lack of support to a task leads to scheduling delays and
higher cost occurrences.
Second, the simulations of this model can be a useful tool when testing project plans to see
the effect of different factors on the whole project. Though this gives a large change to the project
to erase all needs, it is possible to make smaller changes to the model that still have a large impact.
In most projects, a plan is designed, and the schedule built around that specific flow of tasks that
must be completed. Using a meta-network approach, it is possible to start with the overall tasks
that need to be completed and create a scheduled approach that minimizes scheduling
vulnerabilities through different agent assignment. To show the effect that certain agents have on
the project, a simulation can be run that removes that agent from the network and cross-referenced
with the value for total project completion which would show the percentage of tasks that need the
assistance of that agent to run smoothly. These small changes show the impact of specific agents
on the entire network. A set of analyses that compare the usefulness of certain agents can be used
to improve the overall efficiency of the model and allocate resources in a more effective manner
to complete the required tasks without adding additional waste. This method of analysis is
important as it gives clients options on their project to decide the best way to proceed with the
project. Efficiency in the model can lead to more complex construction processes, such as fast
tracking for schedule improvements, or a categorization of workers with specializations for certain
tasks on the project. By examining different scenarios in this model, the owner can plan for
different occurrences and determine which agents are most important towards completion of the
project.
One of the largest implications of this data is the results that show the comparison in power
that certain agents have based on the tasks that they are assigned and the resources and information
that they possess. This idea shows that there are more factors that must be considered beyond the
typical ranking of a construction project. In this study, it is evident that the soil engineer is the
strongest agent in the project structure due to the large influence they have with creating the
geotechnical report and being the foremost source for design decisions when it comes to
foundation and site development. Though in a typical project structure, the general contractor will
have the final say on most matters that occur on site, it is the soil engineer which creates these
decisions and develops the plan for most of the work that must be done. This sets the hierarchy
that in an excavation-specific section of the project, the expert on soil mechanics and design will
be the most important agent in the project. This is an important observation for future construction
managers, as this shows that projects would run smoother and more effectively with a change to
the traditional hierarchy of a site. These experts are the strongest ally towards running a site
effectively and increasing overall efficiency, due to the fact that they possess the most information
that is required to keep the project running smoothly.
Page 24
23
Another important aspect of the study that can be gleaned from the ORA analysis is the
overwhelming presence of waste in a project. As per Table 11 above, the measurement of blast
attributes has the largest resource waste throughout the project. In a real-life scenario, this has two
main implications: the task itself is simple in the context of the entire project, and the task has a
high importance factor in a real-life scenario. This can be seen through the reasons that explain
why this task has such a large value of waste. Because the project is based on simple
measurements, there are not many requirements that are necessary in terms of resources and
information to fulfill the requirements of this task. This shows that this task is easily fulfilled and
does not have the complexity of other tasks in the structure. However, the more important aspect
to pay attention to is that this overabundance of waste results from the quantity of agents that are
involved with this specific task. Measuring attributes of an explosion on site is a matter of safety
for the members of the crew on site, and the surrounding civilians in the area. It makes sense that
there is a lot of waste due to the fact that several agents oversee the surveying of these blasts in
order to prove there is no danger to the people around them. In this specific example, there are 4
out of 13 agents assigned to the completion of this task, ensuring that it is completed correctly and
in a timely manner without any safety issues. It is important for construction managers to recognize
the importance of resource waste in tasks, and the deeper meaning behind these values.
The results of this study have also provided information towards proper scheduling
practices of each agent in the project. Through ORA’s analysis of workload, the percentage of
tasks that an agent is involved with in relation to the total tasks on the project can be measured and
compared to every agent in the project structure. Because of this, it is possible for construction
managers to make decisions based on the workload of certain agents on a project. If the soil
engineer is involved with over 80% of the tasks on an extensive construction project, it would be
beneficial to increase the manpower of this specific department in an early phase of the project to
balance out this large responsibility. Stretching a certain role too thin results in a potential for
errors on site and scheduling delays due to a large quantity of work that is designated for a singular
agent. This analysis can be used to redistribute workload during the planning phases of the project
and plan for certain agents that will have a larger role during this construction phase.
7. Research Limitations
Though this study will contribute greatly to the development of the construction planning industry,
there are also several limitations that should be considered. The largest limitation of this model is
that there is no distinction that determines which tasks are more important than each other.
Certainly, in a real-life scenario, it is more important that a foundation is lain than a flower bed.
Because there is no distinction in the ORA model, both tasks would account for the same
percentage of the total project competition. This is simply how the model behaves as the formula
for the total project completion exists as:
𝑃𝑟𝑜𝑗𝑒𝑐𝑡 𝐶𝑜𝑚𝑝𝑙𝑒𝑡𝑖𝑜𝑛 =𝑇𝑎𝑠𝑘𝑠 𝐶𝑜𝑚𝑝𝑙𝑒𝑡𝑒𝑑
𝑇𝑜𝑡𝑎𝑙 𝑁𝑢𝑚𝑏𝑒𝑟 𝑜𝑓 𝑇𝑎𝑠𝑘𝑠∗ 100% (3)
By taking the number of tasks that are completed and dividing it by the total number of
projects in the network, the percentage of completion for the entire project can be seen as
referenced by equation 3. However, by including a weight that is assigned to each task to determine
a more accurate project completion, a more useful analysis can be done for the entire network.
Page 25
24
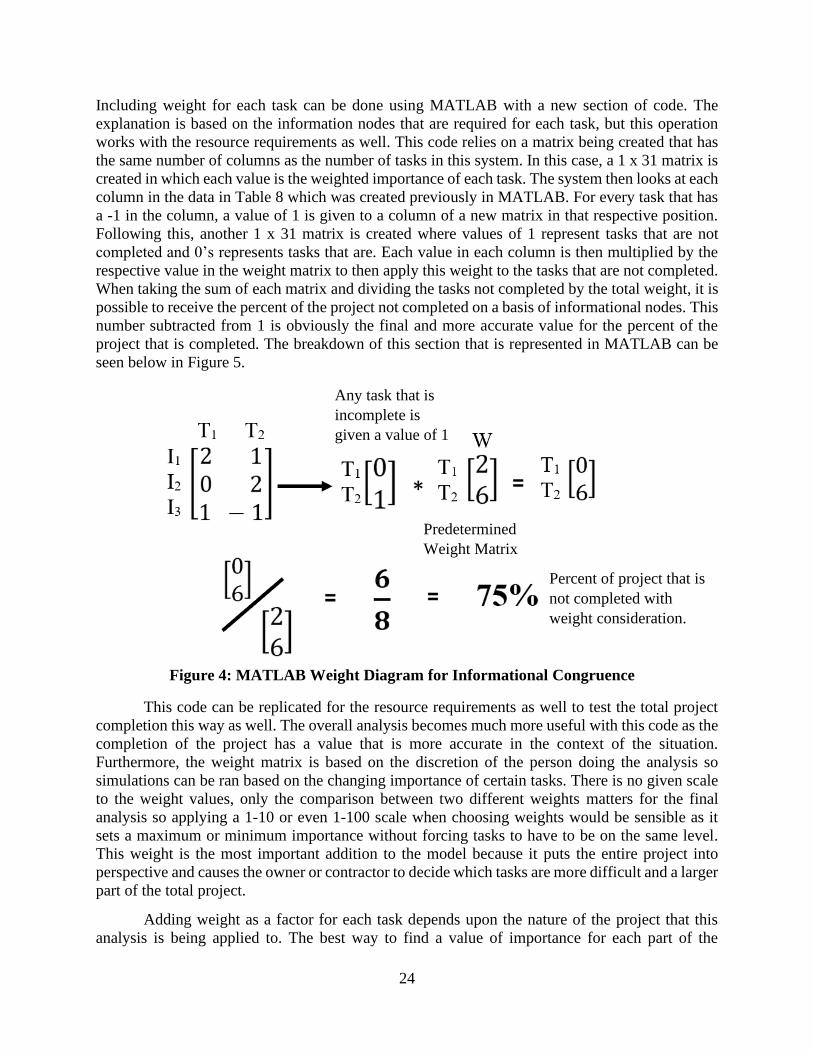
Including weight for each task can be done using MATLAB with a new section of code. The
explanation is based on the information nodes that are required for each task, but this operation
works with the resource requirements as well. This code relies on a matrix being created that has
the same number of columns as the number of tasks in this system. In this case, a 1 x 31 matrix is
created in which each value is the weighted importance of each task. The system then looks at each
column in the data in Table 8 which was created previously in MATLAB. For every task that has
a -1 in the column, a value of 1 is given to a column of a new matrix in that respective position.
Following this, another 1 x 31 matrix is created where values of 1 represent tasks that are not
completed and 0’s represents tasks that are. Each value in each column is then multiplied by the
respective value in the weight matrix to then apply this weight to the tasks that are not completed.
When taking the sum of each matrix and dividing the tasks not completed by the total weight, it is
possible to receive the percent of the project not completed on a basis of informational nodes. This
number subtracted from 1 is obviously the final and more accurate value for the percent of the
project that is completed. The breakdown of this section that is represented in MATLAB can be
seen below in Figure 5.
This code can be replicated for the resource requirements as well to test the total project
completion this way as well. The overall analysis becomes much more useful with this code as the
completion of the project has a value that is more accurate in the context of the situation.
Furthermore, the weight matrix is based on the discretion of the person doing the analysis so
simulations can be ran based on the changing importance of certain tasks. There is no given scale
to the weight values, only the comparison between two different weights matters for the final
analysis so applying a 1-10 or even 1-100 scale when choosing weights would be sensible as it
sets a maximum or minimum importance without forcing tasks to have to be on the same level.
This weight is the most important addition to the model because it puts the entire project into
perspective and causes the owner or contractor to decide which tasks are more difficult and a larger
part of the total project.
Adding weight as a factor for each task depends upon the nature of the project that this
analysis is being applied to. The best way to find a value of importance for each part of the
Any task that is
incomplete is
given a value of 1
Predetermined
Weight Matrix
Percent of project that is
not completed with
weight consideration.
Figure 4: MATLAB Weight Diagram for Informational Congruence
Page 26
25
construction project is to investigate the most integral parts of previous projects of a similar nature.
For example, if on a previous project, the grading of a soil area held up the construction of the rest
of the project, or incurred extra costs or delays during its duration, it could be seen to be treated as
a greater level of importance for future endeavors. As this model continues to be used in future
projects, it will become more accurate as a metric of project completion potential from within the
planning stage of construction. Future work should build upon this idea and investigate the model
with a more weighted analysis to increase the accuracy of project vulnerability metrics.
8. Conclusion
By expanding upon the idea of using a meta-network approach to construction project planning
and introducing the optimization of the model to eliminate specific vulnerabilities in the planning
structure, it is possible to make breakthroughs in project development that previously would have
been impossible. From data that is taken directly from the construction documents, an entire
project can be judged based on efficiency and completion to eliminate issues with vulnerabilities
during the actual construction phase of the project. Preparing nodesets to reflect an entire project
allows for a deeper understanding of a project’s requirements, and a better structure to begin
construction under.
Though this analysis method shows the potential for a project to be fully designed without
reasonable potential for scheduling vulnerabilities, there are also limitations associated with the
model that have been discussed above. However, these limitations will give way to strengths as
this planning method becomes more widely used. This optimization opens doors for further tools
to be used with this study’s structure that will continue to benefit the construction industry for
years to come. It is reasonable to say that as this method becomes more common among
construction companies, and developed through further studies, an extensive database could be
created that rationalizes similar tasks and agent data throughout different projects, and provides
further accuracy to the resources that they require and possess, respectively. A communal planning
structure will shift this study’s planning structure to the next logical step and allow for more
detailed planning in the early stages of a project’s life cycle. As it stands, this framework will serve
the industry to create stronger planning structures without potential for errors, and will be able to
guide the future of pre-construction with greater reliability and efficiency.
9. Acknowledgements
This study is part of a research effort that has been supported by Dr. Jin Zhu and the University of
Connecticut, focused on creating strategies for better planning approaches for construction
projects. This study has also been made possible with the help of Sudipta Chowdhury and his work
to refine the results of this approach.
Page 27
26
References:
Altman, N., Carley, K. M., & Reminga, J. (2019). ORA User ’ s Guide 2019.
Callinan, T. (2018). How to deal with project overrun. Fieldwire.
https://www.fieldwire.com/blog/how-to-deal-with-cost-overrun-as-a-construction-project-
owner/
El-sawalhi, N. I., & Shehatto, O. (2016). A Neural Network Model for Building Construction
Projects Cost Estimating. December 2014. https://doi.org/10.6106/JCEPM.2014.4.4.009
Emsley, M. W., Lowe, D. J., Duff, A. R. O. Y., & Hickson, A. (2002). Data modeling and the
application of a neural network approach to the Data modelling and the application of a
neural network approach to the prediction of total construction costs. February.
https://doi.org/10.1080/01446190210151050
Newman Architects. (2019). Athletic District Development Stadium Road, Storrs, CT 06269. 4.
Zhu, J., Asce, S. M., Mostafavi, A., Ph, D., & Asce, M. (2016). Metanetwork Framework for
Integrated Performance Assessment under Uncertainty in Construction Projects. 1–14.
https://doi.org/10.1061/(ASCE)CP.1943-5487.0000613.