Metabolic Responses of Lactobacillus plantarum Strains duringFermentation and Storage of Vegetable and Fruit Juices
P. Filannino,a G. Cardinali,b C. G. Rizzello,a S. Buchin,c M. De Angelis,a M. Gobbetti,a R. Di Cagnoa
Department of Soil, Plant and Food Science, University of Bari Aldo Moro, Bari, Italya; Sez. Microbiologia Applicata-Dipartimento di Biologia Vegetale e BiotecnologieAgroambientali, University of Perugia, Perugia, Italyb; INRA, UR 342, Technologie et Analyses Laitières, Poligny, Francec
Strains of Lactobacillus plantarum were grown and stored in cherry (ChJ), pineapple (PJ), carrot (CJ), and tomato (TJ) juices tomimic the chemical composition of the respective matrices. Wheat flour hydrolysate (WFH), whey milk (W), and MRS brothwere also used as representatives of other ecosystems. The growth rates and cell densities of L. plantarum strains during fermen-tation (24 h at 30°C) and storage (21 days at 4°C) differed only in part, being mainly influenced by the matrix. ChJ and PJ werethe most stressful juices for growth and survival. Overall, the growth in juices was negatively correlated with the initial concen-tration of malic acid and carbohydrates. The consumption of malic acid was noticeable for all juices, but mainly during fermen-tation and storage of ChJ. Decreases of branched-chain amino acids (BCAA)—with the concomitant increase of their respectivebranched alcohols—and His and increases of Glu and gamma-aminobutyric acid (GABA) were the main traits of the catabolismof free amino acids (FAA), which were mainly evident under less acidic conditions (CJ and TJ). The increase of Tyr was foundonly during storage of ChJ. Some aldehydes (e.g., 3-methyl-butanal) were reduced to the corresponding alcohols (e.g., 3-methyl-1-butanol). After both fermentation and storage, acetic acid increased in all fermented juices, which implied the activation of theacetate kinase route. Diacetyl was the ketone found at the highest level, and butyric acid increased in almost all fermented juices.Data were processed through multidimensional statistical analyses. Except for CJ, the juices (mainly ChJ) seemed to induce spe-cific metabolic traits, which differed in part among the strains. This study provided more in-depth knowledge on the metabolicmechanisms of growth and maintenance of L. plantarum in vegetable and fruit habitats, which also provided helpful informa-tion to select the most suitable starters for fermentation of targeted matrices.
When environmental conditions are favorable, microorgan-isms primarily devote resources to growth, whereas under
nutrient limitation, most of the energy is invested in survival (1).This dichotomy is formalized through the Pirt linear equation forsubstrate consumption (2), which shares metabolic energy be-tween biosynthetic and maintenance processes. As the microbialdemand for maintenance energy is usually constant, less energy isavailable for growth-associated processes in the presence of hostileenvironments, where resources are limiting (3).
More than other food ecosystems, raw fruits and some vegeta-bles possess intrinsic chemical and physical parameters that makethem particularly hostile environments for microorganisms. Theextremely acid environment, buffering capacity, high concentra-tion of carbohydrates, indigestible nutrients (e.g., fiber, inulin,and fructo-oligosaccharides), and antinutritional and inhibitoryfactors (e.g., tannins and polyphenol compounds) (4, 5, 6) are themain features of raw fruits and some vegetables (7).
Lactic acid bacteria are the most widely used group of bacteriain the food industry. Recently, several vegetables and fruits (6, 8, 9,10) were successfully subjected to fermentation by lactic acid bac-teria, which were selected within the autochthonous microbiota.Lactic acid fermentation of fresh vegetables and fruits is a low-costand sustainable process that aims to retain the sensory and nutri-tional features of the raw matrices and extend shelf life under safeconditions. Lactobacillus plantarum is one of the species of lacticacid bacteria most frequently found or used to ferment vegetablesand fruits (6, 8, 9, 10). L. plantarum is a highly heterogeneous andversatile species (6), very often encountered in plant, dairy, meat,and wheat fermentations and as a natural inhabitant of the gastro-intestinal tract in humans and animals (11, 12). Its natural con-tamination and broad commercial application reflect its remark-
able ecological adaptability to different habitats. The capacity toferment a broad range of carbohydrates (13) and other energysources and to metabolize several polyphenol compounds (14),the possession of a broad portfolio of enzymes (e.g., �-glucosi-dase, p-coumaric acid decarboxylase, and general decarboxylase)(14), and the synthesis of several antimicrobial compounds (15)are considered to be the most suitable features for niche adapta-tion.
Adaptation to vegetable and fruit ecosystems markedly variedwithin species and strains of lactic acid bacteria. This is because ofthe diversity of the plant environments, which, in turn, reflects onthe microbial capacity to share metabolic energy between biosyn-thesis (e.g., use of alternative substrates) and maintenance (e.g.,global stress responses) (3). The right balance between growthduring fermentation, also including enzyme activities that havepositive effects on the sensory, nutritional, and functional fea-tures, and survival at elevated numbers during storage is indis-pensable to guarantee high standards during vegetable and fruitprocessing by lactic acid bacteria (16). Nevertheless, the metabolicadaptation and response of lactic acid bacteria to vegetable and
Received 22 November 2013 Accepted 22 January 2014
fruit ecosystems was poorly investigated compared to other fer-mented foods (e.g., dairy and cereal products). We sought morein-depth knowledge of the mechanisms of growth and survival indiverse and hostile vegetable and fruit habitats with the aim ofdescribing specific metabolic traits, which allows better design offermentation strategies based on selected strains of lactic acid bac-teria for targeted raw matrices.
With the above-mentioned aim, this study investigated thegrowth and survival of several strains of L. plantarum under envi-ronmental conditions such as those characterizing vegetables andfruits. A panel of various metabolome approaches was used todescribe the responses. Multidimensional statistical analyses wereused to define the correlations between the chemical composi-tions of plant matrices and the growth and survival of L. planta-rum strains, as well as the differences among bacterial strains,based on metabolic responses.
MATERIALS AND METHODSPreparation of media. Fruit (cherry [ChJ] and pineapple [PJ]) and vege-table (carrot [CJ] and tomato [TJ]) juice media were chosen as modelsystems for the study as representatives of diverse ecosystems. They wereprepared as described by Di Cagno et al. (8). Fruits and vegetables wereseparately homogenized, centrifuged (10,000 � g; 20 min; 4°C), heattreated (121°C for 10 min), filtered onto a Whatman apparatus (Polycarp75 SPF; Whatman International, Maidstone, England), sterilized by filtra-tion on 0.22-�m membrane filters (Millipore), and stored at �20°C be-fore use. Wheat flour hydrolysate (WFH) and whey milk (W) were chosenas representative media for other ecosystems where lactic acid bacteria arelargely used and studied. WFH was produced as described by Di Cagno etal. (17). Commercial W (Sigma Chemical Co., Milan, Italy) was resus-pended (5% [wt/vol] in tap water), filtered through a Whatman apparatus(Whatman International), sterilized by filtration on 0.22-�m membranefilters (Millipore), and stored at 4°C before use. MRS broth (Oxoid, Bas-ingstoke, Hampshire, England) was used as the control medium for opti-mal growth. The main chemical compositions of the culture media areshown in Table S1 in the supplemental material.
Microorganisms and growth conditions. L. plantarum CIL6 fromcherry (6), L. plantarum 1MR20 from pineapple (10), L. plantarum C2from carrot (8), L. plantarum POM1 from tomato (9), L. plantarumDC400 from Italian wheat sourdough (17), and L. plantarum CC3M8from Caciocavallo Pugliese cheese (18) were used for fermentation. Allbacterial strains belonged to the Culture Collection of the Department ofSoil, Plant and Food Sciences, University of Bari, Bari, Italy. Except for L.plantarum DC400, which was propagated on MRS broth modified by theaddition of fresh yeast extract (5% [vol/vol]) and 28 mM maltose at a finalpH of 5.6 (mMRS), all the strains were propagated in MRS broth at 30°Cfor 24 h. The 24-h-old cells were harvested by centrifugation (10,000 � g;10 min at 4°C), washed twice in 50 mM sterile potassium phosphate buffer(pH 7.0), resuspended in sterile distilled water to a final optical density at620 nm (OD620) of 2.5 (final cell number corresponding to ca. 9.0 log CFUml�1), and used to inoculate (4% [vol/vol]; initial cell number corre-sponding to ca. 7.0 log CFU g�1) each of the culture media. Incubationwas at 30°C for 24 h, and further storage was allowed for 21 days at 4°C.Assays were performed in triplicate under a total of 42 sets of experimentalconditions (126 samples). Samples were analyzed at the end of fermenta-tion and after storage. Cell enumeration was carried out by plating ontomMRS or MRS agar.
Chemical compositions of media. pH was measured with a Food-trode electrode (Hamilton, Bonaduz, Switzerland). Total titratable acidity(TTA) was measured on 10 ml of medium diluted with 90 ml of distilledwater (Classic Blender; PBI International) and expressed as the amount(ml) of 0.1 M NaOH needed to achieve a pH of 8.3. Soluble solids weremeasured using an Atago digital refractometer (Chemifarm srl, Parma,Italy). The refractive index was recorded and converted to degrees Brix.
Measurements were carried out at 25 � 0.5°C. Total polyphenol com-pounds were determined according to the method of Slinkard and Single-ton (19). Gallic acid was the standard, and the concentration of totalpolyphenol compounds was calculated as gallic acid milliequivalents. Thebuffering capacities of the media were measured using the method of Paiet al. (20). One-hundred milliliters of each medium was titrated with 1 NHCl. The values were expressed as the amount of HCl (mmol) needed todrop 1 pH unit per unit volume (1 liter).
Kinetics of growth and acidification. The kinetics of growth and acid-ification were determined and modeled according to the Gompertz equa-tion as modified by Zwietering et al. (21): y � k � A exp{�exp[(�max orVmax e/A)( � t) � 1]}, where k is the initial level of the dependentvariable to be modeled (log CFU ml�1 or pH units), A is the difference incell density or units of pH (pH) between inoculation and the stationaryphase, �max and Vmax are the maximum growth rate (expressed as logCFU ml�1 h�1) and the maximum acidification rate (expressed as pHh�1), respectively, is the length of the lag phase (expressed in hours), andt is the time.
Determination of carbohydrates, organic acids, and free amino ac-ids. Thirty milliliters of medium was diluted in 90 ml of 50 mM phosphatebuffer, pH 7.0. The suspension was kept at 40°C for 1 h under gentlestirring (150 rpm) and centrifuged at 10,000 � g for 10 min. The super-natant was filtered through a Millex-HA 0.22-�m-pore-size filter (Milli-pore Co.) and used for determinations. Organic acids and carbohydrateswere determined through high-performance liquid chromatography(HPLC) analysis using the Äkta Purifier System (GE Healthcare), whichwas equipped with an Aminex HPX-87H column (ion exclusion; Bio-Rad) and a UV detector operating at 210 nm (22) or with a Spherisorbcolumn (Waters, Milford, MA, USA) and the PerkinElmer 200a refractiveindex detector (PerkinElmer, Waltham, MA, USA), respectively. Totaland individual free amino acids (FAA) were analyzed with a Biochrom 30series amino acid analyzer (Biochrom Ltd., Cambridge Science Park, Eng-land), as described by Rizzello et al. (23).
Determination of volatile components and volatile free fatty acids.Volatile components (VOC) were analyzed through purge and trap cou-pled with gas chromatography-mass spectrometry (PT–GC-MS), accord-ing to the method of Di Cagno et al. (9). Volatile free fatty acids (VFFA)were extracted by solid-phase microextraction coupled with GC-MS(SPME–GC-MS). One milliliter of sample was mixed with 100 �l ultra-high-quality (UHQ) water and 100 �l 2 N H2SO4 in a 10-ml glass vial, andthe sealed vial was allowed to rest for 10 min at 60°C. An SPME fiber(CAR/PDMS 75 �m; Supelco) was placed in the headspace of the vial for30 min at 60°C. Then, it was removed and desorbed for 5 min in a splitlesschromatograph injector at 240°C. The chromatograph (6890; Agilent In-struments) was equipped with a Stabilwax-DA column (Restek; 30 mlong, 0.32-�m inside diameter [i.d.], and 0.5 �m thick). The oven tem-perature was 120°C during the first 2 min, and then it was increased to160°C (2°C min�1) and to 250°C (10°C 3 min�1). The pressure was keptconstant at 41 kPa. Quantification was carried out by external calibration,using a mixed solution of VFFA standards (Sigma). Quantification ofVOC was expressed as log arbitrary units of area of an ion characteristic ofthe compound, and quantification of VFFA was expressed in ppm (vol/vol).
Malolactic activity assays. Cell suspensions were harvested from themedia by centrifugation (8,000 � g; 15 min) and washed twice with tar-trate K2HPO4 buffer, pH 3.5. The pellet was resuspended in 5 ml of buffer.Aliquots of cell suspension (1 ml, corresponding to ca. 109 CFU ml�1)were added to 25 ml of buffer (final volume) in 50-ml Erlenmeyer flasks.The headspace was flushed with N2, and suspensions were initially equil-ibrated for 10 min at the reaction temperature. The assay was carried outas described by Herrero et al. (24). The results were expressed as thespecific activity (�mol of L-malic acid degraded per min per mg [dryweight]).
Cell membrane integrity. The cell membrane integrity of L. planta-rum strains was estimated using the LIVE/DEAD BacLight Bacterial Via-
bility Kit (Molecular Probes, Inc., Cambridge Bioscience, Cambridge,United Kingdom), according to the manufacturer’s instructions. Thestained bacterial suspensions were observed using a Leica LDMC (LeicaMicrosystems SpA, Milan, Italy) with a 60� objective. Cell numbers weredetermined from images using the Image-Pro Plus image analysis soft-ware (Media Cybernetics Inc., Silver Spring, MD) (25).
Statistical analyses. Data (at least three replicates) were subjected toone-way analysis of variance (ANOVA), and pair comparison of treat-ment means was achieved by Tukey’s procedure at a P value of �0.05,using the statistical software Statistica 7.0 for Windows. Data were pro-cessed and analyzed in the free statistical environment R (CRAN; http://cran.r-project.org/), according to the specific procedures described be-low. Distances and correlations among objects (R mode) or amongdescriptors (Q mode) were calculated with the dist (Euclidean method)and cor (Pearson correlation) functions of the base statistical package,respectively. Principal-coordinate analysis (PCoA) was carried out andplotted with the cmdscale function, which served to calculate the variabil-ity expressed in the two axes of the plot. The distance among bacterialstrains for PCoA was obtained for each group of descriptors (carbohy-drates, organic acids, free amino acids, volatile components, and volatilefree fatty acids) by averaging the distance between strains in each singlemedium. Pseudoheatmaps were used to synthetically visualize the corre-lations among volatile compounds or among strains, using as inputs theconcentrations of all descriptors (carbohydrates, organic acids, freeamino acids, volatile compounds, and volatile free fatty acids) both at theend of fermentation and at the end of storage. The heatmap function wasused, setting the color to a 12-grade rainbow scale spanning from �0.1(red) to 1 (light yellow).
RESULTSKinetics of growth and acidification. ChJ, PJ, CJ, and TJ wereused as model systems to mimic the chemical compositions of therespective fruits and vegetables. Strains of L. plantarum were iso-lated from various foods, and the juices or other media (WFH andW) used were representative of the sources of isolation.
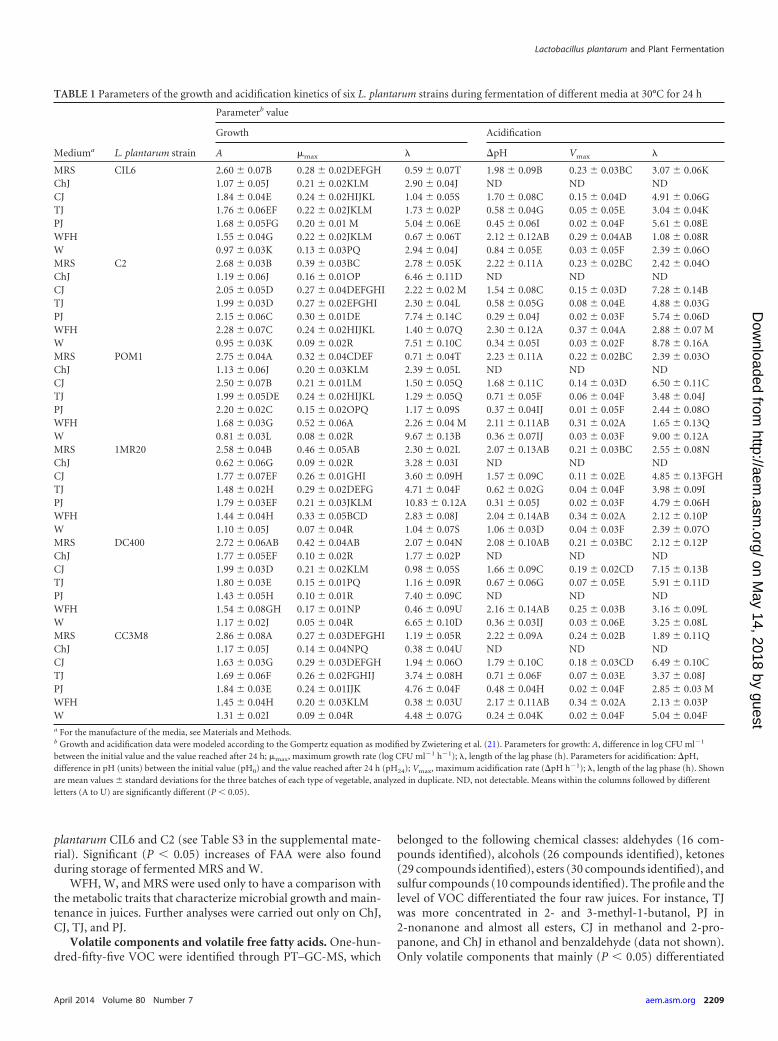
All L. plantarum strains grew under all the conditions, but theincreases of cell density (A) depended on the medium (Table 1).W, ChJ, and PJ induced the longest and the lowest A. The mi-crobial growth in WFH, TJ, and CJ was similar to the optimum,which was found in MRS medium. L. plantarum DC400 andPOM1 had the highest A values and the lowest values in almostall juices. Due to the low initial pH values (4.38 � 0.04 and 3.64 �0.03), TJ and PJ were subjected to mild lactic acidification (Table1). No decrease of pH was found during fermentation of ChJ,which had the highest buffering capacity (45.0 � 2.1 mmol HClpH�1 liter�1). The greatest decreases of pH were found for WFHand CJ, which approached those found in MRS medium. ThePearson correlation matrix between the chemical compositions ofjuices and A was calculated (data not shown). Except for L. plan-tarum DC400, the A values of the strains were negatively corre-lated with the concentrations of malic acid and glucose (0.92 to0.988 and 0.935 to 0.983, respectively). A positive correlation(0.975) between A and the initial pH value of each medium wasfound for L. plantarum DC400.
Cell viability. The cell viability of L. plantarum strains slightly(P � 0.05) decreased in all media (ca. 0.15 to 0.8 log CFU ml�1)during 21 days of storage at 4°C. The only exception was L. plan-tarum DC400, which decreased ca. 1.5 log CFU ml�1 in ChJ, PJ,and CJ. The decrease of strain DC400 was limited during storageof WFH (ca. 0.5 log CFU ml�1).
The analysis with a LIVE/DEAD BacLight Bacterial ViabilityKit (see Fig. S1 in the supplemental material) and the related
quantification with Image-Pro Plus image software confirmedthat the number of intact cells of L. plantarum DC400 significantly(P � 0.05) varied during storage and depended on the medium.The percentage of dead/damaged cells with respect to total cellsvaried between 7 and 8 (MRS and WFH, CJ and TJ) to 13 to 17%(PJ and ChJ). The estimated percentage of dead/damaged cellswith respect to total cells of L. plantarum C2 did not exceed ca. 1%throughout storage in all the media. Apart from the medium, theabove ratio for the other strains was always lower than ca. 6%.
Carbohydrates, organic acids, and free amino acids. Inde-pendent of the medium used, the stoichiometric ratio betweenglucose, fructose, sucrose, maltose, lactose, galactose, and/ormalic acid consumed and lactic acid synthesized was almost re-spected for all the strains (see Table S2 in the supplemental mate-rial). Compared to prior fermentation, the concentrations of citricacid in fermented juices did not significantly (P � 0.05) vary. Asexpected, the concentration of carbohydrates significantly (P �0.05) decreased during fermentation and storage of MRS andWFH. The decrease of lactose was slight (P � 0.05) in all fer-mented W media. The consumption of carbohydrates did notdifferentiate (P � 0.05) the L. plantarum strains during fermenta-tion and storage of MRS, WFH, and W. The concentrations ofglucose and fructose of ChJ did not significantly (P � 0.05) varyduring fermentation and storage. Almost the same was found forPJ. On the other hand, the concentrations of glucose and fructosemarkedly decreased (P � 0.05) during fermentation of CJ (ca. 15and 10%, respectively) and TJ (ca. 11% for both carbohydrates).
Lactic acid was always the major fermentation end product.The lowest level was found in fermented W (see Table S2 in thesupplemental material). Compared to prior fermentation, theconcentration of malic acid in all juices significantly (P � 0.05)decreased during fermentation. The greatest decrease was foundfor ChJ. It ranged from 18% (strain C2) to 32% (strain DC400).After fermentation, the molar ratios between consumed malicacid and glucose/fructose were 1.77 to 1.28 (ChJ), 0.86 to 0.47(CJ), 0.60 to 0.15 (PJ), and 0.35 to 0.30 (TJ). The highest ratioswere found for juices fermented with L. plantarum DC400. A de-crease of malic acid was also found during storage of ChJ, PJ, andCJ. The above ratios increased during storage of most of the fer-mented ChJ. L. plantarum DC400 showed the highest malolacticspecific activity. Cells harvested from fermented ChJ and PJshowed higher enzyme activity than those from CJ and TJ (1.15 �0.11 and 1.05 � 0.32 versus 0.05 � 0.01 and 0.09 � 0.02 �molL-malic acid degraded per min per mg dry weight, respectively).Almost the same trend was found for the other strains.
The initial concentration of FAA in the juices varied between587 � 25 mg liter�1 (PJ) and 2,395 � 51 mg liter�1 (TJ) (see TableS3 in the supplemental material). FAA increased during fermen-tation of ChJ (ca. 17 to 25%) and TJ (ca. 6 to 17%). Markeddecreases were found for CJ (ca. 30 to 44%) and PJ (ca. 13 to 44%).The initial concentrations of FAA in MRS, WFH, and W werealmost unchanged after fermentation. In particular, the concen-tration of branched-chain amino acids (BCAA) (Val, Ile, and Leu)decreased (P � 0.05) during fermentation of all juices, especiallyCJ and TJ. Almost the same was found for His, especially in TJ andPJ. Glu increased (P � 0.05) during fermentation of TJ only tomarkedly decrease during storage. The same trend was found forgamma-aminobutyric acid (GABA) (P � 0.05). FAA increasedduring storage of all fermented ChJ and PJ. An increase of Tyr wasfound only during storage of ChJ, which was fermented with L.
Filannino et al.
2208 aem.asm.org Applied and Environmental Microbiology
plantarum CIL6 and C2 (see Table S3 in the supplemental mate-rial). Significant (P � 0.05) increases of FAA were also foundduring storage of fermented MRS and W.
WFH, W, and MRS were used only to have a comparison withthe metabolic traits that characterize microbial growth and main-tenance in juices. Further analyses were carried out only on ChJ,CJ, TJ, and PJ.
Volatile components and volatile free fatty acids. One-hun-dred-fifty-five VOC were identified through PT–GC-MS, which
belonged to the following chemical classes: aldehydes (16 com-pounds identified), alcohols (26 compounds identified), ketones(29 compounds identified), esters (30 compounds identified), andsulfur compounds (10 compounds identified). The profile and thelevel of VOC differentiated the four raw juices. For instance, TJwas more concentrated in 2- and 3-methyl-1-butanol, PJ in2-nonanone and almost all esters, CJ in methanol and 2-pro-panone, and ChJ in ethanol and benzaldehyde (data not shown).Only volatile components that mainly (P � 0.05) differentiated
TABLE 1 Parameters of the growth and acidification kinetics of six L. plantarum strains during fermentation of different media at 30°C for 24 h
between the initial value and the value reached after 24 h; �max, maximum growth rate (log CFU ml�1 h�1); , length of the lag phase (h). Parameters for acidification: pH,difference in pH (units) between the initial value (pH0) and the value reached after 24 h (pH24); Vmax, maximum acidification rate (pH h�1); , length of the lag phase (h). Shownare mean values � standard deviations for the three batches of each type of vegetable, analyzed in duplicate. ND, not detectable. Means within the columns followed by differentletters (A to U) are significantly different (P � 0.05).
fermented juices and were indicative of some metabolic traits werefurther considered (see Table S4 in the supplemental material).Except for benzeneacetaldehyde, most of the aldehydes, especially3-methyl-butanal, 2-methyl-butanal, and 2-hexenal, significantly(P � 0.05) decreased during fermentation of almost all juices.Several branched alcohols (e.g., 3-methyl-1-butanol and 2-meth-yl-1-butanol) increased (P � 0.05) during both fermentation andstorage. A marked increase of most of the ketones was found dur-ing fermentation. 2,3-Butanedione (diacetyl) showed the highestconcentration for all the fermented juices. Its level further in-creased during storage of ChJ and CJ.
During fermentation and storage, all 10 VFFA (C2 to C8) sig-nificantly (P � 0.05) differentiated juices and strains. Only VFFAthat mainly (P � 0.05) differentiated fermented juices and wereindicative of some metabolic traits are shown (see Table S4 in thesupplemental material). Acetic acid increased in almost all fer-mented juices, especially in TJ and PJ. L. plantarum POM1,1MR20, and C2 showed the greatest increases. During storage, theconcentrations of acetic acid increased for all fermented ChJ (ca.26 to 293 ppm) and CJ (ca. 35 to 404 ppm) and for PJ and TJ whenfermented with L. plantarum POM1 (ca. 465 and 344 ppm, respec-tively). Propionic, isobutyric, 3-methyl-butyric, and 2-methyl-butyric acids decreased during fermentation of CJ. The oppositewas found for all fermented TJ. The concentrations of butyric acidincreased in ChJ and, especially, TJ, mainly when fermented withstrain C2. No significant (P � 0.05) variations were foundthroughout storage.
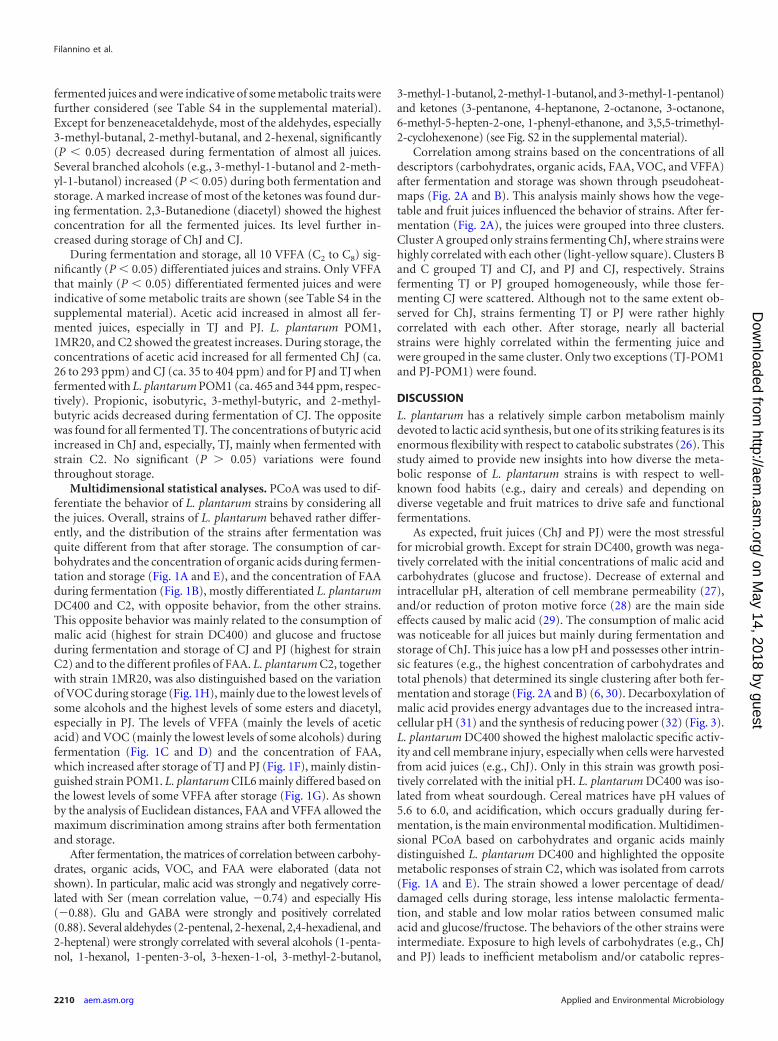
Multidimensional statistical analyses. PCoA was used to dif-ferentiate the behavior of L. plantarum strains by considering allthe juices. Overall, strains of L. plantarum behaved rather differ-ently, and the distribution of the strains after fermentation wasquite different from that after storage. The consumption of car-bohydrates and the concentration of organic acids during fermen-tation and storage (Fig. 1A and E), and the concentration of FAAduring fermentation (Fig. 1B), mostly differentiated L. plantarumDC400 and C2, with opposite behavior, from the other strains.This opposite behavior was mainly related to the consumption ofmalic acid (highest for strain DC400) and glucose and fructoseduring fermentation and storage of CJ and PJ (highest for strainC2) and to the different profiles of FAA. L. plantarum C2, togetherwith strain 1MR20, was also distinguished based on the variationof VOC during storage (Fig. 1H), mainly due to the lowest levels ofsome alcohols and the highest levels of some esters and diacetyl,especially in PJ. The levels of VFFA (mainly the levels of aceticacid) and VOC (mainly the lowest levels of some alcohols) duringfermentation (Fig. 1C and D) and the concentration of FAA,which increased after storage of TJ and PJ (Fig. 1F), mainly distin-guished strain POM1. L. plantarum CIL6 mainly differed based onthe lowest levels of some VFFA after storage (Fig. 1G). As shownby the analysis of Euclidean distances, FAA and VFFA allowed themaximum discrimination among strains after both fermentationand storage.
After fermentation, the matrices of correlation between carbohy-drates, organic acids, VOC, and FAA were elaborated (data notshown). In particular, malic acid was strongly and negatively corre-lated with Ser (mean correlation value, �0.74) and especially His(�0.88). Glu and GABA were strongly and positively correlated(0.88). Several aldehydes (2-pentenal, 2-hexenal, 2,4-hexadienal, and2-heptenal) were strongly correlated with several alcohols (1-penta-nol, 1-hexanol, 1-penten-3-ol, 3-hexen-1-ol, 3-methyl-2-butanol,
3-methyl-1-butanol, 2-methyl-1-butanol, and 3-methyl-1-pentanol)and ketones (3-pentanone, 4-heptanone, 2-octanone, 3-octanone,6-methyl-5-hepten-2-one, 1-phenyl-ethanone, and 3,5,5-trimethyl-2-cyclohexenone) (see Fig. S2 in the supplemental material).
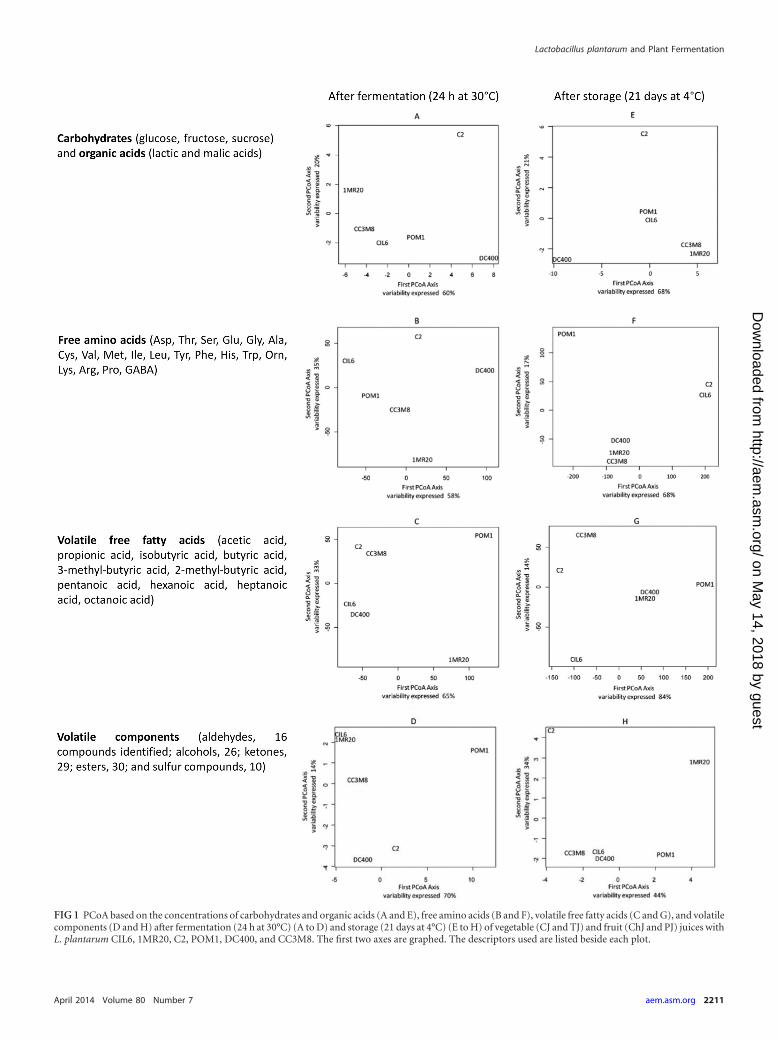
Correlation among strains based on the concentrations of alldescriptors (carbohydrates, organic acids, FAA, VOC, and VFFA)after fermentation and storage was shown through pseudoheat-maps (Fig. 2A and B). This analysis mainly shows how the vege-table and fruit juices influenced the behavior of strains. After fer-mentation (Fig. 2A), the juices were grouped into three clusters.Cluster A grouped only strains fermenting ChJ, where strains werehighly correlated with each other (light-yellow square). Clusters Band C grouped TJ and CJ, and PJ and CJ, respectively. Strainsfermenting TJ or PJ grouped homogeneously, while those fer-menting CJ were scattered. Although not to the same extent ob-served for ChJ, strains fermenting TJ or PJ were rather highlycorrelated with each other. After storage, nearly all bacterialstrains were highly correlated within the fermenting juice andwere grouped in the same cluster. Only two exceptions (TJ-POM1and PJ-POM1) were found.
DISCUSSION
L. plantarum has a relatively simple carbon metabolism mainlydevoted to lactic acid synthesis, but one of its striking features is itsenormous flexibility with respect to catabolic substrates (26). Thisstudy aimed to provide new insights into how diverse the meta-bolic response of L. plantarum strains is with respect to well-known food habits (e.g., dairy and cereals) and depending ondiverse vegetable and fruit matrices to drive safe and functionalfermentations.
As expected, fruit juices (ChJ and PJ) were the most stressfulfor microbial growth. Except for strain DC400, growth was nega-tively correlated with the initial concentrations of malic acid andcarbohydrates (glucose and fructose). Decrease of external andintracellular pH, alteration of cell membrane permeability (27),and/or reduction of proton motive force (28) are the main sideeffects caused by malic acid (29). The consumption of malic acidwas noticeable for all juices but mainly during fermentation andstorage of ChJ. This juice has a low pH and possesses other intrin-sic features (e.g., the highest concentration of carbohydrates andtotal phenols) that determined its single clustering after both fer-mentation and storage (Fig. 2A and B) (6, 30). Decarboxylation ofmalic acid provides energy advantages due to the increased intra-cellular pH (31) and the synthesis of reducing power (32) (Fig. 3).L. plantarum DC400 showed the highest malolactic specific activ-ity and cell membrane injury, especially when cells were harvestedfrom acid juices (e.g., ChJ). Only in this strain was growth posi-tively correlated with the initial pH. L. plantarum DC400 was iso-lated from wheat sourdough. Cereal matrices have pH values of5.6 to 6.0, and acidification, which occurs gradually during fer-mentation, is the main environmental modification. Multidimen-sional PCoA based on carbohydrates and organic acids mainlydistinguished L. plantarum DC400 and highlighted the oppositemetabolic responses of strain C2, which was isolated from carrots(Fig. 1A and E). The strain showed a lower percentage of dead/damaged cells during storage, less intense malolactic fermenta-tion, and stable and low molar ratios between consumed malicacid and glucose/fructose. The behaviors of the other strains wereintermediate. Exposure to high levels of carbohydrates (e.g., ChJand PJ) leads to inefficient metabolism and/or catabolic repres-
Filannino et al.
2210 aem.asm.org Applied and Environmental Microbiology
FIG 1 PCoA based on the concentrations of carbohydrates and organic acids (A and E), free amino acids (B and F), volatile free fatty acids (C and G), and volatilecomponents (D and H) after fermentation (24 h at 30°C) (A to D) and storage (21 days at 4°C) (E to H) of vegetable (CJ and TJ) and fruit (ChJ and PJ) juices withL. plantarum CIL6, 1MR20, C2, POM1, DC400, and CC3M8. The first two axes are graphed. The descriptors used are listed beside each plot.
sion, and bacteria need to equilibrate the extra- and intracellularconcentrations (33). Consumption of carbohydrates was consis-tent and similar to that in other favorable media (WFH and MRSbroth) only in vegetable juices (CJ and TJ), which had lower con-centrations of glucose and fructose and were less acidic than fruitjuices (ChJ and PJ). None of the previous studies (6, 8, 9, 10)showed a shift of the main energy source used, depending on thevegetable and fruit matrices, and this also differentiated the be-havior of L. plantarum with respect to dairy or wheat ecosystems,where carbohydrates are mostly fermented. Indeed, depending onwhether the environmental conditions were favorable (CJ and TJ)or unfavorable (ChJ and PJ), the trend of L. plantarum strainsseemed to turn from pathways mainly devoted to growth (fermen-tation of carbohydrates) to routes that mainly allowed mainte-nance (e.g., malolactic fermentation) (34, 35). This considerationis strengthened by the results of the pseudoheatmaps in Fig. 2Aand B, which showed that in most cases the juice matrix deter-mined a homogeneous metabolic response of the strains.
The catabolism of FAA is another mechanism for microbialadaptation to surrounding environments, which was investigatedin depth for lactic acid bacteria growing in cheeses and sour-doughs (36) but poorly for vegetable and fruit fermentations (16).As shown by the analysis of Euclidean distances, different re-sponses between the strains were mainly related to the catabolismof FAA (Fig. 1B and F). Due to the high nitrogen content, fermen-
tation of the rich media MRS broth, WFH, and W was not affectedby significant variations of FAA during fermentation. On theother hand, BCAA (Val, Ile, and Leu) decreased during fermenta-tion of juices (mainly CJ and TJ) and seemed to be converted intotheir respective branched alcohols (2-methyl-1-butanol, 3-meth-yl-1-butanol, and 2-methyl-1-propanol), whose levels concomi-tantly increased (Fig. 3). Consumption of BCAA into their corre-sponding 2-ketoacids leads to gain of ATP and allows theregeneration of Glu from -ketoglutarate (35, 37). Conversion ofGlu to GABA also enhances acid resistance (38, 39). All fermentedTJ showed increased levels of Glu and GABA, and in general, thetwo compounds were positively correlated. A decreasing trend,mainly when TJ and PJ were fermented with strain CC3M8 (iso-lated from cheese), was also found for His. The decarboxylation ofHis into histamine provides energy through the generation of pro-ton motive force (40) (Fig. 3). The matrices of correlation showeda negative correlation between His and malic acid, which sug-gested the alternative use of these sources (41). Overall, it seemedthat the catabolism of FAA is a mechanism of adaptation that ismore pronounced under less acidic conditions and for vegetablejuices (CJ and TJ), whereas malolactic fermentation prevails in avery acidic environment (ChJ). The increase of Tyr, which wasfound only during storage of ChJ, mainly when fermented withstrains CIL6 (isolated from cherries) and C2, may deserve specificconsideration. Quinate is largely present in cherries, and it may act
FIG 2 Pseudoheatmap showing correlation between L. plantarum CIL6, 1MR20, C2, POM1, DC400, and CC3M8 based on the concentrations of carbohydrates(glucose, fructose, and sucrose), organic acids (lactic and malic acids), free amino acids (Asp, Thr, Ser, Glu, Gly, Ala, Cys, Val, Met, Ile, Leu, Tyr, Phe, His, Trp,Orn, Lys, Arg, Pro, and GABA), volatile free fatty acids (acetic acid, propionic acid, isobutyric acid, butyric acid, 3-methyl-butyric acid, 2-methyl-butyric acid,pentanoic acid, hexanoic acid, heptanoic acid, and octanoic acid), and volatile compounds (aldehydes, 16 compounds; alcohols, 26; ketones, 29; esters, 30; sulfurcompounds, 10) after fermentation (24 h at 30°C) (A) and storage (21 days at 4°C) (B) of vegetable (CJ and TJ) and fruit (ChJ and PJ) juices. A 12-grade rainbowscale ranging from a minimum of �0.1 (red) to a maximum of 0.1 (light yellow) was used. Clusters are separated by the vertical dashed lines.
Filannino et al.
2212 aem.asm.org Applied and Environmental Microbiology
as a precursor of Tyr through a number of reactions (Fig. 3) (42).Tyr is a stimulatory amino acid for the growth of L. plantarumand, in general, its catabolism is also involved in the mechanism ofintracellular pH regulation (43). First, this study showed thatsome traits of the catabolism of FAA are also indispensable forgrowth and adaptation of L. plantarum to vegetable and fruit ma-trices.
Several VOC identified during juice fermentation and storagewere inherent aroma components of the vegetables and fruits used(44). Overall, alcohols, ketones, ketoacids, and terpenes are synthe-sized by lactic acid bacteria when subjected to environmental stresses(45–49). Some aldehydes (e.g., 3-methyl-butanal, 2-methyl-butanal,or 2-hexenal) that decreased during fermentation were statisticallycorrelated with the corresponding and increasing alcohols (e.g.,3-methyl-1-butanol, 2-methyl-1-butanol, or 2-hexen-1-ol). The lowredox potential of the juices may have directly caused the reduction ofunstable aldehydes and ketones to primary and secondary alcohols(50), or as discussed previously, branched alcohols may have beenderived from the catabolism of BCAA (Fig. 3). As previously shown
during sourdough fermentation (51), microbial activity may alsohave been responsible for this reduction, which increases the capacityto recycle NADH cofactors (Fig. 3). After both fermentation and stor-age, acetic acid markedly increased in all fermented juices. This im-plies activation of the acetate kinase route of the phosphogluconatepathway by L. plantarum strains. The marked activation of this routestrictly relies on the availability of external acceptors of electrons, suchas aldehydes, which were reduced to the corresponding alcohols (Fig.3). Almost the same mechanism of activation was shown duringsourdough fermentation (51), but none of the previous studies (16)highlighted its occurrence during vegetable and fruit fermentations.Diacetyl was the ketone found at the highest level in all fermentedjuices (mainly PJ fermented with L. plantarum CIL6, 1MR20, andC2). The synthesis of neutral diacetyl is induced at the transcriptionallevel by acidic conditions, which presumably contributes to intracel-lular pH regulation by decreasing the level of pyruvate (52) (Fig. 3).
Data were processed through multidimensional statisticalanalyses (Fig. 1 and 2A and B) to show the effects of the matricesand to differentiate L. plantarum strains. Due to their inherent and
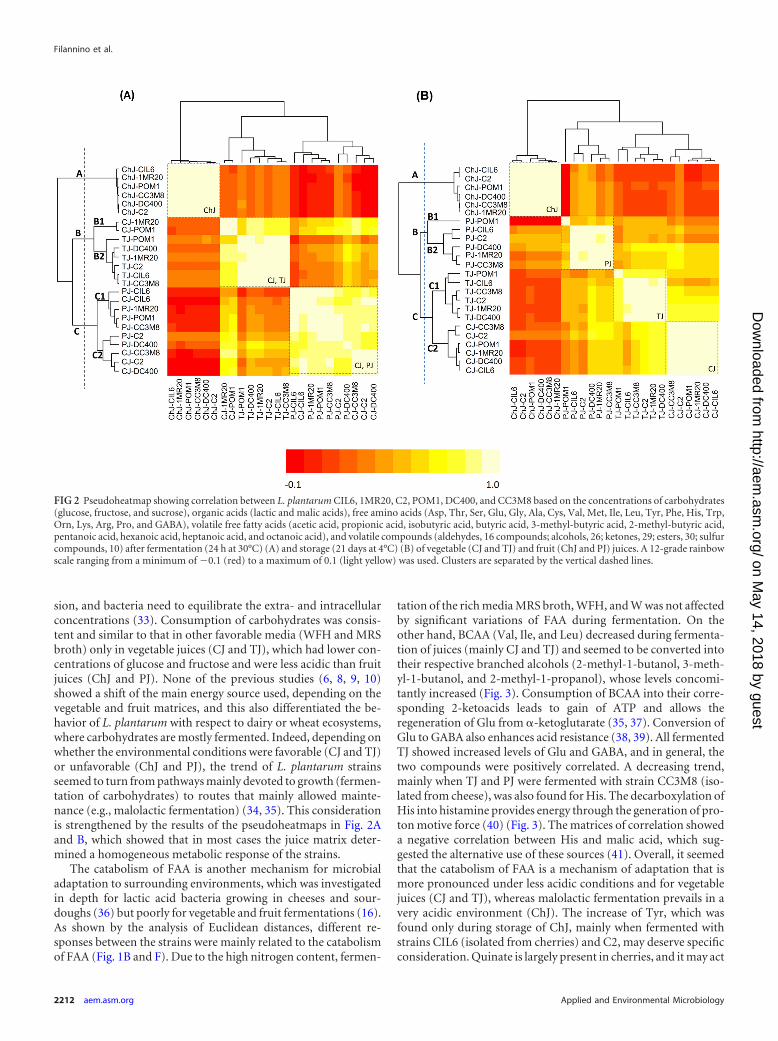
FIG 3 Schematic representation of the presumptive metabolic pathways in L. plantarum CIL6, C2, POM1, 1MR20, DC400, and CC3M8 during fermentation (24h at 30°C) and storage (21 days at 4°C) of vegetable (CJ and TJ) and fruit (ChJ and PJ) juices. Changes in the amounts of the substrates and products (average ofthree replicates) are represented by histograms in which each strain is indicated on the x axes as follows: 1, CIL6; 2, C2; 3, POM1; 4, 1MR20; 5, DC400; and 6,CC3M8. The histograms marked with asterisks refer to changes in the amounts during storage. Different colored bars represent juices: ChJ (red), CJ (orange), TJ(yellow), and PJ (green). BcAT, branched-chain aminotransferase; KDC, -keto acid decarboxylase; ADH, alcohol dehydrogenase; MLE, malolactic enzyme;HDC, histidine decarboxylase; Q(S)DH, quinate/shikimate dehydrogenase; DHQD, 3-dehydroquinate dehydratase; SDH, shikimate dehydrogenase; SK I,shikimate kinase I; SK II, shikimate kinase II; EPSPS, EPSP synthase; CS, chorismate synthase; AK, acetate kinase; Pta, phosphotransacetylase; ALDH, acetalde-hyde dehydrogenase.
different chemical characteristics, TJ, PJ, and especially ChJ in-duced specific metabolic responses in almost all the strains duringfermentation. CJ did not exert the same selective pressure. Exceptfor POM1 in TJ and PJ, the responses of all the strains duringstorage were determined by the type of juice. Based on the meta-bolic responses that were induced by juices, strains might be se-lected for targeted fermentations. Some examples follow. StrainCIL6 was the most suitable strain to ferment ChJ because of thehigh survival, the capacity to consistently activate malolactic fer-mentation, the highest synthesis of diacetyl and GABA, and themetabolism of Tyr, which may positively influence the microbio-logical and sensory features of fermented cherries. Strain POM1could be selected to ferment TJ because of the greatest increase ofcell numbers and highest concentrations of FAA and GABA, thecatabolism of BCAA and His, and the capacity to consistentlyactivate the acetate kinase route. Almost the same suitable featureswere shown by strain POM1 during fermentation of PJ. As shownin Fig. 2B, POM1 was the only one that did not correlate with theother strains during fermentation of TJ and PJ. Overall, CJ seemedto be the juice in which all the strains behaved similarly, and C2was the strain that showed the highest survival during storage of allthe juices.
This study provided more in-depth knowledge on the meta-bolic mechanisms of growth and maintenance of L. plantarum,which depended on vegetable and fruit habitats and differed inpart from other well-described responses in other food ecosystems(e.g., dairy and sourdough products). The metabolic responses ofthe strains differed in part, which was helpful in selecting the mostsuitable starters for industrial-scale fermentation of targeted ma-trices.
REFERENCES1. Nyström T. 2004. Growth versus maintenance: a trade-off dictated by
2. Pirt S. 1965. The maintenance energy of bacteria in growing cultures.Proc. R. Soc. Lond. B Biol. Sci. 163:224 –231. http://dx.doi.org/10.1098/rspb.1965.0069.
3. Redon E, Loubiere P, Cocaign-Bousquet M. 2005. Transcriptome anal-ysis of the progressive adaptation of Lactococcus lactis to carbon starvation.J. Bacteriol. 187:3589 –3592. http://dx.doi.org/10.1128/JB.187.10.3589-3592.2005.
5. Rodrìguez H, Curiel JA, Landete JM, de Las Rivas B, de Felipe FL,Gòmez-Cordovés C. 2009. Food phenolics and lactic acid bacteria. Int. J.Food Microbiol. 132:79–90. http://dx.doi.org/10.1016/j.ijfoodmicro.2009.03.025.
6. Di Cagno R, Surico RF, Minervini G, Rizzello CG, Lovino R, Servili M,Taticchi A, Urbani S, Gobbetti M. 2011. Exploitation of sweet cherry(Prunus avium L.) puree added by stem infusion through fermentation byselected autochthonous lactic acid bacteria. Food Microbiol. 28:900 –909.http://dx.doi.org/10.1016/j.fm.2010.12.008.
7. Demir N, Bahçeci KS, Acar J. 2006. The effects of different initial Lacto-bacillus plantarum concentrations on some properties of fermented carrotjuice. J. Food Process. Preserv. 30:352–363. http://dx.doi.org/10.1111/j.1745-4549.2006.00070.x.
8. Di Cagno R, Surico RF, Siragusa S, De Angelis M, Paradiso A, Min-ervini F, De Gara L, Gobbetti M. 2008. Selection and use of autochtho-nous mixed starter for lactic acid fermentation of carrots, French beans ormarrows. Int. J. Food Microbiol. 127:220 –228. http://dx.doi.org/10.1016/j.ijfoodmicro.2008.07.010.
9. Di Cagno R, Surico RF, Paradiso A, De Angelis M, Salmon JC, BuchinS, De Gara L, Gobbetti M. 2009. Effect of autochthonous lactic acidbacteria starters on health-promoting and sensory properties of tomato
juices. Int. J. Food Microbiol. 128:473– 483. http://dx.doi.org/10.1016/j.ijfoodmicro.2008.10.017.
10. Di Cagno R, Cardinali G, Minervini G, Antonielli L, Rizzello CG,Ricciuti P, Gobbetti M. 2010. Taxonomic structure of the yeasts and lacticacid bacteria microbiota of pineapple (Ananas comosus L. Merr.) and useof autochthonous starters for minimally processing. Food Microbiol. 27:381–389. http://dx.doi.org/10.1016/j.fm.2009.11.012.
11. Filya I, Sucu E, Karabulut A. 2004. The effect of Propionibacterium acidi-propionici, with or without Lactobacillus plantarum, on the fermentationand aerobic stability of wheat sorghum and maize silages. J. Appl. Micro-biol. 97:818 – 826. http://dx.doi.org/10.1111/j.1365-2672.2004.02367.x.
12. Noonpakdee W, Sitthimonchai S, Panyim S, Lertsiri S. 2004. Expressionof the catalase gene catA in starter culture Lactobacillus plantarumTISTR850 tolerates oxidative stress and reduces lipid oxidation in fer-mented meat product. Int. J. Food Microbiol. 95:127–135. http://dx.doi.org/10.1016/j.ijfoodmicro.2004.01.020.
13. Bringel F, Quenee P, Tailliez P. 2001. Polyphasic investigation of thediversity within Lactobacillus plantarum related strains revealed two L.plantarum subgroups. Syst. Appl. Microbiol. 24:561–571. http://dx.doi.org/10.1078/0723-2020-00061.
14. Rodríguez H, Landete JM, de las Rivas B, Muñoz R. 2008. Metabolism offood phenolic acids by Lactobacillus plantarum CECT 748T. Food Chem.107:1393–1398. http://dx.doi.org/10.1016/j.foodchem.2007.09.067.
15. Helander IM, von Wright A, Mattila-Sandholm TM. 1997. Potential oflactic acid bacteria and novel antimicrobials against Gram-negative bac-teria. Trends Food Sci. Technol. 8:146 –150. http://dx.doi.org/10.1016/S0924-2244(97)01030-3.
16. Di Cagno R, Coda R, De Angelis M, Gobbetti M. 2013. Exploitation ofvegetables and fruits through lactic acid fermentation. Food Microbiol.33:1–10. http://dx.doi.org/10.1016/j.fm.2012.09.003.
17. Di Cagno R, De Angelis M, Limitone A, Minervini F, Simonetti MC,Buchin S, Gobbetti M. 2007. Cell-cell communication in sourdough lacticacid bacteria: a proteomic study in Lactobacillus sanfranciscensis CB1. Pro-teomics 7:2430–2446. http://dx.doi.org/10.1002/pmic.200700143.
18. Di Cagno R, De Pasquale I, De Angelis M, Gobbetti M. 2012. Acceler-ated ripening of Caciocavallo Pugliese cheese with attenuated adjuncts ofselected nonstarter lactobacilli. J. Dairy Sci. 95:4784 – 4795. http://dx.doi.org/10.3168/jds.2011-5283.
19. Slinkard K, Singleton VL. 1997. Total phenol analysis: automation andcomparison with manual methods. Am. J. Enol. Vitic. 28:49 –55.
20. Pai SC, Tsa YJ, Yang TI. 2001. pH and buffering capacity problemsinvolved in the determination of ammonia in saline water using the indo-phenol blue spectrophotometric method. Anal. Chim. Acta 434:209 –216.http://dx.doi.org/10.1016/S0003-2670(01)00851-0.
21. Zwietering MH, Jongeberger I, Roumbouts FM, Van ’t Riet K. 1990.Modelling of bacterial growth curve. Appl. Environ. Microbiol. 56:1875–1881.
22. Zeppa G, Conterno L, Gerbi V. 2001. Determination of organic acids,sugars, diacetyl, and acetoin in cheese by high-performance liquid chro-matography. J. Agric. Food. Chem. 49:2722–2726. http://dx.doi.org/10.1021/jf0009403.
23. Rizzello CG, Nionelli L, Coda R, De Angelis M, Gobbetti M. 2010. Effect ofsourdough fermentation on stabilisation, and chemical and nutritional char-acteristics of wheat germ. Food Chem. 119:1079–1089. http://dx.doi.org/10.1016/j.foodchem.2009.08.016.
24. Herrero M, García L, Díaz M. 2003. Malolactic bioconversion using aOenococcus oeni strain for cider production: effect of yeast extract supple-mentation. J. Ind. Microbiol. Biotechnol. 30:699 –704. http://dx.doi.org/10.1007/s10295-003-0102-9.
25. Biggerstaff JP, Le Puil M, Weidow BL, Prater J, Glass K, Radosevich M,White DC. 2006. New methodology for viability testing in environmentalsamples. Mol. Cell. Probes 20:141–146. http://dx.doi.org/10.1016/j.mcp.2005.11.006.
26. Kleerebezem M, Boekhorst J, van Kranenburg R, Molenaar D, KuipersO, Leer R, Tarchini R, Peters SA, Sandbrink HM, Fiers MWEJ,Stiekema W, Klein Lankhorst RM, Bron PA, Hoffer SM, Nierop GrootMN, Kerkhoven R, de Vries M, Ursing B, de Vos WM, Siezen RJ. 2003.Complete genome sequence of Lactobacillus plantarum WCFS1. Proc.Natl. Acad. Sci. U. S. A. 100:1990 –1995. http://dx.doi.org/10.1073/pnas.0337704100.
27. Beuchat LR. 1998. Surface decontamination of fruits and vegetables eatenraw: a review, p 42. In WHO document FSF/FOS/98.2. World HealthOrganization, Geneva, Switzerland.
Filannino et al.
2214 aem.asm.org Applied and Environmental Microbiology
28. Jay JM. 2000. Modern food microbiology, 6th ed, p 257. Chapman andHall, New York, NY.
29. Kubota H, Senda S, Tokuda H, Uchiyama H, Nomura N. 2009. Stressresistance of biofilm and planktonic Lactobacillus plantarum subsp. plan-tarum JCM 1149. Food Microbiol. 26:592–597. http://dx.doi.org/10.1016/j.fm.2009.04.001.
30. Henick-Kling T, Cox DJ, Olsen EB. 1991. Production de l’energie durantla fermentation malolactique. Rev. Française Oenol. 132:63– 66.
31. Henick-Kling T. 1986. Growth and metabolism of Leuconostoc oenos andLactobacillus plantarum in wine. Ph.D. thesis, University of Adelaide, Ad-elaide, Australia.
32. Kunkee RE. 1991. Some roles of malic acid in the malolactic fermentationin wine making. FEMS Microbiol. Lett. 88:55–72.
33. Teusink B, Wiersma A, Jacobs L, Notebaart RA, Smid EJ. 2009. Un-derstanding the adaptive growth strategy of Lactobacillus plantarum by insilico optimisation. PLoS Comput. Biol. 5:e1000410. http://dx.doi.org/10.1371/journal.pcbi.1000410.
34. Passos FV, Fleming HP, Hassan HM, McFeeters RF. 2003. Effect of malicacid on the growth kinetics of Lactobacillus plantarum. Appl. Microbiol.Biotechnol. 63:207–211. http://dx.doi.org/10.1007/s00253-003-1375-7.
35. Goffin P, van de Bunt B, Giovane M, Leveau JHJ, Höppener-Ogawa S,Teusink B, Hugenholtz J. 2010. Understanding the physiology of Lacto-bacillus plantarum at zero growth. Mol. Syst. Biol. 6:413– 425. http://dx.doi.org/10.1038/msb.2010.67.
36. Fernandez M, Zúñiga M. 2006. Amino acid catabolic pathways of lacticacid bacteria. Crit. Rev. Microbiol. 32:155–183. http://dx.doi.org/10.1080/10408410600880643.
37. Christensen JE, Dudley EG, Pederson JA, Steele JL. 1999. Peptidases andamino acid catabolism in lactic acid bacteria. Antonie Van Leeuwenhoek76:217–246. http://dx.doi.org/10.1023/A:1002001919720.
38. Di Cagno R, Mazzacane F, Rizzello CG, De Angelis M, Giuliani G,Meloni M, De Servi B, Gobbetti M. 2010. Synthesis of �-aminobutyricacid (GABA) by Lactobacillus plantarum DSM19463: functional grapemust beverage and dermatological applications. Appl. Microbiol. Biotech-nol. 86:731–741. http://dx.doi.org/10.1007/s00253-009-2370-4.
39. Su MS, Schlicht S, Gänzle MG. 2011. Contribution of glutamate decar-boxylase in Lactobacillus reuteri to acid resistance and persistence in sour-dough fermentation. Microb. Cell Fact. 10:S8. http://dx.doi.org/10.1186/1475-2859-10-S1-S8.
40. Molenaar D, Hagting A, Alkema H, Driessen AJM, Konings WN. 1993.Characteristics and osmoregulatory roles of uptake systems for prolineand glycine betaine in Lactococcus lactis. J. Bacteriol. 175:5438 –5444.
41. Farías ME, Manca de Nadra MC, Rollán GC, Strasser de Saad AM.
1995. Histidine decarboxilase production by Lactobacillus hilgardii: effectof organic acids. Curr. Microbiol. 31:15–18. http://dx.doi.org/10.1007/BF00294627.
42. Johansson L, Lidén G. 2006. Transcriptome analysis of a shikimic acidproducing strain of Escherichia coli W3110 grown under carbon- andphosphate-limited conditions. J. Biotechnol. 126:528 –545. http://dx.doi.org/10.1016/j.jbiotec.2006.05.007.
43. Kumagai H, Yamada H, Matsui H, Ohkishi H, Ogata K. 1970. Tyrosinephenol lyase. J. Biol. Chem. 245:1767–1772.
44. Buttery RG, Ling LC. 1993. Volatile components of tomato fruit andplant parts: relationship and biogenesis, p 22–33. In Teranishi R, ButteryRG, Sugisawa H (ed), Bioactive volatile compounds from plants. ASC,Washington, DC.
45. Fernández M, Kleerebezem M, Kuipers OP, Siezen RJ, van KranenburgR. 2002. Regulation of the metC-cysK operon, involved in sulfur metabo-lism in Lactococcus lactis. J. Bacteriol. 184:82–90. http://dx.doi.org/10.1128/JB.184.1.82-90.2002.
46. Guerzoni ME, Vernocchi P, Ndagijimana M, Gianotti A, Lanciotti R.2007. Generation of aroma compounds in sourdough: effects of stressexposure and lactobacilli-yeasts interactions. Food Microbiol. 24:139 –148. http://dx.doi.org/10.1016/j.fm.2006.07.007.
47. Vermeulen N, Gänzle MG, Vogel RF. 2007. Glutamine deamidation bycereal-associated lactic acid bacteria. J. Appl. Microbiol. 103:1197–1205.http://dx.doi.org/10.1111/j.1365-2672.2007.03333.x.
48. Vernocchi P, Ndagijimana M, Serrazanetti D, Gianotti A, Vallicelli M,Guerzoni E. 2008. Influence of starch addition and dough microstructureon fermentation aroma production by yeasts and lactobacilli. Food Chem.108:1217–1225. http://dx.doi.org/10.1016/j.foodchem.2007.06.050.
49. Chambellon E, Rijnen L, Lorquet F, Gitton C, van Hylckama Vlieg JE,Wouters JA, Yvon M. 2009. The D-2-hydroxyacid dehydrogenase incor-rectly annotated PanE is the sole reduction system for branched-chain2-keto acids in Lactococcus lactis. J. Bacteriol. 191:873– 881. http://dx.doi.org/10.1128/JB.01114-08.
50. Molimard P, Spinnler HE. 1996. Review: compounds involved in theflavor of surface mold-ripened cheeses: origins and properties. J. Dairy Sci.79:169 –184. http://dx.doi.org/10.3168/jds.S0022-0302(96)76348-8.
51. Gänzle M, Vermeulen N, Vogel RF. 2007. Carbohydrate, peptide andlipid metabolism of lactic acid bacteria in sourdough. Food Microbiol.24:128 –138. http://dx.doi.org/10.1016/j.fm.2006.07.006.
52. García-Quintáns N, Repizo G, Martín M, Magni C, López P. 2008.Activation of the diacetyl/acetoin pathway in Lactococcus lactis subsp. lactisbv. diacetylactis CRL264 by acidic growth. Appl. Environ. Microbiol. 74:1988 –1996. http://dx.doi.org/10.1128/AEM.01851-07.