Metadata of the article that will be visualized in OnlineFirst 1 Article Title Genetic diversity of the endemic honeybee: Apis mellifera unicolor (Hymenoptera: Apidae) in Madagascar 2 Article Sub- Title 3 Article Copyright - Year INRA, DIB and Springer-Verlag France 2015 (This will be the copyright line in the final PDF) 4 Journal Name Apidologie 5 Corresponding Author Family Name Delatte 6 Particle 7 Given Name Hélène 8 Suffix 9 Organization CIRAD, UMR PVBMT 10 Division 11 Address 7, chemin de l’IRAT, Saint Pierre 97410, La Réunion, France 12 e-mail [email protected]13 Author Family Name Rasolofoarivao 14 Particle 15 Given Name Henriette 16 Suffix 17 Organization CIRAD, UMR PVBMT 18 Division 19 Address 7, chemin de l’IRAT, Saint Pierre 97410, La Réunion, France 20 Organization Université d’Antananarivo 21 Division Département d’Entomologie, Faculté de Sciences 22 Address B.P. 906, Antananarivo 101, Madagascar 23 Organization Université de La Réunion, UMR PVBMT 24 Division 25 Address Saint Denis CEDEX 9 97715, La Réunion, France 26 e-mail 27 Author Family Name Clémencet 28 Particle 29 Given Name Johanna
Transcript
Metadata of the article that will be visualized in OnlineFirst
1 Article Title Genetic div ersity of the endemic honeybee: Apis mellifera
unicolor (Hymenoptera: Apidae) in Madagascar
2 Article Sub- Title
3 Article Copyright -Year
INRA, DIB and Springer-Verlag France 2015(This will be the copyright line in the final PDF)
4 Journal Name Apidologie
5
Corresponding
Author
Family Name Delatte
6 Particle
7 Given Name Hélène
8 Suffix
9 Organization CIRAD, UMR PVBMT
10 Division
11 Address 7, chemin de l’IRAT, Saint Pierre 97410, LaRéunion, France
19 Address 7, chemin de l’IRAT, Saint Pierre 97410, LaRéunion, France
20 Organization Université d’Antananarivo
21 Division Département d’Entomologie, Faculté de Sciences
22 Address B.P. 906, Antananarivo 101, Madagascar
23 Organization Université de La Réunion, UMR PVBMT
24 Division
25 Address Saint Denis CEDEX 9 97715, La Réunion, France
26 e-mail
27
Author
Family Name Clémencet
28 Particle
29 Given Name Johanna
30 Suffix
31 Organization Université de La Réunion, UMR PVBMT
32 Division
33 Address Saint Denis CEDEX 9 97715, La Réunion, France
34 e-mail
35
Author
Family Name Techer
36 Particle
37 Given Name Maév a Angélique
38 Suffix
39 Organization CIRAD, UMR PVBMT
40 Division
41 Address 7, chemin de l’IRAT, Saint Pierre 97410, LaRéunion, France
42 Organization Université de La Réunion, UMR PVBMT
43 Division
44 Address Saint Denis CEDEX 9 97715, La Réunion, France
45 e-mail
46
Author
Family Name Rav aomanariv o
47 Particle
48 Given Name Lala Hariv elo Rav eloson
49 Suffix
50 Organization Université d’Antananarivo
51 Division Département d’Entomologie, Faculté de Sciences
52 Address B.P. 906, Antananarivo 101, Madagascar
53 e-mail
54
Author
Family Name Reynaud
55 Particle
56 Given Name Bernard
57 Suffix
58 Organization CIRAD, UMR PVBMT
59 Division
60 Address 7, chemin de l’IRAT, Saint Pierre 97410, LaRéunion, France
61 e-mail
62
Schedule
Received 1 October 2014
63 Revised 20 February 2015
64 Accepted 9 March 2015
65 Abstract Apis mellifera unicolor is a tropical honeybee endemic ofMadagascar. Comprehensive knowledge about its mitochondrialand nuclear genetic diversity and structuration was our mainpurpose. Samples of worker bees were collected from 867 coloniesin 76 sites in Madagascar and 1 reference population in SouthAfrica. PCR-restriction fragment length polymorphism (RFLP) andsequencing were used to reveal variabil ity in the COI–COII mtDNAregion. Seventeen microsatell ite loci were used for studying thenuclear diversity. Three PCR-RFLP profiles were observed, amongwhich 99.4 % belonged to A1 haplotype, 0.2 % to a new Ahaplotype, and 0.4 % to A4 haplotype. In microsatell ite analysis,moderate genetic diversity values were found for Madagascar,together with low mean number of alleles ranging from 2.47 to3.88 compared to South Africa. Bayesian clustering assignmentmethods and principal component analysis (PCA) separatedpopulations into two genetic clusters which matched withgeographic areas. Several hypotheses are discussed regarding tothe low genetic diversity of A. m. unicolor in its native range.
Henriette Rasolofoarivao holds an Ir degree, CIRAD, UMR PVBMT.Johanna Clémencet holds a PhD degree, Université de LaRéunion, UMR PVBMT.Maéva Angélique Techer holds an Ir degree, CIRAD, UMR PVBMT.Lala Harivelo Raveloson Ravaomanarivo holds a PhD degree,Université d’Antananarivo.Bernard Reynaud holds a PhD degree, CIRAD, UMR PVBMT.Helene Delatte holds a PhD degree, CIRAD, UMR PVBMT.
The online version of this article (doi:10.1007/s13592-015-0362-1)contains supplementary material, which is available to authorizedusers.
Div ersité génétique d'une abeille endémique de Madagascar:Apis mellifera unicolor (Hymenoptera: Apidae)Microsatellite / lignée africaine / ADNmt / aire de répartition /haplotypeGenetische Div ersität der endemischen Honigbiene v onMadagaskar, Apis mellifera unicolor (Hymenoptera: Apidae)Apis mellifera unicolor / Mikrosatelliten / Afrikanische Lineage /genetische Div ersität / mtDNA
Electronic supplementary material
ESM 1(PDF 1211 kb)
UNCORRECTEDPROOF
UNCORRECTEDPROOF
1Q1
2 Genetic diversity of the endemic honeybee: Apis mellifera3 unicolor (Hymenoptera: Apidae) in Madagascar
4 Henriette RASOLOFOARIVAO1,2,3
, Johanna CLÉMENCET3,Q2 Maéva Angélique TECHER
1,3,
5 Lala Harivelo Raveloson RAVAOMANARIVO2, Bernard REYNAUD
1, Hélène DELATTE
1
6 1Q3 CIRAD, UMR PVBMT, 7, chemin de l’IRAT, 97410, Saint Pierre, La Réunion, France7 2Département d’Entomologie, Faculté de Sciences, Université d’Antananarivo, B.P. 906, 101, Antananarivo,Madagascar8 3Université de La Réunion, UMR PVBMT, 97715, Saint Denis CEDEX 9, La Réunion, France
9 Received 1 October 2014 – Revised 20 February 2015 – Accepted 9 March 2015
10
11 Abstract – Apis mellifera unicolor is a tropical honeybee endemic ofMadagascar. Comprehensive knowledge about12 its mitochondrial and nuclear genetic diversity and structuration was our main purpose. Samples of worker bees were13 collected from 867 colonies in 76 sites in Madagascar and 1 reference population in South Africa.Q4 PCR-restriction14 fragment length polymorphism (RFLP) and sequencing were used to reveal variability in the COI–COII mtDNA15 region. Seventeen microsatellite loci were used for studying the nuclear diversity. Three PCR-RFLP profiles were16 observed, among which 99.4 % belonged to A1 haplotype, 0.2 % to a newA haplotype, and 0.4% to A4 haplotype. In17 microsatellite analysis, moderate genetic diversity values were found for Madagascar, together with low mean number18 of alleles ranging from 2.47 to 3.88 compared to South Africa. Bayesian clustering assignment methods and principal19 component analysis (PCA) separated populations into two genetic clusters which matched with geographic areas.20 Several hypotheses are discussed regarding to the low genetic diversity of A. m. unicolor in its native range.
25 Apis mellifera subspecies are the most econom-26 ically valuable pollinators of crop monocultures
27worldwide (Klein et al. 2007). In addition, honeybee28contribution to floral biodiversity and conservation29through pollination is estimated to affect 80 % of30wild flora (Batra 1995; De la Rua et al. 2009).31Remarkable morpho-geographical differentia-32tions are found throughout honeybee distribution33areas; 28 subspecies are endemic to Africa, Eu-34rope, and Middle East (Ruttner et al. 1978;35Ruttner 1988; Sheppard et al. 1997; Sheppard36and Meixner 2003). Four evolutionary lineages37have been described based on phenotypes and38molecular traits (Garnery et al. 1992, 1993;39Estoup et al. 1995; Franck et al. 2000, 2001;40Alburaki et al. 2013).41In Africa, 11 subspecies are found from all42lineages except from the C lineage (Hepburn and43Radloff 1998;Meixner et al. 2011). The AfricanA44lineage is native to Africa and subspecies include45Apis mellifera scutellata (Lepeletier 1836), Apis46mellifera capensis (Eschscholtz 1822), and Apis47mellifera unicolor (Latreille 1804).
Electronic supplementary material The online version ofthis article (doi:10.1007/s13592-015-0362-1) containssupplementarymaterial, which is available to authorized users.
Corresponding author: H. Delatte, [email protected] editor: Marina MeixnerHenriette Rasolofoarivao holds an Ir degree, CIRAD,UMR PVBMT.Johanna Clémencet holds a PhD degree, Université deLa Réunion, UMR PVBMT.Maéva Angélique Techer holds an Ir degree, CIRAD,UMR PVBMT.Lala Harivelo Raveloson Ravaomanarivo holds a PhDdegree, Université d’Antananarivo.Bernard Reynaud holds a PhD degree, CIRAD, UMRPVBMT.Helene Delatte holds a PhD degree, CIRAD, UMRPVBMT.
Apidologie Original article* INRA, DIB and Springer-Verlag France, 2015DOI: 10.1007/s13592-015-0362-1
48 A. m. unicolor is the endemic subspecies of49 Madagascar, a drifted tropical island, located50 400 km off the East coast of Africa. Madagascar51 is among the five richest biodiversity hotspots of52 the world in terms of endemic plants and vertebrate53 species (Myers et al. 2000). However, less than54 10 % of its original habitat still remains (Myers55 et al. 2000). In such an area of endemism,with over56 80 % of endemic phanerogam (Ganzhorn et al.57 2001), the role of pollinating insects is vital for58 the reproduction of these plants. Although the pol-59 linating role of the honeybee has never been inves-60 tigated in detail for these floras, A. m. unicolor is61 thought to play a crucial role in the pollination of62 endemic phanerogam species (Ruttner 1975;63Q5 Ralalaharisoa-Ramamonjisoa et al. 1996).64 After molecular analysis, mitotype A1 was at-65 tributed to the honeybee of Madagascar, with a66 surprising absence of mitochondrial polymorphism67 within this endemic subspecies (Franck et al.68 2001). The latest molecular study using SNP anal-69 yses suggested that A. m. unicolor had a specific70 SNP (Whitfield et al. 2006). However, those as-71 sumptions were based on a low number of samples72 (<50) taken from regions of the vast territory of73 Madagascar. In terms of morphological and behav-74 ioral criteria, two ecotypes were described, the first75 from the highlands (Hauts Plateaux) and the sec-76 ond from the coastal area (Ruttner 1988).77 Since the recent arrival of the parasitic mite78 Varroa destructor documented in Madagascar in79 2010, severe colony losses have been observed80 (Rasolofoarivao et al. 2013). This situation may81 dramatically impact the biodiversity of Madagas-82 car. Therefore, considering the lack of genetic data83 and the threat to this subspecies, it appears neces-84 sary to improve our knowledge on A. m. unicolor85 genetic diversity in its native area.
86 2. MATERIAL AND METHODS
87 2.1. Area of study
88 The land area and relief of Madagascar gives rise to89 various climatic zones. The year is characterized by two90 distinct seasons: the austral winter (April to November)91 and the austral summer (December toMarch). The coastal92 zones enjoy a warm climate, and mean annual tempera-93 tures range between 22 and 25 °C. The upland areas of the
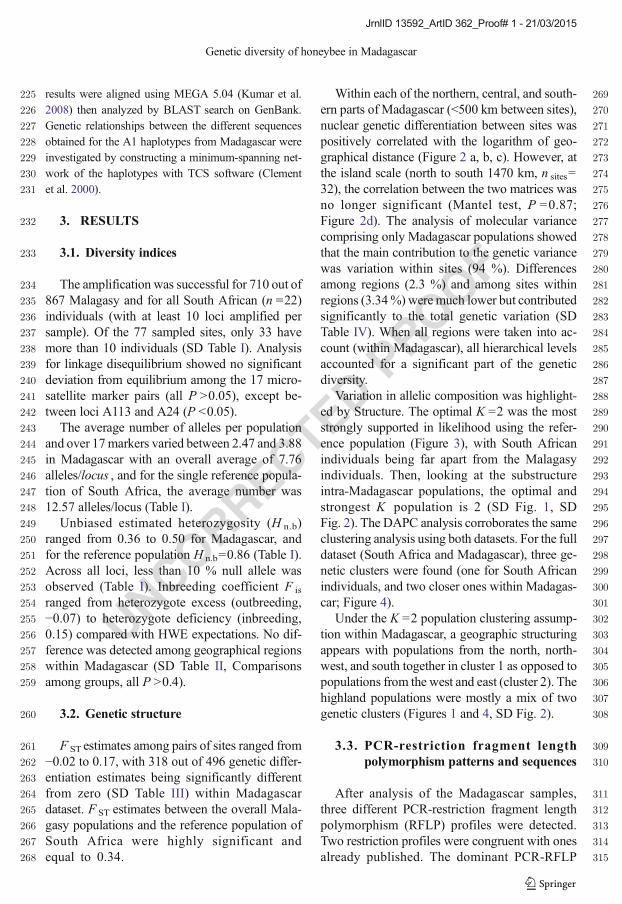
94island have a more temperate climate with a mean annual95temperature of 20 °C. Tropical forests mainly consist of96deciduous woodland in Western Madagascar and xero-97phytic thorn forests in the southern region (Figure 1).
982.2. Sampling
99One adult worker honeybee per colony was sampled100between August 2011 and March 2013 from 76 sites101(n =867) in Madagascar (Figure 1, SD Table I). Sam-102pling was performed on managed colonies and 33 wild103colonies (collected in Djamajar (S8) n =6, Antsoha (S7)104n =9, Rantolava (S24) n =3, and Tsararano (S21) n =10515). As a reference population from African lineage,106samples were collected from 22 managed colonies in107South Africa (one apiary from Cape region) in 2013.108Honeybees were preserved in ethanol (96%) and kept at109−20 °C until molecular analysis.
1102.3. DNA extraction
111The sixworker legswere used forDNA isolation.DNA112was extracted from individual honeybees as previously113described (Delatte et al. 2010). All individuals were sub-114jected to both microsatellite and mitochondrial analyses.
117Microsatellite population studies were carried out using11817 loci published in Solignac et al. (2003) and combined119into four different mixes (mix 1: A024, A113, Ac306,120Ap055, Ap081; mix 2: A (B)124, A028, A029, A088,121Ap273, Ap289; mix 3: Ap033, A035, Ap036; mix 4:122A014, Ap043, Ap066). PCR reactions were performed123in a 10 μL final reaction volume with a primer mix124(10 μM) using Type-it Multiplex PCR Master Mix125(Qiagen) kits. PCR programs were run with an initial126denaturation of 94 °C for 5 min, followed by 35 cycles127of denaturation at 94 °C for 30 s; annealing was 55 °C for12830 s for mix 1 and 52 °C for mixes 2–4, followed by129elongation at 72 °C for 30 to 45 s. A final extension was130done at 72 °C for 10 to 20 min.
Figure 1. Madagascar map with ecological zonationand honeybee sampling sites (emplacements of eachsite are presented in red polygons ). The 76 sites arespread in 6 geographic regions. Each number repre-sents a site with correspondence in Table I.
�
H. Rasolofoarivao et al.
JrnlID 13592_ArtID 362_Proof# 1 - 21/03/2015
UNCORRECTEDPROOF
North: dry deciduous forest, dry tropical climate
West: dry deciduous forest, hot tropical climate during dry season
Center: high land, sub humid forest, altitude tropical climate
East: wetter area of island, lowland forest, sub equatorial climate
South west: succulent woodlands, dry tropical climate
Genetic diversity of honeybee in Madagascar
JrnlID 13592_ArtID 362_Proof# 1 - 21/03/2015
UNCORRECTEDPROOF
131 Samples were further genotyped using an automated132 DNA sequencer (Applied Biosystems 3130XL) with133 capillaries. Allele sizes were scored using GeneMapper134 4.0 Software. Individuals with genotype data missing135 for more than 40 % of all loci were excluded from136 statistical analysis. Small sample sizes under 10 indi-137 viduals per site were not included in the nuclear genetic138 analysis at population level.
139 2.5. Microsatellite analysis
140 Observed (H o), expected (H e), and Nei’s 1987 un-141 biased expected (H n.b) heterozygosity and fixation in-142 dices (F is) (Q6 Weir et al. 1984) were estimated using143 Genepop 4.2 (Rousset 2008) and Genetix 4.05144 (Belkhir et al. 1996). All pairs of loci were tested for145 linkage disequilibrium using Genepop 4.2 (Rousset146 2008). Deviations from Hardy–Weinberg equilibrium147 (HWE) were tested using a two-tailed Fisher exact test148 based on Markov chain (Rousset 2008). Permutation149 tests conducted by FSTAT (Goudet 2001) determined150 whether genetic diversity (H e, H n.b, H o) and F is dif-151 fered significantly between geographical regions.152 FreeNA (Q7 Chapuis and Estoup 2007) was used to153 estimate null allele frequencies. Population differentia-154 tion was quantified by calculating pairwise F ST values155 (Weir and Cockerham 1984) and verifying their signif-156 icance through the permutational test in Genetix 4.05157 (Belkhir et al. 1996). Relationships between genetic and158 geographic distances at all sites were tested using the159 Mantel’s test in Genepop 4.2 (Rousset 2008). The sig-160 nificance of the correlation between matrices of geo-161 graphical and genetic distances among pairs of sites162 was tested using 1000 permutations of the data. As163 potential isolation by distance (ibd) patternsmay not hold164 over the entire range (1470 km), because at some point165 the influence of gene flow is expected to be weak relative166 to the influence of genetic drift and homoplasy167 (Hutchison and Templeton 1999), ibd patterns were in-168 vestigated at smaller spatial scales, i.e., in sites from the169 northern regions (500 km, n sites=7), the central regions170 (370 km, n sites=15), and southern regions of the island171 (380 km, n sites=9). We further investigated the impor-172 tance of scale on spatial genetic structuring by173 performing a hierarchical F analysis, which estimates174 the genetic variation found at each hierarchical level. A175 nested tree-level analysis of molecular variance176 (AMOVA, Excoffier and Lischer 2010) was performed177 by partitioning the total sum of squares into components
178representing variation between geographical regions,179among sites within regions and among individuals within180sites using Arlequin V3.5 (Excoffier and Lischer 2010).181Levels of population admixture were quantified182using a number of Bayesian clustering procedures as183implemented in Structure V2.3.4 (Pritchard et al. 2000).184The number of population clusters was inferred accord-185ing to Evanno et al. (2005) and the ad hoc statistic ΔK186was calculated for K ranging from 1 to 10 for the full187dataset comprising the reference population and 1 to 20188within the Madagascar dataset (1 million simulations189and 100,000 burn-in with 10 iterations for eachK ). This190ad hoc statistic was processed through the Structure191Harvester website (http://taylor0.biology.ucla.edu/192structureHarvester/). Clumpp v.1.1.2 (Jakobsson and193Rosenberg 2007) was used to align the best of the five194repetitions of the K . Distruct v.1.1 (Rosenberg 2004)195was used to graphically display the results. A principal196component analysis (PCA) was performed on the ge-197netic data to visualize genetic differentiation among the198population groups using adegenet 1.4 (Jombart 2008) in199R software (Team 2005). Adegenet 1.4 was also used to200check the dataset structure using an alternative cluster-201ing analysis with a discriminant analysis of principal202component (DAPC).
225 results were aligned using MEGA 5.04 (Kumar et al.226 2008) then analyzed by BLAST search on GenBank.227 Genetic relationships between the different sequences228 obtained for the A1 haplotypes from Madagascar were229 investigated by constructing a minimum-spanning net-230 work of the haplotypes with TCS software (Clement231 et al. 2000).
232 3. RESULTS
233 3.1. Diversity indices
234 The amplification was successful for 710 out of235 867 Malagasy and for all South African (n =22)236 individuals (with at least 10 loci amplified per237 sample). Of the 77 sampled sites, only 33 have238 more than 10 individuals (SD Table I). Analysis239 for linkage disequilibrium showed no significant240 deviation from equilibrium among the 17 micro-241 satellite marker pairs (all P >0.05), except be-242 tween loci A113 and A24 (P <0.05).243 The average number of alleles per population244 and over 17markers varied between 2.47 and 3.88245 in Madagascar with an overall average of 7.76246 alleles/locus , and for the single reference popula-247 tion of South Africa, the average number was248 12.57 alleles/locus (Table I).249 Unbiased estimated heterozygosity (H n.b)250 ranged from 0.36 to 0.50 for Madagascar, and251 for the reference population H n.b=0.86 (Table I).252 Across all loci, less than 10 % null allele was253 observed (Table I). Inbreeding coefficient F is
254 ranged from heterozygote excess (outbreeding,255 −0.07) to heterozygote deficiency (inbreeding,256 0.15) compared with HWE expectations. No dif-257 ference was detected among geographical regions258 within Madagascar (SD Table II, Comparisons259 among groups, all P >0.4).
260 3.2. Genetic structure
261 F ST estimates among pairs of sites ranged from262 −0.02 to 0.17, with 318 out of 496 genetic differ-263 entiation estimates being significantly different264 from zero (SD Table III) within Madagascar265 dataset. F ST estimates between the overall Mala-266 gasy populations and the reference population of267 South Africa were highly significant and268 equal to 0.34.
269Within each of the northern, central, and south-270ern parts of Madagascar (<500 km between sites),271nuclear genetic differentiation between sites was272positively correlated with the logarithm of geo-273graphical distance (Figure 2 a, b, c). However, at274the island scale (north to south 1470 km, n sites=27532), the correlation between the two matrices was276no longer significant (Mantel test, P =0.87;277Figure 2d). The analysis of molecular variance278comprising only Madagascar populations showed279that the main contribution to the genetic variance280was variation within sites (94 %). Differences281among regions (2.3 %) and among sites within282regions (3.34%) were much lower but contributed283significantly to the total genetic variation (SD284Table IV). When all regions were taken into ac-285count (within Madagascar), all hierarchical levels286accounted for a significant part of the genetic287diversity.288Variation in allelic composition was highlight-289ed by Structure. The optimal K =2 was the most290strongly supported in likelihood using the refer-291ence population (Figure 3), with South African292individuals being far apart from the Malagasy293individuals. Then, looking at the substructure294intra-Madagascar populations, the optimal and295strongest K population is 2 (SD Fig. 1, SD296Fig. 2). The DAPC analysis corroborates the same297clustering analysis using both datasets. For the full298dataset (South Africa and Madagascar), three ge-299netic clusters were found (one for South African300individuals, and two closer ones within Madagas-301car; Figure 4).302Under the K =2 population clustering assump-303tion within Madagascar, a geographic structuring304appears with populations from the north, north-305west, and south together in cluster 1 as opposed to306populations from the west and east (cluster 2). The307highland populations were mostly a mix of two308genetic clusters (Figures 1 and 4, SD Fig. 2).
3093.3. PCR-restriction fragment length310polymorphism patterns and sequences
311After analysis of the Madagascar samples,312three different PCR-restriction fragment length313polymorphism (RFLP) profiles were detected.314Two restriction profiles were congruent with ones315already published. The dominant PCR-RFLP
Genetic diversity of honeybee in Madagascar
JrnlID 13592_ArtID 362_Proof# 1 - 21/03/2015
UNCORRECTEDPROOF
316 profile observed was the African A1 haplotype317 (99.4 %), which exhibited three lengths of
318fragments (∼47, 108, and 483 bp) (Franck et al.3192001). Another PCR-RFLP profile referred to as
t1:1Q9 Table I. Genetic diversity indices by sites.
t1:36 South Africa 77 Cape 22 0.84 0.86 0.83 0.031 12.57 0.03
For each site, indicated are as follows: their geographical region, number of individuals per site, expected heterozygosity (H e),expected unbiased heterozygosity (H n.b), observed heterozygosity (H o), estimate ofWright’s (Weir and Cockerham 1984) fixationindex (F is),mean number of allele (N br). Only sites with at least 10 individuals per apiary are considered
An mean null allele frequencya Deviations from HWE
H. Rasolofoarivao et al.
JrnlID 13592_ArtID 362_Proof# 1 - 21/03/2015
UNCORRECTEDPROOF
320 the A4 haplotype (∼47, 108, 192, and 483 bp) was321 found in three individuals in our sample, two from322 S66 and one from S23. Another notable profile323 was found in two individuals from S22 and S29324 (∼47, 108, 150, 350 bp). The total sizes of each325 haplotype ranged from 638 bp for A1, 830 bp for326 A4, and 655 bp for the new haplotype. Within the327 South African samples, two different PCR-RFLP328 profiles were detected: A1 haplotype (n =1) and329 A4 haplotype (n =21).330 A total of 173 samples collected in 49 sites331 were sequenced. A total of 18 different sequences332 were found with variable sequence sizes belong-333 ing to the A lineage (SD Table V). The 16 se-334 quences obtained for the A1 restriction profile335 have never been reported and were named336 A1_Mad1 to A1_Mad16 (accession numbers337 KF976992 to KF977009). These 16 sequences338 were characterized by one unit P 0 and one unit339 Q . The most frequent sequence, A1_Mad3, was
340present in all sites (n =121, 70 %). The sequences341of the two individuals exhibiting the new PCR-342RFLP haplotype (in S29, S22) cluster within the343A. m. unicolor group (it was subsequently named344A1_Mad13) and we propose to classify it as a345subtype of A1. The two other sequences346(A4_Mad1 and A4_Mad2) were genetically close347to the A4 haplotypes of A. m. scutellata (acces-348sion number FJ 477987 (Franck et al. 2001),349similarity=98 %) and found in two different re-350gions of the West coast of Madagascar (R4 and351R16) (SD Table V, SD Fig. 2). The A4 haplotypes352were characterized by one unit P 0 and two units353Q sequences.
3544. DISCUSSION
355Previous PCR-RFLP analyses performed on 48356individuals from Madagascar by several authors357(Garnery et al. 1992; Franck et al. 2001) detected
Figure 2. Relationship between logarithm of geographical distance and nuclear genetic differentiation as estimatedas F ST/(1−F ST), between a sites from the northern region only (n sites=7, P =0.014), b the southern region only(n sites=9, P =0.0027), c sites from Hauts Plateaux only (n sites=16, 120 combinations, Mantel test P =0.014), and dsites from all regions sampled in Madagascar (n sites=32, 496 combinations, Mantel test P =0.84).
Genetic diversity of honeybee in Madagascar
JrnlID 13592_ArtID 362_Proof# 1 - 21/03/2015
UNCORRECTEDPROOF
358 a single restriction profile (A1). The larger sam-359 pling scale of this study in Madagascar detected a360 new A1 restriction profile and the occurrence of
361an A4 restriction profile. The sequencing ap-362proach used in our study revealed mtDNA vari-363ability with 16 new sequences. Haplotype
Figure 3. Population structure and Euclidean distances among genetic clusters based on 17microsatellites loci. Top :Structure bar plots (K =2, 3, and 4) with 22 reference samples from South Africa and 710 individuals of Madagascarorganized by sampling sites (S1–76). Each horizontal bar represents one individual, and sites are delimited by blacklines . The height of each bar represents the probability of assignment to a genetic cluster (one color ). Bottom :PCAs among individual genotypes assigned to the different clusters (K =2, 3, and 4). Inertia percentage of each axisis indicated (using 232 variables).
H. Rasolofoarivao et al.
JrnlID 13592_ArtID 362_Proof# 1 - 21/03/2015
UNCORRECTEDPROOF
364 frequencies and network analyses suggested that365 divergences are quite recent (SD Fig. 3), with all366 A1 sequences in Madagascar diverging from the367 predominant one through one single mutation368 (except for A1Mad_12). The A1 haplotype is369 widespread. It was found in this study in South370 Africa, and it has also been reported in Morocco371 (De la Rua et al. 2006), Algeria (Chahbar et al.372 2013), Sudan (El-Niweiri and Moritz 2008), and373 in the Middle East (Alburaki et al. 2011). Three374 samples from A4 were found in the Western re-375 gion of Madagascar. Two of these samples show376 high genetic diversity compared to A4 published377 sequences. A4 haplotypes might probably result378 from ancestral introductions to the island together379 with ancestral A1, as both haplotypes (belonging380 to AI sublineage) are commonly distributed within381 the different African subspecies populations382 (Franck et al. 2001).
383The absence of haplotypes belonging to other384lineages in our study implies that introductions of385foreign queens are rare. This can be explained by386the fact that other subspecies i) if imported/387introduced were too few to be seen in our sampling,388ii) are not well adapted to this environment (climate389and specific endemic vegetation), or iii) are not390selected by traditional Malagasy beekeepers, A. m.391unicolor being easy to handle compared to other392much more aggressive subspecies like the African-393ized honeybee (Ruttner 1988; Winston 1992).394Madagascar populations were highly different395(F ST=0.34) to the reference population (compris-396ing A1 and A4 haplotypes). Furthermore, A. m.397unicolor has a poor allelic diversity in terms of398number of alleles for each population marker399(N br=2.47 to 3.88), in comparison to our refer-400ence population (N br=12.57) or even with other401studies performed on African honeybee
Figure 4. DAPC based on individual genotypes of Madagascar (n =710) and reference population of South Africa(n =22). Dots of different colors indicate honeybee samples from different genetic clusters (K =3). Inertia percent-age of each axis, PCs eigenvalues, and discriminant factors retained are indicated.
Genetic diversity of honeybee in Madagascar
JrnlID 13592_ArtID 362_Proof# 1 - 21/03/2015
UNCORRECTEDPROOF
402 populations with allelic diversity ranging from 7.9403 (A. m. capensis ) to 9 (Apis mellifera intermissa )404 and even 11 (A. m. scutellata ) (for 7 to 12 micro-405 satellite loci, withmost loci being the same in both406 studies) (Estoup et al. 1995).407 The levels of heterozygosity observed in Mala-408 gasy populations were also much lower than the409 reference population used in this study and those410 reported from African populations. Across Mada-411 gascar, levels varied from 0.34 to 0.47 (H e), while412 the reference populationH e=0.84, and the average413 He ranged between 0.78 and 0.90 (A. m. intermissa414 to A. m. scutellata) in African populations (Franck415 et al. 2001). In parallel, the lowest levels ranged416 from 0.26 to 0.66 inwestMediterranean subspecies417 (Apis mellifera iberiensis and Apis mellifera418 siciliana , respectively) (Garnery et al. 1998).419 High levels of nuclear polymorphism in African420 populations have been explained by i) quaternary421 climate changes that could be responsible for hon-422 eybee subspecies diversification and expansion in423 Africa (Franck et al. 2001), ii) larger effective424 population size (Estoup et al. 1995), allowing more425 alleles to be maintained, and iii) the high migratory426 behavior of colonies which is typical for African427 honeybees south of the Sahara (Hepburn and428 Radloff 1998; Jaffe et al. 2009). Allelic richness429 within populations can also be increased by intro-430 gression of foreign genes into zones with other431 subspecies. Due to the lack of data on the biology432 of the Malagasy subspecies, it is difficult to com-433 pare effective population size of A. m. unicolor to434 other subspecies. However, its insular situation435 prevents frequent natural introductions and may436 in part explain the low nuclear polymorphism.437 Both the significant pairwise F ST values observed438 between neighboring sites (i.e., S34–S35 only439 10 km apart, SD Table III) and the significant440 isolation by distance patterns observed among sites441 500 km apart (Figures 1 and 2) suggest that gene442 flow is restricted. The larger variance of F ST at443 longer distances (>500 km, Figure 2d) indicates444 that at the island scale, the influence of genetic drift445 is strong relative to gene flow (Hutchison and446 Templeton 1999) and that problems of homoplasy447 could be more important (Jarne and Lagoda 1996).448 As observed in A. m. capensis from South Africa,449 A. m. unicolor populations may be less mobile450 than other African subspecies (Estoup et al. 1995)
451because of the topography of the island (coastal vs.452Hauts Plateaux areas) and the climatic variations453between regions. Indeed this was underlined with454the results of Structure indicating genetic455subclustering of the observed populations into at456least two major clusters. The observed genetic457subclustering did not match the distribution of the458two honeybee ecotypes described by Ruttner459(1988). Furthermore, we found such an admixture460of genetic clusters between populations from dif-461ferent regions and the region surrounding the cap-462ital (on the Hauts Plateaux) that those ecotypes463might have been mixed in the recent past. Indeed,464in Madagascar, most goods pass through the capi-465tal, central market, and free commercial exchanges,466which facilitate honeybee movement. Transport467routes around the island are limited but all of them468lead to the capital.469Wild populations, uninfluenced by beekeeping,470exist in many regions of Africa, and honeybees471from natural habitats have been shown to have a472higher genetic diversity than managed populations473(Allsopp 2004), so more intensive studies of wild474colonies in protected and wild zones of Madagas-475car would be interesting to confirm or not our476findings on the genetic diversity of A. m. unicolor .477Several clues and hypotheses point out the fact478that A. m. unicolor might be derived from a recent479(in geological time) colonization event of this480continental island: i) relatively low mitochondrial481and nuclear genetic diversity were found on A. m.482unicolor in Madagascar, compared to other sub-483species of the A lineage (Estoup et al. 1995;484Franck et al. 1998, 2001). ii) The hypothesis on485molecular data showing A lineage split from other486lineages 6 million years ago with A. m. unicolor487divergence from other subspecies more recently488(1 million years ago) (Han et al. 2012). iii) The489prehistoric breakup of the supercontinent Gond-490wana which separatedMadagascar frommainland491Africa is dated much earlier (around 135 million492years ago; Rabinowitz et al. 1983) than the first493honeybee species.494Nevertheless, its morphological (two ecotypes)495and behavioral differences (one of the most gentle496honeybees in the world (Ruttner 1988)) from oth-497er African honeybees suggest that, such as the498flora of the island, A. m. unicolor seems to have499evolved in relative isolation. Furthermore, the low
H. Rasolofoarivao et al.
JrnlID 13592_ArtID 362_Proof# 1 - 21/03/2015
UNCORRECTEDPROOF
500 genetic diversity observed, if confirmed in wild501 and conserved areas, might also be the result of502 over 1400 years of high deforestation rates and503 habitat fragmentation on the island (Campbell504 1993; Gade 1996) which has been increasing over505 the last 50 years (Harper et al. 2007).506
507 ACKNOWLEDGMENTS508
509 We thank Ravelomanana A. for mapping sites with510 GIS and Simiand C. for technical help in the laboratory.511 We thank the following people for their help with data512 collection: Rousse P., Porphyre V. (and QualiREG net-513 working), Borsa C., Mandirola V., Andrianaivoariseta N.,514 Razafindrazaka D., Cattel J., Chesnais Q., ADEFA, and515 FENAM.We are grateful to theMalagasy beekeepers who516 participated in the study. We would like to thank Garnery517 L. for the fruitful discussions related to those genetic518 results. This work is part of the Ph.D. of Rasolofoarivao519 H., recipient of a grant of CIRAD-AIRD-Sud. Field work520 had been partly funded by CIRAD, the Enlargement and521 sustainability of the Plant ProtectionNetwork supported by522 the European Union, the French government, and the523 Région Réunion and the Département of la Réunion. In524 addition, we would like to thank the editor (M. Meixner)525 and the anonymous referees for their remarks that greatly526 improved our manuscript.527
528 Diversité génétique d'une abeille endémique de Mada-529 gascar: Apis mellifera unicolor (Hymenoptera:530 Apidae)
540 Alburaki, M., Moulin, S., Legout, H., Alburaki, A.,541 Garnery, L. (2011) Mitochondrial structure of eastern542 honeybee populations from Syria, Lebanon and Iraq.543 Apidologie 42 , 628–641
544 Alburaki, M., Bertrand, B., Legout, H., Moulin, S.,545 Alburaki, A., Sheppard, W.S., Garnery, L. (2013) A546 fifth major genetic group among honeybees revealed in547 Syria. BMC Genet. 14 (1), 117
548Allsopp, M.H. (2004) Cape honeybee (Apis mellifera549capensis Eschscholtz) and Varroa mite (Varroa550destructor Anderson & Trueman) threats to honeybees551and beekeeping in Africa. Int. J. Trop. Insect Sci. 24 ,55287–94
553Batra, S. (1995) Bees and pollination in our changing554environment. Apidologie 26 , 361
555Belkhir, K., Borsa, P., Chikhi, L., Raufaste, N., Bonhomme,556F. (1996) GENETIX 4.05, logiciel sous Windows TM557pour la génétique des populations. Laboratoire gé-558nome, populations, interactions. CNRS UMR 5000 ,5591996–2004
560Campbell, G. (1993) The Structure of Trade inMadagascar.561Int. J Afr. Hist. Stud. 26 , 111–148
562Chahbar, N., Munõz, I., Dall’Olio, R., De la Rua, P.,563Serrano, J., Doumandji, S. (2013) Population structure564of north african honeybees is influenced by both bio-565logical and anthropogenic factors. J. Insect Conserv.56617 , 385–392
567Chapuis, M.-P., Estoup, A. (2007) Microsatellite null al-568leles and estimation of population differentiation. Mol.569Biol. Evol. 24 (3), 621–631
570Clement, M., Posada, D., Crandall, K.A. (2000) TCS: a571computer program to estimate gene genealogies. Mol.572Ecol. 9 (10), 1657–1659
573De la Rua, P., Galian, J., Pedersen, B.V., Serrano, J. (2006)574Molecular characterization and population structure of575Apis mellifera from Madeira and the Azores.576Apidologie 37 , 699–708
577De la Rua, P., Jaffe, R., Dall’Olio, R., Munoz, I., Serrano, J.578(2009) Biodiversity, conservation and current threats to579European honeybees. Apidologie 40 (3), 263–284
580Delatte, H., Virgilio, M., Simiand, C., Risterucci, A.M., de581Meyer, M., Quilici, S. (2010) Isolation and characteriza-582tion of microsatellite markers from Bactrocera583cucurbitae (Coquillett). Mol. Ecol. Resour. 10 , 576–579
584El-Niweiri, M.A., Moritz, R.F. (2008) Mitochondrial dis-585crimination of honeybees (Apis mellifera ) of Sudan.586Apidologie 39 , 566–573
587Eschscholtz, J.F. (1822) Entomographien: Erste Lieferung.588Gedruckt und verlegt bei G. Reimer 42 p.
589Estoup, A., Garnery, L., Solignac,M., Cornuet, J.M. (1995)590Microsatellite Variation in Honey Bee (Apis-Mellifera591L) Populations - Hierarchical Genetic-Structure and592Test of the Infinite Allele and Stepwise Mutation593Models. Genetics 140 (2), 679–695
594Evanno, G., Regnaut, S., Goudet, J. (2005) Detecting the595number of clusters of individuals using the software596STRUCTURE: a simulation study. Mol. Ecol. 14 (8),5972611–2620
598Excoffier, L., Lischer, H.E.L. (2010) Arlequin suite ver 3.5:599a new series of programs to perform population genet-600ics analyses under Linux and Windows. Mol. Ecol.601Resour. 10 (3), 564–567
602Franck, P., Garnery, L., Solignac, M., Cornuet, J.M. (1998)603The origin of west European subspecies of honeybees604(Apis mellifera ): New insights from microsatellite and605mitochondrial data. Evolution 52 (4), 1119–1134
Genetic diversity of honeybee in Madagascar
JrnlID 13592_ArtID 362_Proof# 1 - 21/03/2015
UNCORRECTEDPROOF
606 Franck, P., Garnery, L., Solignac, M., Cornuet, J.M. (2000)607 Molecular confirmation of a fourth lineage in honey-608 bees from the Near East. Apidologie 31 (2), 167–180
609 Franck, P., Garnery, L., Loiseau, A., Oldroyd, B.P., Hep-610 burn, H.R., Solignac, M., Cornuet, J.M. (2001) Genet-611 ic diversity of the honeybee in Africa: microsatellite612 and mitochondrial data. Heredity 86 , 420–430
613 Gade, D.W. (1996) Deforestation and its effects in highland614 Madagascar. Mt. Res. Dev. 16 (2), 101–116
615 Ganzhorn, J.U., Lowry II, P.P., Schatz, G.E., Sommer, S.616 (2001) The biodiversity of Madagascar: one of the617 world’s hottest hotspots on its way out. Oryx 35 (4),618 346–348
619 Garnery, L., Cornuet, J.M., Solignac, M. (1992) Evolution-620 ary history of the honeybee Apis mellifera inferred from621 mitochondrial DNA analysis. Mol. Ecol. 1 (3), 145–154
622 Garnery, L., Solignac, M., Celebrano, G., Cornuet, J.M.623 (1993) A simple test using restricted PCR-amplified624 mitochondrial DNA to study the genetic structure of625 Apis mellifera L. Experientia 49 (11), 1016–1021
626 Garnery, L., Franck, P., Baudry, E., Vautrin, D., Cornuet, J.-627 M., Solignac, M. (1998) Genetic diversity of the west628 European honeybee (Apis mellifera mellifera and629 A. m. iberica ) I. Mitochondrial DNA. Gen. Sel. Evol.630 30 , S31–S47
631 Goudet J. (2001) Fstat, a Program to Estimate and Test632 Gene Diversities and Fixation Indices Version 2.9.3.,633 Available from http://www.unil.ch/izea/softwares/634 fstat.html
635 Han, F., Wallberg, A., Webster, M.T. (2012) From where636 did the Western honeybee (Apis mellifera ) originate?637 Ecol. Evol. 2 (8), 1949–1957
638 Harper, G.J., Steininger, M.K., Tucker, C.J., Juhn, D.,639 Hawkins, F. (2007) Fifty years of deforestation and640 forest fragmentation in Madagascar. Environ. Conserv.641 34 (4), 325
642 Hepburn, H.R., Radloff, S.E. (1998) Honeybees of Africa.643 Springer, Berlin, Heidelberg, New York. 379 p
644 Hutchison, D.W., Templeton, A.R. (1999) Correlation of645 pairwise genetic and geographic distance measure:646 inferring the relative influences of gene flow and drift647 on distribution of genetic variability. Evolution 53 ,648 1898–1914
649 Jaffe, R., Dietemann, V., Crewe, R.M., Moritz, R.F.A.650 (2009) Temporal variation in the genetic structure of651 a drone congregation area: an insight into the popula-652 tion dynamics of wild African honeybees (Apis653 mellifera scutellata ). Mol. Ecol. 18 (7), 1511–1522
654 Jakobsson, M., Rosenberg, N.A. (2007) CLUMPP: a clus-655 ter matching and permutation program for dealing with656 label switching and multimodality in analysis of pop-657 ulation structure. Bioinformatics 23 (14), 1801–1806
658 Jarne, P., Lagoda, P. (1996) Microsatellites, frommolecules659 to populations and back. Trends Ecol. Evol. 11 (10),660 424–429
661 Jombart, T. (2008) adegenet: a R package for the multivar-662 iate analysis of genetic markers. Bioinformatics663 24 (11), 1403–1405
664Klein, A.M., Vaissiere, B.E., Cane, J.H., Steffan-Dewenter,665I., Cunningham, S.A., Kremen, C., Tscharntke, T.666(2007) Importance of pollinators in changing land-667scapes for world crops. Proc. R. Soc. B Biol. Sci.668274 (1608), 303
669Kumar, S., Nei, M., Dudley, J., Tamura, K. (2008) MEGA:670a biologist-centric software for evolutionary analysis671ofDNA and protein sequences. Brief. Bioinform. 9 (4),672299–306
673Latreille, P.A. (1804) Notice des espèces d’abeilles vivant674en grande société, ou abeilles proprement dites, et675description d’espèces nouvelles. Ann. Mus. Natl. Hist.676Nat. 5 , 161–178
677Lepeletier, A. (1836) Histoire Naturelle des Insectes.678Hymenoptères, Paris, Roret. 644 p
679Meixner, M.D., Leta, M.A., Koeniger, N., Fuchs, S. (2011)680The honey bees of Ethiopia represent a new subspecies681of Apis mellifera—Apis mellifera simensis n. ssp.682Apidologie 42 (3), 425–437
686Pritchard, J.K., Stephens, M., Donnelly, P. (2000) Inference687of population structure using multilocus genotype data.688Genetics 155 (2), 945–959
689Rabinowitz, P.D., Coffin, M.F., Falvey, D. (1983)690The separation of Madagascar and Africa. Science691220 , 67–69
692Ralalaharisoa-Ramamonjisoa Z., Ralimananai H.,693Lobreau-Callen D. (1996) Comportement de butinage694d’Apis mellifera var Unicolor (HYMENOPTERA,695APIDAE) dans divers biotopes. Biogéographie de696Madagascar, 517–522.
697Rasolofoarivao, H., Clemencet, J., Raveloson-698Ravaomanarivo, L.H., Razafindrazaka, D., Reynaud,699B., Delatte, H. (2013) Spread and strain determination700of Varroa destructor (Acari: Varroidea) in Madagascar701since its first description in 2010. Exp. Appl. Acarol.70260 (4), 521–530
703Rosenberg, N.A. (2004) DISTRUCT: a program for the704graphical display of population structure. Mol. Ecol.705Notes 4 (1), 137–138
706Rousse t , F. (2008) Genepop ‘007: a complete707reimplementation of the Genepop software for Win-708dows and Linux. Mol. Ecol. Resour. 8 , 103–106
709Ruttner, F. (1975) Races of bees. In: Sons Dadant (ed.) The710Hive and the Honeybee, pp. 19–38. Dadant, publ,711Hamilton
712Ruttner, F. (1988) Biogeography and taxonomy of honey-713bees. Springer, Berlin, Germany. 284 p
714Ruttner, F., Tassencourt, I., Louveaux, J. (1978)715Biometrical-statistical analysis of the geographic vari-716ability of Apis mellifera L. Apidologie 9 , 363–381
717Sheppard, W.S., Meixner, M.D. (2003) Apis mellifera718pomonella , a new honeybee subspecies from Central719Asia. Apidologie 34 (4), 367–376
720Sheppard, W., Arias, M., Grech, A., Meixner, M.721(1997) Apis mellifera ruttneri , a new honeybee
722 subspecies from Malta. Apidologie 28 (5), 287–723 293
724 Solignac, M., Vautrin, D., Loiseau, A., Mougel, F., Baudry,725 E., Estoup, A., Garnery, L., et al. (2003) Five hundred726 and fifty microsatellite markers for the study of the727 honeybee (Apis mellifera L.) genome. Mol. Ecol.728 Notes 3 (2), 307–311
729 Team R.D.C. (2005) R: A language and environment for730 statistical computing. R Foundation for Statistical731 Computing, Vienna, Austria
732Weir, B.S., Cockerham, C.C. (1984) Estimating F-statistics733for the analysis of population structure. Evolution73438 (6), 1358–1370
735Whitfield, C.W., Behura, S.K., Berlocher, S.H., Clark,736A.G., Johnston, J.S., Sheppard, W.S., Smith, D.R.,737et al. (2006) Thrice out of Africa: ancient and recent738expansions of the honeybee, Apis mellifera . Science739314 , 642–645
740Winston M. (1992) Killer bees. The Africanized honeybee741in the Americas. Harvard University Press, 162 p.
742
Genetic diversity of honeybee in Madagascar
JrnlID 13592_ArtID 362_Proof# 1 - 21/03/2015
UNCORRECTEDPROOF
AUTHOR QUERIES
AUTHOR PLEASE ANSWER ALL QUERIES.
Q1. Springer offers the possibility to send copies of your article to colleagues.Please supply up to 10 names and e-mail addresses of colleagues, and we willsend a PDF copy of your paper to each of them.
Q2. Please check captured author names Maéva Angélique Techer and LalaHarivelo Raveloson Ravaomanarivo if presented correctly.
Q3. Please check captured affiliations if presented correctly. Otherwise, pleaseadvise us on how to proceed.
Q4. Please check if the captured expansion for RFLP is correct. Otherwise, pleaseamend.
Q5. The citation “Ralalaharisoa-Ramamonjisoa, 1996” (original) has beenchanged to “Ralalaharisoa-Ramamonjisoa et al. 1996”. Please check ifappropriate.
Q6. “Weir et al., 1984” is cited in text but not given in the reference list. Pleaseprovide details in the list.
Q7. The citation “Chapuis et al., 2007” (original) has been changed to “Chapuisand Estoup 2007”. Please check if appropriate.
Q8. Please check if the captured expansion for the unit "μL" is correct.Q9. Please check if the table is presented correctly. Otherwise, please amend.