43
METALCASTING INDUSTRY E E N N E E R R G G Y Y B B E E S S T T P P R R A A C C T T I I C C E E GUIDEBOOK

METALCASTING INDUSTRY
EENNEERRGGYY BBEESSTT PPRRAACCTTIICCEE
GUIDEBOOK
Metal Casting Industry Energy Best Practice Guidebook
Provided By:
Focus on Energy, a statewide service, provides technical expertise, training and financial incentives to help implement innovative energy management projects. We place emphasis on helping implement
projects that otherwise would not get completed, or to complete projects sooner than scheduled. Our efforts help Wisconsin residents and businesses manage rising energy costs, protect our environment
and control the state’s growing demand for electricity and natural gas.
Prepared by:
Science Applications International Corporation CleanTech Partners, Inc.
Safety and Industrial Engineering Service Kestrel Management Services, LLC
2006
Special thanks to the Wisconsin Cast Metal Association
This guidebook in whole is the property of the State of Wisconsin, Department of Administration, Division of Energy, and was funded through the FOCUS ON ENERGY Program.

Focus on Energy © 2006
ii
TABLE OF CONTENTS
FORWARD ......................................................................................................... 1 Development of the Guidebook----------------------------------------------------------------------------1
Special Thanks to the Wisconsin Cast Metals Association-----------------------------------------1
EXECUTIVE SUMMARY..................................................................................... 2 How to Use the Guidebook ---------------------------------------------------------------------------------3
ENERGY USE IN THE METALCASTING INDUSTRY........................................ 4 Benchmarking a Facility -------------------------------------------------------------------------------------4
MANAGEMENT BEST PRACTICES .................................................................. 7 Steps to Getting Started -------------------------------------------------------------------------------------7
TECHNICAL BEST PRACTICES...................................................................... 14 Invert Pouring Ladles During Preheat / Standby ----------------------------------------------------16
Use Exhaust to Preheat Combustion Air --------------------------------------------------------------17
Use VSD’s on Variably Use/Loaded Motors----------------------------------------------------------18
Recover Exhaust Heat -------------------------------------------------------------------------------------19
Modulate Electric Furnace Exhaust---------------------------------------------------------------------20
Improve Mold Yield to Reduce Metal Melt ------------------------------------------------------------21
Scrap Reduction to Reduce Metal Poured------------------------------------------------------------23
Convert Shell Sand to Cold Box Core Making -------------------------------------------------------25
Reduce Time Induction Furnace Cover is Open ----------------------------------------------------27
Optimize Induction Furnace Tap Temperature ------------------------------------------------------28
Clean Foundry Returns to Minimize Melt Energy ---------------------------------------------------30
Use Cleaned Dust Collector Air as Make-Up Air ----------------------------------------------------31
PARTNER SURVEY SUMMARY ...................................................................... 32
REFERENCES AND FURTHER RESOURCES................................................ 36 Appendix A: Best Practices Check List ----------------------------------------------------------------37
Appendix B: Additional Resources for the Metal Casting Industry -----------------------------39

Focus on Energy © 2006
1
FORWARD
Development of the Guidebook
Jim Bettinghaus, P.E., President, Safety & Industrial Engineering Services, Inc., a Waukesha, Wisconsin based engineering consulting firm specializing in metal casting engineering projects. He has been involved for more than 40 years in management and engineering in the metal casting industry with special emphasis on cost reduction programs.
Thomas P. Kunes, P.E., Principal Owner, Kestrel Management Services, LLC, a Madison, Wisconsin based consulting firm that works with industrial companies in management system design, improvement and implementation; risk and liability management; and process improvement. Mr. Kunes has worked with the metal casting industry for more that 30 years, assisting in the design and implementation of processes and practices for more reliable and efficient management of environmental compliance, safety, quality and energy utilization.
John Nicol, P.E., SAIC, Industrial Program Manager for Focus on Energy’s Business Program – more than 20 years of experience in industrial energy efficiency.
Doug Presny, P.E. CleanTech Partners and SAIC. He finds and brings energy technologies to Wisconsin and optimize industrial energy efficiency. His background includes 18 years of energy efficiency experience as an industrial energy manager, an energy consultant for industry, a utility representative, and an analyst to identify, screen and commercialize emerging energy technologies.
Craig Schepp, SAIC, Focus on Energy, has over 25 years experience in the energy efficiency industry working with utility and government programs.
Nate Altfeather, SAIC, Focus on Energy Industrial Program
Special Thanks to the Wisconsin Cast Metals Association
We wish to extend our gratitude to Brian Mitchell and members of the Wisconsin Cast Metals Association. Their participation in the foundry surveys and review of this document was necessary for the creation of this guidebook.

Focus on Energy © 2006
2
EXECUTIVE SUMMARY
The Metal Casting Industry Energy Best Practice Guidebook provides Wisconsin metal casters a reference for reducing process energy used in metal casting. The guidebook contains individual best practice descriptions as well as tips for overcoming the most common barriers encountered during implementation of these practices.
The best practices described in this guidebook pertain to metal casting specifically and are intended to be used in conjunction with general industrial plant best practices found in the Practical Energy Management© guidebook also available from Focus on Energy at (608) 277-2946.
The information provided in the guidebook was identified and screened through site visits made to Wisconsin metal casting facilities. This guidebook will be updated as new best practices are identified and screened for applicability.
This guidebook contains the summary findings of a voluntary site survey completed by participating metal casting facilities. The final survey data is available on the accompanying CD-Rom.
Are You A World Class Energy User?
World class energy users have:
1. Received firm commitments from management for plant-wide improvements in energy efficiency and demand reduction
2. Aligned their energy using equipment decisions with their corporate goals
3. Baselined energy consumption in their plant
4. Benchmarked best practice opportunities
5. Defined a quantifiable, affordable energy reduction goal
6. Established a multi-year plan to meet their energy reduction goals
7. Identified the necessary internal and external resources to meet these goals and to provide feedback to continuously improve plan
If your plant lacks any of these essential ingredients, this Metal Casting Industry Energy Best Practice Guidebook will help you get there.

Focus on Energy © 2006
3
How to Use the Guidebook
The roadblocks to taking action on cost effective energy efficiency best practices were discussed during the site visits to metal casting facilities that participated in the development of this guidebook. Using the information in the guidebook will help you overcome these common roadblocks.
• Lack of time to seek out best practice opportunities
• Lack of metering to quantify the cost of operation for the status quo practice
• Uncertainty in quantifying both energy and non-energy benefits of new opportunities
• Lack of available staff time to pursue energy efficiency projects
To use this guidebook:
Step 1: Identify the financial criteria that your organization requires before a potential project is considered. Criteria may include payback, cash flow and limits on initial investment size.
Step 2: Identify other concerns and business needs that may be non-energy drivers for energy projects. For example, your company may be willing to pursue projects that exceed typical financial criteria if the project also addresses other concerns such as employee health, safety or production efficiency.
Step 3: Once the financial criteria and any possible non-energy operating concerns have been identified, decide which best practices in this guidebook meet the needs of your organization. At the beginning of the technical best practices section you will find a table listing the simple payback period for each practice and the potential non-energy benefits for each practice.
Step 4: Estimate the existing energy use of the targeted process. Use the included spreadsheet entitled Process Energy Cost Calculation Tool. This spreadsheet can be found in MS Excel format on the included CD-ROM. An Energy Advisor from Focus on Energy can also assist you with this step. Contact Focus on Energy at 608-277-2946 to find the advisor for your area.
Step 5: Estimate the energy use of the process after the proposed changes using the same spreadsheet. Complete the spreadsheet by entering the cost of energy in your area, calculate the dollar saving resulting from the reduction in energy consumption. Use this to calculate a preliminary simple payback. An Energy Advisor from Focus on Energy can also assist you with this step.
Step 6: Quantify non-energy benefits and add them to your energy savings. Materials are available to assist you organizing potential non-energy benefits on the CD-Rom included with this guidebook.
Step 7: Contact Focus on Energy to learn about potential energy efficiency financial incentives to support your planned projects and help you meet your company’s financial criteria.
Step 8: Assemble project information including the preliminary potential energy and non-energy benefits as well as the calculated financial figures. Present this information to the decision makers in your organization and be sure to mention available assistance from Focus on Energy.
Step 9: Develop a plan to continue to manage your energy use and uncover good opportunities – see section on “Management Best Practices”

Focus on Energy © 2006
4
ENERGY USE IN THE METALCASTING INDUSTRY
Metal casting is the fourth largest industry in Wisconsin and, based on a recent Focus on Energy report, accounts for approximately eight percent of energy use statewide. The industry has struggled in recent years, as a result of higher operating costs, and views cutting energy costs as a significant goal. Both the availability of capital and personnel are barriers to implementing energy efficient equipment and practices. In addition to wanting to improve energy efficiency, the metal casting industry has engendered an atmosphere of openness and idea-sharing, making industry-wide improvements more feasible. The industry, represented by the Wisconsin Cast Metals Association (WCMA), has given strong support and pledge of cooperation for continuation of the metal casting industry cluster initiative.
Benchmarking a Facility
It is often useful as a first step in developing an energy plan to benchmark your organization’s energy consumption against those considered to be the best in the industry. The difference between the benchmark standard and the current level of performance of one’s own facility represents the potential for improvement through the adoption of best practices. The volatile and upward trend of energy costs in today’s competitive, global business environment provides strong motivation for a company to shrink that gap.
Energy benchmarking can be viewed as a five-step process:
1. Determine the performance levels of top operating facilities
2. Determine the same performance levels for your own facility
3. Assess the gap between your facility and top performers
4. Identify the technologies, procedures and practices used by top performers that also could be applied at your facility
5. Adopt those identified best practices that will bring your facility in-line with top competitors
The following tables are taken from the US Department of Energy report, Theoretical / Best Practices Energy Use in Metalcasting Operations, J.F. Schifo and J.T. Radia 2004. The tables provide current industry energy use for different metal casting operations. The facilities selected for the sampling do not necessarily represent optimum energy use for these groups. The table values are for entire facility use, including electricity use, for lighting and natural gas use for space conditioning.
You can make a simple comparison by dividing your facility’s total electric bill by the shipped tons of product for your facility. Compare this value with the appropriate value in the table below to get an approximation of your potential energy efficiency savings. Even if your facility performs the same or better than the facility benchmarks in the table below, there may be opportunities in your facility.

Focus on Energy © 2006
5
Cast Iron Foundry Energy Use per Shipped Ton
Process Type Iron Type Electricity [kWh/Ton]
Natural Gas [therms/Ton]
Coke [MMBtu/Ton]
Total [MMBtu/Ton]
Cupola* Gray Iron 6,061 23.69 51.00 95.84
Cupola, Greensand Molding Gray Iron 4,065 10.69 38.43 64.24
Cupola, Greensand Molding Gray & Ductile 5,240 11.48 43.15 73.21
5,123 15.29 44.19 77.76
Cupola Greensand Average Gray & Ductile 8,862 49.17 53.31 133.61
Gray Iron Cupola Average 6,993 32.23 48.75 105.69
Induction* Gray Iron 34,573 58.90 176.87
Gray Iron Average** 20,782 45.56 24.38 141.28
Cupola* Ductile Iron 6,521 20.21 58.72 101.26
Cupola*, Centrifugal Ductile Pipe 1,342 26.48 27.87 59.82
Cupola, Centrifugal Ductile Pipe 1,709 31.17 27.37 65.4
Ductile pipe Avg. 1,527 28.83 27.62 62.61
Induction* Ductile Iron 25,037 59.70 145.13
Induction Greensand Molding Ductile-D 15,911 18.01 72.30
Induction Greensand Molding Ductile-D 16,391 16.24 72.17
Ductile-D Average 16,151 17.13 72.24
Ductile Average 20,594 38.41 108.68
* Participated in "Energy Use in Selected Metal Casting Facilities", DOE, 2003(2). Other facilities did not directly participate in the study
** Cupola melt shops shipments at 62% and Induction Melt 38% per modified numbers from EPA-453/R-2-013
Table 1

Focus on Energy © 2006
6
Steel Foundry Energy Use per Shipped Ton
Process Type
Natural Gas Therms/Ton (Btu x 10
5)
Electrical (kWh/Ton)
Total (Btu x 10
5)/Ton
Induction Melt, Stainless, Airset Molding* 267 65,706 491
Arc Melt, Low Carbon, Greensand and Airset* 115 27,021 207
Induction Melt, Low Carbon, Airset* 104 20,193 173
Average Steel (used only low carbon) 109 23,607 190 * Participated in "Energy Use in Selected Metal Casting Facilities", DOE, 2003(2). Other facilities did not directly participate in the study.
Aluminum Foundry Energy Use per Shipped Ton
Process Type
Natural Gas Therms/Ton (Btu x 10
5)
Electrical (kWh/Ton)
Total (Btu x
105)/Ton
High Pressure Die Casting* 253 19,346 319
High Pressure Die Casting, Automotive* 117 58,380 316
High Pressure Casting Average 185 38,864 317
Permanent Mold, Sand Casting** 598 35,526 719
Lost Foam, Automotive* 552 55,217 741 Adjusted Lost foam, Automotive 313 55,217 502
Estimated Non-automotive Lost Foam 211 51,853 388
Lost Foam Average 245 52,972 426 * Participated in "Energy Use in Selected Metal Casting Facilities", DOE, 2003(2). Other facilities did not directly participate in the study.
Table 2
Table 3

Focus on Energy © 2006
7
MANAGEMENT BEST PRACTICES
A metal casting facility can effectively manage its energy costs by first conducting an internal survey, audit or assessment, to identify energy saving opportunities and then by implementing the best practices to achieve the savings. A plan for periodic review and continual improvement will ensure that energy efficiency opportunities are exploited.
An effective energy management program:
• Provides a systematic approach to continually assess and reduce the energy costs of your facility
• Is proactive, not just reliant on "putting out fires" when energy costs increase
• Is more than an energy improvement project (a one-time event), but an on-going process
• Can be either a stand-alone effort devoted exclusively to energy management or part of an existing management program such as quality or environmental assurance management
The most successful energy management programs are developed and maintained by a team of individuals from various functions such as administration, engineering, maintenance, operations, finance and management, or if the system is medium- or small-sized, periodic reviews by a specialist can be valuable.
At first glance, creating and implementing an energy management program may seem to be an overwhelming task, pulling your attention away from the daily operations that keep your organization functioning. Yet making an effort up front can save you time, money and energy in both the short- and long-term. Once in place, your energy management program will deliver results year after year.
Energy efficiency is a good investment. Many energy efficiency projects provide a high return on investment (ROI) (as much as 100% or more) and are low risk. When compared to other investment opportunities, these projects can be very attractive. Typically you can achieve 10 % to 15 % energy cost savings in the first three years by implementing a systematic energy management program. The following are the first steps to get started with a systematic energy management approach. Focus on Energy, Wisconsin’s energy efficiency and renewable energy program, can assist you with completing any of these steps. Focus on Energy also has developed a set of tools called Practical Energy Management© that can make these steps even easier.
All procedures and figures in the following section and in the Management Best Practices folder of the enclosed CD are examples of tools included in the Practical Energy Management© approach available for FREE to eligible Wisconsin facilities from Focus on Energy. Call 608-
277-2946.
Steps to Begin
Step 1) Establish a Baseline Energy Use: Compile your monthly utility bills to develop an overall energy profile of your facility. Put energy in the context of overall organizational operations by comparing it to more widely tracked measures such as tons melted or tons shipped (see example in Table 4). Then graph energy use per month versus this measure (e.g., tons shipped). This will set your present baseline for energy use. Tracking energy consumption

Focus on Energy © 2006
8
over time provides an indication of the effectiveness of your energy efficiency efforts. Projecting usage forward provides a method to set targets and goals for energy use (see example in Table 5).
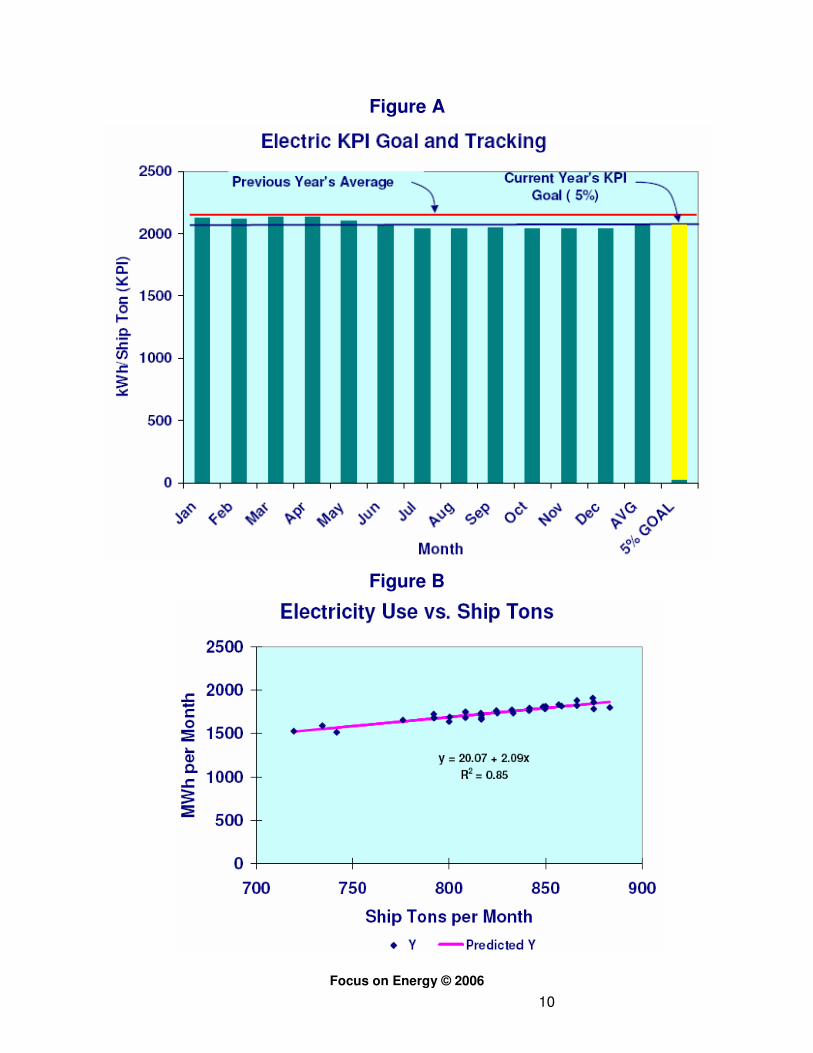
Next, develop your facility’s Energy Profile Summary, showing changes in consumption and Key Performance Indicators (KPI), by year (Figure A).
Track and graph your energy KPI for each month. This will set your present baseline and target for your energy KPI (see example in Figure B). Tracking this energy KPI over time gives an indication of the effectiveness of your energy efficiency efforts. Projecting the KPI forward provides a method to set targets and goals for energy use.
Step 2) Estimate Energy Use for Major Systems: Determine the energy used by major equipment and energy-using systems. This will point the way to your largest energy users and the best places to focus your attention.
Step 3) Identify Best Practice Opportunities: Best practices are techniques or technologies generally recognized as being economical and more energy efficient than common or typical practices. Review best practices in comparison to your existing equipment and system to identify opportunities for energy efficiency improvement. Recommended best practices for metal casting facilities are provided in the Technical Best Practices section. These practices apply to system retrofits as well as to new system designs. A checklist of best practices is provided in each best practice section for your use to copy and check off each best practice that is deemed as considered, determined feasible or implemented. Appendix A includes a list of additional best practices for ancillary end uses, such as lighting and compressed air systems.
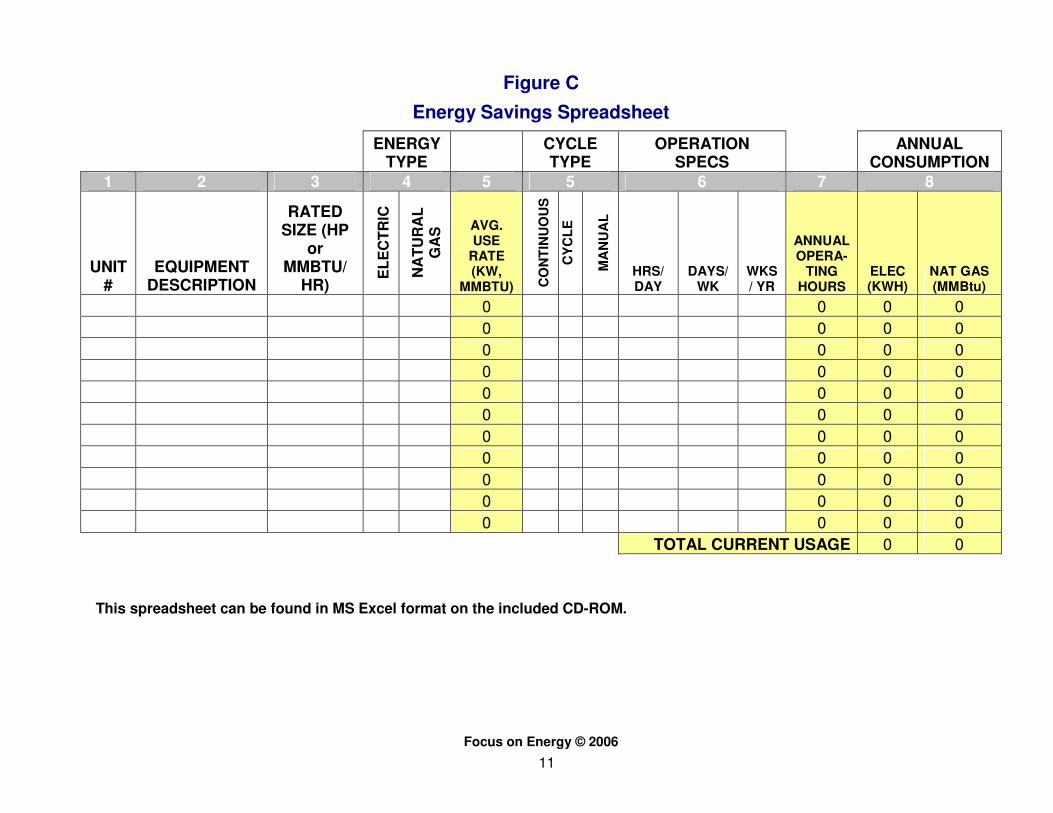
Step 4) Quantify Benefits and Costs of Best Practice Opportunities: Once the best practice opportunities are determined, the next step is to estimate the cost savings associated with each project including energy and maintenance, and the installed cost of the modification. Focus on Energy can provide technical assistance to estimate projected energy savings for projects. The Energy Savings Spreadsheet is one way to project estimated energy savings from a proposed energy efficiency project (Figure C). Make sure to include the indirect benefits and costs for projects. A tool to help you define both direct and non-energy benefits and costs can be found in the enclosed CD under “Annual Savings Resulting from Energy Saving Process Changes (Non-Energy and Energy)”
Step 5) Prioritize Projects: Apply criteria such as ROI, energy savings, associated process improvements or ease of installation to help you prioritize among all the possible energy saving opportunities identified. Select the modification for implementation that achieves the energy savings goals within time and budget constraints.
Step 6) Project Management: Manage each identified energy project as you would any other project within your organization by clearly defining the project parameters, assigning responsibilities for the project implementation and undertaking specific tasks needed to implement the project.
Note: The following figures and tables can be found in electronic format on the Management Best Practices folder of the enclosed CD-ROM
so that you can enter your own company data.

Focus on Energy © 2006
9
Table 4
Table 5
Focus on Energy © 2006
10
Figure A
Figure B
Focus on Energy © 2006
11
Figure C
Energy Savings Spreadsheet
ENERGY
TYPE CYCLE TYPE
OPERATION SPECS
ANNUAL CONSUMPTION
1 2 3 4 5 5 6 7 8
UNIT #
EQUIPMENT DESCRIPTION
RATED SIZE (HP
or MMBTU/
HR)
EL
EC
TR
IC
NA
TU
RA
L
GA
S AVG.
USE RATE (KW,
MMBTU) CO
NT
INU
OU
S
CY
CL
E
MA
NU
AL
HRS/ DAY
DAYS/ WK
WKS/ YR
ANNUAL OPERA-
TING HOURS
ELEC (KWH)
NAT GAS (MMBtu)
0 0 0 0
0 0 0 0
0 0 0 0
0 0 0 0
0 0 0 0
0 0 0 0
0 0 0 0
0 0 0 0
0 0 0 0
0 0 0 0
0 0 0 0
TOTAL CURRENT USAGE 0 0
This spreadsheet can be found in MS Excel format on the included CD-ROM.

Focus on Energy © 2006
12
Calculating Existing and Proposed Energy Consumption for a Process
The preceding spreadsheet (Figure C) is intended to assist in the estimation of energy savings from alterations of existing processes. The spreadsheet can be found in electronic MS Excel format on the enclosed CD-ROM. You can populate the spreadsheet on the CD with data from your facility and save it to your computer. The spreadsheet assumes an efficiency of 85% and a load of 65% for every energy consuming device entered. In order to account for efficiency improvement, you may need to adjust the cell-to-cell equations, as needed, on a case-by-case basis.
To calculate the process total energy:
1. First, list each piece of equipment that uses electricity or natural gas and its appropriate horse-power or Btu/hr rating in the process you are investigating
2. If the electricity is for resistance heating, enter the rated kW for that equipment in the AVG USE RATE column
3. Next, place an X in the energy type box for either electricity or natural gas
4. When ELECT box is checked, the AVG USE RATE cell automatically calculates the kW used by that motor
5. This calculation assumes a 65% load and an 85% motor efficiency
6. When the NAT GAS box is checked the rate is transferred to the AVG USE RATE cell
7. Enter the CYCLE TYPE and OPERATION SPECS. The hours of operation are critical for determining annual energy use
8. The ANNUAL CONSUMPTION is automatically calculated for electricity and natural gas. Note the total cost for later reference
9. After assessing each piece of equipment consider proposals to improve the operational efficiency of that equipment
10. Note any revisions to horsepower requirements, electrical consumption rates, Btu ratings and operation specifications and make the changes in the spreadsheet
11. Note the change in total annual cost and subtract from the original cost noted in Step 8

Focus on Energy © 2006
13
Steps for Ongoing Energy Management
Step 1) Strong commitment from Management: Critical to the success of long-term energy management is a strong commitment from the operations, administration, management and governing personnel. Without this, the time spent on other steps may not significantly enhance energy efficiency.
Step 2) Track Energy Saving Performance: An energy use value per unit (e.g., MWh/ton shipped) provides a measure of energy use per a critical factor. Tracking these values over time provides an indication of the effectiveness of your energy efficiency efforts. Projecting your forecasted savings forward provides a method to set targets and goals for energy use.
Step 3) Form an Energy Team: An energy team should be formed from personnel in operation, maintenance, administration, management, financing and governing. This team should meet periodically as needed to review progress on the energy management plan and set new direction as necessary to reach established goals.
Step 4) Develop a Long-Term Energy Management Plan: The first task for the Energy Team will be to develop a long-term Energy Management Plan. The plan should define the goals, tasks and responsibilities for implementing and operating an energy management program within your facility. You should also inform project and facility designers of your energy use goals to ensure consistency with the plan. Proper design and installation up front are less expensive that after-the-fact retrofits. Your specific energy management plan should define the necessary level of performance for all processes and show how all processes will work together to achieve effective and efficient production.
Step 5) Establish a System for Continual Improvement (Figure D) Maintaining an effective energy management program requires management commitment, ongoing project planning and implementation, and communication of program and project results. To the extent possible, integrate the administration of the energy management program with existing management programs such as quality control and safety or environmental management.
Figure D – Continual Improvement Cycle

Focus on Energy © 2006
14
TECHNICAL BEST PRACTICES
The following technical best practices are the energy savings measures that are identified to date. As new practices are discovered they will be sent to you to add to this guidebook. Check back with Focus on Energy for updates. The technical best practices are not listed in any particular order. The following table will assist you in quickly identifying best practices that may meet your company’s investment criteria.
BEST PRACTICE
TITLE SIMPLE
PAYBACK
1 Invert Pouring Ladles During Preheating/Standby < 1 year
2 Use Exhaust to Preheat Combustion Air 1-2 years
3 Use Variable Speed Drives on Variably Loaded Motors variable
4 Recover Exhaust Heat 1-2 years
5 Modulate Electric Furnace Exhaust 3-7 years
6 Improve Mold Yield to Reduce Amount of Metal Melted < 1 year
7 Reduce Scrap to Reduce Amount of Metal Poured < 1 year
8 Convert Shell Sand to Cold Box Core-making variable
9 Reduce Time that Induction Furnace Cover is Open Instant
10 Optimize Induction Furnace Tap Temperature Instant
11 Clean Foundry Returns to Minimize Melt Energy Instant
12 Use Cleaned Dust-Collector Air as Make-up Air 2-4 years
The following table lists possible non-energy benefits for each of the best practices listed above. Review the non-energy benefits table to see if any of the best practices can meet the needs of your company beyond reducing energy costs.

Focus on Energy © 2006
15
Table 6
POTENTIAL NON-ENERGY BENEFITS OF TECHNICAL BEST PRACTICES ( TOOL 1 )
Best Practice
# Description Waste
Handling Air
Emissions Water Use
Wastewater Handling
Maintenance &
Housekeeping
Raw Material
Use
Efficiency &
Capacity
1 Invert Pouring Ladles During Preheating/Standby
N Y N N Y N Y
2 Use Exhaust to Preheat Combustion Air
N Y N N Y Y Y
3 Use Variable Speed Drives on Variably Loaded Motors
N Y N N Y N Y
4 Recover Exhaust Heat N Y N N Y Y N
5 Modulate Electric Furnace Exhaust
N Y N N Y N N
6 Improve Mold Yield to Reduce Amount of Melted Metal
Y Y Y N Y Y Y
7 Reduce Scrap to Reduce Amount of Metal Poured
Y Y Y Y Y Y Y
8 Convert Shell Sand to Cold Box Core-making
Y Y Y Y Y Y Y
9 Reduce Time that Induction Furnace Cover is Open
Y Y N N N Y Y
10 Optimize Induction Furnace Tap Temperature
N Y Y N Y Y Y
11 Clean Foundry Returns to Minimize Melt Energy
Y Y N N Y Y Y
12 Use Cleaned Dust-Collector Air as Make-up Air
Y Y N N Y Y Y
N -No, it is very unlikely that implementing the best practice will result in a non-energy savings or cost
Y - Yes, there is a strong possibility that implementing the best practice will result in a non-energy savings or cost
Note: This table of potential opportunities came from the experience and consensus of 40 members of the Wisconsin metal casting Industry during a Wisconsin Cast Metals Association energy conference held in Stevens Point, Wisconsin on May 24, 2006

Focus on Energy © 2006
16
Metal Casting Best Practice 1
Invert Pouring Ladles During Preheat / Standby
Best Practice Invert pouring ladles 90� or 180� prior to heating. This will improve ladle heat retention and reduce the amount of natural gas required for heating.
Primary Area/Process Areas of use include the melting department, mold pouring lines and ladle preparation/repair areas.
Productivity Impact No improvement or reduction of throughput expected.
Return on Investment Simple payback expected to be less than one year.
Energy Savings Example: Saving 10% of a 250,000 Btu/hr ladle heater would save 2,000 therms per year if used for 8,000 hours per year.
Applications & Limitations
This technology will not apply if the facility uses fiber-ladle inserts instead of refractory-lined ladles.
Practical Notes Requires cleaning of ladle prior to inverting in order to prevent molten metal from running out of ladle.
Other Benefits The driving force for inverting ladles is to reduce energy costs.
Stage of Acceptance The practice is not widely accepted due to additional effort required to clean and invert ladle.
Resources Your Focus on Energy Advisor can assist you to quantify the energy savings. Call 800.762.7077 to speak with a member of the industrial team.

Focus on Energy © 2006
17
Metal Casting Best Practice 2
Use Exhaust to Preheat Combustion Air
Best Practice Recover heat from high temperature exhaust air to preheat incoming
combustion air.
Primary Area/Process Cupola hot blast, heat-treat furnaces, scrap dryers and charge pre-heaters.
Productivity
Impact
May increase process throughput via increasing output of burner.
Return on Investment Typically a one year to two year payback.
Energy Savings With a 250,000 BTU/hr burner this saves 2,250 therms to 4,500 therms per year.
Applications &
Limitations
Best application is to preheat combustion air by using exhaust heat from the same process.
Practical Notes Can preheat combustion air to 800oF. May require a burner retrofit.
Other Benefits None noted.
Stage of Acceptance This is well known technology, although not widely adopted.
Resources PHAST - Process Heating and Survey Tool
http://www.eere.energy.gov/industry/bestpractices/software.html
Your Focus on Energy Advisor can assist you to quantify the energy savings. Call 800.762.7077 to speak with a member of the industrial team.

Focus on Energy © 2006
18
Metal Casting Best Practice 3
Use Variable Speed Drives on Variably Loaded Motors
Best Practice Use of variable speed drives (VSDs), on motors which have variable
loads
Primary Area/Process Variable speed drives allow better load matching where demand varies from frequently to below full capacity of the motor. The most noteworthy application of VSD units is on sand mulling applications, dust collectors and cooling towers.
Productivity Impact No impact on productivity.
Return on Investment The return on investment will vary between metal casting operations. Variable speed drive technology has become affordable and, in the best applications, can save up to 50% in energy costs.
Energy Savings Assuming a 50hp motor spends 2,000 hours per year at 1/3 loading, 20,000 kWh would be saved with a VSD.
Applications & Limitations
Metal casters accept the technology but lack the engineering resources to develop it within their own plant.
Practical Notes This technology is limited to large horsepower motors (in excess of 75hp). The cost of the VSD limits its application to loads that vary over a wide part of the full motor capacity.
The use of VSDs is not a substitute for prudent shut-down procedures that can save more energy and reduce power demand.
Other Benefits Reduction of motor repair and replacement costs.
Stage of Acceptance This practice is not widely used since engineering time within facilities is not spent to determine feasibility of the project.
Resources
Your Focus on Energy Advisor can assist you to quantify the energy savings. Call 800.762.7077 to speak with a member of the industrial team.
www.energy.wsu.edu/ftp-ep/pubs/engineering/motors/MotorDrvs.pdf
Focus on Energy © 2006
19
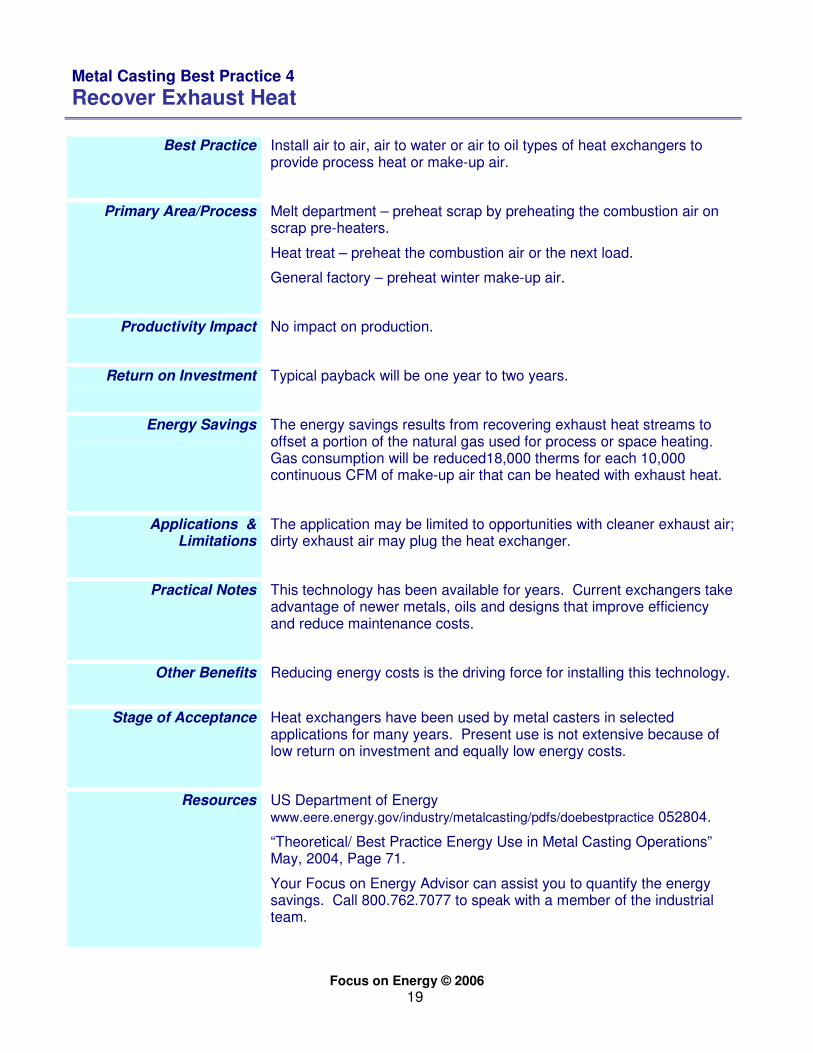
Metal Casting Best Practice 4
Recover Exhaust Heat
Best Practice Install air to air, air to water or air to oil types of heat exchangers to
provide process heat or make-up air.
Primary Area/Process Melt department – preheat scrap by preheating the combustion air on scrap pre-heaters.
Heat treat – preheat the combustion air or the next load.
General factory – preheat winter make-up air.
Productivity Impact No impact on production.
Return on Investment Typical payback will be one year to two years.
Energy Savings The energy savings results from recovering exhaust heat streams to offset a portion of the natural gas used for process or space heating. Gas consumption will be reduced18,000 therms for each 10,000 continuous CFM of make-up air that can be heated with exhaust heat.
Applications & Limitations
The application may be limited to opportunities with cleaner exhaust air; dirty exhaust air may plug the heat exchanger.
Practical Notes This technology has been available for years. Current exchangers take advantage of newer metals, oils and designs that improve efficiency and reduce maintenance costs.
Other Benefits Reducing energy costs is the driving force for installing this technology.
Stage of Acceptance Heat exchangers have been used by metal casters in selected applications for many years. Present use is not extensive because of low return on investment and equally low energy costs.
Resources US Department of Energy
www.eere.energy.gov/industry/metalcasting/pdfs/doebestpractice 052804.
“Theoretical/ Best Practice Energy Use in Metal Casting Operations” May, 2004, Page 71.
Your Focus on Energy Advisor can assist you to quantify the energy savings. Call 800.762.7077 to speak with a member of the industrial team.

Focus on Energy © 2006
20
Metal Casting Best Practice 5
Modulate Electric Furnace Exhaust
Best Practice Reduce the volume of electric furnace exhaust when furnace covers
are closed by reducing the air flow (CFM) from the exhaust hood on the electric furnace. Energy is saved by reducing the amount of heated air exhausted from the plant and by reducing the fan energy used to exhaust the air. This can be done in two ways: by reducing the exhaust fan speed when covers are closed and by placing a partial damper in the exhaust stack when the cover is closed.
Primary Area/Process Electric melting furnaces.
Productivity Impact No impact on productivity.
Return on Investment Typical payback on this project is three years to seven years.
Energy Savings Save 400 therms and 2,000 kWh for each 1,000 CFM reduced for every 2,000 hours of operation per year.
Applications & Limitations
This practice applies only to close capture hoods on electric furnaces in both iron and aluminum foundries. The best time for installation is at the same time as the installation of a new ventilation system for the furnace.
Practical Notes This practice is only applicable to furnaces that have close capture hoods.
Other Benefits The driving force of this best practice is the reduction of energy costs.
Stage of Acceptance Well known but not widely adopted.
Resources Your Focus on Energy Advisor can assist you to quantify the energy savings. Call 800.762.7077 to speak with a member of the industrial team.

Focus on Energy © 2006
21
Metal Casting Best Practice 6
Improve Mold Yield to Reduce Amount of Metal Melted
Best Practice Optimize gating and riser systems within the mold to reduce the amount of molten metal required to fill the mold.
Primary Area/Process This will affect the melt area but may also affect the molding and cleaning areas of the casting process.
Productivity Impact With less metal melted, productivity will increase in the melting area. The finishing area will see improvements through reduced gating and proper riser connection sizing.
Return on Investment Return on investment is less than one year. Even with the cost of computer analysis and pattern revisions, return on investment is immediate.
Energy Savings A one percent improvement in yield represents significant savings in the number of Btus required per gross ton of castings poured. The attached table shows the projected energy savings at various levels of yield.
Applications & Limitations
This practice applies to any mold design. The limits to implement this best practice are production demands, tooling budget and the amount of time available for in-house analysis.
Practical Notes Inherited tooling and reluctance of the customer to pay for revisions and computer analysis prevents many metal casters from doing the necessary analysis and experimental work to obtain the desired results.
Other Benefits Reduced emissions.
Stage of Acceptance This is accepted practice in the industry.
Resources Determination of formulas from “Theoretical/Best Practice Energy Use in Metalcasting Operations” May 2004, page 52 – Table #30
Your Focus on Energy Advisor can assist you to quantify the energy savings. Call 800.762.7077 to speak with a member of the industrial team.
The attached table presents projected metal and energy savings for all metals and processes.

Focus on Energy © 2006
22
Btus Saved for a 1% Yield Improvement for Various Existing Process Gross Yields
ENERGY SAVED PER CAST TON (Btus*)
IRON ALUMINUM MELT**
PERCENT YIELD TONS MELTED**** REVERB WET REV - DRY CRUCIBLE CORELESS
GROSS TONS
CASTINGS*** PRESENT PROPOSED PRESENT PROPOSED
TOTAL MELT
SAVINGS [tons]
SAVINGS / TON MELT [ton] GAS ELEC GAS GAS ELEC INDUCT
10,000 45% 46% 22,222 21,739 483 0.048 57,488 130,435 70,386 106,280 458,937 85,749 70,386
10,000 50% 51% 20,000 19,608 392 0.039 46,667 105,882 57,137 86,275 372,549 69,608 57,137
10,000 55% 56% 18,182 17,857 325 0.032 38,636 87,662 47,305 71,429 308,442 57,630 47,305
10,000 60% 61% 16,667 16,393 273 0.027 32,514 73,770 39,809 60,109 259,563 48,497 39,809
10,000 65% 66% 15,385 15,152 233 0.023 27,739 62,937 33,963 51,282 221,445 41,375 33,963
10,000 70% 71% 14,286 14,085 201 0.020 23,944 54,326 29,316 44,266 191,147 35,714 29,316
10,000 75% 76% 13,333 13,158 175 0.018 20,877 47,368 25,561 38,596 166,667 31,140 25,561
10,000 80% 81% 12,500 12,346 154 0.015 18,364 41,667 22,485 33,951 146,605 27,392 22,485
* 3413 Btu = 1 kWh
** Energy values derived from Theoretical/Best Practice Energy Use in Metal Casting Operations Page 37 - Table 19 and Page 15 - Table 2
*** Gross tons of castings represents the gross cast tons of production, before scrap.
**** Tons melted = the total melt required to cast the gross tons
This table is available in Excel format in the enclosed CD-ROM.
Example: If ACME Iron Castings Inc. casts 10,000 gross tons at a current yield of 45%, they are melting 22,222 tons of raw metal. If ACME increases gross yield by 1% to 46%, the total melt is reduced by 483 tons – an improvement of 4.8% per ton melted. From the table, the net savings are 57,488 Btus.

Focus on Energy © 2006
23
Metal Casting Best Practice 7
Reduce Scrap to Reduce Amount of Metal Poured
Best Practice
Optimize gating and riser systems and improve process control to reduce the scrap percentage for a given casting.
Primary Area/Process
This practice will affect the melting, molding and finishing areas of the casting process.
Productivity Impact
Productivity will increase in the melting area as less metal is melted. The finishing area will see improvements by reducing the number of castings that require finishing.
Return on Investment
The return on investment is less than one year. Even with computer analysis, pattern revisions and process control changes the return is immediate.
Energy Savings
A one-half percent reduction in scrap represents a significant energy savings per gross ton of castings. The attached table indicates the energy savings at various levels of scrap reduction
Applications & Limitations
This practice will apply to any current mold design. The limits to implementing this best practice are production demands, tooling budget and the time available for in-house analysis.
Practical Notes
Inherited tooling and reluctance to pay for revisions and computer analysis prevents many metal casters from doing the necessary analysis and experimental work to obtain the desired results.
Other Benefits Reduction in emissions.
Stage of Acceptance This concept is a generally accepted practice in the industry.
Resources Determination of formulas from “Theoretical/Best Practice Energy Use in Metalcasting Operations” May 2004, page 52 – Table #30
Your Focus on Energy Advisor can assist you to quantify the energy savings. Call 800.762.7077 to speak with a member of the industrial team.
The attached table presents projected metal and energy savings for all metals and processes.

Focus on Energy © 2006
24
The Energy Impact of Scrap Reduction through Improved Mold Design and Process Optimization
ENERGY SAVED PER CAST TON (Btus*)
IRON ALUMINUM MELT**
REVERB WET REV - DRY CRUCIBLE
CORELESS INDUCT
GROSS CASTINGS***
[tons] SCRAP
REDUCTION
TOTAL MELT
SAVINGS [tons]
SAVINGS / TON MELT [tons]
GAS [therms]
ELE [kWh]
GAS [therms]
GAS [therms]
ELE [kWh] ELE [kWh]
10,000 0.50% 50 0.005 5,950 13,500 7,285 11,000 47,500 8,875 7,285
10,000 0.75% 75 0.008 8,925 20,250 10,92
8 16,500 71,250 13,313 10,928
10,000 1.00% 100 0.010 11,900 27,000 14,57
0 22,000 95,000 17,750 14,570
10,000 1.25% 125 0.013 14,875 33,750 18,21
3 27,500 118,750 22,188 18,213
10,000 1.50% 150 0.015 17,850 40,500 21,85
5 33,000 142,500 26,625 21,855
10,000 1.75% 175 0.018 20,825 47,250 25,49
8 38,500 166,250 31,063 25,498
10,000 2.00% 200 0.020 23,800 54,000 29,14
0 44,000 190,000 35,500 29,140
10,000 2.25% 225 0.023 26,775 60,750 32,78
3 49,500 213,750 39,938 32,783
* 3413 BTU = 1 kWh
** Energy values taken from Theoretical/Best Practice Energy Use in Metal Casting Operations Page 37 - Table 19 and Page 15 - Table 12
*** Gross tons of castings represents the gross cast tons of production before scrap
This table is available in Excel format in the enclosed CD-ROM.
Example: If ACME Iron Castings Inc. casts 10,000 gross tons, and reduces total gross tons by one-half percent through scrap reduction, ACME will save 0.005 tons of metal and 5950 Btu for each ton poured. If ACME is an aluminum caster and uses a reverb wet process it will save 13,500 therms of gas and 7,285 kWh per ton poured.

Focus on Energy © 2006
25
Metal Casting Best Practice 8
Convert Shell Sand to Cold Box Core Making
Best Practice Use existing metal shell core boxes in a cold box process. Cold box
processes include SO2, DMEA, CO2 and Ecolotec.
Primary Area/Process Core making department.
Productivity Impact Production increases can be as high as 300% with the cold box process.
Return on Investment The specific facility’s value to increased throughput will drive the economics of this opportunity. See “Additional notes on Converting Shell Sand to Cold Box Core Making” on following page.
Energy Savings Energy savings is estimated to be 1.7 BTU per pound of shell sand. Save one therm for every 60,000 pound reduction in shell sand.
Applications & Limitations
About 90% of all shell cores can be converted. The problems encountered include finished core size and pattern shop revisions to alter the boxes for the difference in sand conditions. Cores with very thin sections are not good candidates for conversion. Some customer specifications may require the shell process due to dimensional tolerances and surface finish requirements.
Practical Notes Client specifications requiring the shell process may hinder this opportunity.
Other Benefits The release of certain toxic chemicals is eliminated. Employee safety is enhanced by reducing the exposure to burns from the hot boxes and cores.
Stage of Acceptance This conversion is practiced in many plants and is widely accepted when customer specifications and tolerances allow the conversion.
Resources Foundry Energy Conservation Workbook published Fall 1990.
Your Focus on Energy Advisor can assist you to quantify the energy savings. Call 800.762.7077 to speak with a member of the industrial team.

Focus on Energy © 2006
26
Additional notes on Converting Shell Sand to Cold Box Core Making In this best practice, the metal caster converts hot box phenolic resin cores (shell process) to a cold box process requiring no natural gas in the curing process. This conversion can be to any of several cold box processes, including CO2, SO2, DMEA catalyzed resins. The conversion depends on customer specifications, core configuration, surface finish demands and the quantity of cores required. EXAMPLE: The metalcaster decides to convert as many shell boxes to the SO2 process as is practical. After the conversion, shell sand purchases are reduced by 80,000 pounds of shell sand per month. While the energy reduction is small the productivity improvement is significant and should be calculated separately. Example Your data
Monthly shell sand reduction (lbs) 80,000 From foundry records Annual shell sand reduction (lbs) 960,000 0 Monthly x 12
Natural gas saved per pound (Btus) 1.70 1.70 Annual energy savings (Btus) 1,632,000 0 Annual reduction x 1.7
Conversion factor (Btus per therm) 100,000 100,000 Annual savings (therms) 16.32 0.00 Annual Btu savings /
100,000 Cost per therm $0.80 Foundry records Annual savings $13.06 $0.00
Note: This calculation does not include the production increase resulting from the reduced heating time for the elimination box. Also, the ancillary energy savings from lower space heat and lighting requirements due to reduced production time is not included in the calculation above.
This table is available in electronic format on the enclosed CD-ROM

Focus on Energy © 2006
27
Metal Casting Best Practice 9
Reduce Time that Induction Furnace Cover is Open
Best Practice
Minimize the time the furnace cover is open to reduce heat loss. The molten metal bath temperature is about 2,800 degrees Fahrenheit which can result in a significant amount of heat loss through radiation heat transfer if not addressed.
Primary Area/Process
Melting department.
Productivity Impact
There is no productivity impact for this best practice.
Return on Investment
This is a no-cost operational best practice and the return on investment is immediate.
Energy Savings
A 12-ton furnace loses 14 kWh for each minute the furnace cover is open. The heat loss impact on larger furnaces can be extrapolated from this value.
Applications & Limitations
This best practice is useful in any furnace operation. Discipline to maintain the practice over time is the greatest challenge.
Practical Notes
Because this is an operational best practice, it is susceptible to creeping divergence away from the practice over time.
Other Benefits
None claimed.
Stage of Acceptance
This practice has been established in many metalcasting operations.
Resources
“Theoretical/Best Practice Energy Use in Metalcasting Operations” May 2004, Section 2, page 24, Recommendation #2.
Your Focus on Energy Advisor can assist you to quantify the energy savings. Call 800.762.7077 to speak with a member of the industrial team.
Focus on Energy © 2006
28
Metal Casting Best Practice 10
Optimize Induction Furnace Tap Temperature
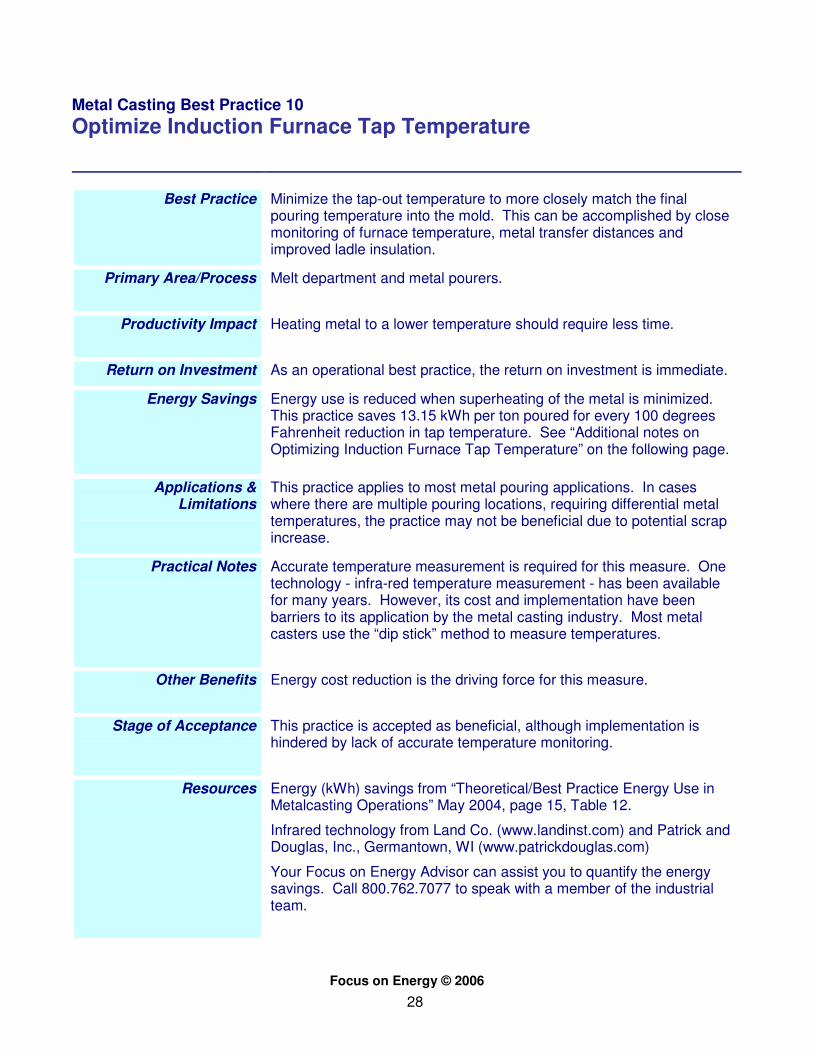
Best Practice
Minimize the tap-out temperature to more closely match the final pouring temperature into the mold. This can be accomplished by close monitoring of furnace temperature, metal transfer distances and improved ladle insulation.
Primary Area/Process Melt department and metal pourers.
Productivity Impact Heating metal to a lower temperature should require less time.
Return on Investment As an operational best practice, the return on investment is immediate.
Energy Savings
Energy use is reduced when superheating of the metal is minimized. This practice saves 13.15 kWh per ton poured for every 100 degrees Fahrenheit reduction in tap temperature. See “Additional notes on Optimizing Induction Furnace Tap Temperature” on the following page.
Applications & Limitations
This practice applies to most metal pouring applications. In cases where there are multiple pouring locations, requiring differential metal temperatures, the practice may not be beneficial due to potential scrap increase.
Practical Notes
Accurate temperature measurement is required for this measure. One technology - infra-red temperature measurement - has been available for many years. However, its cost and implementation have been barriers to its application by the metal casting industry. Most metal casters use the “dip stick” method to measure temperatures.
Other Benefits Energy cost reduction is the driving force for this measure.
Stage of Acceptance
This practice is accepted as beneficial, although implementation is hindered by lack of accurate temperature monitoring.
Resources
Energy (kWh) savings from “Theoretical/Best Practice Energy Use in Metalcasting Operations” May 2004, page 15, Table 12.
Infrared technology from Land Co. (www.landinst.com) and Patrick and Douglas, Inc., Germantown, WI (www.patrickdouglas.com)
Your Focus on Energy Advisor can assist you to quantify the energy savings. Call 800.762.7077 to speak with a member of the industrial team.
Focus on Energy © 2006
29
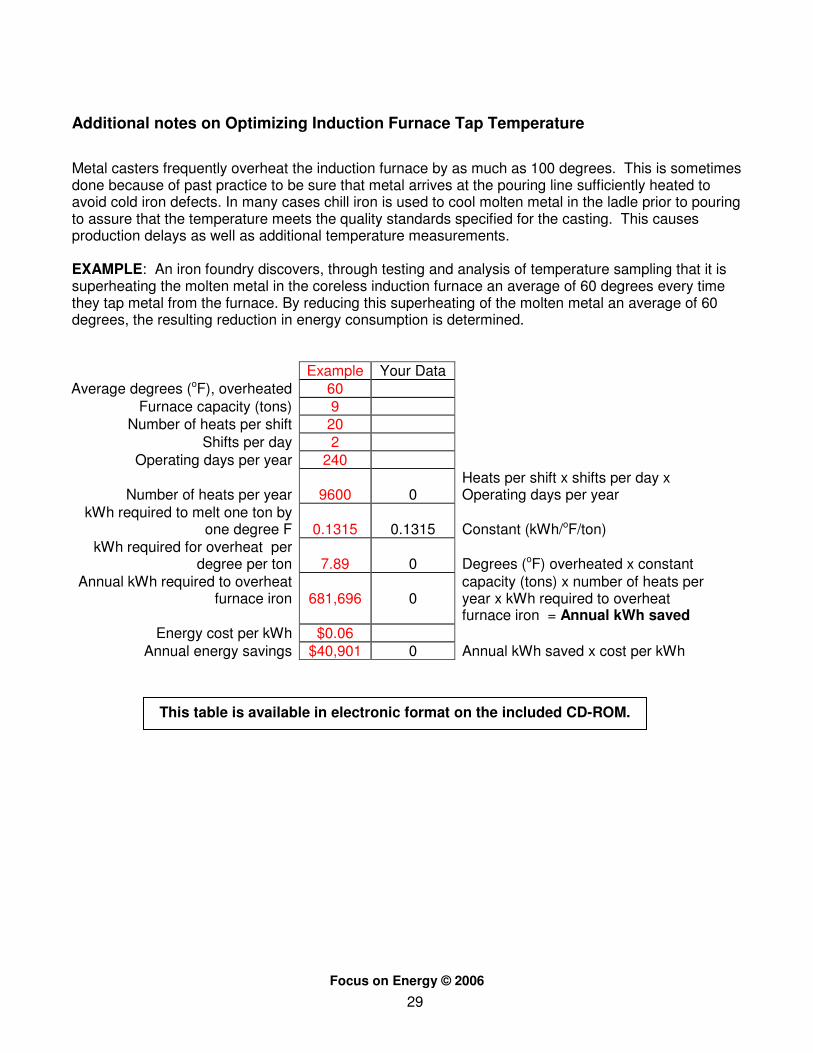
Additional notes on Optimizing Induction Furnace Tap Temperature
Metal casters frequently overheat the induction furnace by as much as 100 degrees. This is sometimes done because of past practice to be sure that metal arrives at the pouring line sufficiently heated to avoid cold iron defects. In many cases chill iron is used to cool molten metal in the ladle prior to pouring to assure that the temperature meets the quality standards specified for the casting. This causes production delays as well as additional temperature measurements. EXAMPLE: An iron foundry discovers, through testing and analysis of temperature sampling that it is superheating the molten metal in the coreless induction furnace an average of 60 degrees every time they tap metal from the furnace. By reducing this superheating of the molten metal an average of 60 degrees, the resulting reduction in energy consumption is determined.
Example Your Data Average degrees (oF), overheated 60
Furnace capacity (tons) 9 Number of heats per shift 20
Shifts per day 2 Operating days per year 240
Number of heats per year
9600
0
Heats per shift x shifts per day x Operating days per year
kWh required to melt one ton by one degree F
0.1315
0.1315
Constant (kWh/oF/ton)
kWh required for overheat per degree per ton
7.89
0
Degrees (oF) overheated x constant
Annual kWh required to overheat furnace iron
681,696
0
capacity (tons) x number of heats per year x kWh required to overheat furnace iron = Annual kWh saved
Energy cost per kWh $0.06 Annual energy savings $40,901 0 Annual kWh saved x cost per kWh
This table is available in electronic format on the included CD-ROM.

Focus on Energy © 2006
30
Metal Casting Best Practice 11
Clean Foundry Returns to Minimize Melt Energy
Best Practice Clean foundry returns and gating systems to remove mold sand prior to
melting. This is accomplished by shot blasting. This sand contaminant consumes melt energy which is lost when the sand contaminant is removed as slag.
Primary Area/Process Casting, finishing, molding and melt departments.
Productivity Impact The additional effort to clean the castings will be offset by a reduction of slag removal and reduced scrap.
Return on Investment The driving benefit for implementation of this practice is the reduction of slag. Minimizing slag reduces scrap rates. This operational best practice will have an immediate return on investment. Assuming 150 pounds. of sand can be eliminated per shift, the annual cost reduction will be approximately $2,500.
Energy Savings Heating sand requires twice as much energy per unit of weight, as heating metal. Energy savings can be estimated by first estimating the weight of sand that is currently introduced into the furnace. The energy saved equals the energy it takes to melt twice the same weight of metal.
Applications & Limitations
This applies to all induction melting operations except for those that outsource cleaning and finishing.
Practical Notes Throughput restrictions in the casting and finishing areas often limit implementation of this practice.
Other Benefits The non-energy benefits include reduced scrap and reduced slag.
Stage of Acceptance The benefits of this practice are known and accepted by most foundries.
Resources “Theoretical/Best Practice Energy Use in Metalcasting Operations,” May 2004, page 42.
Your Focus on Energy Advisor can assist you to quantify the energy savings. Call 800.762.7077 to speak with a member of the industrial team.
Focus on Energy © 2006
31
Metal Casting Best Practice 12
Use Cleaned Dust-Collector Air as Make-Up Air
Best Practice
Take advantage of improvements in dust-collection, air cleaning and air quality sensing in order to recycle treated air for facility make-up air during heating months.
Primary Area/Process
Duct collection systems in the finishing area and the molding area are best suited for this opportunity.
Productivity Impact
No impact on productivity is associated with this opportunity.
Return on Investment
The return on investment is expected to be in the range of 25% to 50%, depending on the system improvements needed.
Energy Savings
Energy is saved by reducing the amount of outdoor air that must be heated for building conditioning. Each 1,000 CFM reduction of outdoor air saves $1.40 per year.
Applications & Limitations
Air which is contaminated with toxic fumes is not a candidate for particulate cleaning and recirculation.
Practical Notes
The energy savings do not occur if the facility does not also reduce the amount of incoming outdoor make-up air.
Other Benefits
There may be reduced maintenance of make-up heaters.
Stage of Acceptance
This practice has gained acceptance by facilities that have seen the data demonstrating that air can be cleaned to a quality necessary for use as make-up air.
Resources
Your Focus on Energy Advisor can assist you to quantify the energy savings. Call 800.762.7077 to speak with a member of the industrial team.

Focus on Energy © 2006
32
PARTNER SURVEY SUMMARY
Survey Background
Jim Bettinghaus of Safety and Industrial Engineering, a co-leader of the Metal Casting Cluster Team, made site visits to Wisconsin metal casters. The survey was distributed to senior management personnel. The project focused mostly on grey and ductile iron foundries in Wisconsin with at least 40 employees and production of at least 300 tons per month, but also included a small number of aluminum and steel foundries. The remainder of this section summarizes the findings from this survey
All of the raw survey data can be found on the enclosed CD-Rom
Executive Summary
The Metal Casting Industry Cluster Team (Team) was formed to coordinate the development of metal casting process best practices in cooperation with Focus on Energy and metal casting industry leaders. The Team reviewed current industry literature and used market experience to develop a set of survey questions. These questions were presented to senior management personnel at participating foundries during an in-person interview. The Team compiled interview responses and developed a list of the best practices with the most potential benefit to metal casters.
In addition to surveying grey and ductile iron foundries, a small number of aluminum and steel foundries were surveyed. While the number surveyed was not significant enough to draw conclusions for these types of foundries, the survey data is included along with the data for the iron foundries on the CD which accompanies this guidebook.
All of the foundries surveyed were interested in improving energy efficiency. An environmental committee, created by the metal casting industry, has recently begun to discuss energy efficiency issues and has made a long term commitment to continuous improvement. Metal casting is the fourth largest industry in Wisconsin and based on a recent Focus on Energy report, accounts for approximately eight percent of energy use statewide. The industry has been struggling as a result of increased operating costs in recent years and views cutting energy costs as a significant issue. Available capital and staffing are both barriers to implementing energy efficient equipment and practices. In addition to a desire to improve energy efficiency, the metal casting industry has developed an atmosphere of openness and sharing of ideas, making industry-wide improvements more feasible. The industry, as represented by the Wisconsin Cast Metals Association (WCMA), has indicated their strong support and pledge of cooperation for continuation of the project in 2006.

Focus on Energy © 2006
33
Partner Survey Summary
Twenty-one grey and ductile iron metal casters participated in the partner survey. Of the 21 participants, six are considered large foundries. The remaining 15 foundries are medium size foundries. In addition to the iron foundries, three aluminum and two steel foundries were surveyed.
The following is a summary of significant iron foundry findings.
Melting Process – Induction
Slightly less than two-thirds of the foundries surveyed used clean scrap in the melting process. One pound of sand charged means two pounds of iron or steel are not melted and increases the slag generated. The Team prepared a best practice, Reduce Energy Use by Induction Furnaces with Clean Foundry Returns, to address this finding.
At least one-third of the foundries did not ensure that furnace cover open-time is minimized. For each ton of furnace rated capacity the energy lost equals 1.167 kWh each minute the cover is open. The Team prepared a best practice, Reduce Induction Furnace Cover Open Time, to address this finding.
The metal casters frequently overheated the induction furnace by as much as 100 degrees. In many cases chill iron is used to cool molten metal in the ladle prior to pouring to assure that the temperature meets the quality standards specified for the casting. This practice results in additional energy consumption and causes production delays as well as a need for additional temperature measurements. The Team prepared a best practice, Induction Furnace Tap Temperature Reduction, to address this finding.
Almost none of the foundries used process heat recovery; this was especially true for medium size foundries.
Only half of the large foundries and less than one-third of the medium-sized foundries inverted their ladles for the preheating process.
Melting Process – Cupola
Four foundries used a cupola for the melting process. The significant findings for this process are that none of the foundries dehumidified blast air and only one foundry covered the coke storage area to prevent water from being introduced into the charge. For every one pound of water that can be removed up front, the foundry avoids burning approximately 1.2 pounds of coke.
Molding
Only three of the foundries surveyed returned treated dust-collector exhaust air to the building. The Team prepared a best practice, Return Dust Collector Exhaust to Building, to address this finding. The practice has proven to be beneficial and practical; however, the metal caster should take samples of the exhausted air to determine the content of benzene, silica, carbon monoxide and any other content that may be deemed necessary. If all emissions are within the acceptable pollution emissions limits (PEL), the foundry may proceed with the project.
A majority of foundries did not use reclaimed sand for the chemical bonding process. The foundries that did use reclaimed sand were very happy with the results.
Core Making Process
Approximately one-third of the foundries surveyed used shell sand cores at their facility. Significant production increases and some energy reduction can be achieved by converting

Focus on Energy © 2006
34
shell-sand to cold-box core making. The Team prepared a best practice, Converting Shell Sand to Cold Box Core Making, to address this finding.
Some of the foundries that used the shell core process had procedures for reducing the number of burner tips in use in the core making process. Reducing the number of tips in use reduces the gas consumption used in the core making cycle. Those foundries with procedures in place did not control the application of the procedure.
Finishing Process
Approximately half of the foundries surveyed did not maintain pressure in air tools at 90 psi. A majority of foundries also seldom or never checked vent hood air velocities.
Heat Treat Process
None of the foundries surveyed conducted in-house heat-treat operations. All of the foundries surveyed sent heat-treat requirements to outside vendors.
General Factory Practices and General Issues
The survey showed that large and medium sized foundries used gas and electricity at approximately the same rates: gas use ranges from 25% to 40% of total energy use; electricity use makes up the remaining 60% to 75% of total utility energy use. All of the foundries used main gas and electric meters. All of the large foundries also metered at each furnace and on some of the heavier energy use equipment. Only a few of the medium foundries had meters on furnaces and none of the medium foundries had any additional metering. The large foundries also use fast operating overhead doors and air locks and had more extensive preventive maintenance programs that included, for example, checking faucets regularly for leaks.
Results showed that metal casters used, or considered, many approaches and practices to reduce energy use and cost. Some of these included:
• Controlling plant temperature
• Oxygen readers on stacks to optimize the burner mix
• Capacitor replacements to correct the power factor
• More efficient office lighting
• Burner preventive maintenance program on make-up air units
• Increasing mold yield
• Returning dust collector exhaust air to buildings to reduce the need for heated make-up air
• Performing compressed air audits
• Installing an electric damper on the furnace exhaust to reduce CFM exhausted
• Interlocking make-up heaters to infrared heaters so they cannot run simultaneously
• Purchasing energy efficient equipment over standard efficiency
• Using preheated combustion air for pre-heaters
• Distributing heat from the air compressor room to the foundry
• Installing a variable frequency drive on large motors that do not require continuous operation

Focus on Energy © 2006
35
• Replacing compressors with newer energy saving compressors
• Metering on electric furnaces to measure efficiency
• Recovering heat from hot sprue boxes
• Utilizing heat from furnace exhaust
• Directing heat to the floor using air mixers and heat tubes
• Achieving ventilation balance and improvement
While some energy savings result from technology or equipment investments, others come from improvement in work practices. Many of these are being implemented simultaneously without capturing or tracking the cost savings from each practice improvement. Savings show up undifferentiated as bulk savings. Most foundries don’t have a full understanding of their true energy costs, so it can be difficult to quantify the savings resulting from improved production and energy efficiency. A lack of specific metering close to the points of energy use and a lack of standard methodology for cost and energy savings calculations become barriers to formulating the “business case” for making specific, targeted energy efficiency improvements.
Capital availability and the competition for capital is a barrier to implementing more energy efficient equipment and practices in all of the foundries surveyed. Available staffing and engineering is also a problem, especially for the smaller foundries.

Focus on Energy © 2006
36
REFERENCES AND FURTHER RESOURCES
1. KERIMIDA Environmental Inc. Indianapolis IN,. Theoretical Best Practice / Energy Use in Metalcasting, prepared for the Department of Energy Industrial Technologies Program, Washington DC 2004. http://www.eere.energy.gov/industry/metalcasting/pdfs/doebestpractice_052804.pdf#search=%22radia%20schifo%22
2. Pennsylvania Foundry Association and Pennsylvania University. Metalcasting Best
Practices , prepared for the Pennsylvania Environmental & Energy Challenge 2005.
3. Energy Center of Wisconsin, Wisconsin Metal Casting Roadmap, Madison, WI 2000.
4. Wisconsin Focus on Energy Industrial Program, www.focusonenergy.com, 608-277-2946.

Focus on Energy © 2006
37
Appendix A: Best Practices Check List
The following are key energy best practices within common systems in industrial facilities. Spreadsheets to estimate the possible energy savings for some of these common system best practices can be found on the enclosed CD-ROM. For more information on these best practices, free technical support to estimate the best practice energy savings for your systems and possible financial incentives call the Focus on Energy - Industrial Program at 800-762-7077. System
Best Practices
System
Best Practices
Compressed Air Area Comfort Heating
Reduce system pressure Reduce waste heat Repair leaks De-stratify heated air in plant
Single vs. two stage Control heating to desired temperature
Variable inlet volume Use infrared heating Variable speed control Optimize CFM air exhausted
Energy efficient motor Automatic temperature control
Lighting Minimize heat to storage areas
Light meter used to verify levels Comfort Cooling
T-8 or pulse start MH lighting are considered Install removable insulation
Occupancy sensors Minimize unnecessary ventilation
Lights off during process shutdown Minimize moisture released
Task lighting is maximized Higher efficiency AC
Night lighting is turned off Optimize room air temperature
LED lamps in exit signs Dehumidification Motors Reduce humidity load
Premium efficiency motor vs. repair
Accurately controlling humidity
Cogged belts vs. V-belts Optimize ventilation
Premium efficiency motors specified Desiccant dehumidification
Pumps Minimize reheat energy
Trim impeller to meet maximum Load
Use VSD instead of throttled control
Use VSD instead of bypass control

Focus on Energy © 2006
38
Best Practices for Common Systems – continued Refrigeration Fan Systems Thermosiphon Reduce excess flow Evaporator fan control Eliminate flow restrictions Floating head pressure Correct poor system effects
Scheduled maintenance Optimize efficiency of components
- Clean filters Correct leaks in system
- Low refrigerant charge Optimize fan output control
Automatic air purge Process Cooling
Steam Systems Use variable frequency drives
Reduce steam pressure Float head pressure
Steam trap maintenance Use of free cooling - fluid cooler
Minimize blowdown Use of free cooling - cooling tower
Insulate pipes Match chilled water pumps Improve boiler efficiency Insulate pipes and vessels
Heat recovery for boiler blowdown
Process to process heat recovery
Increase condensate return Process Heating
Stack economizer Optimize combustion air fuel ratios
Recover flash steam Preheat combustion air Ventilation Insulate pipes and vessels
Direct fired make-up units Schedule cleaning of heat exchangers
Better ventilation management Condensing heat recovery
De-stratified air Process to process heat recovery
Wastewater Ultra filtration for condensation
Fine bubble diffusers Vacuum
Automatic controlled DO sensors/VSDs
Optimize total cost for conveying
Heat recovery on anaerobic digester
Choose appropriate vacuum pump
Unneeded aeration basins are shut off Optimize vacuum pressure
Eliminate vacuum leaks
Focus on Energy © 2006
39
Appendix B: Additional Resources for the Metal Casting Industry
WISCONSIN FOCUS ON ENERGY: www.focusonenergy.com - offers financial incentives to eligible customers for installing qualifying energy efficiency measures. These measures include energy efficient lighting and HVAC equipment, and "custom" projects such as motor and compressed air system upgrades, process improvements and especially implementing the best practices that this guidebook features. Incentives are also available for maintaining equipment and studying the feasibility of a proposed energy efficiency project. Custom Incentive Partner Guidelines are provided below:
• You must work with a Focus on Energy advisor to obtain approval for custom incentives. If you do not currently have an advisor, please call (800) 762-7077.
• Incentives are available for new projects, not those that have been previously installed. Applications must be submitted before commencement of the project. See the Program Rules and Qualifications at www.focusonenergy.com for more information.
• All custom project incentives are calculated based on first-year energy savings. • Projects with less than a two year payback are not eligible for custom incentives. • A $20,000 per application limit has been imposed on lighting-only projects
A comprehensive bonus incentive of an additional 30 percent may be available for partners who implement multiple projects that increase overall facility energy efficiency. CLEANTECH PARTNERS, INC. (formerly CENTER FOR TECHNOLOGY TRANSFER, INC.): www.cleantechpartners.org - CleanTech Partners helps companies overcome barriers that restrict the commercialization of energy efficient technologies in Wisconsin. CleanTech Partners provides capital in the form of loans or equity to companies not typically served by traditional financial resources. This capital, coupled with technical, business and financial expertise can help bridge the gaps preventing the adoption and commercialization of new technology. CleanTech Partners’ technology investment funds are aimed at companies with technologies specific to the forest products (paper), metal casting, food processing, printing and plastics industries. CTT will also consider investment in other areas that will have a significant impact on energy use in Wisconsin. Businesses that have technology ready for commercialization in the near term, as well as business with commercialized technology that is not currently offered in Wisconsin, are especially encouraged to contact CleanTech Partners. US – DEPARTMENT OF ENERGY – ENERGY EFFICIENCY AND RENEWABLE ENERGY (EERE) - EERE offers valuable tools and publications to help industrial companies improve productivity and energy efficiency. These resources are listed below, you can learn more by visiting the Best Practices website at www.eere.energy.gov/industry/bestpractices or by calling the EERE Information Center at 877-337-3463.
Focus on Energy © 2006
40
Training: Best Practices offers system-wide and component-specific training programs to help you run your plant more efficiently. The training is offered throughout the year and around the country. • End-User Training for compressed air, motor, process heating, pump and steam systems. • Specialist Qualification Training offers additional training in the use of specific assessment
and analysis software tools developed by DOE. Software: ITP’s comprehensive suite of software tools can help your organization identify energy savings opportunities. Visit the Web site to learn more and download these tools, free of charge, to improve industrial compressed air, motor, fan , pump, process heating and steam systems: • ASDMaster evaluates adjustable speed drives and their application • AirMaster+ assesses compressed air systems • MotorMaster+ and MotorMaster+ International assists in selecting and managing energy-
efficient motors • Process Heating Assessment and Survey Tool (PHAST) assesses process heating systems • Pumping System Assessment Tool (PSAT) assesses the efficiency of pumping systems • NOx and Energy Assessment Tool (NxEAT) assesses and analyzes NOx emissions and
applications of energy-efficient improvements • Steam System Scoping Tool (SSST) profiles and grades steam system operations and
management • Steam System Assessment Tool (SSAT) assesses steam systems • 3E Plus determines whether boiler systems can be optimized through the insulation of
steam lines FORWARD WISCONSIN. See http://www.forwardwisconsin.com Forward Wisconsin's role in the economic development arena is to help businesses establish profitable Wisconsin operations. We provide state cost comparisons, Wisconsin financial information and a variety of other relocation consulting services to prospective expanding businesses.


