Metal Forming CAE Lab., Gyeongsang National University Metal Forming CAE Lab. Department of Mechanical Engineering Gyeongsang National University, Korea A new method for acquiring true stress -strain curves from tensile test Author: M.S, Joun a, *, H.T, Kim, I.S, Choi b , J.G, Eom c , M.C, Lee d a Professor, School of Mechanical and Aerospace Engineering, Gyeongsang National University, Republic of Korea b Graduate Student, School of Mechanical and Aerospace Engineering, Gyeongsang National University, Republic of Korea c R&D Team Leader, Technology Innovation Center, Gyeongsang National University, Republic of Korea d Post-doctoral Researcher, School of Mechanical and Aerospace Engineering, Gyeongsang National University, Republic of Korea ETAL ORMING IMULATION
Transcript
Metal Forming CAE Lab., Gyeongsang National University
Metal Forming CAE Lab.
Department of Mechanical Engineering
Gyeongsang National University, Korea
A new method for acquiring true stress-strain curves from tensile test
Author: M.S, Joun a,*, H.T, Kim, I.S, Choib,
J.G, Eomc, M.C, Leed
a Professor,
School of Mechanical and Aerospace Engineering,
Gyeongsang National University, Republic of Koreab Graduate Student,
School of Mechanical and Aerospace Engineering,
Gyeongsang National University, Republic of Korea
c R&D Team Leader,
Technology Innovation Center,
Gyeongsang National University, Republic of Koread Post-doctoral Researcher,
School of Mechanical and Aerospace Engineering,Gyeongsang National University, Republic of Korea
ETAL
OR
MIN
G
IMU
LA
TIO
N
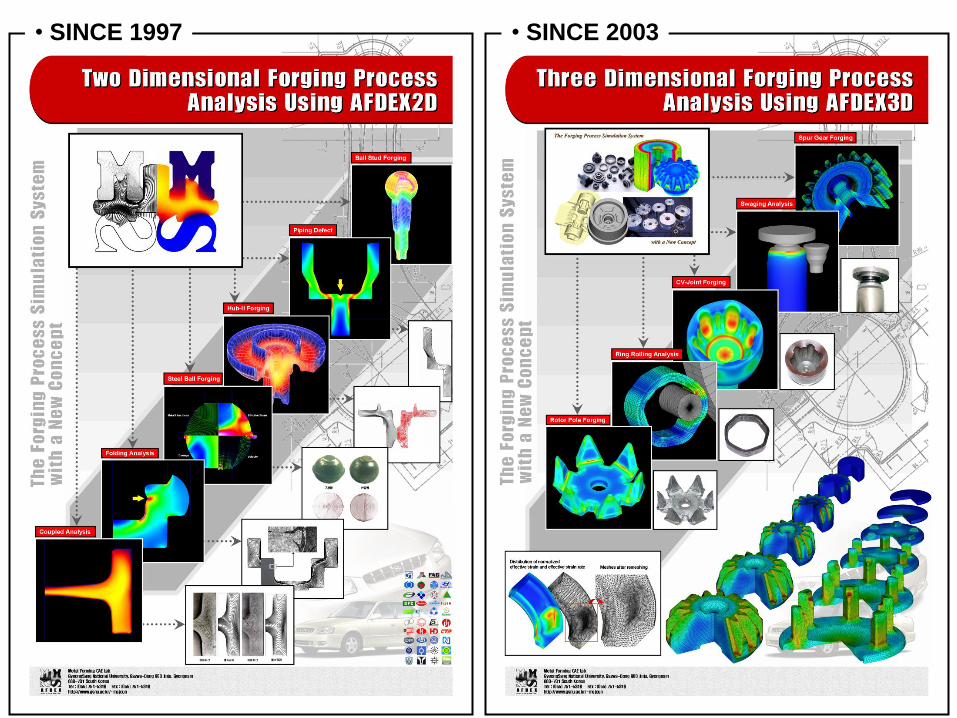
• SINCE 1997 • SINCE 2003
Metal Forming CAE Lab., Gyeongsang National University
Introduction
⊙ To obtain the true stress-strain curve over large strain by the tensile testthe exact prediction of the necking point is essential.
⊙ We present a method of predicting the exact necking point and a newalgorithm of acquisition of true stress-strain curve over large strain
⊙ Many researchers have tried to predict the necking point in tensile test that meets the Considère condition only to fail except Dumoulin et al(2003).
They used various imperfections or constraints.
⊙ Tensile Test(0.15 before the necking), Compression Test(0.5), SphericalIndentation Test(0.25)
⊙ True stress-strain curve over large strain is not easy to be acquired.
⊙ Recently several researchers have used the finite element method to obtainthe true stress-strain curve. Cabezas and Celentano, 2004; Campitelli et al.,2004; Choi et al., 1997; Husain et al., 2004; Isselin et al., 2006; Lee et al., 2005;Mirone, 2004; Nayebi et al., 2002; Springmann and Kuna, 2005
Metal Forming CAE Lab., Gyeongsang National University
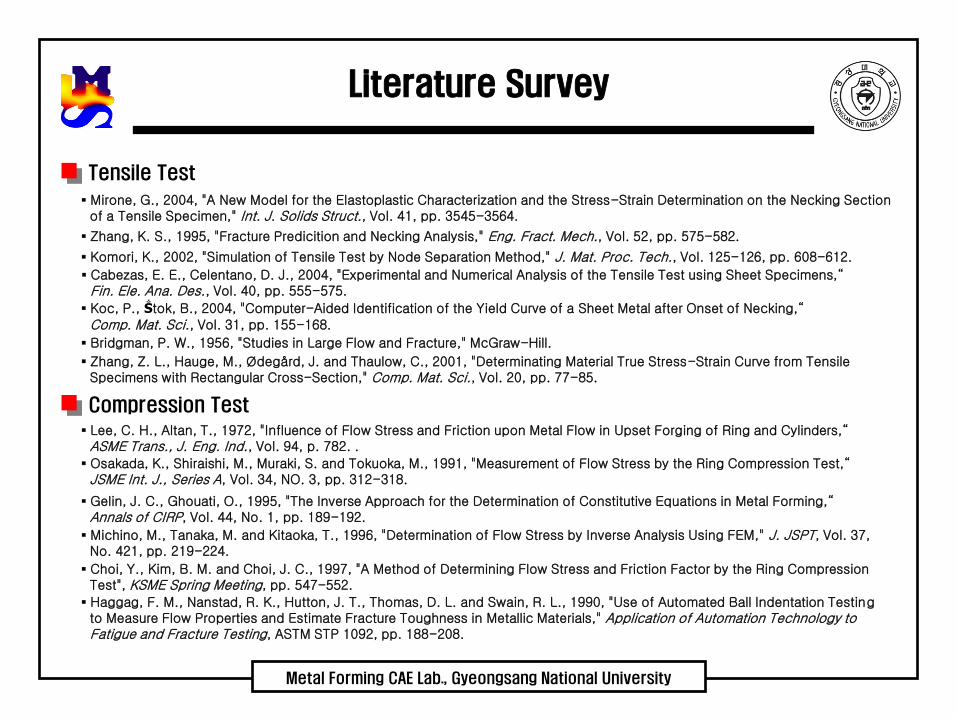
Literature Survey
Tensile Test
▪ Mirone, G., 2004, "A New Model for the Elastoplastic Characterization and the Stress-Strain Determination on the Necking Sectionof a Tensile Specimen," Int. J. Solids Struct., Vol. 41, pp. 3545-3564.
▪ Zhang, K. S., 1995, "Fracture Predicition and Necking Analysis," Eng. Fract. Mech., Vol. 52, pp. 575-582.
▪ Komori, K., 2002, "Simulation of Tensile Test by Node Separation Method," J. Mat. Proc. Tech., Vol. 125-126, pp. 608-612.
▪ Cabezas, E. E., Celentano, D. J., 2004, "Experimental and Numerical Analysis of the Tensile Test using Sheet Specimens,“Fin. Ele. Ana. Des., Vol. 40, pp. 555-575.
▪ Koc, P., Ṧtok, B., 2004, "Computer-Aided Identification of the Yield Curve of a Sheet Metal after Onset of Necking,“Comp. Mat. Sci., Vol. 31, pp. 155-168.
▪ Bridgman, P. W., 1956, "Studies in Large Flow and Fracture," McGraw-Hill.
▪ Zhang, Z. L., Hauge, M., Ødegård, J. and Thaulow, C., 2001, "Determinating Material True Stress-Strain Curve from TensileSpecimens with Rectangular Cross-Section," Comp. Mat. Sci., Vol. 20, pp. 77-85.
Compression Test
▪ Lee, C. H., Altan, T., 1972, "Influence of Flow Stress and Friction upon Metal Flow in Upset Forging of Ring and Cylinders,“ASME Trans., J. Eng. Ind., Vol. 94, p. 782. .
▪ Osakada, K., Shiraishi, M., Muraki, S. and Tokuoka, M., 1991, "Measurement of Flow Stress by the Ring Compression Test,“JSME Int. J., Series A, Vol. 34, NO. 3, pp. 312-318.
▪ Gelin, J. C., Ghouati, O., 1995, "The Inverse Approach for the Determination of Constitutive Equations in Metal Forming,“Annals of CIRP, Vol. 44, No. 1, pp. 189-192.
▪ Michino, M., Tanaka, M. and Kitaoka, T., 1996, "Determination of Flow Stress by Inverse Analysis Using FEM," J. JSPT, Vol. 37,No. 421, pp. 219-224.
▪ Choi, Y., Kim, B. M. and Choi, J. C., 1997, "A Method of Determining Flow Stress and Friction Factor by the Ring CompressionTest", KSME Spring Meeting, pp. 547-552.
▪ Haggag, F. M., Nanstad, R. K., Hutton, J. T., Thomas, D. L. and Swain, R. L., 1990, "Use of Automated Ball Indentation Testingto Measure Flow Properties and Estimate Fracture Toughness in Metallic Materials," Application of Automation Technology to Fatigue and Fracture Testing, ASTM STP 1092, pp. 188-208.
Metal Forming CAE Lab., Gyeongsang National University
Literature Survey
Spherical Indentation Test▪ Cheng, Y. T., Cheng, C. T., 1999, "Can Stress-Strain Relationships Be Obtained from Indentation Curves Using Conical andPyramidal Indenters?," J. Mater. Res., Vol. 14, pp. 3493-3496.
▪ Huber, N., Tsakmakis, C., 1999, "Determination of Constitutive Properties from Spherical Indentation Data Using NeuralNetworkings. Part Ⅰ: the Case of Pure Kinematic Hardening in Plasticity Laws," J. Mech. Phys. Solids, Vol. 47, pp. 1569-1588.
▪ Nayebi, A., Abdi, R. El., Bartier, O. and Mauvoisin, G., 2002, "New Procedure to Determine Steel Mechanical Parameters fromthe Spherical Indentation Technique," Mech. Materials, Vol. 34, pp. 243-254.
▪ Huber, N., Tsakmakis, C., 1999, "Determination of Constitutive Properties from Spherical Indentation Data Using NeuralNetworkings. Part Ⅱ: Plasticity with Nonlinear Isotropic and Kinematic Hardening," J. Mech. Phys. Solids, Vol. 47, pp. 1589-1607.
▪ Lee, H., Lee, J. H. and Pharr, G. M., 2005, "A Numerical Approach to Spherical Indentation Techniques for Material PropertyEvaluation," J. Mech. Phy. Solids, Vol. 53, pp. 2037-2069.
Punch Test▪ Campitelli, E. N., Spätig, P., Bonadé, R., Hoffelner, W. and Victoria, M., 2004, "Assessment of the Constitutive Properties fromSmall Ball Punch Test: Experiment and Modeling," J. Nuclear Materials, Vol. 335, pp. 366-378.
▪ Husain, A., Sehgal, D. K. and Pandey, R. K., 2004, "An Inverse Finite Element Procedure for the Determination of ConstitutiveTensile Behavior of Materials Using Miniature Specimen," Comp. Mat. Sci., Vol. 31, pp. 84-92.
▪ Isselin, J., Iost, A., Golel, J., Najjar, D. and Bigerelle, M., 2006, "Assessment of the Constitutive Law by Inverse Methodology:Small Punch Test and Hardness," J. Nuclear Materials, in press.
Torsion Test
▪ Bressan, J. D., Unfer, R. K., 2006, "Construction and Validation Tests of a Torsion Test Machine," J. Mater. Proc. Tech., in press.
Notch Tensile Test▪ Springmann, M., Kuna, M., 2005, "Indentification of Material Parameters of the Gurson-Tvergaard-Needleman Model byCombined Experimental and Numerical Techniques," Comp. Mat. Sci, Vol. 32, pp. 501-509.
Metal Forming CAE Lab., Gyeongsang National University
Basic Relationships
⊙ Relationship of true stress , true strain , nominal stress , and nonimal strain before necking point :
Metal Forming CAE Lab., Gyeongsang National University
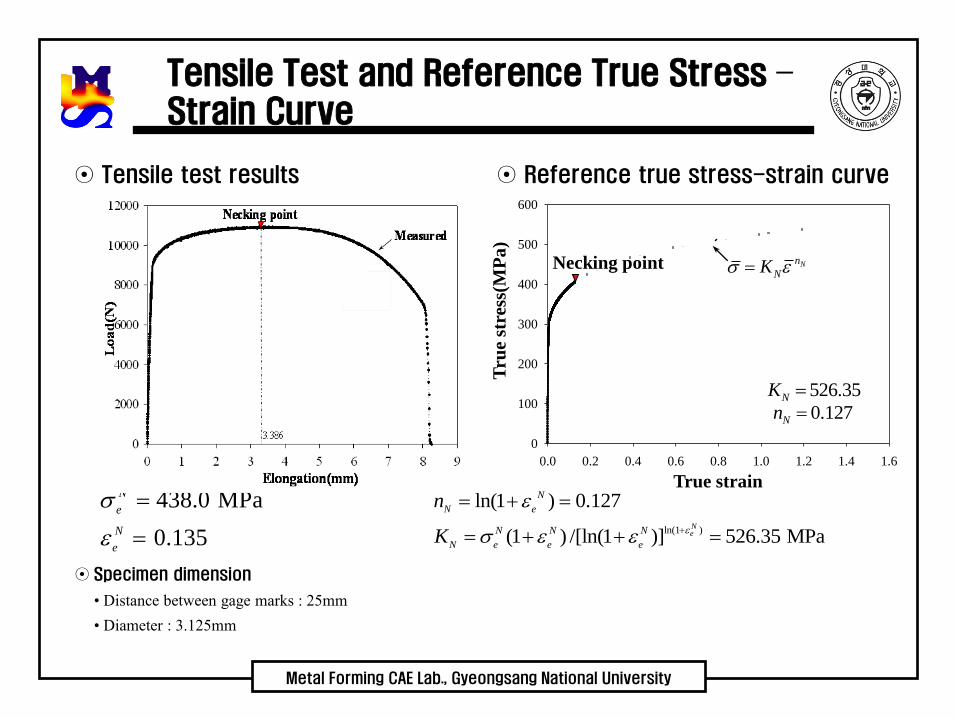
Tensile Test and Reference True Stress –Strain Curve
⊙ Tensile test results ⊙ Reference true stress-strain curve
0.0 0.2 0.4 0.6 0.8 1.0 1.2 1.4 1.6
0
100
200
300
400
500
600
Necking point
Tru
e st
ress
(MP
a)
True strain
Nn
NK
526.35NK
0.127Nn
438.0 MPa
0.135
N
e
N
e
ln(1 )
ln(1 ) 0.127
(1 ) /[ln(1 )] 526.35 MPaNe
N
N e
N N N
N e e e
n
K
⊙ Specimen dimension
• Distance between gage marks : 25mm
• Diameter : 3.125mm
Metal Forming CAE Lab., Gyeongsang National University
Finite element analysis of a tensile test- Finite element model : Perfect analysis model
Analysis domain Finite element mesh system
and boundary conditions
<Finite element model of the tensile test specimen>
0x
0xy
0y
0yx
1mm /secy
0yx
( ) 0n
xt( ) 0n
yt
x
y
Gage mark
Gage mark
⊙ Material : SWCH10A
⊙ Specimen dimension
• Distance between gage marks : 25mm
• Radius: 3.125mm
•
⊙ Material Behavior
• Rigid-plastic
• Isotropic hardening
•
⊙ Perfect analysis model
• Simple bar
• Shear-free ends
• No imperfections
• Mesh size : 15 x 30
0.127526.3
Metal Forming CAE Lab., Gyeongsang National University
Finite element analysis of a tensile test-Comparison of prediction and experiment
0 1 2 3 4 5 6 7 8 9
0
2000
4000
6000
8000
10000
12000Necking point
Predicted by
Measured
Elongation(mm)
Load
(N)
Nn
NK
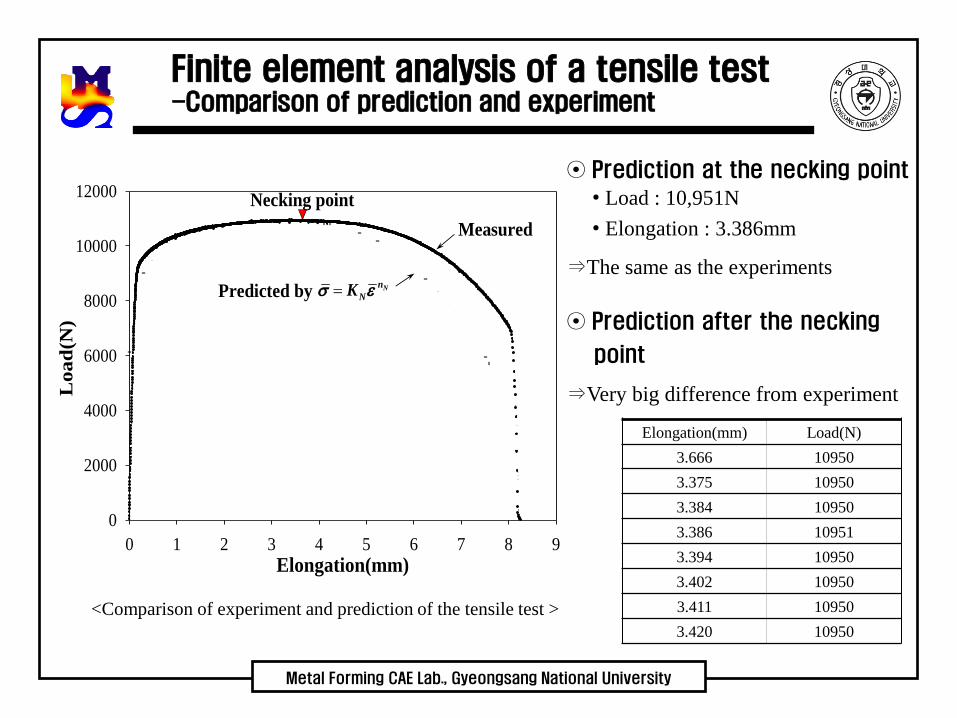
<Comparison of experiment and prediction of the tensile test >
⊙ Prediction at the necking point
• Load : 10,951N
• Elongation : 3.386mm
⇒The same as the experiments
Elongation(mm) Load(N)
3.666 10950
3.375 10950
3.384 10950
3.386 10951
3.394 10950
3.402 10950
3.411 10950
3.420 10950
⊙ Prediction after the necking
point
⇒Very big difference from experiment
Metal Forming CAE Lab., Gyeongsang National University
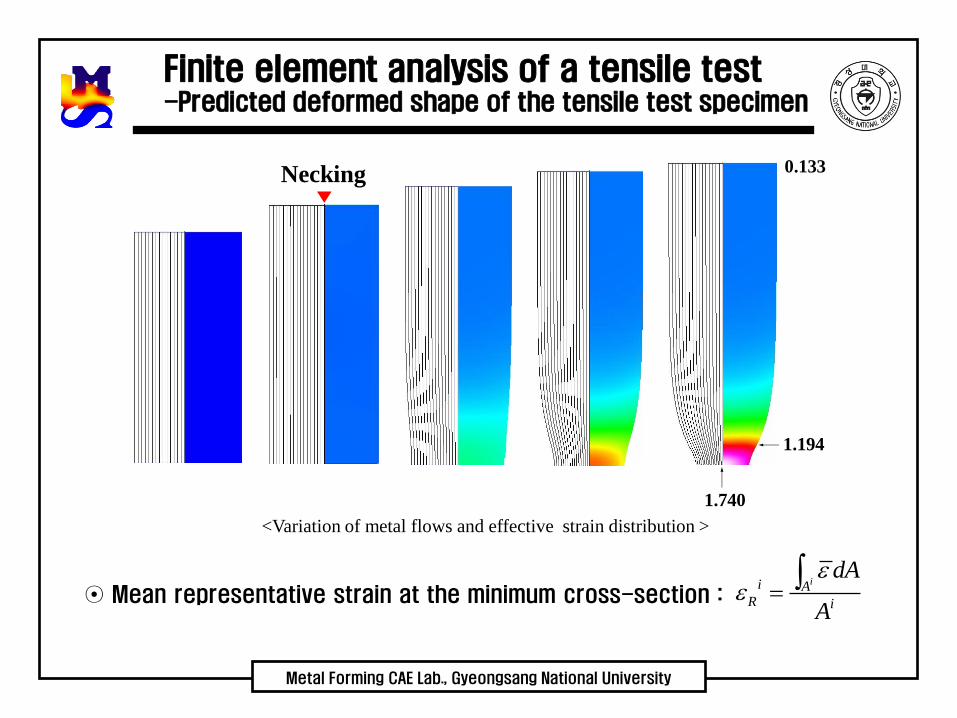
Finite element analysis of a tensile test-Predicted deformed shape of the tensile test specimen
Necking▼
0.133
1.740
1.194
<Variation of metal flows and effective strain distribution >
ii AR i
dA
A
⊙ Mean representative strain at the minimum cross-section :
Metal Forming CAE Lab., Gyeongsang National University
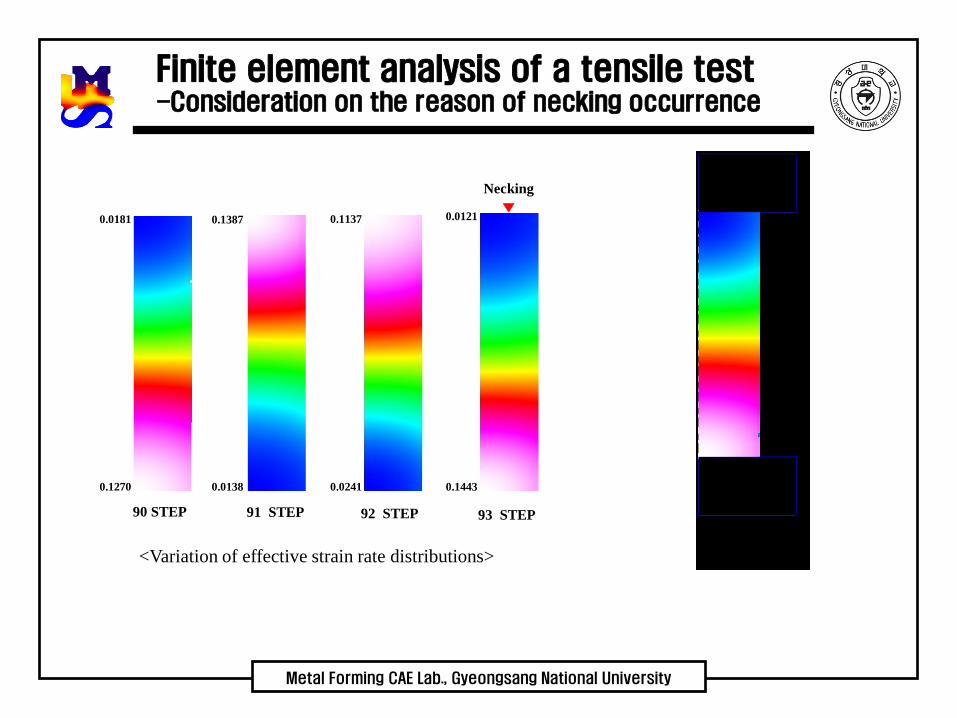
Finite element analysis of a tensile test-Consideration on the reason of necking occurrence
Necking
▼0.0181
0.1270
0.1387
0.0138
0.1137
0.0241
0.0121
0.1443
90 STEP 91 STEP 92 STEP 93 STEP
<Variation of effective strain rate distributions>
Metal Forming CAE Lab., Gyeongsang National University
⊙ First improved true s-s curve
A New Algorithm of Finding True Stress-StrainCurve Over Large Strains From Tensile Test
Calculate and
Determine test elongations
Analyze the tensile test using the true stress
-strain curve and calculate the mean strain
at the minimum cross-section.
Put
Put
Analyze the tensile test using the true stress
-strain curve defined by
Calculate and at .
Calculate by interpolating at
. Calculate
Stop
NnNK
i
, ,, , ( , )i j i j
N N R Rn K
, , 1 , 11, ,i j i j i i j
R R R Rj j
, 1i j i
R R
, , ,0, , ( ) Nni j i i j i j
R R R N Rj K
i
eF i
i i
e tF F yes
, ,( , )i j i j
R R ,i j
R
, 1i j
R , 1 ,i
i j i j tR R i
e
F
F
True strain
0 1 2 3 4 5 6 7 8 9
0
2000
4000
6000
8000
10000
12000Necking point
Predicted by
Measured
Elongation(mm)
Load
(N)
Nn
NK
1
②③
④ ⑤⑥
⑦⑧
⑨
⑩
5
①
0.0 0.2 0.4 0.6 0.8 1.0 1.2 1.4
0
200
400
600
800
Tru
e st
ress
(MP
a)
Reference strain-stress curve
First improved strain-stress curve
①②③ ④ ⑤ ⑥ ⑦ ⑧ ⑨ ⑩
1
R8 8,0
R R
8,0
R
8,1
R
True strain
1
0
Metal Forming CAE Lab., Gyeongsang National University
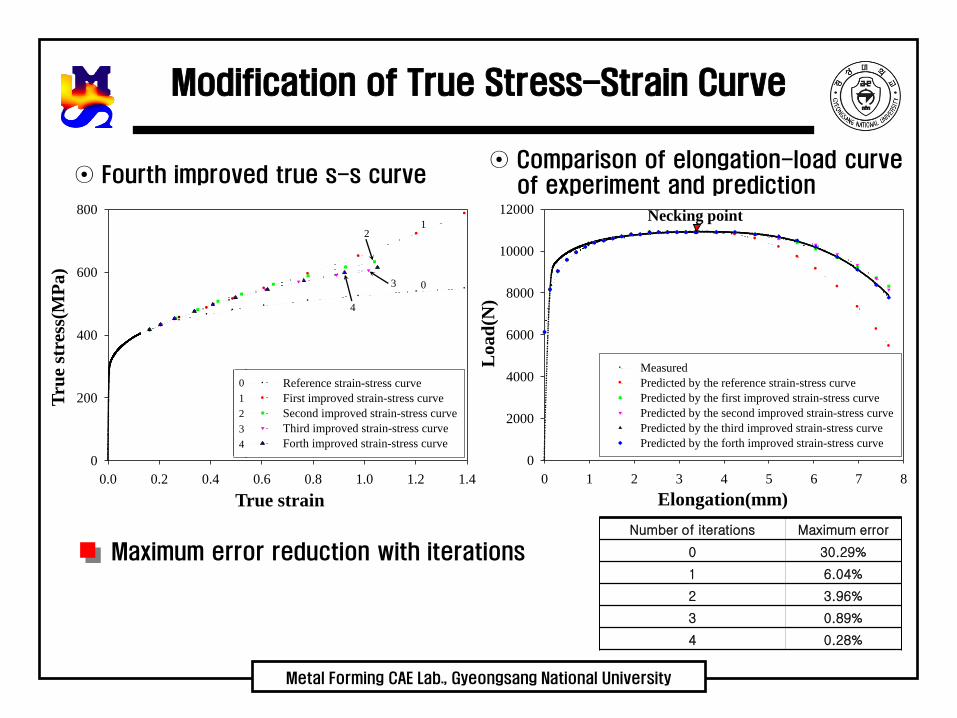
Modification of True Stress-Strain Curve
0.0 0.2 0.4 0.6 0.8 1.0 1.2 1.4
0
200
400
600
800
Reference strain-stress curve
First improved strain-stress curve
Second improved strain-stress curve
Third improved strain-stress curve
Forth improved strain-stress curve
Tru
e st
ress
(MP
a)
True strain
0 1 2 3 4 5 6 7 8
0
2000
4000
6000
8000
10000
12000
Measured
Predicted by the reference strain-stress curve
Predicted by the first improved strain-stress curve
Predicted by the second improved strain-stress curve
Predicted by the third improved strain-stress curve
Predicted by the forth improved strain-stress curve
Necking point
Lo
ad
(N)
Elongation(mm)
⊙ Fourth improved true s-s curve⊙ Comparison of elongation-load curve
of experiment and prediction
Number of iterations Maximum error
0 30.29%
1 6.04%
2 3.96%
3 0.89%
4 0.28%
Maximum error reduction with iterations
0
1
2
3
4
1
0
2
3
4
Metal Forming CAE Lab., Gyeongsang National University
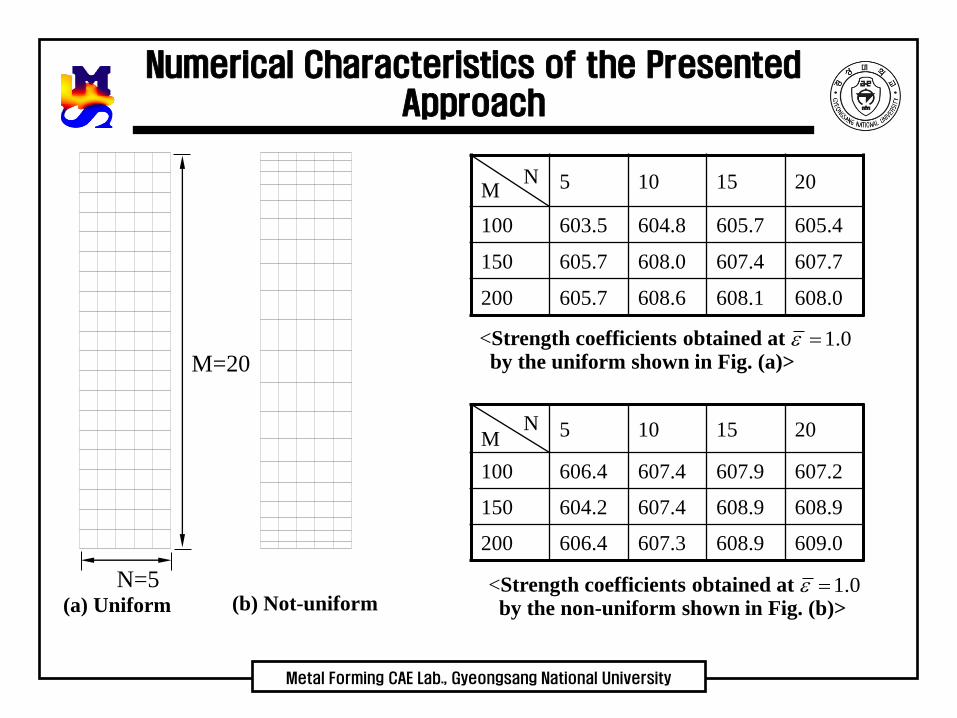
Numerical Characteristics of the Presented Approach
N=5
M=20
(a) Uniform (b) Not-uniform
NM 5 10 15 20
100 603.5 604.8 605.7 605.4
150 605.7 608.0 607.4 607.7
200 605.7 608.6 608.1 608.0
NM 5 10 15 20
100 606.4 607.4 607.9 607.2
150 604.2 607.4 608.9 608.9
200 606.4 607.3 608.9 609.0
<Strength coefficients obtained at by the uniform shown in Fig. (a)>
1.0
<Strength coefficients obtained at by the non-uniform shown in Fig. (b)>
1.0
Metal Forming CAE Lab., Gyeongsang National University
Conclusions
⊙ A new method of acquisition of true stress-strain curve over large strains by the tensile test and its finite element analysis was presented.
⊙ The presented approach predicted the exact true stress-strain curve in the engineering sense.
⊙ The numerical characteristics of the approach were revealedto be so good that the related program can be embedded into the tensile test machine as a special function.