Metal Retention in Constructed Wetland Sediment Anna Sophia Knox and Michael H. Paller Savannah River National Laboratory, Aiken, SC, USA Coral Springs, Florida April 23-26, 2018 12 th International Symposium on Biogeochemistry of Wetlands SRNL-L3200-2018-00042
Transcript
Metal Retention in Constructed Wetland Sediment
Anna Sophia Knox and Michael H. PallerSavannah River National Laboratory, Aiken, SC, USA
Coral Springs, Florida
April 23-26, 2018
12th International Symposium on Biogeochemistry of Wetlands SRNL-L3200-2018-00042
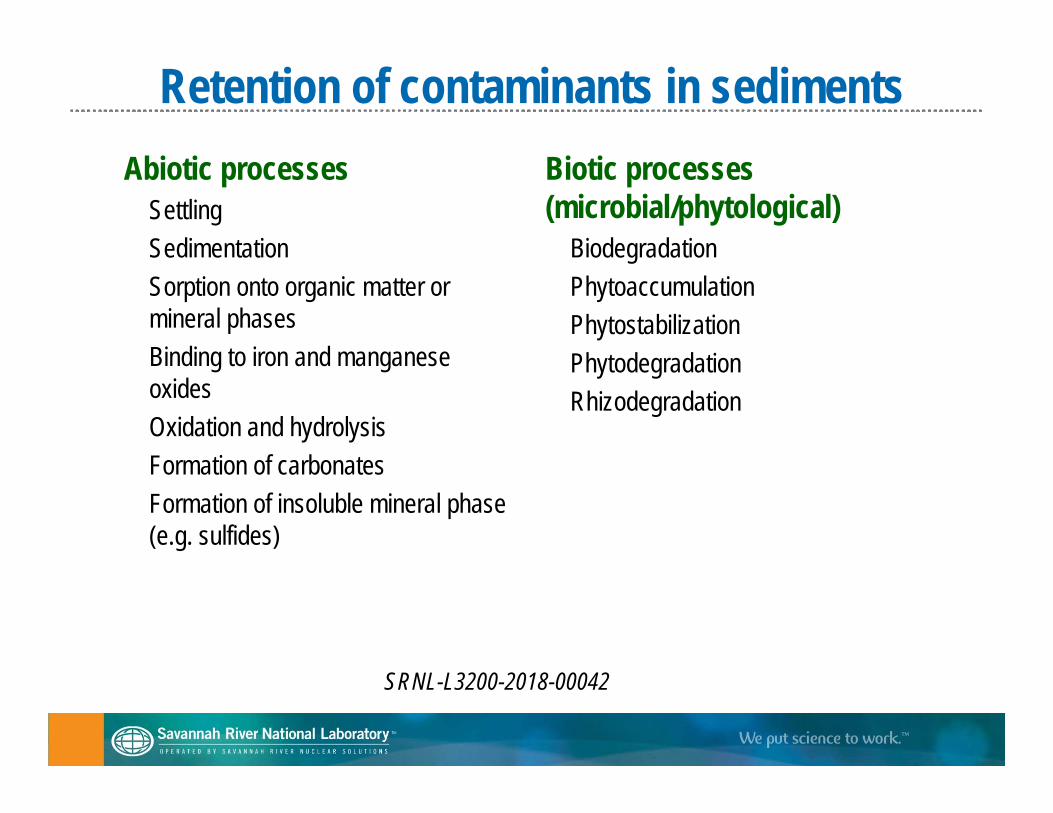
Retention of contaminants in sedimentsAbiotic processes
SettlingSedimentationSorption onto organic matter or mineral phasesBinding to iron and manganese oxidesOxidation and hydrolysisFormation of carbonatesFormation of insoluble mineral phase (e.g. sulfides)
The A-01 wetland treatment system was designed to remove metals, especially copper, from the A-01 effluent discharge. The treatment system consists of a stormwater retention basin, a splitter box, and four sets of two sequential treatment cells.
Studied area ‐ cells 4A and 4BSRNL-L3200-2018-00042
Objective
– The flow path of the A-01 effluent is from the retention basin to the splitter box, through the four A-cells, through the four B-cells, to the wetland outfall, and into the receiving stream.
SplitterBox
New A-01Outfall
1A
1B
3A
3B
2B
4A
4B
Old A-01
OutfallTreatment Wetland Cells
StreamRetention
Basin
2ASediment Sample Locations
The main objective of this study it was to evaluate retention of contaminants in the wetland sediment and their potential remobilization from the sediment into the water column over time.
SRNL-L3200-2018-00042
Determination of metal retention in sediment
Comparison of metal concentrations in sediment samples collected in 2004 and 2016 Sequential extraction of sediment collected in 2004
• Potentially Mobile Fraction (PMF) - indicator of remobilization• Recalcitrant Factor (RF) – indicator of retention
Partition (or distribution) coefficient/Kd values calculated from 2004 data • in-situ batch method (paired sediment and pore water samples)
SRNL-L3200-2018-00042
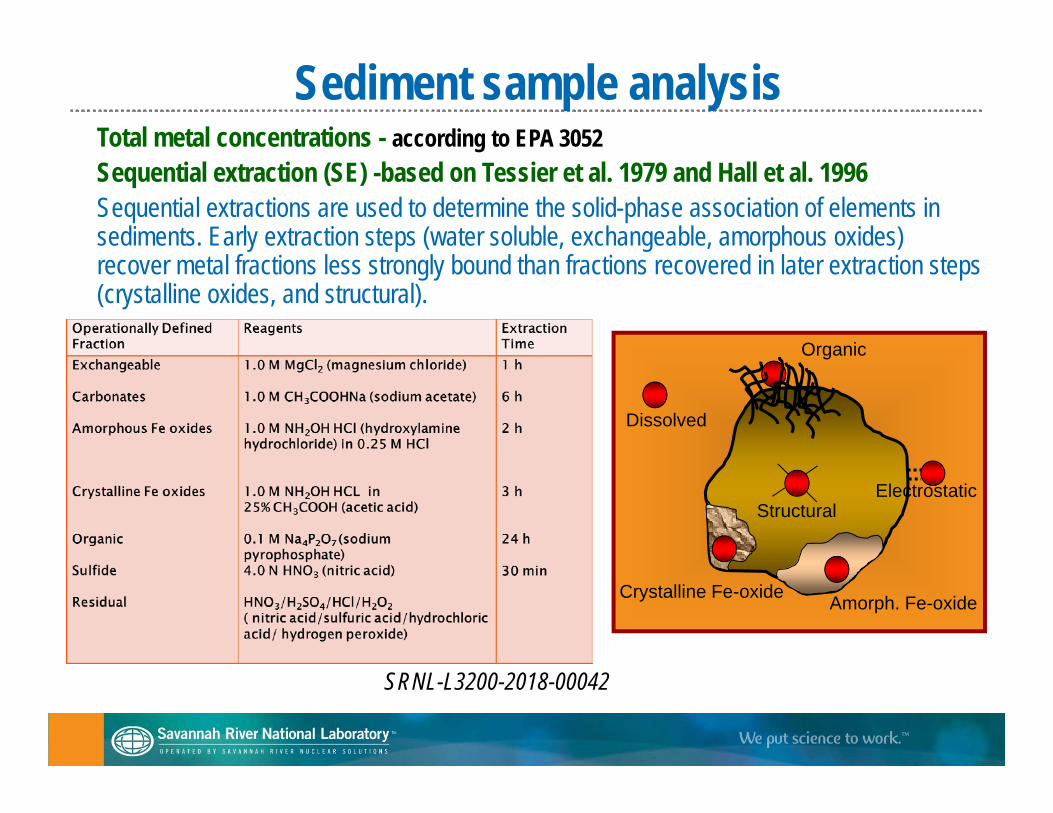
Sediment sample analysis Total metal concentrations - according to EPA 3052 Sequential extraction (SE) -based on Tessier et al. 1979 and Hall et al. 1996Sequential extractions are used to determine the solid-phase association of elements in sediments. Early extraction steps (water soluble, exchangeable, amorphous oxides) recover metal fractions less strongly bound than fractions recovered in later extraction steps (crystalline oxides, and structural).
Organic
Dissolved
Electrostatic
Amorph. Fe-oxideCrystalline Fe-oxide
Structural
SRNL-L3200-2018-00042
7
100.
residualoxidesorgASexch
residualoxidescryCCCCC
CCFactorcalcitrantRe
where: C represents concentrations of metals in sequential fraction extracts
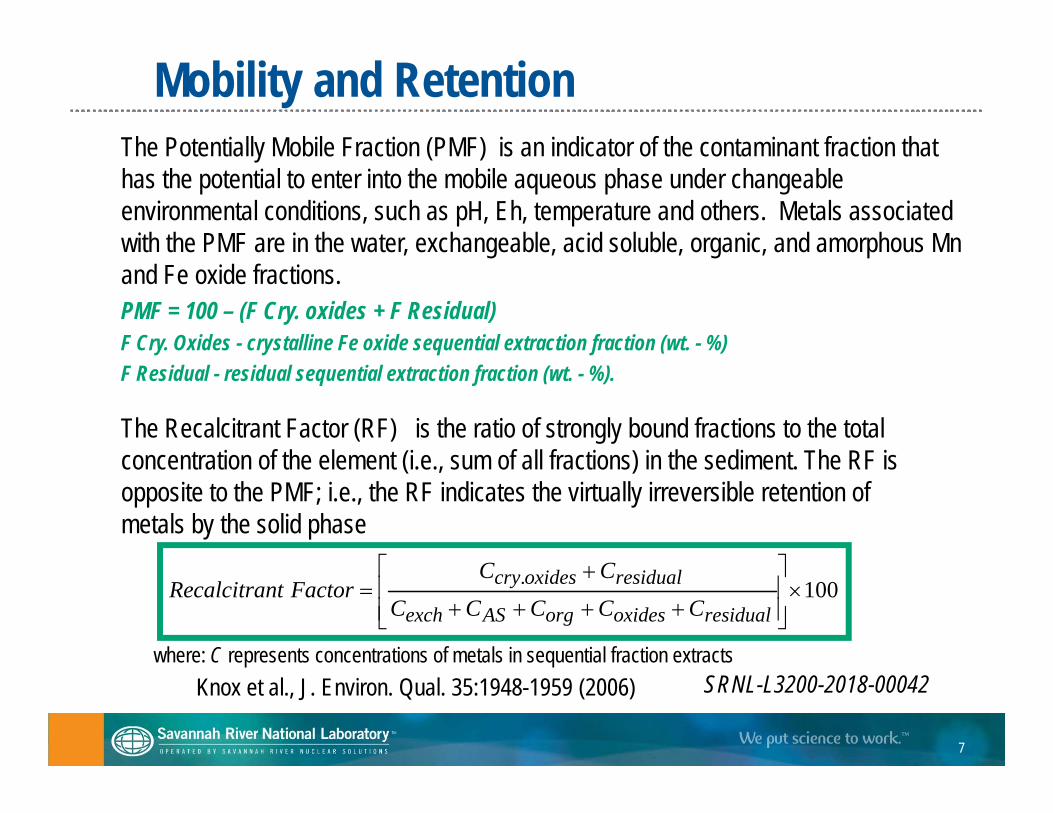
The Recalcitrant Factor (RF) is the ratio of strongly bound fractions to the total concentration of the element (i.e., sum of all fractions) in the sediment. The RF is opposite to the PMF; i.e., the RF indicates the virtually irreversible retention of metals by the solid phase
The Potentially Mobile Fraction (PMF) is an indicator of the contaminant fraction that has the potential to enter into the mobile aqueous phase under changeable environmental conditions, such as pH, Eh, temperature and others. Metals associated with the PMF are in the water, exchangeable, acid soluble, organic, and amorphous Mnand Fe oxide fractions.PMF = 100 – (F Cry. oxides + F Residual) F Cry. Oxides - crystalline Fe oxide sequential extraction fraction (wt. - %)F Residual - residual sequential extraction fraction (wt. - %).
Mobility and Retention
Knox et al., J. Environ. Qual. 35:1948-1959 (2006) SRNL-L3200-2018-00042
Partition coefficient (Kd )Kd is defined as the ratio of the contaminant concentration associated with the solid to the contaminant concentration in the surrounding aqueous solution at equilibrium.
Contaminant concentration in sediment (mg/kg)Kd = ------------------------------------------------------------------
Contaminant concentration in the solution contacting the sediment (mg/L)It is important to note that the interpretation of results from laboratory batch sorption tests generally allow no distinction to be made on how the sorbate (i.e., contaminant) is associated with the sorbent (i.e., sediment or sequestering agent). The sorbate may be adsorbed by ion exchange, chemisorption, bound to complexes that are themselves sorbed on the solid, and /or precipitated. Five methods to determine Kd values:
laboratory batch method in-situ batch method laboratory flow-through method field modeling method Koc method (EPA, 1991; Ivanovich et al., 1982)
The in-situ batch method was used in this study. The Kd values were determined from paired sediment and pore water samples.
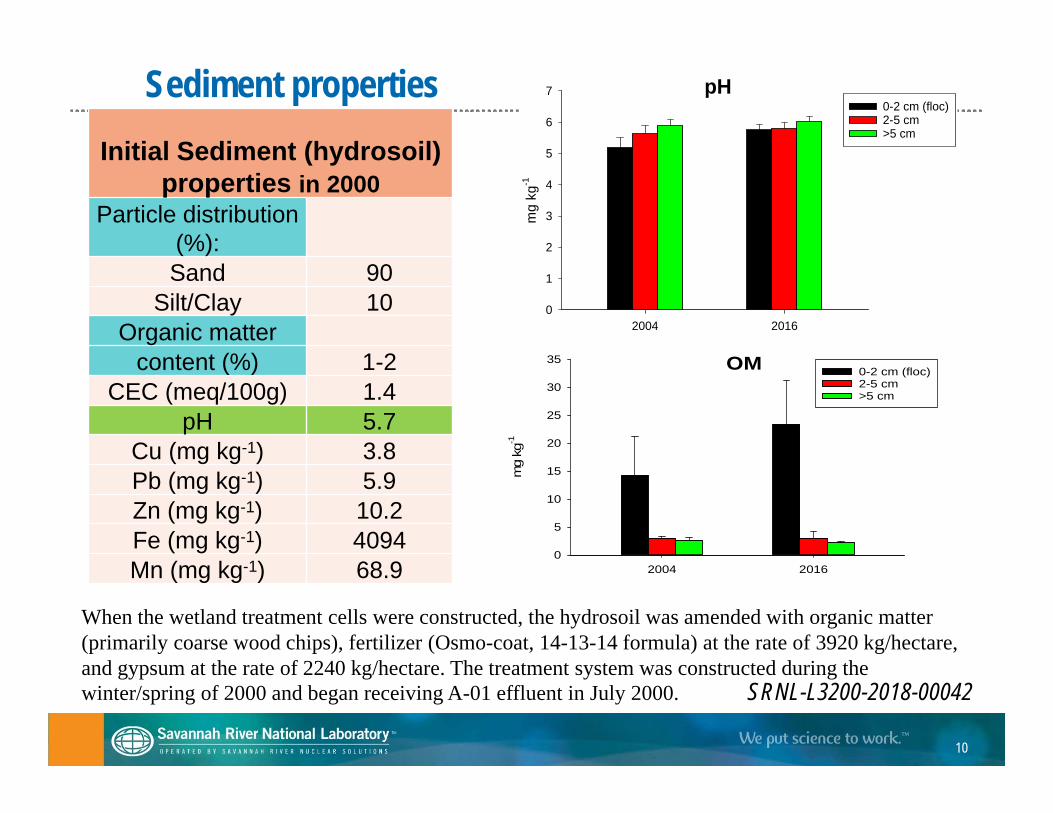
When the wetland treatment cells were constructed, the hydrosoil was amended with organic matter (primarily coarse wood chips), fertilizer (Osmo-coat, 14-13-14 formula) at the rate of 3920 kg/hectare, and gypsum at the rate of 2240 kg/hectare. The treatment system was constructed during the winter/spring of 2000 and began receiving A-01 effluent in July 2000. SRNL-L3200-2018-00042
Cu
2004 2016
mg
kg-1
0
200
400
600
800
1000
0-2 cm (floc)2-5 cm>5 cm
11
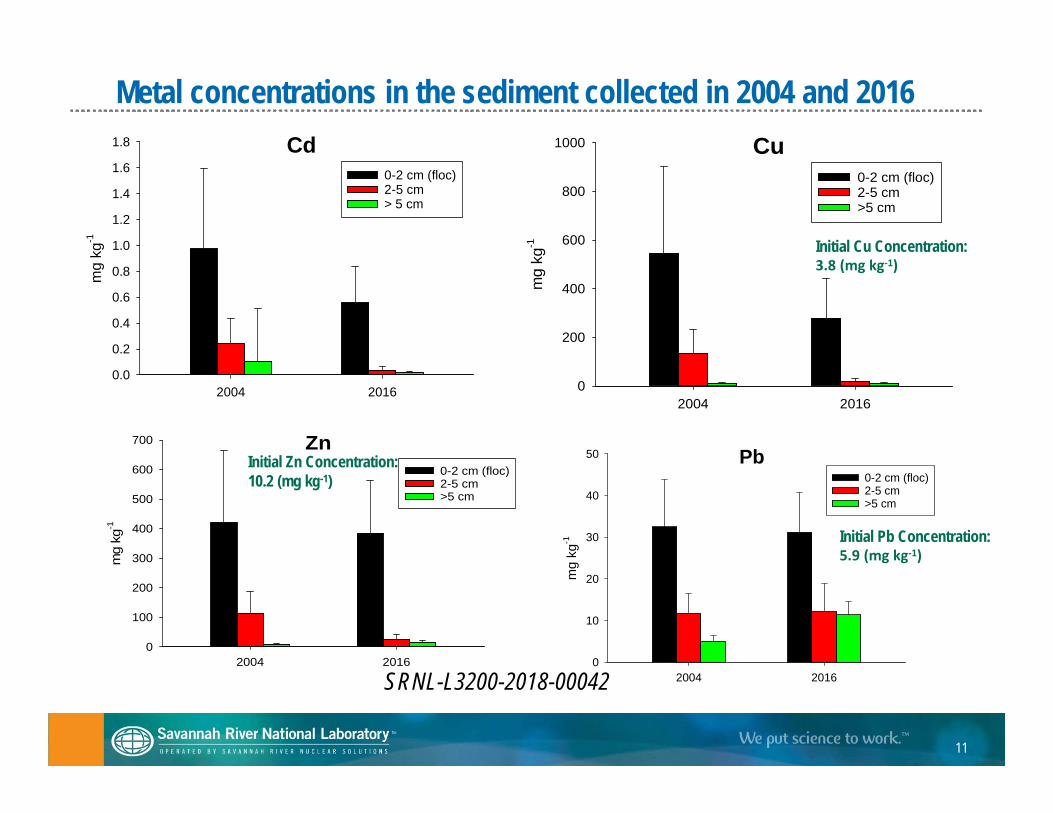
Metal concentrations in the sediment collected in 2004 and 2016Cd
2004 2016
mg
kg-1
0.0
0.2
0.4
0.6
0.8
1.0
1.2
1.4
1.6
1.8
0-2 cm (floc)2-5 cm> 5 cm
Pb
2004 2016
mg
kg-1
0
10
20
30
40
50
0-2 cm (floc)2-5 cm >5 cm
Zn
2004 2016
mg
kg-1
0
100
200
300
400
500
600
700
0-2 cm (floc)2-5 cm >5 cm
Initial Cu Concentration:3.8 (mg kg‐1)
Initial Zn Concentration:10.2 (mg kg-1)
Initial Pb Concentration:5.9 (mg kg‐1)
SRNL-L3200-2018-00042
12
Arsenic, Mn and Fe concentrations in the sediment collected in 2004 and 2016
Mn
2004 2016
mg
kg-1
0
100
200
300
400
500
0-2 cm (floc)2-5 cm>5 cm
Fe
2004 2016
mg
kg-1
0
5000
10000
15000
20000
25000
30000
350000-2 cm (floc)2-5 cm>5 cm
As
2004 2016
mg
kg-1
0
2
4
6
8
10
12
14
16
18
0-2 cm (floc) 2-5 cm>5 cm
Initial Fe Concentration:4094 (mg kg-1)
Initial Mn Concentration:68.9 (mg kg-1)
Higher metal concentrations in the organic layer could be related to Fe(III) and Mn(IV) reducing microorganisms. These microorganisms can dissolve insoluble Fe(III) and Mn(IV) oxides, resulting in the release of soluble (Fe(II) and Mn(II), as well as the trace metals bound by the Fe(III) or Mn(IV) minerals SRNL-L3200-2018-00042
13
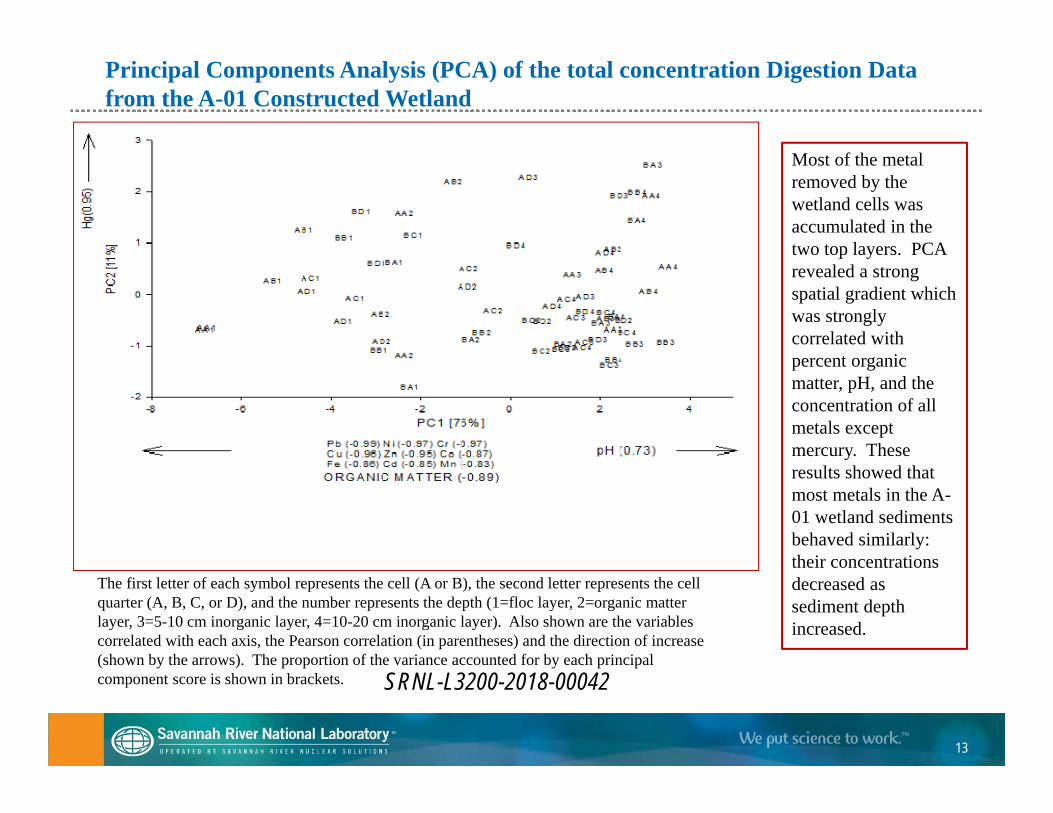
The first letter of each symbol represents the cell (A or B), the second letter represents the cell quarter (A, B, C, or D), and the number represents the depth (1=floc layer, 2=organic matter layer, 3=5-10 cm inorganic layer, 4=10-20 cm inorganic layer). Also shown are the variables correlated with each axis, the Pearson correlation (in parentheses) and the direction of increase (shown by the arrows). The proportion of the variance accounted for by each principal component score is shown in brackets.
Principal Components Analysis (PCA) of the total concentration Digestion Data from the A-01 Constructed Wetland
Most of the metal removed by the wetland cells was accumulated in the two top layers. PCA revealed a strong spatial gradient which was strongly correlated with percent organic matter, pH, and the concentration of all metals except mercury. These results showed that most metals in the A-01 wetland sediments behaved similarly: their concentrations decreased as sediment depth increased.
SRNL-L3200-2018-00042
14
0%10%
20%30%
40%50%60%
70%80%
90%100%
4A-org. 4A-inorg. 4B-org. 4B-inorg.
Layers
Cu
Res.
Sulf ide
Org.
Cryst. Ox.
Amorph. Ox.
Carb.
Exch.
0%
20%
40%
60%
80%
100%
4A-org. 4A-inorg. 4B-org. 4B-inorg.
Layers
Pb
Res.
Sulfide
Org.
Cryst. Ox.
Amorph. Ox.
Carb.
Exch.
0%10%20%30%40%50%60%70%80%90%
100%
4A-org. 4A-inorg. 4B-org. 4B-inorg.
Layers
Zn
Res.
Sulf ide
Org.
Cryst. Ox.
Amorph. Ox.
Carb.
Exch.
Partitioning of Cu, Zn, and Pb in the sediment
The lowest copper concentrations were associated with the exchangeable and carbonate fractions, and the highest with the residual, organic, and oxide fractions. Differences in the amount of organic matter present undoubtedly contributed to differences in metal speciation between the organic and inorganic layers.
SRNL-L3200-2018-00042
PMF and RF for Cu, Zn, Pb, Fe, and MnFloc layer
020406080
100120
Cu Pb Zn Fe Mn
%
PM F RF
Organic layer
0
20
40
60
80
100
Cu Pb Zn Fe Mn
%
PMF RF
Inorganic layer
0
20
40
60
80
100
120
Cu Pb Zn Fe M n
%
PM F RF
Average Potentially Mobile Fractions (PMF) and Recalcitrant Factors (RF) for Elements in the Floc (0-2 cm), Organic (2-5 cm), and Inorganic (5-10 cm) Layers
SRNL-L3200-2018-00042
16
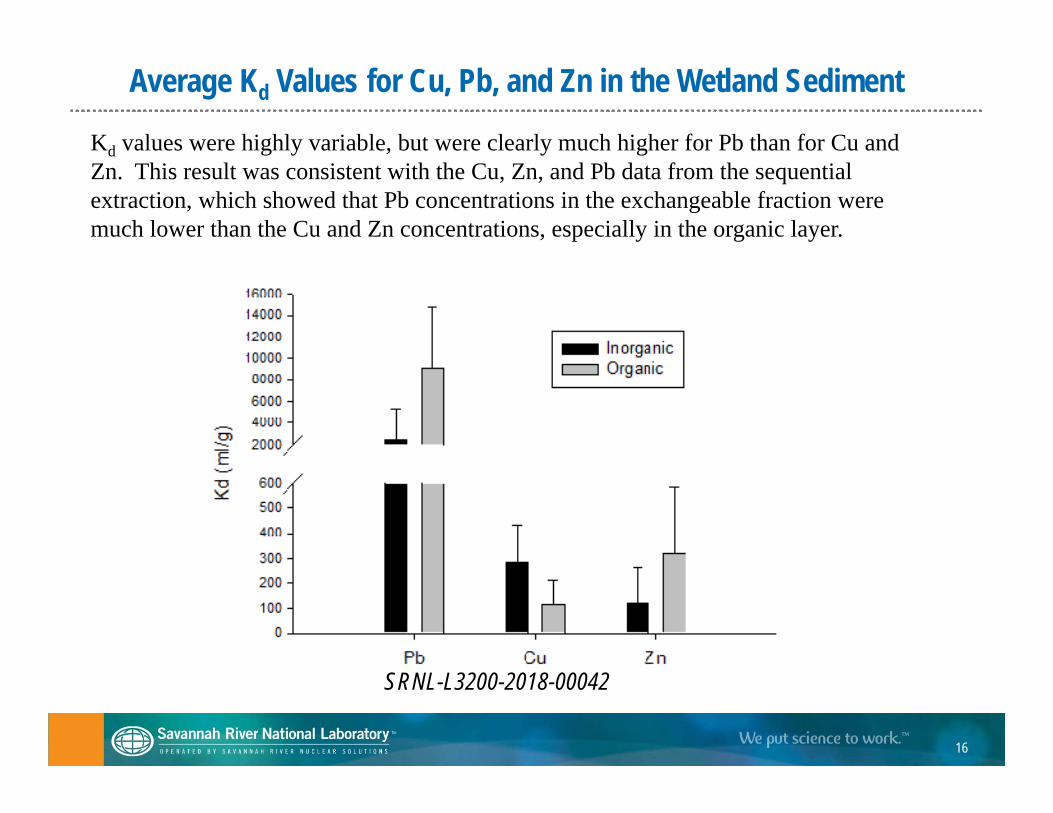
Average Kd Values for Cu, Pb, and Zn in the Wetland Sediment
Kd values were highly variable, but were clearly much higher for Pb than for Cu and Zn. This result was consistent with the Cu, Zn, and Pb data from the sequential extraction, which showed that Pb concentrations in the exchangeable fraction were much lower than the Cu and Zn concentrations, especially in the organic layer.
SRNL-L3200-2018-00042
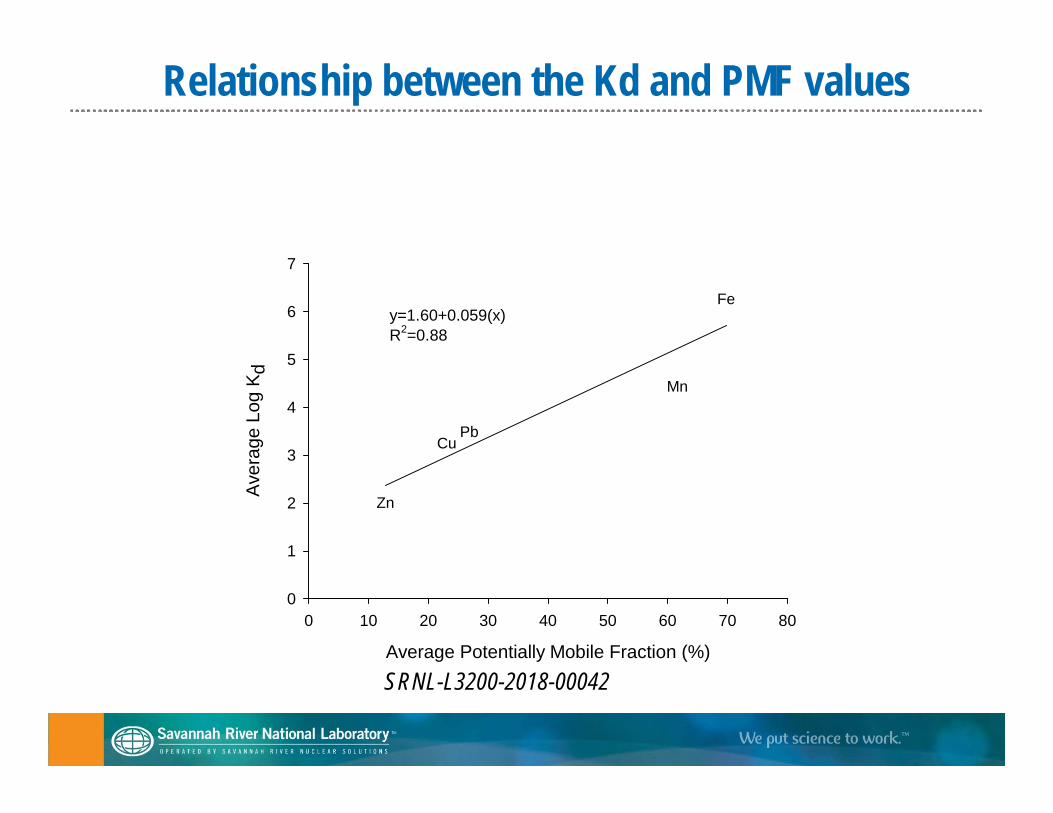
Relationship between the Kd and PMF values
Average Potentially Mobile Fraction (%)
0 10 20 30 40 50 60 70 80
Ave
rage
Log
Kd
0
1
2
3
4
5
6
7
Cu
Zn
Pb
Fe
Mn
y=1.60+0.059(x)R2=0.88
SRNL-L3200-2018-00042
SummaryMost of the metal removed by the wetland cells was accumulated in the two top layers: floc
and organic. PCA revealed a strong gradient in the sediment metal data, with floc layer samples at one
extreme and inorganic layer samples at the other. This gradient was correlated with percent organic matter, pH, and the concentration of all metals. These results showed that the concentrations of most metals decreased as sediment depth increased.
The highest potentially mobile fraction (PMF values) of metals was in the floc layer, followed by the organic layer. PMF was lowest in the inorganic layer.
Recalcitrant factor (RF values) for Cu, Pb, and Zn were high in the inorganic layers indicating that all three elements were strongly bound in the deeper sediments and not easily extractable. RF values were low in the floc layer indicating high potential for desorption and solubility.
Kd values were higher for Pb than for Cu and Zn. This was consistent with sequential extraction results, which showed that Pb concentrations were much lower than Cu and Zn concentrations in the exchangeable fraction, especially in the organic layer.
Metal concentrations in the A-01 wetland were greater in the surface layers of sediment, which were rich in organic matter.
SRNL-L3200-2018-00042
Future ResearchAssociation of metals with soluble organic complexes in the floc layer that accumulates in
wetlands is substantial and should be further evaluated for its role in food chain transport.
Although there have been a variety of engineering improvements for constructed wetlands, much less attention has been paid to optimizing the microbial processes responsible for metal removal. An understanding of biotic interactions may prove to be crucial for designing an effective wetland system.
Enhanced understanding of the complex biotic and abiotic interactions involved along with the technical possibilities for exploiting these interactions will facilitate the use of wetland technologies on a broader scale.
SRNL-L3200-2018-00042
The book is composed of three parts. “Understanding, processes, and needs,” provides fundamental knowledge concerning trace element geochemistry in waterlogged soils and sediments.
The second part of the book, “Bioavailability (chapters 11 to 16),” provides detailed information on the bioavailability of trace elements in the aquatic and semi-aquatic ecosystems
The third part of the book, “Remediation” (chapters 17 and 18), discusses the remediation of metal contaminated sediments.
Rinklebe, J., A.S. Knox, and M.H. Paller, editors. 2016. Trace Elements in Waterlogged Soils and Sediments. CRC Press, Boca Raton, FL.