Published: August 02, 2011 r2011 American Chemical Society 7298 dx.doi.org/10.1021/es201025v | Environ. Sci. Technol. 2011, 45, 7298–7306 ARTICLE pubs.acs.org/est Metallothionein-Like Multinuclear Clusters of Mercury(II) and Sulfur in Peat Kathryn L. Nagy,* ,† Alain Manceau, ‡ Jarrod D. Gasper, §,^ Joseph N. Ryan, || and George R. Aiken § † Department of Earth and Environmental Sciences, MC-186, 845 West Taylor Street, University of Illinois at Chicago, Chicago, Illinois 60607, United States ‡ ISTerre-Maison des Geosciences, CNRS and Universit e J. Fourier, BP 53, 38041 Grenoble Cedex 9, France § United States Geological Survey, Water Resources Discipline, 3215 Marine Street, Boulder, Colorado 80303, United States ) Department of Civil, Environmental, and Architectural Engineering, University of Colorado Boulder, 428 UCB, Boulder, Colorado 80309-0428, United States b S Supporting Information ’ INTRODUCTION Reduced sulfur (S red ) ligands are the main pool of strong binding sites for mercury(II) (Hg) in natural organic matter (OM) that may influence methylation rates, distribution and transport, and ecotoxicity of mercury. The S red derives from biomolecules produced by organisms, free sulfide species formed during microbial sulfate reduction, and recycled products of OM degradation and diagenesis. Total amounts of S red in OM range typically from about 0.1 2 wt %, sufficient to bind even unusually high concentrations of Hg. Small organic and inorganic Hg S red species can enable methylation, 1,2 but effects of Hg bound to larger OM molecules on microbial methylation and direct toxicity to fish and filter- feeders are ambiguous or unknown. 3 5 Unlike small biomole- cules, which are labile and can rapidly exchange thiol-bonded Hg, 6 macromolecular OM may have binding environments that are influential in decreasing bioavailability of Hg. Because peat and soil OM contain more macromolecular plant-derived com- pounds, as well as more reduced and total S, compared to dissolved OM (DOM), they may sequester Hg from the aqueous phase. The binding strength of Hg to OM, expressed as conditional HgLR + and HgL 2 R formation constants, spans from about 10 10 to 10 38 , 7 14 corresponding to mole ratios of S red to bound Hg (S red /Hg) from less than 1 to about 77000 in the solid phase at equilibrium with dissolved mercury. In the form Hg(LR) 2 the largest constants are g10 43 , matching values for thiol-binding in low molecular weight organic molecules. 15 The strongest binding sites containing S red are fewer in number than the markedly weaker sites containing O and/or N. 8 Binding constants must be linked to molecular structures to quantify reactions between OM and Hg species. Such structures have been characterized in peat, soil OM, and humic acid with added metal using extended X-ray absorption fine-structure (EXAFS) spectroscopy. At mole ratios of S red /Hg = 0.3 to 1.2 a structure with one S and one O or N bond (i.e., R(O/N)HgSR) was observed 16,17 whereas at S red /Hg = 1.6 to 4, 60 to 90% of added Hg bonded to 1.3 to 1.7 S atoms, suggesting up to 70% Hg(SR) 2 in a linear configuration. 17 At S red /Hg = 20 to 100 a Hg(SR) 2 3 complex with two S ligands at 2.34 Å and a tentative third near 3 Å in a T-shape geometry was reported. 18,19 Possible three-coordinate binding is supported by the average release of 2.7 protons for each adsorbed Hg atom in peat humic acid at S red /Hg = 120. 13 Peat typically contains about 0.1 ppm Hg (0.1 mg Hg/kg OM, equivalent to about 10 6 mol S red /mol Hg). This amount of Received: March 27, 2011 Accepted: July 14, 2011 Revised: July 12, 2011 ABSTRACT: Strong mercury(II) sulfur (Hg-SR) bonds in natural organic matter, which influence mercury bioavailability, are difficult to characterize. We report evidence for two new Hg-SR structures using X-ray absorption spectroscopy in peats from the Florida Everglades with added Hg. The first, observed at a mole ratio of organic reduced S to Hg (S red /Hg) between 220 and 1140, is a Hg 4 S x type of cluster with each Hg atom bonded to two S atoms at 2.34 Å and one S at 2.53 Å, and all Hg atoms 4.12 Å apart. This model structure matches those of metal thiolate clusters in metallothioneins, but not those of HgS minerals. The second, with one S atom at 2.34 Å and about six C atoms at 2.97 to 3.28 Å, occurred at S red /Hg between 0.80 and 4.3 and suggests Hg binding to a thiolated aromatic unit. The multinuclear Hg cluster indicates a strong binding environment to cysteinyl sulfur that might impede methylation. Along with a linear Hg(SR) 2 unit with Hg—S bond lengths of 2.34 Å at S red /Hg of about 10 to 20, the new structures support a continuum in Hg-SR binding strength in natural organic matter.
Transcript
Published: August 02, 2011
r 2011 American Chemical Society 7298 dx.doi.org/10.1021/es201025v | Environ. Sci. Technol. 2011, 45, 7298–7306
ARTICLE
pubs.acs.org/est
Metallothionein-Like Multinuclear Clusters of Mercury(II) andSulfur in PeatKathryn L. Nagy,*,† Alain Manceau,‡ Jarrod D. Gasper,§,^ Joseph N. Ryan,|| and George R. Aiken§
†Department of Earth and Environmental Sciences, MC-186, 845 West Taylor Street, University of Illinois at Chicago, Chicago,Illinois 60607, United States‡ISTerre-Maison des G�eosciences, CNRS and Universit�e J. Fourier, BP 53, 38041 Grenoble Cedex 9, France§United States Geological Survey, Water Resources Discipline, 3215 Marine Street, Boulder, Colorado 80303, United States
)Department of Civil, Environmental, and Architectural Engineering, University of Colorado Boulder, 428 UCB, Boulder,Colorado 80309-0428, United States
bS Supporting Information
’ INTRODUCTION
Reduced sulfur (Sred) ligands are the main pool of strongbinding sites for mercury(II) (Hg) in natural organic matter(OM) that may influence methylation rates, distribution andtransport, and ecotoxicity of mercury. The Sred derives frombiomolecules produced by organisms, free sulfide species formedduring microbial sulfate reduction, and recycled products of OMdegradation and diagenesis. Total amounts of Sred in OM rangetypically from about 0.1�2 wt %, sufficient to bind evenunusually high concentrations of Hg.
Small organic and inorganic Hg�Sred species can enablemethylation,1,2 but effects of Hg bound to larger OM moleculeson microbial methylation and direct toxicity to fish and filter-feeders are ambiguous or unknown.3�5 Unlike small biomole-cules, which are labile and can rapidly exchange thiol-bondedHg,6 macromolecular OM may have binding environments thatare influential in decreasing bioavailability of Hg. Because peatand soil OM contain more macromolecular plant-derived com-pounds, as well as more reduced and total S, compared to dissolvedOM (DOM), they may sequester Hg from the aqueous phase.
The binding strength of Hg to OM, expressed as conditionalHgLR+ and HgL2R formation constants, spans from about 1010
to 1038,7�14 corresponding to mole ratios of Sred to bound Hg(Sred/Hg) from less than 1 to about 77000 in the solid phase atequilibrium with dissolved mercury. In the form Hg(LR)2 the
largest constants areg1043, matching values for thiol-binding inlowmolecular weight organic molecules.15 The strongest bindingsites containing Sred are fewer in number than the markedlyweaker sites containing O and/or N.8
Binding constants must be linked to molecular structures toquantify reactions between OM and Hg species. Such structureshave been characterized in peat, soil OM, and humic acid withadded metal using extended X-ray absorption fine-structure(EXAFS) spectroscopy. At mole ratios of Sred/Hg = 0.3 to 1.2a structure with one S and oneO orN bond (i.e., R(O/N)HgSR)was observed16,17 whereas at Sred/Hg = 1.6 to 4, 60 to 90% ofadded Hg bonded to 1.3 to 1.7 S atoms, suggesting up to 70%Hg(SR)2 in a linear configuration.17 At Sred/Hg = 20 to 100 aHg(SR)2�3 complex with two S ligands at 2.34 Å and a tentativethird near 3 Å in a T-shape geometry was reported.18,19 Possiblethree-coordinate binding is supported by the average release of2.7 protons for each adsorbed Hg atom in peat humic acid atSred/Hg = 120.13
Peat typically contains about 0.1 ppmHg (0.1 mgHg/kg OM,equivalent to about 106 mol Sred/mol Hg). This amount of
Received: March 27, 2011Accepted: July 14, 2011Revised: July 12, 2011
ABSTRACT: Strong mercury(II)�sulfur (Hg-SR) bonds in natural organic matter, which influencemercury bioavailability, are difficult to characterize. We report evidence for two new Hg-SR structuresusing X-ray absorption spectroscopy in peats from the Florida Everglades with added Hg. The first,observed at amole ratio of organic reduced S toHg (Sred/Hg) between 220 and 1140, is a Hg4Sx type ofcluster with eachHg atom bonded to two S atoms at 2.34 Å and one S at 2.53 Å, and all Hg atoms 4.12 Åapart. This model structure matches those of metal�thiolate clusters in metallothioneins, but not thoseof HgS minerals. The second, with one S atom at 2.34 Å and about six C atoms at 2.97 to 3.28 Å,occurred at Sred/Hg between 0.80 and 4.3 and suggests Hg binding to a thiolated aromatic unit. Themultinuclear Hg cluster indicates a strong binding environment to cysteinyl sulfur that might impedemethylation. Along with a linear Hg(SR)2 unit with Hg—S bond lengths of 2.34 Å at Sred/Hg of about10 to 20, the new structures support a continuum in Hg-SR binding strength in natural organic matter.
mercury is about 1% of the adsorbed amount (10 ppm Hg)at which the strongest binding constants in OM have beenmeasured,8,9,12 and about 0.1% of the lowest value at whichEXAFS spectra are measurable today. Because only about 0.02%of Sred is needed to bind 0.1 ppm Hg, molecular structuresidentified by EXAFS at around 100 ppmHg, or about 20% of theSred, may reasonably approximate the strongest sites. Our goalwas to distinguish binding environments that involved Sred byobtaining and interpreting EXAFS spectra of Hg-containingpeats, including spectra obtained at liquid He temperature.
The peats were collected from two locations (F1 and 2BS) inthe Everglades that had different inorganic sulfide (HS�) con-centrations and Hg methylation rates.20 They were shown tohave dominantly strong to weak binding at adsorbed Hg con-centrations over the range of 1�400000 ppm.9 We observed twonew molecular binding environments out of a total of fourbetween 59 and 99100 ppm added Hg (Sred/Hg mole ratio from1140 to 0.50) that expand our understanding of how thecontinuum of sulfur binding sites in OMmay form and influencebioavailability of mercury.
’EXPERIMENTAL SECTION
We adsorbed mercury to the peats using the experimentalprocedure described previously9 except that the concentrationof peat was 10 times higher (0.1 g peat in 0.25 L of solution)to obtain enough material for EXAFS spectroscopic analysis.Experiments were conducted at initial solution concentrations ofmercury from 3 � 10�7 to 2 � 10�4 mol/L. Mercury wasanalyzed using cold vapor atomic fluorescence spectroscopy (PSAnalytical Ltd., Kent, UK).
EXAFS spectra at the Hg-L3 edge were recorded at roomtemperature (RT) and nine months later at liquid helium tem-perature (He-T; 8�16 K) at beamline BM30B (FAME) of theEuropean Synchrotron Radiation Facility (ESRF) and analyzedby standard techniques. X-ray absorption near-edge structure(XANES) spectra at the S-K edge were recorded on unreactedpeat at RT at beamline 10.3.2, Advanced Light Source (ALS).Fractional abundances of reduced and oxidized sulfur specieswere obtained by linear combination fitting of reference spectra.Binding structures for Hg were identified by comparing spectralfeatures of samples to those of reference compounds, fittingsample spectra with linear combinations of spectra, andmodelingFourier-transformed k3-weighted spectra using amplitude andphase shift functions calculated from first principles.
Details of the experiments and analyses are in the SupportingInformation (SI).
’RESULTS AND DISCUSSION
In contrast to the generally linear trend in the adsorptionisotherms, which may be explained by at most two binding sites,the EXAFS spectral analysis revealed four structural bindingenvironments, three of which involved sulfur ligands. Two of thebinding environments identified are reported for the first time.One is a multinuclear Hg-SR coordination structure observed atlow amounts of adsorbed Hg and the other is indicative of Hgbonded to thiolated aromatic subunits observed at high amountsof adsorbed Hg. We first present results for the adsorptionisotherms and XANES spectra of the sulfur speciation in thepeats, followed by results for the individual binding environ-ments derived from the EXAFS spectra.
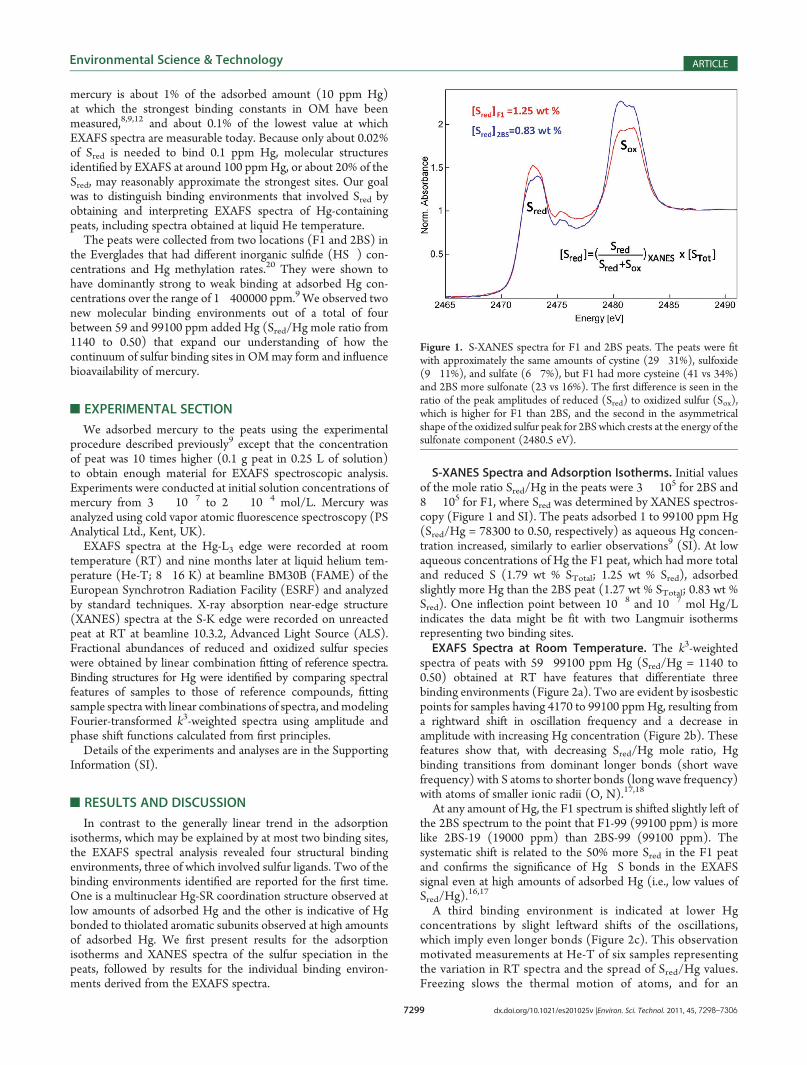
S-XANES Spectra and Adsorption Isotherms. Initial valuesof the mole ratio Sred/Hg in the peats were 3 � 105 for 2BS and8 � 105 for F1, where Sred was determined by XANES spectros-copy (Figure 1 and SI). The peats adsorbed 1 to 99100 ppm Hg(Sred/Hg = 78300 to 0.50, respectively) as aqueous Hg concen-tration increased, similarly to earlier observations9 (SI). At lowaqueous concentrations of Hg the F1 peat, which had more totaland reduced S (1.79 wt % STotal; 1.25 wt % Sred), adsorbedslightly more Hg than the 2BS peat (1.27 wt % STotal; 0.83 wt %Sred). One inflection point between 10�8 and 10�7 mol Hg/Lindicates the data might be fit with two Langmuir isothermsrepresenting two binding sites.EXAFS Spectra at Room Temperature. The k3-weighted
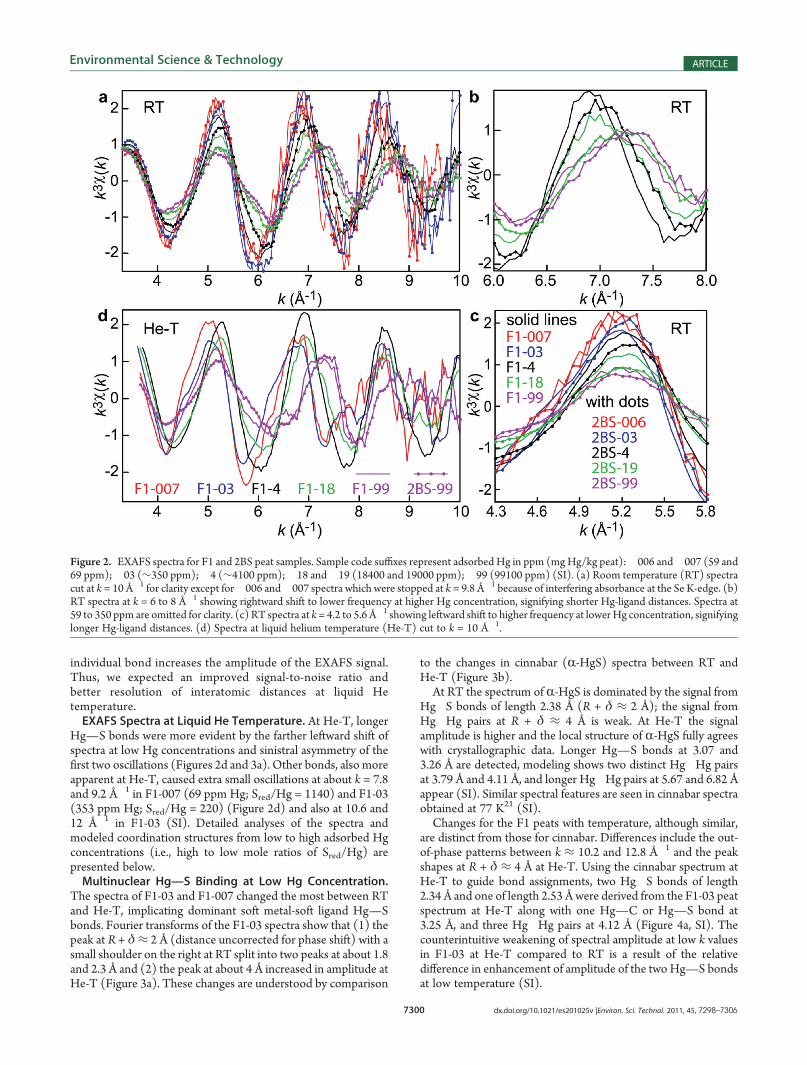
spectra of peats with 59�99100 ppm Hg (Sred/Hg = 1140 to0.50) obtained at RT have features that differentiate threebinding environments (Figure 2a). Two are evident by isosbesticpoints for samples having 4170 to 99100 ppmHg, resulting froma rightward shift in oscillation frequency and a decrease inamplitude with increasing Hg concentration (Figure 2b). Thesefeatures show that, with decreasing Sred/Hg mole ratio, Hgbinding transitions from dominant longer bonds (short wavefrequency) with S atoms to shorter bonds (long wave frequency)with atoms of smaller ionic radii (O, N).17,18
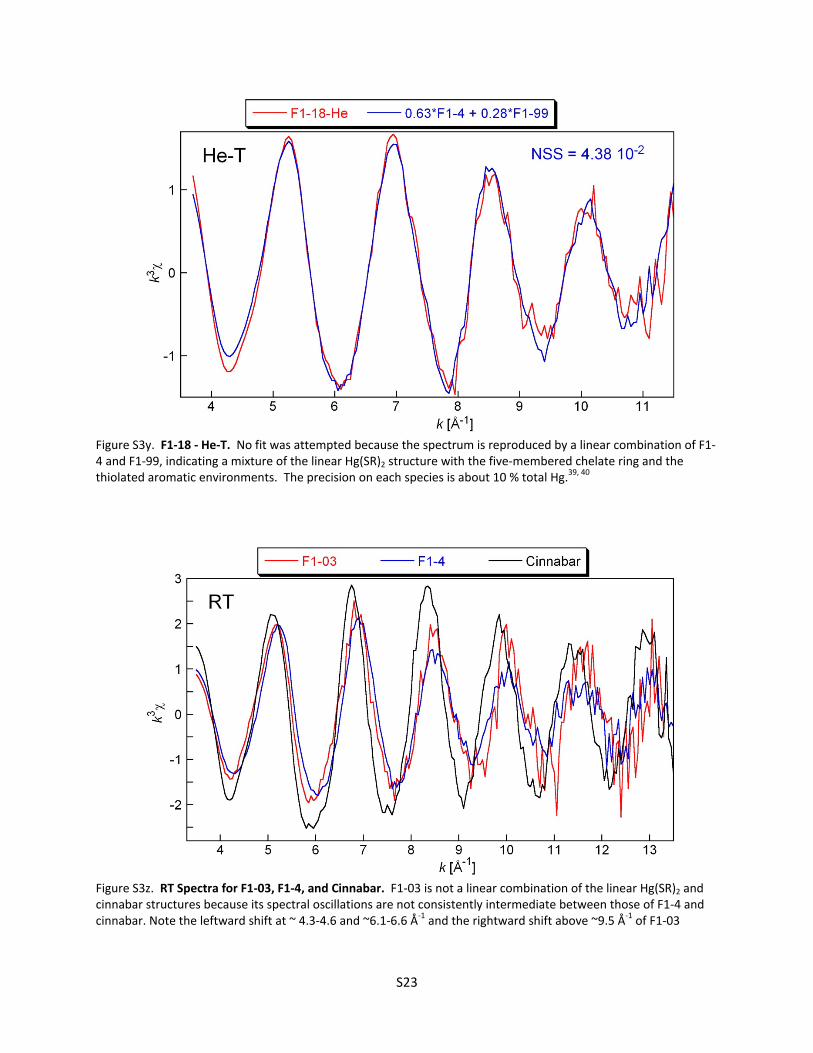
At any amount of Hg, the F1 spectrum is shifted slightly left ofthe 2BS spectrum to the point that F1-99 (99100 ppm) is morelike 2BS-19 (19000 ppm) than 2BS-99 (99100 ppm). Thesystematic shift is related to the 50% more Sred in the F1 peatand confirms the significance of Hg�S bonds in the EXAFSsignal even at high amounts of adsorbed Hg (i.e., low values ofSred/Hg).
16,17
A third binding environment is indicated at lower Hgconcentrations by slight leftward shifts of the oscillations,which imply even longer bonds (Figure 2c). This observationmotivated measurements at He-T of six samples representingthe variation in RT spectra and the spread of Sred/Hg values.Freezing slows the thermal motion of atoms, and for an
Figure 1. S-XANES spectra for F1 and 2BS peats. The peats were fitwith approximately the same amounts of cystine (29�31%), sulfoxide(9�11%), and sulfate (6�7%), but F1 had more cysteine (41 vs 34%)and 2BS more sulfonate (23 vs 16%). The first difference is seen in theratio of the peak amplitudes of reduced (Sred) to oxidized sulfur (Sox),which is higher for F1 than 2BS, and the second in the asymmetricalshape of the oxidized sulfur peak for 2BSwhich crests at the energy of thesulfonate component (2480.5 eV).
individual bond increases the amplitude of the EXAFS signal.Thus, we expected an improved signal-to-noise ratio andbetter resolution of interatomic distances at liquid Hetemperature.EXAFS Spectra at Liquid He Temperature. At He-T, longer
Hg—S bonds were more evident by the farther leftward shift ofspectra at low Hg concentrations and sinistral asymmetry of thefirst two oscillations (Figures 2d and 3a). Other bonds, also moreapparent at He-T, caused extra small oscillations at about k = 7.8and 9.2 Å�1 in F1-007 (69 ppm Hg; Sred/Hg = 1140) and F1-03(353 ppm Hg; Sred/Hg = 220) (Figure 2d) and also at 10.6 and12 Å�1 in F1-03 (SI). Detailed analyses of the spectra andmodeled coordination structures from low to high adsorbed Hgconcentrations (i.e., high to low mole ratios of Sred/Hg) arepresented below.Multinuclear Hg—S Binding at Low Hg Concentration.
The spectra of F1-03 and F1-007 changed the most between RTand He-T, implicating dominant soft metal-soft ligand Hg—Sbonds. Fourier transforms of the F1-03 spectra show that (1) thepeak at R + δ≈ 2 Å (distance uncorrected for phase shift) with asmall shoulder on the right at RT split into two peaks at about 1.8and 2.3 Å and (2) the peak at about 4 Å increased in amplitude atHe-T (Figure 3a). These changes are understood by comparison
to the changes in cinnabar (R-HgS) spectra between RT andHe-T (Figure 3b).At RT the spectrum of R-HgS is dominated by the signal from
Hg�S bonds of length 2.38 Å (R + δ ≈ 2 Å); the signal fromHg�Hg pairs at R + δ ≈ 4 Å is weak. At He-T the signalamplitude is higher and the local structure of R-HgS fully agreeswith crystallographic data. Longer Hg—S bonds at 3.07 and3.26 Å are detected, modeling shows two distinct Hg�Hg pairsat 3.79 Å and 4.11 Å, and longer Hg�Hg pairs at 5.67 and 6.82 Åappear (SI). Similar spectral features are seen in cinnabar spectraobtained at 77 K21 (SI).Changes for the F1 peats with temperature, although similar,
are distinct from those for cinnabar. Differences include the out-of-phase patterns between k ≈ 10.2 and 12.8 Å�1 and the peakshapes at R + δ ≈ 4 Å at He-T. Using the cinnabar spectrum atHe-T to guide bond assignments, two Hg�S bonds of length2.34 Å and one of length 2.53 Åwere derived from the F1-03 peatspectrum at He-T along with one Hg—C or Hg—S bond at3.25 Å, and three Hg�Hg pairs at 4.12 Å (Figure 4a, SI). Thecounterintuitive weakening of spectral amplitude at low k valuesin F1-03 at He-T compared to RT is a result of the relativedifference in enhancement of amplitude of the twoHg—S bondsat low temperature (SI).
Figure 2. EXAFS spectra for F1 and 2BS peat samples. Sample code suffixes represent adsorbed Hg in ppm (mgHg/kg peat):�006 and�007 (59 and69 ppm);�03 (∼350 ppm);�4 (∼4100 ppm);�18 and�19 (18400 and 19000 ppm);�99 (99100 ppm) (SI). (a) Room temperature (RT) spectracut at k = 10 Å�1 for clarity except for�006 and�007 spectra which were stopped at k = 9.8 Å�1 because of interfering absorbance at the Se K-edge. (b)RT spectra at k = 6 to 8 Å�1 showing rightward shift to lower frequency at higher Hg concentration, signifying shorter Hg-ligand distances. Spectra at59 to 350 ppm are omitted for clarity. (c) RT spectra at k= 4.2 to 5.6 Å�1 showing leftward shift to higher frequency at lowerHg concentration, signifyinglonger Hg-ligand distances. (d) Spectra at liquid helium temperature (He-T) cut to k = 10 Å�1.
Comparison of the Hg-SR structure in the peat and metacin-nabar (β-HgS) at He-T is also warranted, but is not straightfor-ward. Although the spectra for metacinnabar and cinnabar(R-HgS) are distinct at RT, the spectrum of β-HgS is similarto that of cinnabar (R-HgS) at He-T, indicating that the structureof the metastable mercuric sulfide (β-HgS) approaches that ofcinnabar (R-HgS) near absolute zero (SI). Such a structuraltransition is consistent with the relative thermodynamic stabilityof the two phases: metacinnabar is the stable phase at highertemperature.22 The transition is also consistent with a reductionin crystallographic symmetry from cubic (β-HgS) to trigonal(R-HgS) as temperature is lowered. A similar transition wasreported recently for magnetite which changed structure fromcubic to monoclinic at about 125 K.23 The spectrum of thestructurally transformed metacinnabar does not match that ofF1-03 at He-T (SI).We used the bond distances derived for F1-03 at He-T as
initial conditions for modeling the RT F1-03 spectrum. A good fitwas obtained with two S atoms at 2.35 Å, 0.6 S at 2.57 Å, and 1.6Hg at 4.14 Å (SI); the 3.25 Å distance was not detected. Like forcinnabar, fewer longer Hg—S and Hg—Hg distances wererevealed at RT than at He-T, but none changed significantly(SI). In addition, F1-03 does not match either metacinnabar,which has all Hg—S bonds at 2.51 Å, or cinnabar at RT (SI).Freezing did not change the unique binding between Hg and S inthe peat: the multinuclear Hg-SR structure, which is nanosizedand surrounded by a relatively flexible organic matrix, is stable.
Organic materials are commonly examined in the frozen stateby EXAFS spectroscopy to avoid formation of free radicalsthat cause photoreduction.24,25 However, there is virtually noevidence for degraded RT structures during synchrotron mea-surements of Hg binding to OM,16�18 likely in part because ofthe strong bonds that form betweenHg and Sred. In fact, the smalloscillation near 7.8 �1 at He-T in F1-007 and F1-03 (Sred/Hg =1140 and 220) caused by Hg�Hg pairs is also perceptible in RTspectra of soil OM at Sred/Hg = 100 and 20.18 This is not onlyfurther evidence against photoreduction of strongly bound Hg atRT but also supports the conclusion that freezing did not inducethe multinuclear structure.The features of Hg�Hg pairs observed in the He-T spectra of
the peats may be visible in the spectra of soil OM at RT18 becausethe experimental soil OM�Hg solutions equilibrated for 1 wk18
compared to 15 h in the peat OM-Hg solutions. Mercury atomscould have had time to move to higher affinity protein-like Sredsites even though the soil OM had 75% less Sred than theEverglades peats. A similar kinetic effect may have contributedto visualizing the longer bond distances in our He-T analysesgiven the nine-month interval between the measurements at thetwo temperatures. In addition, the greater amount of Sred in thepeats may have accelerated the change in binding enough todetect themultinuclear cluster in themodeled RT spectra despitethe short equilibration time. The final pH of our peat experi-ments was 5�6 vs a pH near 4 for the soil OM.18 If apparent pKa
values of thiols in peats are in the range of those for plant
Figure 3. EXAFS spectra (left) and Fourier transforms (right) for F1�03 peat (353 ppm Hg) and cinnabar (R-HgS). Imaginary parts of the Fouriertransforms show that the differences in the EXAFS frequencies observed in k-space at RT and He-T come from the magnification at low temperature ofdistant Hg—S and Hg—Hg pairs. (a) F1-03 at RT and He-T. (b) R-HgS at RT and He-T. Amplitudes for the spectra and Fourier transforms of R-HgSwere reduced by multiplicative factors to aid comparison of peak shapes and positions.
metallothioneins,26 then accelerated binding of Hg in the peatalso could be explained by more deprotonated sites at higher pH.Similarity of Multinuclear Hg�S Structure to Metal�
Thiolate Clusters in Metallothionein Proteins. The averageHg�S structure can be described as a tetrameric cluster (Hg4Sx)in which three-coordinate molecular units of one Hg atom withtwo short bonds (2.34 Å) and one longer bond (2.53 Å) to S atomsare arranged so that any two Hg atoms are about 4.12 Å apart(Figure 4a). The bonds around any Hg atom form a Y-shape,19
precluding successful modeling of the peak at R + δ≈ 4 Å in theFourier transforms at both temperatures as multiple-scatteringfrom a linear Hg(SR)2 complex18 (SI). At least 0.5 mol % of Sredmust be in the cluster, similar to the 0.15�1% deduced for strongbinding constants of Hg in other OM samples.8,9,15
The Hg4Sx model cluster resembles polynuclear-thiolate clus-ters in Cu(I) metalloproteins and metal-peptide compounds.27
Cu(I)4S6-type structures with three-coordinate metal centersoccur in metallochaperone and metallothionein (MT) proteinswith CXC (CysXaaCys) amino acid consensus sequences frommammals and yeast.28�32 These structuresmimic organometallic[Cu4(SPh)6]
2-, which contains thiolated aromatics.33
Structures of Hg metalloproteins are few and varied. Onethree-coordinate unit with Hg—S bond length of 2.43(2) Å wasobserved in the merR-regulatory protein,34 and one with eithertwo 2.34 Å and one 2.47 Å or three 2.39 Å Hg—S bonds in a denovo Hg(II)-metalloprotein.35 In Hg7-MT, Hg is bonded toeither two S atoms at 2.33(2) Å (and possibly two other S at3.4 Å)36 or to three S at 2.42(2) Å,37 whereas in Hg18-MT Hg isbonded to two S atoms at 2.42(3) Å and one Cl at 2.57 Å;36 noHg�Hg distances were reported for either Hg-MT. The crystalstructure of the metallochaperone Hah1 in the presence of Hghas a distorted tetrahedral coordination with one Hg bonded to
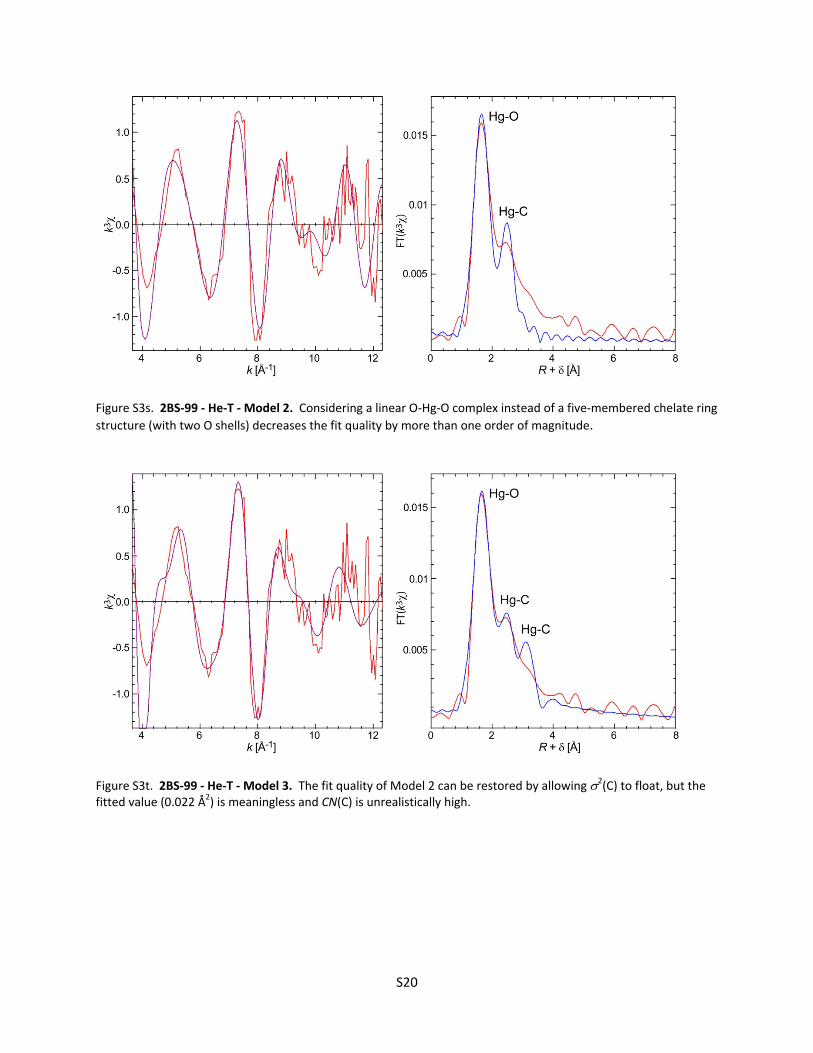
Figure 4. EXAFS spectra, Fourier transforms, and model structures of dominant Hg binding structures (left to right) and correspondence with Sred/Hgin the peats (far right). (a) F1�03 (353 ppmHg) at RT andHe-Twithmodel fits. Schematic multinuclear Hg4Sx structure is at right. Data analysis showsthat the Hg—S distance at 2.53�2.57 Å contributes to the right tail of the first peak (SI). Imaginary parts of the Fourier transforms were omitted forclarity. (b) F1-4 (~4100 ppm Hg) and Hg(Cys)2 reference solution at He-T. The modeled Hg(SR)2 structure is shown at the upper right. (c) F1-99(99100 ppm) and 2BS-99 (99100 ppm) at He-T. A schematic of the five-membered (O,N) chelate ring structure in 2BS-99 is shown at the lower right.Modeled bond distances and coordination numbers in F1-99 suggest the hypothetical structure linking Hg to aromatic rings at the upper right. Atomscoded as oxygen are indistinguishable from nitrogen.
one S at 2.3 Å, two S at 2.5 Å, and one S at 2.8 Å.38 One Hg atomis thought to bind to two Hah1 molecules each with CXXCsequences. Molecules with CXXC sequences usually form two-coordinate structures as in the MerP Hg(II) transport protein.39
Three-coordinate binding in a multinuclear cluster was inferredfor Hg-loaded MT from Cicer arietinum (chickpea) using UV-visspectroscopy.40
Hg(SR)2, Chelate Ring, and Thiolated Aromatic Structuresat Higher Hg Concentrations. A linear Hg(SR)2 structure wasdominant in the F1-4 peat with 4180 ppm Hg (Sred/Hg = 18.7).This structure has the same shorter Hg—S bonds (2.33 Å at He-T and 2.35 Å at RT) as the cluster, but not the longer Hg—Sbond (2.53 Å) and Hg�Hg distance (4.12 Å): there is neithera spectral shift to lower k nor extra oscillations at higher k(Figure 4b). The spectrum and Fourier transform at He-Tmatchthose for our 1:2 Hg-cysteine solution (Hg(Cys)2), and similarlyfrozen Hg-cysteine solids,41 and Hg-cysteine and Hg-glutathionesolutions.41,42 Linearity is confirmed by the peak atR+δ≈ 4 Å inthe Fourier transform at He-T, caused by multiple scatteringpaths (SI). Only 65% of the Hg(Cys)2 spectrum is needed tomatch the F1�4 spectrum indicating that at least 20�25% of theHg is bonded to O and/or N (Figure 4b).The other sample having a dominant binding environment
was 2BS-99 (99100 ppm Hg and Sred/Hg = 0.50). The spectraindicate shorter bonds between Hg and lower Z atoms (Figures 2and 4c). In the best model, Hg bonds to one O atom at 2.02 Å,oneO orN atom at 2.45 Å, oneC atom at 2.87 Å, and oneC atomat 3.28 Å (SI). The structure is likely a five-membered chelatering with one carboxylate O and amino N (R-HN2) or alcohol O(R-OH) from an R-substituted carbon, similar to structures formonomethylmercury binding to amino acids43,44 and for Hg andCu(II) complexed to soil OM and humic acid.18,24
The second new Hg�S structure appeared in F1-99 (alsohaving 99100 ppmHg, but a higher Sred/Hg of 0.80 compared to2BS-99). A small oscillation at about 6.7 Å�1 and the shift of thethird oscillation at 8 Å�1 in the He-T spectrum are distinctive(Figure 4c). The best model gives an average structure aroundHg of one O or N atom at 2.02 Å, 0.4 S atoms at 2.34 Å, two Catoms at 2.97 Å, and four C atoms at 3.28 Å (SI). The number ofC atoms along with S suggests the presence of thiolated aromaticunits.45 However, the low amount of S indicates that this struc-ture is mixed mainly with the (O,N) chelate ring seen in 2BS-99.The spectra of F1-18 (18400 ppm Hg; Sred/Hg = 4.3) could
not be modeled successfully from first principles because therewas no dominant binding environment. Instead, RT and He-Tspectra were analyzed by linear combination fitting using spectrafrom the other peat samples. Sample F1-18 has about 67% F1-4type bonds and 33% of themixture of bondsmodeled in F1-99 (SI),further supporting a continuum in binding environments.Environmental Implications. As the concentration of ad-
sorbed Hg increased, the Hg atoms filled increasing amounts ofprogressively weaker binding sites. Binding of highest to lowestaffinity corresponds in order to the Hg4Sx cluster, linearHg(SR)2, thiolated aromatic, and five-membered chelate ringsites (Figure 4). The first three reinforce the importance ofthiolate ligands even at relatively low values of Sred/Hg, whereOH and N ligands are in great excess. Other relatively weakbinding sites withO andN ligandsmay exist at low values of Sred/Hg, but could not be distinguished in this study. Also, the EXAFSspectroscopic data obtained here cannot be used to differentiateO from N ligands such as the imidazole component of histidinewhich can bind metals in protein structures.46 A four-coordinate
Hg-SR structure like that observed, for example, in the HgHah1metallochaperone protein38 or the Hg(Cys)4 species inHg-cysteine solutions with H2Cys/Hg(II) > 541 might form athigher values of Sred/Hg than investigated here. However, thelonger bond-length expected for such a structure19 was neverdominant in the peat samples.Thiols may be incorporated into OM as components of bio-
molecules such as metallothioneins and phytochelatins. Metal-lothioneins, which have high contents of cysteinyl thiols, areproduced by bacteria and eukaryoa and possibly by archaea.26,47,48
Photosynthetic organisms also produce phytochelatins, whichare glutathione-based peptides with (γ-Glu-Cys)nGly (PCn,n = 2�11). In addition, thiols can be formed when hydrogensulfide, typically generated by bacterial sulfate reduction,49�51
adds to unsubstituted double bonds in alkenes and aromaticsfrom tannins, lignins, and terpenoids.52,53
Reduced sulfur in the peats has XANES character like that ofthiols in cysteine and disulfide bridges in cystine (SI); that is, thereduced sulfur that forms metal�thiolate clusters in metallopro-teins. Such clusters typically have 2�11 metal centers54withevidence in bacterial, animal, and plant MTs that histidine re-sidues stabilize the negative charge of the cluster.55 Histidineresidues can also be part of the coordination structure.46 Valuesequal to 2�2.7 observed for the ratios of protons exchanged forlow amounts of adsorbed Hg in DOM and soil OM at pH e710,13 imply x = 8�11 in the Hg4Sx structure, in the range oftypical numbers of S atoms in MT metal�thiolate clusters.Living organisms can control the binding of metals to stable
clusters in MTs by cellular redox reactions 56,57 and rapid metalexchange can occur through protein folding and unfolding.58
Metal�thiolate clusters in plant MTs tend to be somewhat lessstable than those in most vertebrate MTs at comparable pH,26,59
which may be related to fewer cysteine residues and longer linkerchains between domains in plant MTs. Upon cellular death,metal�thiolate clusters might become incorporated in OMwhereas amino acid linker segments likely decompose.Mercury(II) binds more strongly than Cu(I), Cd(II), Pb(II),
and Zn(II) to MTs and model peptides in vitro60�62 and inphytochelatins the strength of metal binding is higher with lengthof the peptides (i.e., with more cysteine).63,64 Phytochelatin�metal complexes can be stabilized if plants or fungi produceexcess sulfide.65�67 Phytochelatins, MTs, and intracellular sulfideproduction may all explain Hg-rich granules in roots of plantsgrown in vivo68�70 and in a contaminated saltmarsh.71
In the Everglades peats, the Sred in the thiolate ligands thatformed the experimental Hg4Sx type of clusters may originate ascysteine inMTs or phytochelatins in sawgrass (2BS), cattail (F1)(SI), and periphyton72 or in MTs produced by aquatic in-vertebrates,73 fungi, and bacteria. Thiols also could havebeen added to the peats during bacterial reduction of aqueoussulfate.20
The two new Hg-SR structures we identified may elucidateother interactions between OM and Hg species. Formation ofmercury-thiolate clusters might explain why metacinnabar wasinhibited from precipitating in DOM solutions to which Hg wasadded first (<5� 10�8 M; Sred/Hg∼ 60) followed by sulfide.74
A thiolated aromatic structure could clarify why cinnabar dis-solution rates increasedwith greater aromaticity of DOMand notreduced sulfur content.75,76 Multinuclear clusters might beretained and/or nucleate HgS minerals as peat transforms tocoal during burial. This is supported by isotopic signatures ofpresumed organic-bound vs hydrothermally sourced Hg in coal.77
Mercury-SR bonds, in general, could also explain the origin of Hgin petroleum or natural gas.The observed Hg-SR structures raise other questions. What is
the origin of the mercury-thiolate cluster? Are metalloproteinsand peptides added to peat directly from plants and otherorganisms living in the aquatic environment? If so, did the Hgadded during the experiments displace other trace metals origin-ally complexed in these biomolecules? Is the Hg4Sx cluster thestrongest binding site for Hg in peat and by implication otherforms of natural organic matter, and if so, is this Hg available orunavailable for methylation? Further characterization of specificbiomolecules inmacromolecular natural organicmatter would bea step forward toward linking cellular functions in living organ-isms to sequestration of trace metals by organic materials inthe earth.
’ASSOCIATED CONTENT
bS Supporting Information. Descriptions of methods.Adsorption isotherms. Model fits of S-K edge XANES and Hg-L3EXAFS spectra with tables of fit parameters. Microfluorescenceand microdiffraction analysis for S and Fe�S species. This materialis available free of charge via the Internet at http://pubs.acs.org.
Present Addresses^Integral Consulting Inc., 285 Century Place, Suite 190, Louis-ville, Colorado 80027.
’ACKNOWLEDGMENT
Support was provided to K.LN. and J.N.R. from NSF grantsEAR-0447310 and EAR-0447386; to K.L.N., A.M., G.R.A., andJ.N.R. by the Office of Science (BER), U.S. DOE; to A.M. fromthe ANR-CNRS-ECCO Program; and, to G.R.A. from the U.S.Geological Survey Priority Ecosystems Science Program. Wethank K. Butler (USGS), J.L. Hazemann (CNRS), O. Proux(CNRS), andM.Marcus (ALS) for their technical assistance andB. Lanson and N. Findling (CNRS, ISTerre) for the XRDanalysis of cinnabar and metacinnabar (SI). Beamtime at theESRF was provided by the French CRG program of the CNRSand by the ESRF. The ALS is supported by the Director, Office ofScience, Office of Basic Energy Sciences, Materials SciencesDivision of the U.S. Department of Energy under ContractDE-AC03-76SF00098 at the Lawrence Berkeley National La-boratory. The use of brand names is for identification purposesonly and does not imply endorsement by the USGS. We thankthree anonymous reviewers who provided thoughtful commentsused in revising the manuscript.
’REFERENCES
(1) Benoit, J. M.; Gilmour, C. C.; Mason, R. P.; Heyes, A. Sulfidecontrols onmercury speciation and bioavailability tomethylating bacteria insediment pore waters. Environ. Sci. Technol. 1999, 33, 951–957.(2) Schaefer, J. K.; Morel, F. M. M. High methylation rates of
mercury bound to cysteine by Geobacter sulfurreducens. Nat. Geosci.2009, 2, 92–93.
(3) Pickhardt, P. C.; Fisher, N. S. Accumulation of inorganic andmethylmercury by freshwater phytoplankton in two contrasting waterbodies. Environ. Sci. Technol. 2007, 41, 125–131.
(4) Gorski, P. R.; Armstrong, D. E.; Hurley, J. P.; KrabbenhoftD. P. Influence of natural dissolved organic carbon on the bioavail-ability of mercury to a freshwater alga. Environ. Pollut. 2008, 154116–123.
(5) Hammerschmidt, C. R.; Fitzgerald, W. F.; Balcom, P. H.; Visscher,P. T. Organic matter and sulfide inhibit methylmercury production insediments ofNewYork/New JerseyHarbor.Mar.Chem.2008,109, 165–182.
(6) Cheesman, B. V.; Arnold, A. P.; Rabenstein, D. L. Nuclearmagnetic resonance studies of the solution chemistry of metal com-plexes. 25. Hg(thiol)3 complexes and Hg(II)-thiol ligand exchangekinetics. J. Am. Chem. Soc. 1988, 110, 6359–6364.
(7) Skyllberg, U.; Xia, K.; Bloom, P. R.; Nater, E. A.; Bleam, W. F.Binding ofmercury to reduced sulfur in soil organicmatter along upland-peat soil transects. J. Environ. Qual. 2000, 29, 855–865.
(8) Haitzer, M.; Aiken, G. R.; Ryan, J. N. Binding of mercury(II) todissolved organic matter: The role of the mercury-to-DOM concentra-tion ratio. Environ. Sci. Technol. 2002, 36, 3564–3570.
(9) Drexel, R. T.; Haitzer, M.; Ryan, J. N.; Aiken, G. R.; Nagy, K. L.Mercury(II) sorption to two Florida Everglades peats: Evidence forstrong and weak binding and competition by dissolved organic matterreleased from the peat. Environ. Sci. Technol. 2002, 36, 4058–4064.
(10) Haitzer, M.; Aiken, G. R.; Ryan, J. N. Binding of mercury(II) toaquatic humic substances: Influence of pH and source of humic sub-stances. Environ. Sci. Technol. 2003, 37, 2436.
(11) Hsu-Kim, H.; Sedlak, D. L. Strong Hg(II) complexation inmunicipal wastewater effluent and surface waters. Environ. Sci. Technol.2003, 37, 2743–2749.
(12) Han, S.; Gill, G. A. Determination of mercury complexation incoastal and estuarine waters using competitive ligand exchange method.Environ. Sci. Technol. 2005, 39, 6607–6615.
(13) Khwaja, A. R.; Bloom, P. R.; Brezonik, P. L. Binding constantsof divalent mercury (Hg2+) in soil humic acids and soil organic matter.Environ. Sci. Technol. 2006, 40, 844–849.
(14) Gasper, J. D.; Aiken, G. R.; Ryan, J. N. A critical review of threemethods used for the measurement of mercury (Hg2+)-dissolved organicmatter stability constants. Appl. Geochem. 2007, 22, 1583–1597.
(15) Skyllberg, U. Competition among thiols and inorganic sulfidesand polysulfides for Hg andMeHg in wetland soils and sediments undersuboxic conditions: Illumination of controversies and implications forMeHg net production. J. Geophys. Res. 2008, 113, 1–14.
(16) Xia, K.; Skyllberg, U. L.; Bleam, W. F.; Bloom, P. R.; Nater,E. A.; Helmke, P. A. X-ray absorption spectroscopic evidence for thecomplexation of Hg(II) by reduced sulfur in soil humic substances.Environ. Sci. Technol. 1999, 33, 257–261.
(17) Hesterberg, D.; Chou, J. W.; Hutchison, K. J.; Sayers, D. E.Bonding of Hg(II) to reduced organic sulfur in humic acid as affected byS/Hg ratio. Environ. Sci. Technol. 2001, 35, 2741–2745.
(18) Skyllberg, U.; Bloom, P. R.; Qian, J.; Lin, C.-M.; Bleam, W. F.Complexation of mercury(II) in soil organic matter: EXAFS evidencefor linear two-coordination with reduced sulfur groups. Environ. Sci.Technol. 2006, 40, 4174–4180.
(19) Manceau, A.; Nagy, K. L. Relationships betweenHg(II)-S bonddistance andHg(II) coordination in thiolates.DaltonTrans.2008, 1421–1425.
(20) Gilmour, C. C.; Riedel, G. S.; Ederington, M. C.; Bell, J. T.; Gill,G. A.; Stordal, M. A. Methylmercury concentrations and productionrates across a trophic gradient in the northern Everglades. Biogeochem-istry 1998, 40, 327–345.
(21) Jew, A. D.; Kim, C. S.; Rytuba, J. J.; Gustin, M. S.; Brown, G. E.,Jr. New technique for quantification of elemental Hg in mine wastes andits implications for mercury evasion into the atmosphere. Environ. Sci.Technol. 2011, 45, 412–417.
(22) Potter, R. W.; Barnes, H. L. Phase relations in the binary Hg-S.Am. Mineral. 1978, 63, 1143–1152.
(23) Kasama, T.; Church, N. S.; Feinberg, J. M.; Dunin-Borkowski,R. E.; Harrison, R. J. Direct observation of ferrimagnetic/ferroelastic
domain interactions in magnetite below the Verwey transition. EarthPlanet. Sci. Lett. 2010, 297, 10–17.(24) Manceau, A.; Matynia, A. The nature of Cu bonding to natural
organic matter. Geochim. Cosmochim. Acta 2010, 74, 2556–2580.(25) Andrews, J. C. Mercury speciation in the environment using X-ray
absorption spectroscopy. Struct. Bonding (Berlin, Ger.) 2006, 120, 1–35.(26) Freisinger, E. Plant MTs-long neglected members of the
metallothionein superfamily. Dalton Trans. 2008, 47, 6649–6852.(27) Pickering, I. J.; George, G. N.; Dameron, C. T.; Kurz, B.;Winge,
D. R.; Dance, I. G. X-ray absorption spectroscopy of cuprous-thiolateclusters in proteins and model systems. J. Am. Chem. Soc. 1993, 115,9498–9505.(28) Brown, K. R.; Keller, G. L.; Pickering, I. J.; Harris, H. H.;
George, G. N.;Winge, D. R. Structures of the cuprous-thiolate clusters ofthe Mac1 and Ace1 transcriptional activators. Biochemistry 2002, 41,6469–6476.(29) Xiao, Z.; Loughlin, F.; George, G. N.; Howlett, G. J.; Wedd,
A. G. C-terminal domain of themembrane copper transporter Ctr1 fromSaccharomyces cerevisiae binds four Cu(I) ions as a cuprous-thiolatepolynuclear cluster: Sub-femtomolar Cu(I) affinity of three proteinsinvolved in copper trafficking. J. Am. Chem. Soc. 2004, 126, 3081–3090.(30) Voronova, A.; W., M.-K.; Meyer, T.; Rompel, A.; Krebs, B.; J.,
K.; Sillard, R.; Palumaa, P. Oxidative switches in functioning ofmammalian copper chaperone Cox17. Biochem. J. 2007, 408, 139–148.(31) Stasser, J. P.; Siluvai, G. S.; Barry, A. N.; Blackburn, N. J. A
multinuclear copper(I) cluster forms the dimerization interface incopper-loaded human copper chaperone for superoxide dismutase.Biochemistry 2007, 46, 11845–11856.(32) Bogumil, R.; Faller, P.; P.-A., B.; Va�s�ak, M.; Charnock, J. M.;
Garner, C. D. Structural characterization of Cu(I) and Zn(II) sites inneuronal-growth-inhibitory factor by extended X-ray absorption finestructure (EXAFS). Eur. J. Biochem. 1998, 255, 172–177.(33) Dance, I. G.; Calabrese, J. C. The crystal and molecular
structure of the hexa-(μ2benzenethiolato)tetracuprate(I) dianion. Inorg.Chim. Acta 1976, 19, L41–L42.(34) Wright, J. G.; Tsang, H.-T.; Penner-Hahn, J. E.; O’Halloran,
T. V. Coordination chemistry of the Hg-MerR metalloregulatoryprotein: Evidence for a novel tridentate Hg-cysteine receptor site.J. Am. Chem. Soc. 1990, 112, 2434–2435.(35) Dieckmann, G. R.; McRorie, D. K.; Tierney, D. L.; Utschig,
L. M.; Singer, C. P.; O’Halloran, T. V.; Penner-Hahn, J. E.; DeGrado,W. F.; Pecoraro, V. L.De novo design of mercury-binding two- and three-helical bundles. J. Am. Chem. Soc. 1997, 119, 6195–6196.(36) Jiang, D. T.; Heald, S.M.; Sham, T. K.; Stillman,M. J. Structures
of the cadmium, mercury, and zinc thiolate clusters in metallothionein:XAFS study of Zn7-MT, Cd7-MT, Hg7-MT, and Hg18-MT formedfrom rabbit liver metallothionein 2. J. Am. Chem. Soc. 1994, 116,11004–11013.(37) Hasnain, S. S. Application of EXAFS to biochemical systems.
Top. Curr. Chem. 1988, 147, 73–93.(38) Wernimont, A. K.; Huffman, D. L.; Lamb, A. L.; O’Halloran,
T. V.; Rosenzwieg, A. C. Structural basis for copper transfer by themetallochaperone for the Menkes/Wilson disease proteins. Nat. Struct.Biol. 2000, 7, 766–771.(39) Steele, R. A.; Opella, S. J. Structures of the reduced and
mercury-bound forms of MerP, the periplasmic protein from thebacterial mercury detoxification system. Biochemistry 1997, 36, 6885–6895.(40) Schict, O.; Freisinger, E. Spectroscopic characterization ofCicer
arietinum metallothionein 1. Inorg. Chim. Acta 2009, 362, 714–724.(41) Jalilehvand, F.; Leung, B. O.; Izadifard, M.; Damian, E. Mercury-
(II) cysteine complexes in alkaline aqueous solution. Inorg. Chem. 2006,45, 66–73.(42) Mah, V.; Jalilehvand, F. Mercury(II) complex formation with
glutathione in alkaline aqueous solution. J. Biol. Inorg. Chem. 2008,13, 541–553.(43) Alex, S.; Savoie, R.; Corbeil, M.-C.; Beauchamp, A. L. Complexa-
tion of glycylglycine by the methylmercury cation: a vibrational spectros-copy and X-ray diffraction study. Can. J. Chem. 1986, 64, 148–157.
(44) Corbeil, M.-C.; Beauchamp, A. L.; Alex, S.; Savoie, R. Interac-tion of the methylmercury cation with glycine and alanine: a vibrationaland X-ray diffration study. Can. J. Chem. 1986, 64, 1876–1884.
(45) Alvarez-Puebla, R. A.; Valenzuela-Calahorro, C.; Garrido, J. J.Theoretical study on fulvic acid structure, conformation and aggregation: amolecular modeling approach. Sci. Total Environ. 2006, 358, 243–254.
(46) Penner-Hahn, J. E. Characterization of “spectroscopicallyquiet” metals in biology. Coord. Chem. Rev. 2005, 249, 161–177.
(47) Waldron, K. J.; Robinson, N. J. How do bacterial cells ensure thatmetalloproteins get the correct metal?Nat. Rev. Microbiol. 2009, 6, 25–35.
(48) Morris, C. A.; Nicolaus, B.; Sampson, V.; Harwood, J. L.; Kille,P. Identification and characterization of a recombinant metallothioneinprotein from a marine alga, Fucus vesiculosus. Biochem. J. 1999, 338,553–560.
(49) Casagrande, D. J.; Gronli, K.; Sutton, N. The distribution ofsulfur and organic matter in various fractions of peat: origins of sulfur incoal. Geochim. Cosmochim. Acta 1980, 44, 25–32.
(50) Francois, R. A study of sulphur enrichment in the humicfraction of marine sediments during early diagenesis. Geochim. Cosmo-chim. Acta 1987, 51, 17–27.
(51) Ferdelman, T. G.; Church, T. M.; Luther, G. W., III Sulfurenrichment of humic substances in a Delaware salt marsh sediment core.Geochim. Cosmochim. Acta 1991, 55, 979–988.
(52) Herkorn, N.; Benner, R.; Frommberger, M.; Schmitt-Kopplin,P.; Witt, M.; Kaiser, K.; Kettrup, A.; Hedges, J. I. Characterization of amajor refractory component of marine dissolved organic matter. Geo-chim. Cosmochim. Acta 2006, 70.
(53) Lam, B.; Baer, A.; Alaee, M.; Lefebvre, B.; Moser, A.; Williams,A.; Simpson, A. J. Major structural components in freshwater dissolvedorganic matter. Environ. Sci. Technol. 2007, 41, 8240–8247.
(54) Presta, A.; Fowle, D. A.; Stillman, M. J. Structural model ofrabbit liver copper metallothionein. Dalton Trans. 1997, 977–984.
(55) Blindauer, C. A.; Razi, M. T.; Campopiano, D. J.; Sadler, P. J.Histidine ligands in bacterial metallothionein enhance cluster stability.J. Biol. Inorg. Chem. 2007, 12, 393–405.
(56) Maret, W.; Vallee, B. L. Thiolate ligands in metallothioneinconfer redox activity on zinc clusters. Proc. Natl. Acad. Sci. U. S. A. 1998,95, 3478–3482.
(57) Song, F.; Briseno, A. L.; Zhou, F. Redox reactions of andtransformation between cysteine-mercury thiolate and cystine in me-tallothioneins adsorbed at a thinmercury film electrode. Langmuir 2001,17, 4081–4089.
(58) Duncan, K. E. R.; Ngu, T. T.; Chan, J.; Salgado, M. T.;Merrifield, M. E.; Stillman, M. J. Peptide folding, metal-binding mechan-isms, and binding site structures in metallothioneins. Exp. Biol. Med.2006, 231, 1488–1499.
(59) Robinson, N. J.; Tommey, A. M.; Kuske, C.; Jackson, P. J. Plantmetallothioneins. Biochem. J. 1993, 295, 1–10.
(60) Va�s�ak, M., Metal removal and substitution in vertebrate andinvertebratemetallothioneins.Methods Enzymol.Eds.; 1991, 205, 452�458.
(61) Stillman, M. J. Metallothioneins. Coord. Chem. Rev. 1995, 144461–511.
(62) Rousselot-Pailley, P.; S�en�eque, O.; Lebrun, C.; Crouzy, S.;Boturyn, D.; Dumy, P.; Ferrand, M.; P., D. Model peptides based on thebinding loop of the copper metallochaperone Atx1: Selectivity of theconsensus sequence MxCxxC for metal ions Hg(II), Cu(I), Pb(II), andZn(II). Inorg. Chem. 2006, 45, 5510–5520.
(63) Mehra, R. K.; Miclat, J.; Kodati, V. R.; Abdullah, R.; Hunter, T. C.;Mulchandani, P. Optical spectroscopic and reverse-phaseHPLC analyses ofHg(II) binding to phytochelatins. Biochem. J. 1996, 314, 73–82.
(64) Checkmeneva, E.; Diaz-Cruz, J. M.; Arino, C.; Esteban, M.Binding of Hg2+ with phytochelatins: Study by differential pulsevoltammetry on rotating Au-disk electrode, electrospray ionizationmass-spectrometry, and isothermal titration calorimetry. Environ. Sci.Technol. 2009, 43, 7010–7015.
(65) Reese, R. N.; Winge, D. R. Sulfide stabilization of the cadmium-γ-glutamyl peptide complex of Schizosaccharomyces pombe. J. Biol. Chem.1988, 263, 12832–12835.
(66) Steffens, J. C. The heavy-metal binding peptides of plants.Annu. Rev. Plant Physiol. Plant Mol. Biol. 1990, 41, 553–575.(67) Dameron, C. T.; Reese, R. N.; Mehra, R. K.; Kortan, A. R.;
Carroll, P. J.; Steigerwald, M. L.; Brus, L. E.;Winge, D. R. Biosynthesis ofcadmium sulphide quantum semiconductor crystallites. Nature 1989,338, 596–597.(68) Velasco-Alinsug, M. P.; Rivero, G. C.; Quibuyen, T. A. O.
Isolation ofmercury-binding peptides in vegetative parts ofChromolaenaodorata. Z. Naturforsch., C: J. Biosci. 2005, 60c, 252–259.(69) Iglesia-Turi~no, S.; Febrero, A.; Jauregui, O.; Caldelas, C.; Araus,
J. L.; J., B. Detection and quantification of unbound phytochelatin 2 inplant extracts of Brassica napus growth with different levels of mercury.Plant Physiol. 2006, 142, 742–749.(70) Patty, C.; Barnett, B.; Mooney, B.; Kahn, A.; Levy, S.; Liu, Y.;
Pianetta, P.; Andrews, J. C. Using X-ray microscopy and Hg L3 XANESto study Hg binding in the rhizosphere of Spartina cordgrass. Environ.Sci. Technol. 2009, 43, 7397–7402.(71) V�alega, M.; Lima, A. I. G.; Figueira, E. M. A. P.; Pereira, E.;
Pardal, M. A.; Duarte, A. C. Mercury intracellular partitioning andchelation in a salt marsh plant, Halimione portulacoides (L.) Aellen:Strategies underlying tolerance in environmental exposure.Chemosphere2009, 74.(72) Perales-Vela, H. G.; Pe~na-Castro, J. M.; Ca~nizares-Villanueva,
R. O. Heavy metal detoxifiation in eukaryotic microalgae. Chemosphere2006, 64, 1–10.(73) Amiard, J.-C.; Amiard-Triquet, C.; Barka, S.; Pellerin, J.; Rainbow,
P. S. Metallothioneins in aquatic invertebrates: Their role in metaldetoxification and their use as biomarkers. Aquat. Toxicol. 2006, 76,160–202.(74) Ravichandran, M.; Aiken, G. R.; Ryan, J. N.; Reddy, M. M.
Inhibition of precipitation and aggregation of metacinnabar (mercuricsulfide) by dissolved organic matter isolated from the Florida Ever-glades. Environ. Sci. Technol. 1999, 33, 1418–1423.(75) Ravichandran, M.; Aiken, G. R.; Reddy, M. M.; Ryan, J. N.
Enhanced dissolution of cinnabar (mercuric sulfide) by dissolvedorganic matter isolated from the Florida Everglades. Environ. Sci.Technol. 1998, 32, 3305–3311.(76) Waples, J. S.; Nagy, K. L.; Aiken, G. R.; Ryan, J. N. Dissolution
of cinnabar (HgS) in the presence of natural organic matter. Geochim.Cosmochim. Acta 2005, 69, 1575–1588.(77) Lefticariu, L.; Blum, J. D.; Gleason, J. D. Mercury isotope
evidence for multiple mercury sources in coal from the Illinois Basin.Environ. Sci. Technol. 2011, 45, 1724–1729.
S1
Supporting Information (SI)
Authors:
Kathryn L. Nagy,*† Alain Manceau,‡ Jarrod D. Gasper,§,|| Joseph N. Ryan, and George R. Aiken§ †Department of Earth & Environmental Sciences, MC‐186, 845 West Taylor Street, University of Illinois at Chicago, Chicago, IL 60607, USA; ‡ISTerre‐Maison des Géosciences, CNRS and Université J. Fourier, BP 53, 38041 Grenoble Cedex 9, France; §United States Geological Survey, Water Resources Division, 3215 Marine Street, Boulder, CO 80303; Department of Civil, Environmental, and Architectural Engineering, University of Colorado at Boulder, 428 UCB, Boulder, CO 80309‐0428 Title:
Metallothionein‐like multinuclear clusters of mercury(II) and sulfur in peat
Number of pages : 30 Number of tables : 3 Number of figures : 4 (Figure S1a‐b ; Figure S2a‐f ; Figure S3a‐z, Figure S4a‐b)
S2
Table of Contents
S1. Adsorption Experiments ....................................................................................................................................... S3 Table S1. Data for adsorption experiments ......................................................................................................... S3 Figure S1. Mercury(II) adsorption isotherms ....................................................................................................... S4
Figure S1a. Adsorbed Hg(II) vs. Solution Hg(II) at Equilibrium ........................................................ S4 Figure S1b. Reduced Sulfur/Adsorbed Hg(II) vs. Solution Hg(II) at Equilibrium .............................. S4
S2. XANES Spectroscopy ............................................................................................................................................. S4 S2.1 Measurements and data analysis ................................................................................................................ S4 S2.2 Results .......................................................................................................................................................... S5
Table S2. Fraction of S species from the linear decomposition of S‐XANES spectra .................................... S6 Figure S2. Sulfur XANES spectroscopy results ............................................................................................... S6
Figure S2a. Best five‐component fit to S‐XANES data for 2BS peat ................................................ S6 Figure S2b. Best five‐component fit to S‐XANES data for F1 peat .................................................. S6 Figure S2c. Six‐component fit to XANES spectrum of F1 peat ........................................................ S7 Figure S2d. Micro‐X‐ray fluorescence maps for the 2BS and F1 peats ........................................... S7 Figure S2e. Micro‐X‐ray diffraction of spot marked by arrow in Figure S2d. .................................. S8 Figure S2f. Comparison of S‐XANES spectra for bulk F1 and 2BS peats and spot S2BS‐3. .............. S8
S3. EXAFS Spectroscopy .............................................................................................................................................. S8 S3.1 Measurements and data analysis ................................................................................................................ S8 S3.2 Results .......................................................................................................................................................... S9
Figure S3. HgL3 EXAFS spectra (k‐space) and Fourier transforms (R‐space) with model fits ........................ S9 Figure S3a. Powder X‐ray diffraction pattern of metacinnabar with Rietveld analysis ............... S10
Figure S3b. Cinnabar (‐HgS) RT ‐ Model 1 ................................................................................... S11
Figure S3c. Cinnabar (‐HgS) RT ‐ Model 2 ................................................................................... S11
Figure S3d. Cinnabar (‐HgS) He‐T ............................................................................................... S12 Figure S3e. Metacinnabar (‐HgS) RT ........................................................................................... S12 Figure S3f. Metacinnabar (‐HgS) He‐T ........................................................................................ S13 Figure S3g. F1‐03 RT ‐ Model 1 ..................................................................................................... S13 Figure S3h. F1‐03 RT ‐ Model 2 ..................................................................................................... S14 Figure S3i. F1‐03 RT ‐ Model 3 ...................................................................................................... S14 Figure S3j. F1‐03 He‐T ‐ Model 1 ................................................................................................... S15 Figure S3k. F1‐03 He‐T ‐ Model 2 .................................................................................................. S15 Figure S3l. Why the amplitude of the EXAFS signal for F1‐03 decreases with temperature ....... S16 Figure S3m. F1‐4 RT ...................................................................................................................... S17 Figure S3n. F1‐4 He‐T .................................................................................................................... S17 Figure S3o. Hg(Cys)2 He‐T .............................................................................................................. S18 Figure S3p. 2BS‐99 RT ‐ Model 1 ................................................................................................... S18 Figure S3q. 2BS‐99 RT ‐ Model 2 ................................................................................................... S19 Figure S3r. 2BS‐99 He‐T ‐ Model 1 ................................................................................................ S19 Figure S3s. 2BS‐99 He‐T ‐ Model 2 ................................................................................................ S20 Figure S3t. 2BS‐99 He‐T ‐ Model 3 ................................................................................................ S20 Figure S3u. F1‐99 RT ...................................................................................................................... S21 Figure S3v. F1‐99 He‐T ‐ Model 1 .................................................................................................. S21 Figure S3w. F1‐99 He‐T ‐ Model 2 ................................................................................................. S22 Figure S3x. F1‐99 He‐T ‐ Model 3 .................................................................................................. S22 Figure S3y. F1‐18 He‐T ‐ Linear Combination Fit ........................................................................... S23
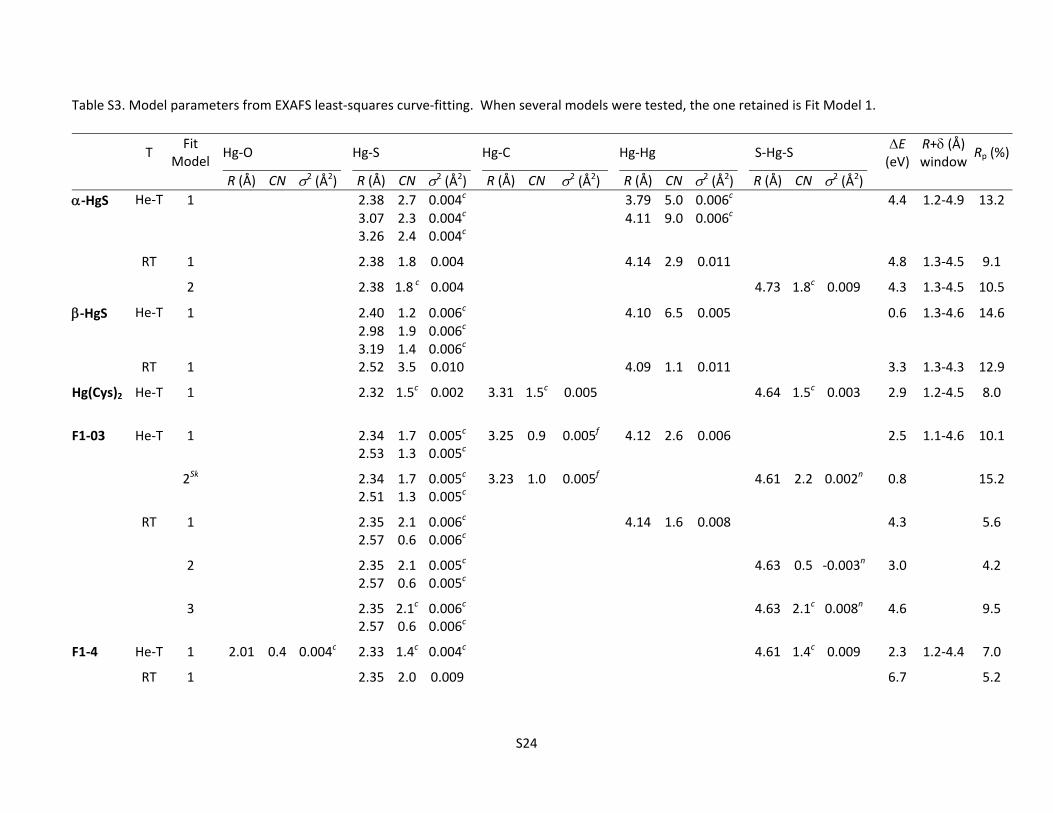
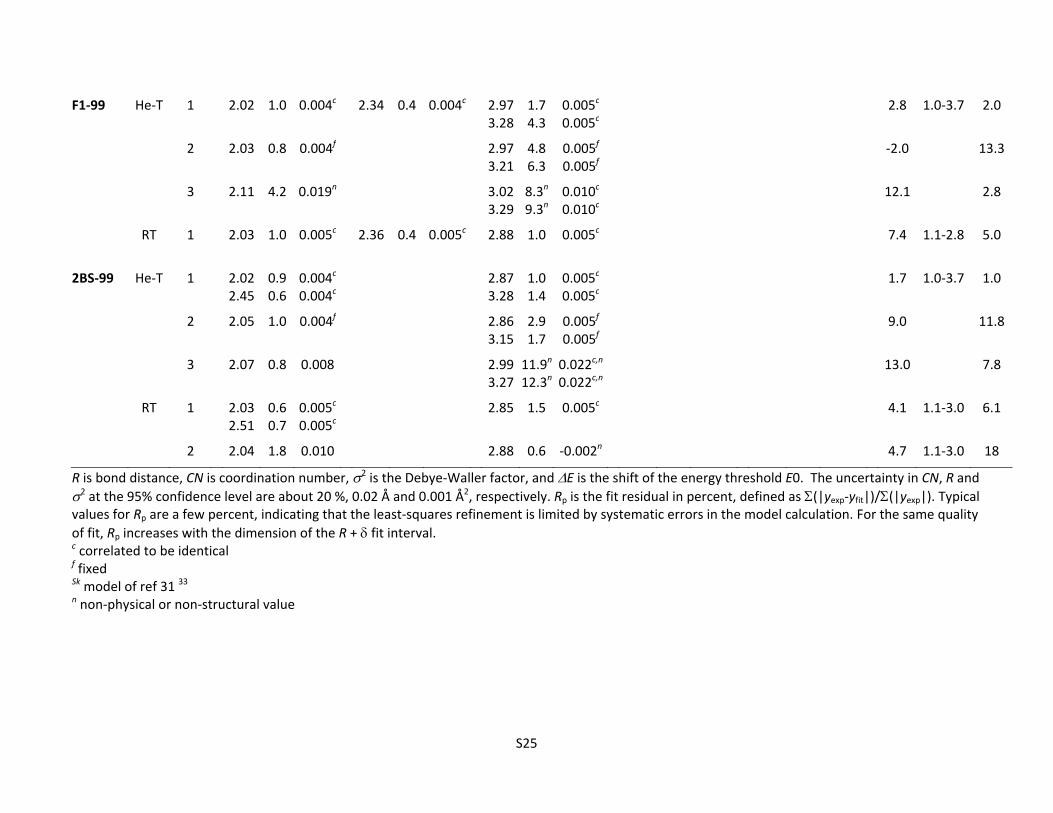
Figure S3z. RT Spectra for F1‐03, F1‐4, and ‐HgS ........................................................................ S23 Table S3. Model parameters from EXAFS least‐squares curve‐fitting ........................................................ S24
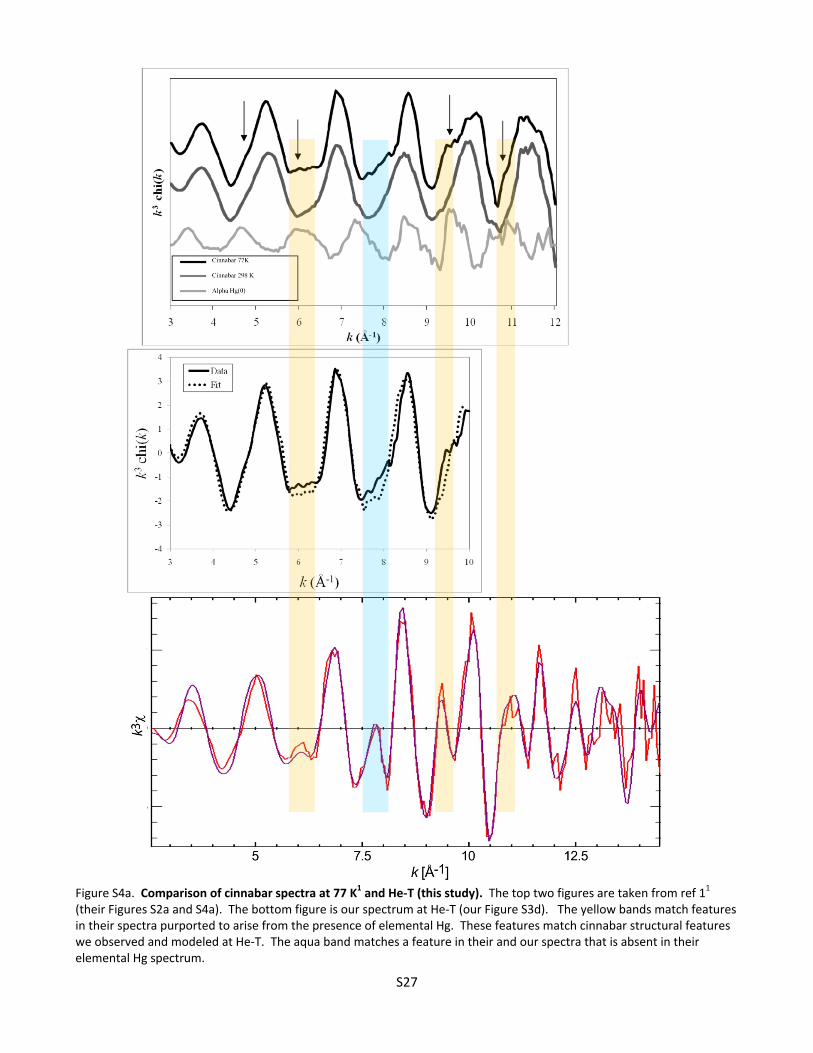
S4. Discussion of Cinnabar and Metacinnabar EXAFS Spectra as a Function of Temperature .............................. S26 Figure S4a. Comparison of cinnabar spectra at 77 K1 and He‐T (this study) ................................. S27 Figure S4b. Comparison of metacinnabar spectra at 77 K1 and He‐T (this study) ........................ S28
The peats were extracted from the top 10 cm of sediment in Water Conservation Areas (WCA) 2A (F1) and 2B (2BS) of the Florida Everglades, washed with deionized water, separated into a 74‐105
m fraction by wet‐sieving, air‐dried, and chemically analyzed.2, 3 After washing, the peats contained 98 (F1) and 180 (2BS) ppb Hg. The porewater at Site F1 contained more sulfide, sulfate, and DOM, and less oxygen than water at Site 2BS (0.22 vs. 0.063 x 10‐6 mol/L H2STotal; 470 vs. 69 x 10
‐6 mol/L SO42‐; 38 vs. 17
mg C/L; and, 10 vs. 100 x 10‐6 mol/L O2, respectively).3 Sediment monomethylmercury concentrations
were 1.4 x 10‐9 for the F1 site and 1.3 x 10‐8 mol/L CH3Hg for the 2BS site.4 Sawgrass (Cladium
jamaicensis) is the dominant plant at the 2BS site but cattail (Typha domingensis) has dominated at the eutrophic F1 site since the mid 1970s as a result of nutrient addition from canal waters.5, 6 Using peat accumulation rates measured in 1996,7 the top 10 cm at each site would largely represent these two different plants. Periphyton is also present at both sites. F1 periphyton has been characterized as green filamentous algae with relatively high chlorophyll a and bacteriochlorophyll8 and no calcareous material. 2BS periphyton is calcareous.6 Both sites have diatoms.
Experiments used 100 mg of peat in 0.25 L of 0.01 M NaNO3 adjusted to an initial pH of 6.0 ± 0.03 after which aqueous Hg(II) was added in the form of Hg(NO3)2 at initial concentrations of 3 x 10
‐7 to 2 x 10‐4 mol/L. Experiments lasted 15 h, sufficient for equilibration of the bulk adsorption reaction based on results where no change in the amount of adsorbed Hg(II) occurred after 1 h.3 The difference between initial and final aqueous Hg(II) concentrations yielded the sorbed amount (Table S1, Figure S1). The peat was separated from the solution by centrifugation and freeze‐dried for EXAFS analysis.
Released amounts of dissolved organic carbon (DOC) were 20 to 50% of those expected based on previous results.3 Between 0.6 and 1.2% of the initial peat mass dissolved (2.55 to 4.71 mg C/L) in no pattern except that the least dissolution occurred for the highest initial Hg concentrations (2BS‐99 and F1‐99). In 6 out of 7 cases, the 2BS peat produced slightly less DOC at a given initial Hg concentration. Final pH after reaction decreased by 0.2 to 0.7 pH units with lower values corresponding to higher Hg(II) loadings. Within the error of the pH measurement (± 0.02 pH units), the observed changes are within those expected for simple exchange of two hydroniums for every Hg2+ adsorbed. Table S1. Data for adsorption experiments. Expt.
F1 peat has 1.79 wt. % S (1.25 wt.% Sred); 2BS peat has 1.27 wt. % S (0.83 wt. % Sred)( see section S2)
DOC Dissolved Organic Carbon; na not applicable; nd not determined
RT spectra measured at room temperature; He‐T spectra measured at liquid helium temperature (8‐16 K)
S4
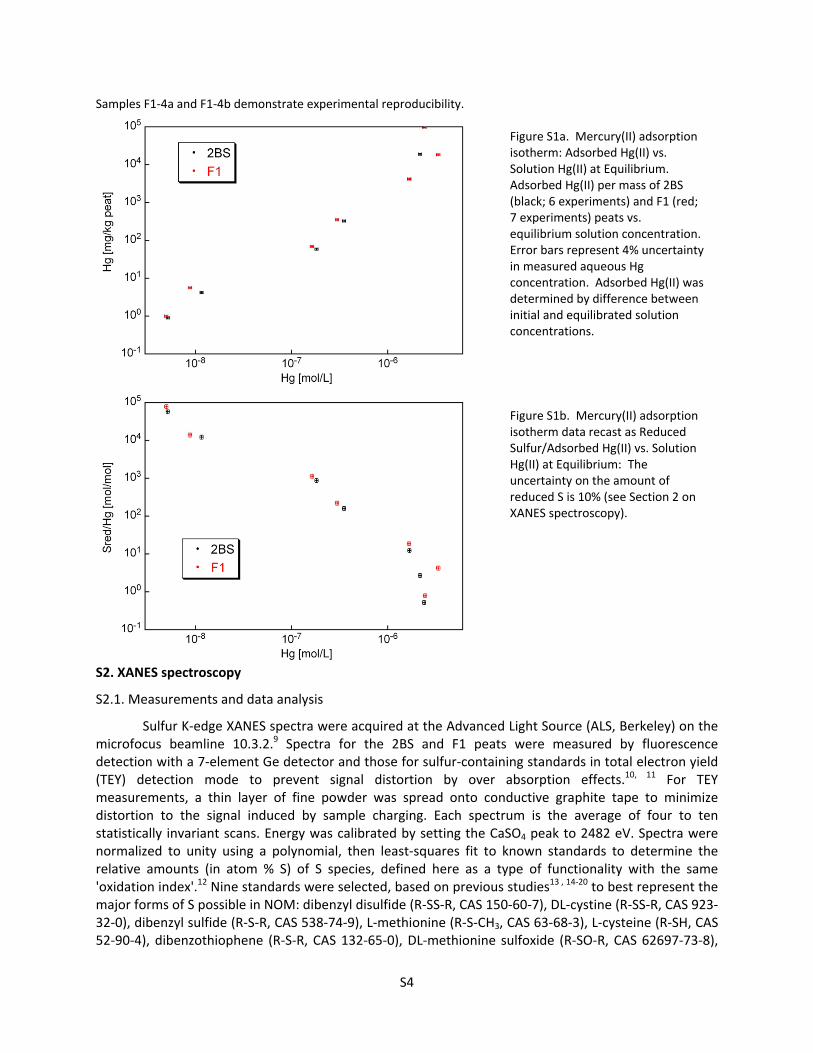
Samples F1‐4a and F1‐4b demonstrate experimental reproducibility.
Figure S1a. Mercury(II) adsorption isotherm: Adsorbed Hg(II) vs. Solution Hg(II) at Equilibrium. Adsorbed Hg(II) per mass of 2BS (black; 6 experiments) and F1 (red; 7 experiments) peats vs. equilibrium solution concentration. Error bars represent 4% uncertainty in measured aqueous Hg concentration. Adsorbed Hg(II) was determined by difference between initial and equilibrated solution concentrations.
Figure S1b. Mercury(II) adsorption isotherm data recast as Reduced Sulfur/Adsorbed Hg(II) vs. Solution Hg(II) at Equilibrium: The uncertainty on the amount of reduced S is 10% (see Section 2 on XANES spectroscopy).
S2. XANES spectroscopy
S2.1. Measurements and data analysis
Sulfur K‐edge XANES spectra were acquired at the Advanced Light Source (ALS, Berkeley) on the microfocus beamline 10.3.2.9 Spectra for the 2BS and F1 peats were measured by fluorescence detection with a 7‐element Ge detector and those for sulfur‐containing standards in total electron yield (TEY) detection mode to prevent signal distortion by over absorption effects.10, 11 For TEY measurements, a thin layer of fine powder was spread onto conductive graphite tape to minimize distortion to the signal induced by sample charging. Each spectrum is the average of four to ten statistically invariant scans. Energy was calibrated by setting the CaSO4 peak to 2482 eV. Spectra were normalized to unity using a polynomial, then least‐squares fit to known standards to determine the relative amounts (in atom % S) of S species, defined here as a type of functionality with the same 'oxidation index'.12 Nine standards were selected, based on previous studies13 , 14‐20 to best represent the major forms of S possible in NOM: dibenzyl disulfide (R‐SS‐R, CAS 150‐60‐7), DL‐cystine (R‐SS‐R, CAS 923‐32‐0), dibenzyl sulfide (R‐S‐R, CAS 538‐74‐9), L‐methionine (R‐S‐CH3, CAS 63‐68‐3), L‐cysteine (R‐SH, CAS 52‐90‐4), dibenzothiophene (R‐S‐R, CAS 132‐65‐0), DL‐methionine sulfoxide (R‐SO‐R, CAS 62697‐73‐8),
S5
sodium sulfite (Na2S, CAS 7757‐83‐7), cyclohexanesulfonic acid (R‐SO3‐H, sulfonate), and sulfate (CaSO4). Pyrite (FeS2) was also tested as a possible component, although its concentration was expected to be below the limit of sensitivity for the fitting procedure. The fitting precision is typically within 5 % when comparing data collected under the same conditions and analyzed with the same set of reference spectra.19 The fitting accuracy is more difficult to assess because it depends on indeterminate biases during data measurements (e.g., detector linearity), systematic errors during data reduction (e.g., background subtraction and normalization), and how well the chosen references represent the variety of sulfur functionalities. A case in point is the sulfate peak whose height is difficult to measure accurately in fluorescence mode because of over absorption effects, and in TEY mode because of the relatively limited linearity of electron detectors. Therefore, the method is not necessarily more accurate for sulfate than for sulfides, despite the factor of five difference in peak height. Overall, we agree with11 that the accuracy of S species composition can be estimated to within 10 % of the relative amounts obtained in the fit, as long as experimental errors are carefully minimized.
An estimate of the amount of reduced S contributed by Fe‐sulfide minerals was obtained using X‐ray fluorescence mapping, micro‐XANES spectroscopy, and micro‐diffraction. Fluorescence maps
were recorded at 4.033 keV with a resolution of 15 15 m2 and 200 ms counting time. The diffraction
pattern was recorded in transmission mode at 17 keV with a Bruker 6000 CCD binned to 1024 1024 pixels.
S2.2. Results
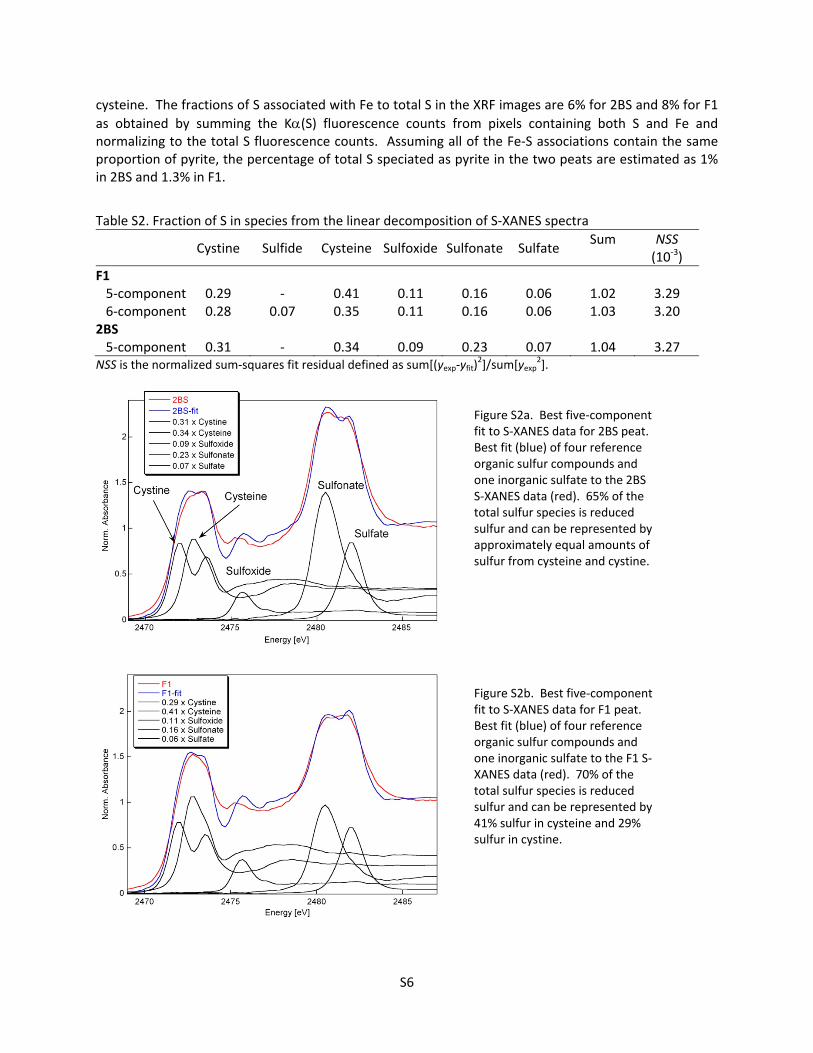
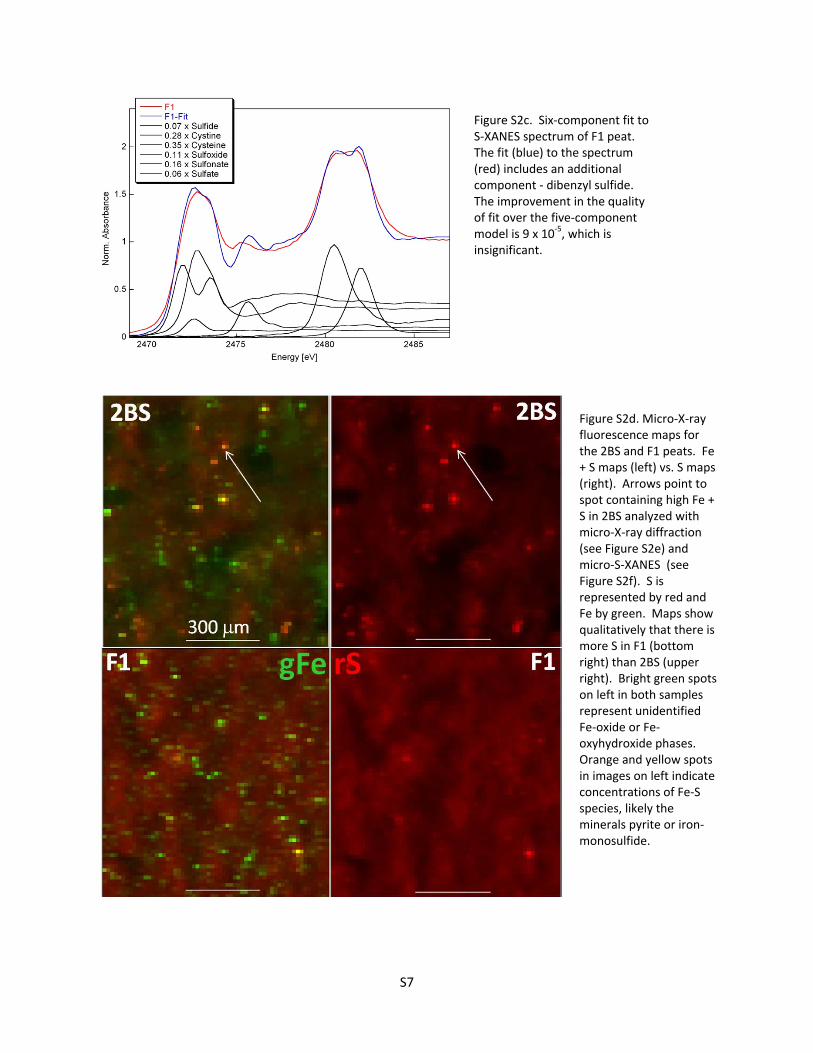
Five components sufficed to model the F1 and 2BS data: cystine, cysteine/methionine, sulfoxide, sulfonate, and sulfate (Figure S2a,b; Table S2). The data were fit equally well with the amino acids cysteine or methionine because their spectra cannot be distinguished in a mixture. Cysteine is produced by all organisms and is common in metallothionein (MT) proteins, whereas methionine is made only by plants and is rarer in proportion in MT. Cystine, the dimer formed by a disulfide bridge between two cysteines, stabilizes the tertiary structure of proteins. A 6‐component fit to F1 added 7% dibenzyl sulfide and subtracted 6% of the cysteine and 1% of the cystine, but did not change the total amount of reduced sulfur (Table S2; Figure S2c). This fit was rejected because (1) the fit quality was improved insignificantly; (2) adding dibenzyl sulfide did not also improve the fit to the 2BS peat, which was sampled from a nearby location and expected to be similar to the F1 peat; and, (3) dibenzyl sulfide, which has a reduced sulfur peak only slightly narrower than those of cysteine and methionine and is therefore indistinguishable in a mixture, has a ‘non‐thiolate’‐like highly symmetrical sulfur binding environment, which is unlikely to occur in this proportion in OM. None of the fits supported the presence of pyrite.
The sum of methionine, cysteine, and cystine in whole Cladium jamaicensis (sawgrass) from a site in WCA‐1 of the Florida Everglades was about 0.7 mg g‐1, whereas the decayed surface litter and upper 5 cm of peat formed from sawgrass contained about 1.7 mg g‐1,21, 22 of which approximately 0.5 mg g‐1 was cysteine. In comparison, the amounts of cysteine in the F1 and 2BS peats as determined by S‐XANES were 28 and 16 mg g‐1, respectively. The amount of cysteine in the plant litter and upper few cm of sawgrass peat is equivalent to 2.3 to 2.5 mol Sred per mol of Hg adsorbed in the F1‐03 and 2BS‐03 peat samples, respectively, enough to form multinuclear clusters of composition Hg4Sx with x = 8 to 10.
The majority of the S in the peats is organic and micro‐X‐ray fluorescence maps of S distribution corroborate the relative difference in amounts as determined by bulk chemical analysis3 (Figure S2d). A small amount of the Sred in the peats is associated with Fe (Figure S2d), and at least some of this Sred is pyrite based on micro‐diffraction of one bright spot of S and Fe in the 2BS peat (Figure S2e). The Sred peak in the micro‐XANES spectrum of this spot is clearly distinct from those of bulk 2BS and F1 peat (Figure S2f), yet the S is still dominantly organic. This peak was fit with 16% pyrite, 20% cystine, and 29%
S6
cysteine. The fractions of S associated with Fe to total S in the XRF images are 6% for 2BS and 8% for F1
as obtained by summing the K(S) fluorescence counts from pixels containing both S and Fe and normalizing to the total S fluorescence counts. Assuming all of the Fe‐S associations contain the same proportion of pyrite, the percentage of total S speciated as pyrite in the two peats are estimated as 1% in 2BS and 1.3% in F1.
Table S2. Fraction of S in species from the linear decomposition of S‐XANES spectra
Cystine Sulfide Cysteine Sulfoxide Sulfonate Sulfate Sum NSS
NSS is the normalized sum‐squares fit residual defined as sum[(yexp‐yfit)2]/sum[yexp
2].
Figure S2a. Best five‐component fit to S‐XANES data for 2BS peat. Best fit (blue) of four reference organic sulfur compounds and one inorganic sulfate to the 2BS S‐XANES data (red). 65% of the total sulfur species is reduced sulfur and can be represented by approximately equal amounts of sulfur from cysteine and cystine.
Figure S2b. Best five‐component fit to S‐XANES data for F1 peat. Best fit (blue) of four reference organic sulfur compounds and one inorganic sulfate to the F1 S‐XANES data (red). 70% of the total sulfur species is reduced sulfur and can be represented by 41% sulfur in cysteine and 29% sulfur in cystine.
S7
Figure S2c. Six‐component fit to S‐XANES spectrum of F1 peat. The fit (blue) to the spectrum (red) includes an additional component ‐ dibenzyl sulfide. The improvement in the quality of fit over the five‐component model is 9 x 10‐5, which is insignificant.
Figure S2d. Micro‐X‐ray fluorescence maps for the 2BS and F1 peats. Fe + S maps (left) vs. S maps (right). Arrows point to spot containing high Fe + S in 2BS analyzed with micro‐X‐ray diffraction (see Figure S2e) and micro‐S‐XANES (see Figure S2f). S is represented by red and Fe by green. Maps show qualitatively that there is more S in F1 (bottom right) than 2BS (upper right). Bright green spots on left in both samples represent unidentified Fe‐oxide or Fe‐oxyhydroxide phases. Orange and yellow spots in images on left indicate concentrations of Fe‐S species, likely the minerals pyrite or iron‐monosulfide.
S8
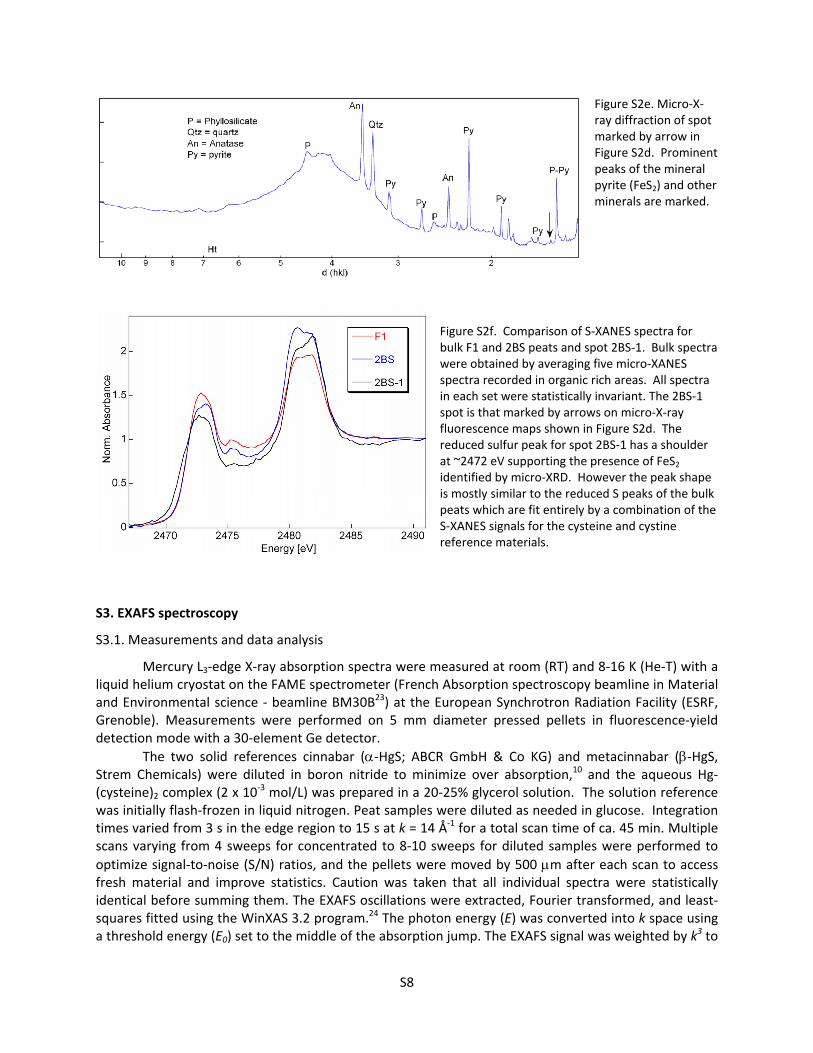
Figure S2e. Micro‐X‐ray diffraction of spot marked by arrow in Figure S2d. Prominent peaks of the mineral pyrite (FeS2) and other minerals are marked.
Figure S2f. Comparison of S‐XANES spectra for bulk F1 and 2BS peats and spot 2BS‐1. Bulk spectra were obtained by averaging five micro‐XANES spectra recorded in organic rich areas. All spectra in each set were statistically invariant. The 2BS‐1 spot is that marked by arrows on micro‐X‐ray fluorescence maps shown in Figure S2d. The reduced sulfur peak for spot 2BS‐1 has a shoulder at ~2472 eV supporting the presence of FeS2 identified by micro‐XRD. However the peak shape is mostly similar to the reduced S peaks of the bulk peats which are fit entirely by a combination of the S‐XANES signals for the cysteine and cystine reference materials.
S3. EXAFS spectroscopy
S3.1. Measurements and data analysis
Mercury L3‐edge X‐ray absorption spectra were measured at room (RT) and 8‐16 K (He‐T) with a liquid helium cryostat on the FAME spectrometer (French Absorption spectroscopy beamline in Material and Environmental science ‐ beamline BM30B23) at the European Synchrotron Radiation Facility (ESRF, Grenoble). Measurements were performed on 5 mm diameter pressed pellets in fluorescence‐yield detection mode with a 30‐element Ge detector.
The two solid references cinnabar (‐HgS; ABCR GmbH & Co KG) and metacinnabar (‐HgS, Strem Chemicals) were diluted in boron nitride to minimize over absorption,10 and the aqueous Hg‐(cysteine)2 complex (2 x 10‐3 mol/L) was prepared in a 20‐25% glycerol solution. The solution reference was initially flash‐frozen in liquid nitrogen. Peat samples were diluted as needed in glucose. Integration times varied from 3 s in the edge region to 15 s at k = 14 Å‐1 for a total scan time of ca. 45 min. Multiple scans varying from 4 sweeps for concentrated to 8‐10 sweeps for diluted samples were performed to
optimize signal‐to‐noise (S/N) ratios, and the pellets were moved by 500 m after each scan to access fresh material and improve statistics. Caution was taken that all individual spectra were statistically identical before summing them. The EXAFS oscillations were extracted, Fourier transformed, and least‐squares fitted using the WinXAS 3.2 program.24 The photon energy (E) was converted into k space using a threshold energy (E0) set to the middle of the absorption jump. The EXAFS signal was weighted by k3 to
S9
compensate for the decreased amplitude at high k; the k3(k) vs. k spectrum was Fourier transformed to real space with a Bessel apodization function; and structural parameters of the various coordination
shells around Hg were determined by fitting data over the distance range (R + ) of interest. Theoretical amplitude and phase functions were calculated ab initio with FEFF v. 7,25 using Hg(SCH3)2
26 as the
structure model for the Hg‐S pair and S‐Hg‐S multiple scattering, metacinnabar (‐HgS27) for the Hg‐S and Hg‐Hg pairs, and mercury di‐acetate (Hg(CH3COO)2
28) for the Hg‐O and Hg‐C pairs. The phase
functions were used in the model‐fits to correct the R + bond distances, as obtained from the Fourier
transformation, for the phase‐shift term (), which depends on the nature of the atomic pair (e.g., Hg‐S,
Hg‐O, Hg‐Hg,…). For this reason, the R + values reported on the x‐axis of the Fourier transforms are apparent crystallographic R values. The uncertainty in the fitted distances, coordination numbers, and Debye–Waller factors were estimated at the 95 % confidence level by varying successively each fit parameter by a certain percentage and restarting the refinement with this parameter fixed.
S3.2. Results
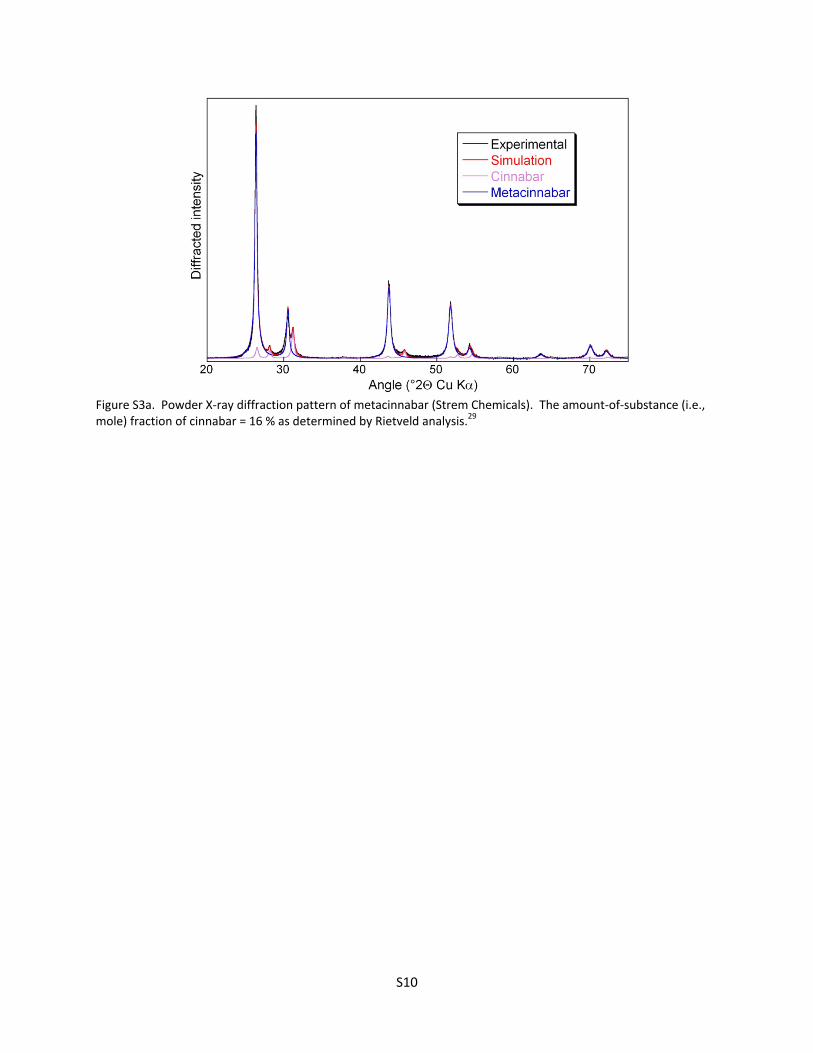
The metacinnabar (‐HgS) reference contained 16% cinnabar based on Rietveld analysis 29 of its powder X‐ray diffraction pattern (Figure S3a). The cinnabar (‐HgS) reference was pure. Therefore, we removed 16% of the RT EXAFS spectrum of cinnabar from the RT EXAFS spectrum of metacinnabar, and 16% of the He‐T EXAFS spectrum of cinnabar from the He‐T EXAFS spectrum of metacinnabar.
Simulations to the spectral data and corresponding Fourier transforms are provided in Figures
S3b to S3z in the order: cinnabar (‐HgS), metacinnabar (‐HgS), F1‐03 (Sred/Hg = 220), F1‐4 (Sred/Hg = 18.7), Hg(Cys)2 reference, 2BS‐99 (Sred/Hg = 0.50), and F1‐99 (Sred/Hg = 0.80). A theoretical simulation of the effect of temperature on the amplitude of the EXAFS signal for F1‐03 is included in Figure S3l immediately following the data and simulations for F1‐03. All data are presented in red in both k‐space and R‐space. Simulated spectra are in purple and simulated Fourier transforms are in blue. Only the modulus of each actual and modeled Fourier transform is shown for simplicity. When the actual and modeled EXAFS spectra (k‐space) are in‐phase, then the imaginary parts of their Fourier transforms (R‐space) are in‐phase as well. The nearest neighboring atoms to target element Hg are denoted above the peaks indicating their apparent bond distances (uncorrected for phase shift) in the Fourier transforms. All fit parameters, including the bond distances corrected for phase shift, are listed in Table S3. Plots in
k‐space are labeled k3 on the ordinate and k [Å‐1] on the abscissa. Plots in R‐space are labeled FT(k3) on the ordinate and R+[Å] on the abscissa. When several fit strategies were attempted, the best simulation is Model 1, unless otherwise noted. Shortcomings of other models are described below each figure.
F1‐18 (Sred/Hg = 4.3) was not modeled ab initio because it is clearly a mixture of three different structural environments as determined by linear combination fitting (Figure S3x). F1‐03 is not a linear combination of F1‐4 (the Hg(SR)2 linear structure) and cinnabar as shown by comparison of the spectra at RT (Figure S3y).
S10
Figure S3a. Powder X‐ray diffraction pattern of metacinnabar (Strem Chemicals). The amount‐of‐substance (i.e., mole) fraction of cinnabar = 16 % as determined by Rietveld analysis.29
S11
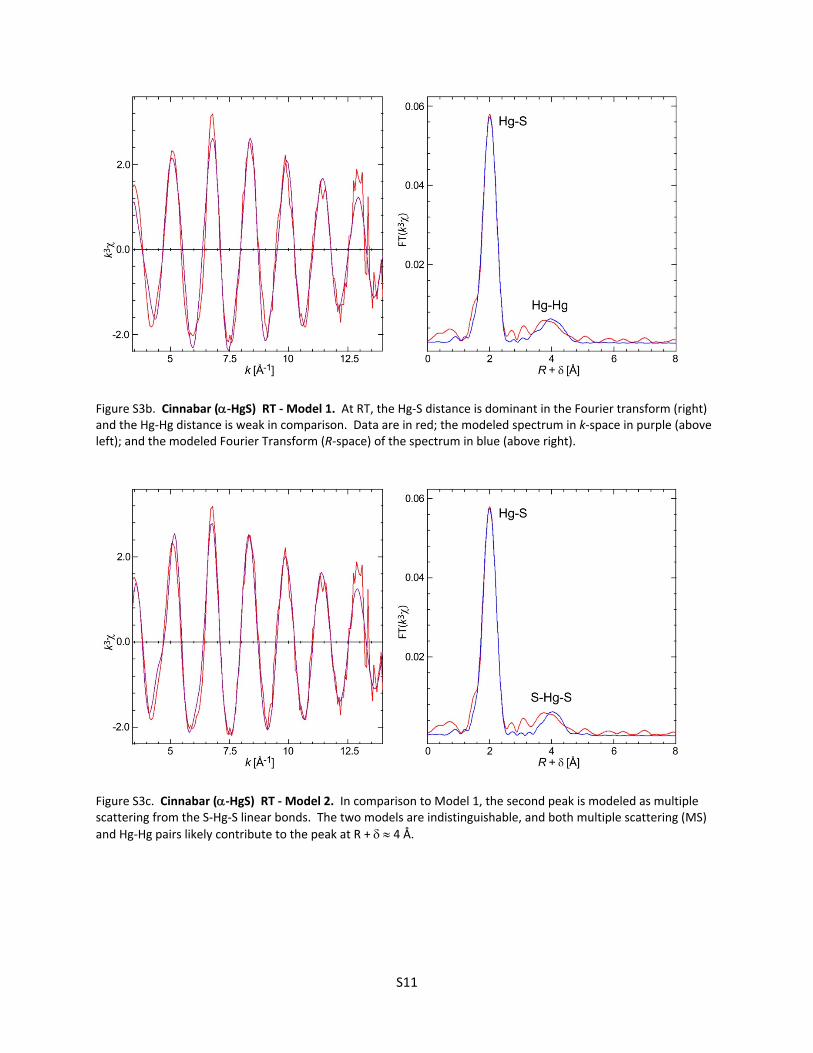
Figure S3b. Cinnabar (‐HgS) RT ‐ Model 1. At RT, the Hg‐S distance is dominant in the Fourier transform (right) and the Hg‐Hg distance is weak in comparison. Data are in red; the modeled spectrum in k‐space in purple (above left); and the modeled Fourier Transform (R‐space) of the spectrum in blue (above right).
Figure S3c. Cinnabar (‐HgS) RT ‐ Model 2. In comparison to Model 1, the second peak is modeled as multiple scattering from the S‐Hg‐S linear bonds. The two models are indistinguishable, and both multiple scattering (MS)
and Hg‐Hg pairs likely contribute to the peak at R + 4 Å.
S12
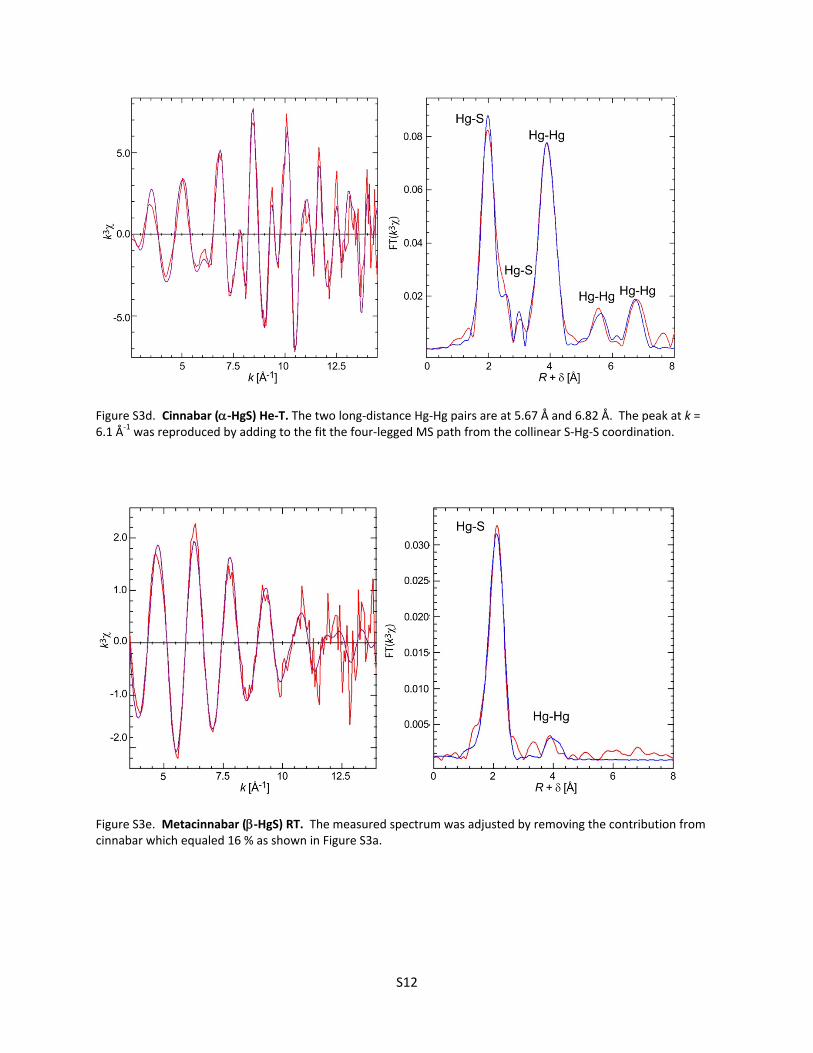
Figure S3d. Cinnabar (‐HgS) He‐T. The two long‐distance Hg‐Hg pairs are at 5.67 Å and 6.82 Å. The peak at k = 6.1 Å‐1 was reproduced by adding to the fit the four‐legged MS path from the collinear S‐Hg‐S coordination.
Figure S3e. Metacinnabar (‐HgS) RT. The measured spectrum was adjusted by removing the contribution from cinnabar which equaled 16 % as shown in Figure S3a.
S13
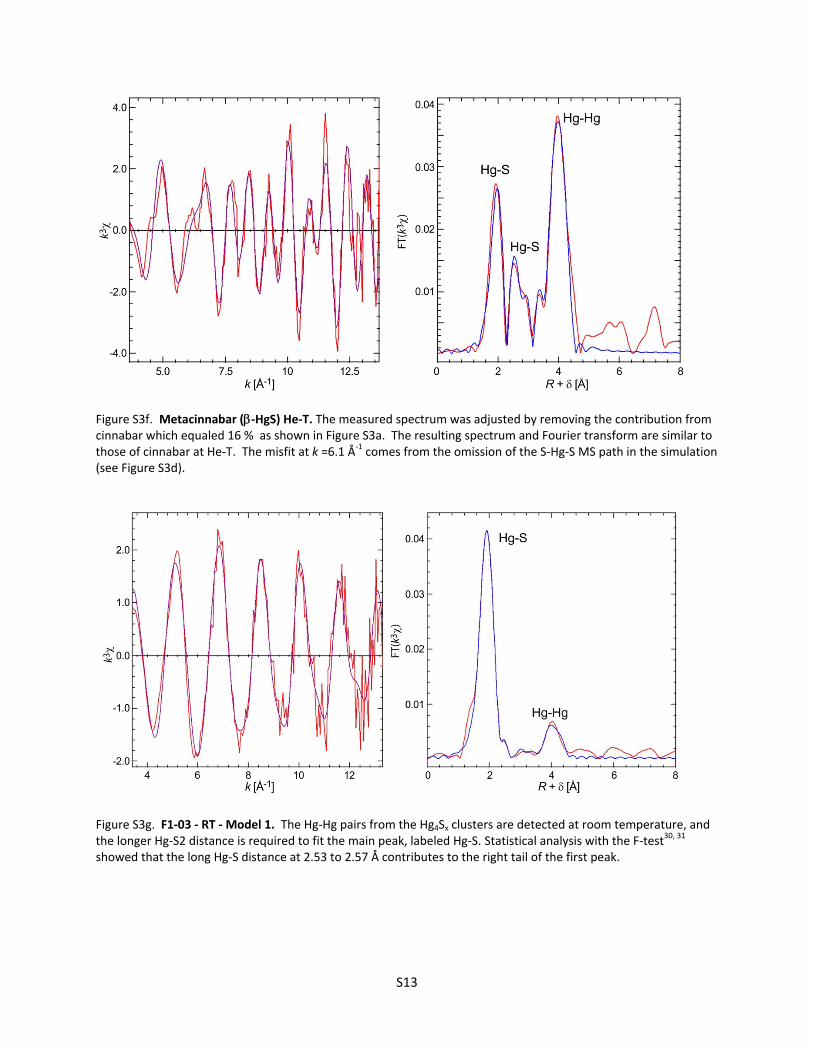
Figure S3f. Metacinnabar (‐HgS) He‐T. The measured spectrum was adjusted by removing the contribution from cinnabar which equaled 16 % as shown in Figure S3a. The resulting spectrum and Fourier transform are similar to those of cinnabar at He‐T. The misfit at k =6.1 Å‐1 comes from the omission of the S‐Hg‐S MS path in the simulation (see Figure S3d).
Figure S3g. F1‐03 ‐ RT ‐ Model 1. The Hg‐Hg pairs from the Hg4Sx clusters are detected at room temperature, and the longer Hg‐S2 distance is required to fit the main peak, labeled Hg‐S. Statistical analysis with the F‐test30, 31 showed that the long Hg‐S distance at 2.53 to 2.57 Å contributes to the right tail of the first peak.
S14
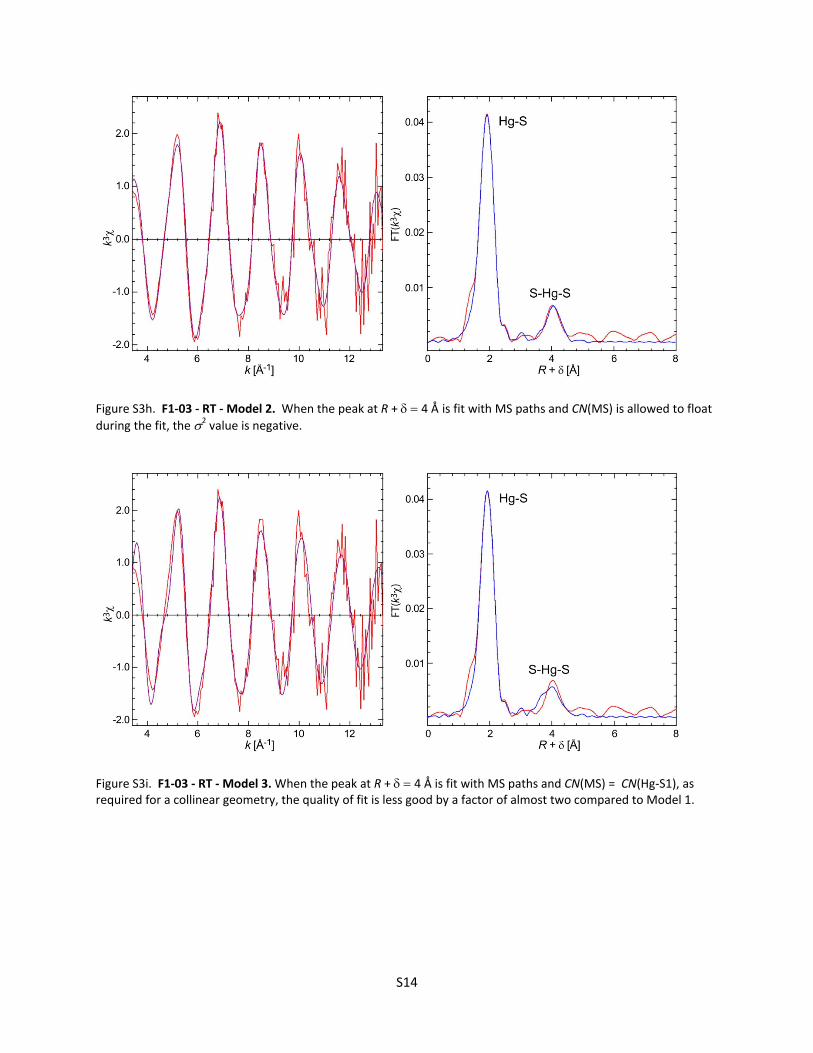
Figure S3h. F1‐03 ‐ RT ‐ Model 2. When the peak at R + 4 Åis fit with MS paths and CN(MS) is allowed to float
during the fit, the 2 value is negative.
Figure S3i. F1‐03 ‐ RT ‐ Model 3. When the peak at R + 4 Å is fit with MS paths and CN(MS) = CN(Hg‐S1), as required for a collinear geometry, the quality of fit is less good by a factor of almost two compared to Model 1.
S15
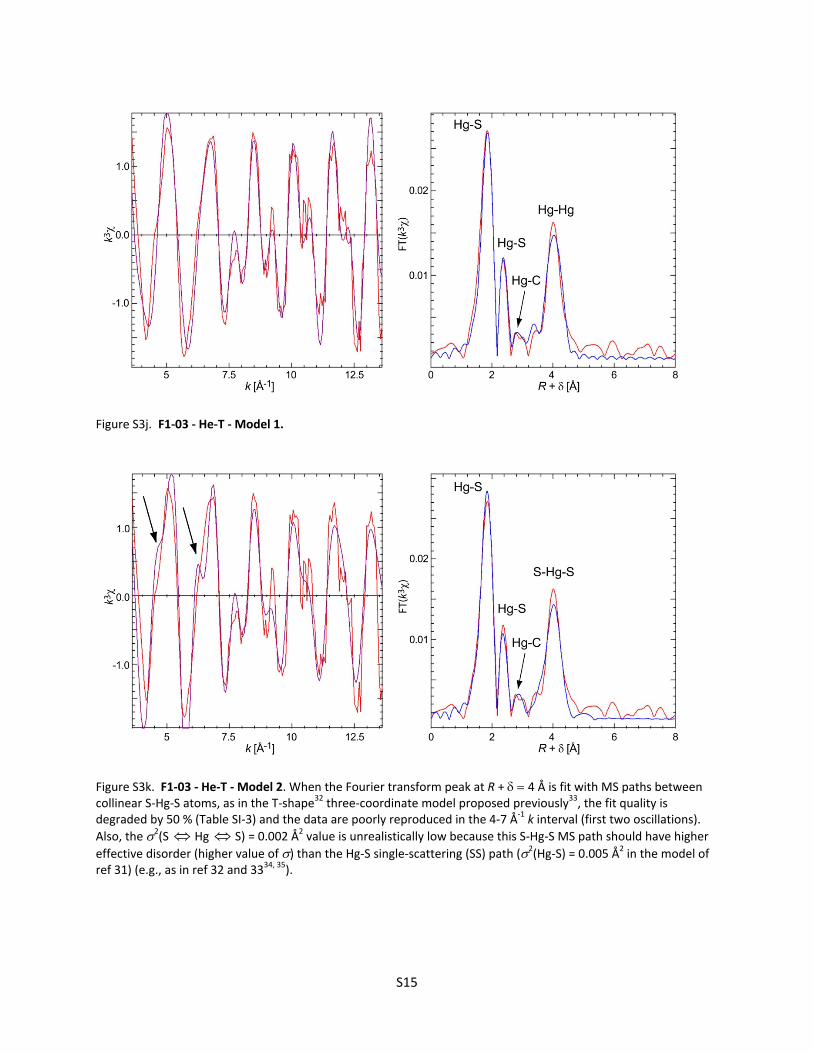
Figure S3j. F1‐03 ‐ He‐T ‐ Model 1.
Figure S3k. F1‐03 ‐ He‐T ‐ Model 2. When the Fourier transform peak at R + 4 Å is fit with MS paths between collinear S‐Hg‐S atoms, as in the T‐shape32 three‐coordinate model proposed previously33, the fit quality is degraded by 50 % (Table SI‐3) and the data are poorly reproduced in the 4‐7 Å‐1 k interval (first two oscillations).
Also, the 2(S Hg S) = 0.002 Å2 value is unrealistically low because this S‐Hg‐S MS path should have higher
effective disorder (higher value of ) than the Hg‐S single‐scattering (SS) path (2(Hg‐S) = 0.005 Å2 in the model of ref 31) (e.g., as in ref 32 and 3334, 35).
S16
(1)
(2)
(3)
(4)
Figure S3l. Why the amplitude of the EXAFS signal for F1‐03 decreases with temperature. The top two figures show the effect of anisotropy of the thermal motions of short and long Hg‐S bonds on RT data. Theoretical EXAFS interference functions (1) and Fourier transforms (2) were calculated for the hypothetical atomic pairs:
Red: two S atoms at 2.34 Å and = 0.005 Å2
Blue: one S atom at 2.53 Å and = 0.01 Å2. Black: sum
The long bond affects the phase only at low k, because the d(Hg‐S)=2.53 Å wave is damped (i.e., is attenuated at high k) as a consequence of the softer character of this longer bond. In real space, the long bond gives a weak
shoulder at about R + R ~ 2.5 Å which can be easily mistaken for a side lobe of the Fourier transform. The bottom two figures show the effect at He‐T. Theoretical EXAFS interference functions (3) and Fourier transforms (4) were calculated for the hypothetical atomic pairs :
Red : two S atoms at 2.34 Å and = 0.005 Å2.
Blue : two S atoms at 2.34 Å, but = 0.004 Å2. Diminishing the Debye‐Waller factor mimics the effect of lowering the temperature. The amplitudes of the EXAFS signal and FT peak increase when the disorder term (i.e., thermal agitation) decreases.
Orange : one S atom at 2.53 Å and = 0.004 Å2. The wave frequency is shifted to the left at low k, to the right at high k, and is out‐of‐phase in the k region where the amplitude of the signal from the short‐distance pair is maximum, i.e., at k = 7‐9 Å‐1. Black : Sum of the orange and blue curves. The composite signal from the 2S + 1S pairs is weaker than the single shell signal from the 2S pair. This counter‐intuitive effect of a reduction of the EXAFS signal at low temperature is observed when two shells are amplified differently at low temperature. The longer Hg‐S bond has a higher thermal motion (i.e., is ‘softer’), therefore is barely detected at room temperature but appears clearly at He‐T.
S17
Figure S3m. F1‐4 ‐ RT.
Figure S3n. F1‐4 ‐ He‐T. The modeled distance is 4.61 Å, i.e., twice the distance for single scattering between Hg and S, and the MS scattering paths consequently have a higher Debye‐Waller factor than the single‐scattering
paths36 (2 = 9 x 10‐3 vs. 4 x 10‐3 Å2; Table S3).
S18
Figure S3o. Hg(Cys)2 He‐T.
Fig. S3p. 2BS‐99 ‐ RT ‐ Model 1.
S19
Figure S3q. 2BS‐99 ‐ RT ‐ Model 2. The five‐membered chelate ring (with two O shells) is also detected at room temperature. The data cannot be satisfactorily reproduced with a single O shell. However, the distant C shell at about 3.3 Å is undetected.
Figure S3r. 2BS‐99 ‐ He‐T ‐ Model 1. The best model suggests a five‐membered chelate ring. A similar chelate ring model was reported for a monomethyl mercury‐humic acid complex.37 However, the acetate‐like bidentate structure37 has unusually short bonds of 2.66‐2.67 Å to C along with bonds of 2.81‐2.85 Å to O. This type of structure should have nearly equal Hg‐C and Hg‐O distances as in methylmercury bonded to tryptophan (2.78 A and 2.83 Å38) and acetate dehydrate (2.89 A and 2.94 Å28).
S20
Figure S3s. 2BS‐99 ‐ He‐T ‐ Model 2. Considering a linear O‐Hg‐O complex instead of a five‐membered chelate ring
structure (with two O shells) decreases the fit quality by more than one order of magnitude.
Figure S3t. 2BS‐99 ‐ He‐T ‐ Model 3. The fit quality of Model 2 can be restored by allowing 2(C) to float, but the fitted value (0.022 Å2) is meaningless and CN(C) is unrealistically high.
S21
Figure S3u. F1‐99 ‐ RT. The S shell is detected also at room temperature, but not the second C shell at about 3.3 Å.
Figure S3v. F1‐99 ‐ He‐T ‐ Model 1
S22
Figure S3w. F1‐99 ‐ He‐T ‐ Model 2. When the S shell is omitted and the 2 parameters fixed to their optimal
values for 2BS‐99 (2(Hg‐O)=0.003 Å2, (Hg‐C)=0.005 Å2), the fit quality decreases by a factor of 7 because the model fails to reproduce the amplitude, phase and structure of the signal at low k.
Figure S3x. F1‐99 ‐ He‐T ‐ Model 3. When the S shell is omitted and 2 allowed to float, the fit quality is restored
but 2(Hg‐O) and CN(C) are too high (Table S3).
S23
Figure S3y. F1‐18 ‐ He‐T. No fit was attempted because the spectrum is reproduced by a linear combination of F1‐4 and F1‐99, indicating a mixture of the linear Hg(SR)2 structure with the five‐membered chelate ring and the thiolated aromatic environments. The precision on each species is about 10 % total Hg.39, 40
Figure S3z. RT Spectra for F1‐03, F1‐4, and Cinnabar. F1‐03 is not a linear combination of the linear Hg(SR)2 and cinnabar structures because its spectral oscillations are not consistently intermediate between those of F1‐4 and cinnabar. Note the leftward shift at ~ 4.3‐4.6 and ~6.1‐6.6 Å‐1 and the rightward shift above ~9.5 Å‐1 of F1‐03
S24
Table S3. Model parameters from EXAFS least‐squares curve‐fitting. When several models were tested, the one retained is Fit Model 1.
T Fit
Model Hg‐O Hg‐S Hg‐C Hg‐Hg S‐Hg‐S
E (eV)
R+ (Å) window
Rp (%)
R (Å) CN 2 (Å2) R (Å) CN 2 (Å2) R (Å) CN 2 (Å2) R (Å) CN 2 (Å2) R (Å) CN 2 (Å2)
R is bond distance, CN is coordination number, 2 is the Debye‐Waller factor, and E is the shift of the energy threshold E0. The uncertainty in CN, R and 2 at the 95% confidence level are about 20 %, 0.02 Å and 0.001 Å2, respectively. Rp is the fit residual in percent, defined as (|yexp‐yfit|)/(|yexp|). Typical values for Rp are a few percent, indicating that the least‐squares refinement is limited by systematic errors in the model calculation. For the same quality
of fit, Rp increases with the dimension of the R + fit interval. c correlated to be identical f fixed Sk model of ref 31 33 n non‐physical or non‐structural value
S26
S4. Discussion of Cinnabar and Metacinnabar EXAFS Spectra as a Function of Temperature We reported in the manuscript that the cinnabar spectrum shows more of its crystallographic structure, i.e., longer Hg‐S and Hg‐Hg bonds, at He‐T than at RT because of the reduced thermal motion of its atoms. We also reported that metacinnabar undergoes a structural transformation between RT and He‐T that suggests it is approaching the cinnabar crystal structure at low temperature. A structural transformation of metacinnabar at He‐T is plausible because it is even further from its stability field than at RT41. The transition is from a higher to lower degree of symmetry, similar to the high‐to‐low symmetry transition reported for magnetite at 125 K.42 The question remains as to where in temperature space the transition actually occurs. To begin to answer this question we use data from ref 11 who measured the EXAFS spectra of cinnabar and metacinnabar at liquid nitrogen temperature (LN2‐T; 77 K).
In Figure S4a, we reproduce Figures S2a and S4a of the SI of ref 11 and in the lower part of the figure we show our cinnabar spectrum at He‐T The authors fit their spectrum of cinnabar obtained at 77 K as a linear combination of the spectrum of cinnabar at RT and the spectrum of elemental Hg at 77 K, making the assumption that the spectrum of cinnabar would not change between RT and 77 K. The vertical aqua band shows a shoulder in the LN2‐T cinnabar spectrum at k = 7.6 to 8.2 Å‐1 that cannot be explained by a spectral feature of elemental Hg. The fit shown in the middle part of this figure is poor in this region. The features in the cinnabar spectrum marked with arrows at k ~ 5.9 Å‐1 and k ~ 9.7 Å‐1 in their Figure S2a and highlighted in yellow are also not fit well in their Figure S4a (middle plot). We propose that all of the features marked by arrows in their Figure S2s are actually structural features from longer bonds in cinnabar that appear at lower temperature as shown in our Figure S3d and Table S3. Based on this new interpretation, there is no evidence for elemental Hg in cinnabar.
Figure S4b reproduces Figure S2b of ref 11 and our metacinnabar spectrum at He‐T. Our measured spectrum was corrected by removing 16% of the cinnabar spectrum obtained at He‐T based on the 16% cinnabar impurity observed in the XRD pattern of the metacinnabar described in Section S3. We also assume that the top two curves of ref 11 have their labels switched and instead follow the order these authors showed for cinnabar (77 K spectrum on top; RT spectrum in the middle; elemental Hg spectrum at 77 K at the bottom) and the order listed in their figure caption. The three arrows in their figure, marked with yellow bands in the composite figure, all align with spectral oscillations in our metacinnabar at He‐T. We see a minimum amplitude at the position of the arrow marked with the aqua band, as do these authors. We do not see evidence for the presence of the oscillation at k ~ 7.3 Å‐1 in elemental Hg. This comparison suggests that metacinnabar has already begun to undergo a structural transition at 77 K. The conclusion that elemental Hg is present in their metacinnabar is ambiguous.
S27
Figure S4a. Comparison of cinnabar spectra at 77 K1 and He‐T (this study). The top two figures are taken from ref 11 (their Figures S2a and S4a). The bottom figure is our spectrum at He‐T (our Figure S3d). The yellow bands match features in their spectra purported to arise from the presence of elemental Hg. These features match cinnabar structural features we observed and modeled at He‐T. The aqua band matches a feature in their and our spectra that is absent in their elemental Hg spectrum.
S28
Figure S4b. Comparison of metacinnabar spectra at 77 K1 and He‐T (this study). The top figure is taken from ref 11 (their Figure S2b). The bottom figure is our spectrum at He‐T corrected for the presence of 16 % cinnabar (our Figure S3f). The yellow bands match features in the spectra purported to arise from the presence of elemental Hg. These features match structural features of metacinnabar we observed and modeled at He‐T. The aqua band matches amplitude minima in the two metacinnabar spectra (ref 11 and this study) that show no contribution from elemental Hg.
S29
S5. References
(1) Jew, A. D.; Kim, C. S.; Rytuba, J. J.; Gustin, M. S.; Brown Jr., G. E., New technique for quantification of elemental Hg in mine wastes and its implications for mercury evasion into the atmosphere. Environ. Sci. Technol. 2011, 45, 412‐417. (2) Lamborg, C. H.; Tseng, C.‐M.; Fitzgerald, W. F.; Balcom, P. H.; Hammerschmidt, C. R., Determination of the mercury complexation characteristics of dissolved organic matter in natural waters with "reducible Hg" titrations. Environ. Sci. Technol. 2003, 37, 3316‐3322. (3) Drexel, R. T.; Haitzer, M.; Ryan, J. N.; Aiken, G. R.; Nagy, K. L., Mercury(II) sorption to two Florida Everglades peats: Evidence for strong and weak binding and competition by dissolved organic matter released from the peat. Environ. Sci. Technol. 2002, 36, 4058‐4064. (4) Gilmour, C. C.; Riedel, G. S.; Ederington, M. C.; Bell, J. T.; Gill, G. A.; Stordal, M. A., Methylmercury concentrations and production rates across a trophic gradient in the northern Everglades. Biogeochemistry 1998, 40, 327‐345. (5) Jensen, J. R.; Rutchey, K.; Koch, M. S.; Narumalini, S., Inland wetland change detection in the Everglades Water Conservation Area 2A using a time series of normalized remotely sensed data. Photogramm. Eng. Remote Sens. 1995, 61, 199‐209. (6) Hurley, J. P.; Krabbenhoft, D. P.; Cleckner, L. B.; Olson, M. L.; Aiken, G. R.; Rawlik, P. S., System controls on the aqueous distribution of mercury in the northern Florida Everglades. Biogeochemistry 1998, 40, 293‐311. (7) Vaithiyanathan, P.; Richardson, C. J.; Kavanaugh, R. G.; Craft, C. B.; Barkay, T., Relationships of eutrophication to the distribution of mercury and to the potential for methylmercury production in peat soils of the Everglades. Environ. Sci. Technol. 1996, 30, 2591‐2597. (8) Cleckner, L. B.; Gilmour, C. C.; Hurley, J. P.; Krabbenhoft, D. P., Mercury methylation in periphyton in the Florida Everglades. Limnol. Oceanogr. 1999, 44, 1815‐1825. (9) Marcus, M. A.; A., M. A.; Celestre, R.; Manceau, A.; Miller, T.; Padmore, H. A.; Sublett, R. E., Beamline 10.3.2 at ALS: a hard X‐ray microprobe for environmental and materials sicences. J. Synchrotron Radiat. 2004, 11, 239‐247. (10) Manceau, A.; Marcus, M. A.; Tamura, N., Quantitative speciation of heavy metals in soils and sediments by synchrotron X‐ray techniques. In Applications of Synchrotron Radiation in Low‐Temperature Geochemistry and Environmental Science, Fenter, P. A.,Rivers, M. L.,Sturchio, N. C.,Sutton, S. R., Eds. Mineralogical Society of America: Washington, D.C., 2002; Vol. 49, pp 341‐428. (11) Jalilehvand, F., Sulfur: not a 'silent' element any more. Chem. Soc. Rev. 2006, 35, 1256‐1268. (12) Vairavamurthy, A., Using X‐ray absorption to probe sulfur oxidation states in complex molecules. Spectrochimica Acta 1998, A54, 2009‐2017. (13) Vairavamurthy, M. A.; Maletic, D.; Wang, S.; Manowitz, B.; Elginton, T.; Lyons, T., Characterization of sulfur‐containing functional groups in sedimentary humic substances by X‐ray absorption near‐edge structure spectroscopy. Energy and Fuels 1997, 11, 546‐553. (14) Skyllberg, U.; Xia, K.; Bloom, P. R.; Nater, E. A.; Bleam, W. F., Binding of mercury to reduced sulfur in soil organic matter along upland‐peat soil transects. J. Environ. Qual. 2000, 29, 855‐865. (15) Beauchemin, S.; Hesterberg, D.; Beauchemin, M., Principal component analysis approach for modeling sulfur K‐XANES spectra of humic acids. Soil Sci. Soc. Am. J. 2002, 66, 83‐91. (16) Solomon, D.; Lehmann, J.; Lobe, I.; Martinez, C. E.; Tveitnes, S.; Du Preez, C. C.; Amelung, W., Sulphur speciation and biogeochemical cycling in long‐term arable cropping of subtropical soils: evidence from wet‐chemical reduction and S K‐edge XANES spectroscopy. Eur. J. Soil Sci. 2005, 56, 621. (17) Zhao, F. J.; Lehmann, J.; Solomon, D.; Fox, M. A.; McGrath, S. P., Sulphur speciation and turnover in soils: evidence from sulphur K‐edge XANES spectroscopy and isotope dilution studies. Soil Biology and Biochemistry 2006, 38, 1000‐1007. (18) Einsiedl, F.; Schäfer, T.; Northrup, P., Combined sulfur K‐edge XANES spectroscopy and stable isotope analyses of fulvic acids and groundwater sulfate identify sulfur cycling in a karstic catchment area. Chem. Geol. 2007, 238, 268‐276. (19) Schroth, A. W.; Bostick, B. C.; Graham, M.; Kaste, J. M.; Mitchell, M. J.; Friedland, A. J., Sulfur species behavior in soil organic matter during decomposition. J. Geophys. Res. 2007, 112, G04011. (20) Preitzel, J.; Thieme, J.; Salomé, M.; Knicker, H., Sulfur K‐edge XANES spectroscopy reveals differences in sulfur speciatilon of bulk soils, humic acid, fulvic acid, and particle size separates. Soil Biology and Biochemistry 2007, 39, 877‐890. (21) Casagrande, D. J.; Given, P. H., Geochemistry of amino acids in some Florida peat accumulations‐I. Analytical approach and total amino acid concentrations. Geochim. Cosmochim. Acta 1974, 44, 1493‐1507. (22) Casagrande, D. J.; Gronli, K.; Sutton, N., The distribution of sulfur and organic matter in various fractions of peat: origins of sulfur in coal. Geochim. Cosmochim. Acta 1980, 44, 25‐32.
S30
(23) Proux, O.; Nassif, V.; Prat, A.; Ulrich, O.; Lahera, E.; Biquard, X.; Menthonnex, J. J.; Hazemann, J. L., Feedback system of a liquid‐nitrogen‐cooled double‐crystal monochromator: design and performances. J. Synchrotron Radiat. 2006, 13, 59‐68. (24) Ressler, T., WinXAS: a program for X‐ray absorption spectroscopy data analysis under MS‐Windows. J. Synchrotron Radiat. 1998, 5, 118‐122. (25) Ankudinov, A. L.; Rehr, J. J., Relativistic calculations of spin‐dependent X‐ray‐absorption spectra. Phys. Rev. B: Condens. Matter Mater. Phys. 1997, 56, 1712‐1716. (26) Bradley, D. C.; Kunchur, N. R., Structures of mercury mercaptides. I. X‐ray structural analysis of mercury methylmercaptide. J. Chem. Phys. 1964, 40, 2258‐2261. (27) Aurivillius, K., An X‐ray and neutron diffraction study of metacinnabarite. Acta. Chem. Scand. 1964, 18, 1552‐1553. (28) Allmann, R., Die struktur des quecksilber(II)‐acetats. Zeitschrift für Kristallography 1973, 138, 366‐373. (29) Bergmann, J.; Kleeberg, R.; Taut, T.; Haase, A., Quantitative phase analysis using a new Rietveld algorithm ‐ assisted by improved stability and convergence behavior. Advances in X‐Ray Analysis 1997, 40, 425‐436. (30) Michalowicz, A.; Provost, K.; Laruelle, S.; Mimouni, A.; Vlaic, G., F‐test in EXAFS fitting of structural models. J. Synchrotron Radiat. 1999, 6, 233‐235. (31) Downward, L.; Booth, C. H.; Lukens, W. W.; Bridge, F. In A variation of the F‐Test for determining statistical relevance of particular parameters in EXAFS fits, 2007; 2007; pp 129‐131. (32) Manceau, A.; Nagy, K. L., Relationships between Hg(II)‐S bond distance and Hg(II) coordination in thiolates. Dalton Trans. 2008, 1421‐1425. (33) Skyllberg, U.; Bloom, P. R.; Qian, J.; Lin, C.‐M.; Bleam, W. F., Complexation of mercury(II) in soil organic matter: EXAFS evidence for linear two‐coordination with reduced sulfur groups. Environ. Sci. Technol. 2006, 40, 4174‐4180. (34) Mansour, A. N.; Melendres, C. A., Analysis of X‐ray absorption spectra of some nickel oxycompounds using theoretical standards. The Journal of Physical Chemistry A 1998, 102, 65‐81. (35) Carrera, F.; Sánchez Marcos, E. S.; Merkling, P. J.; Chaboy, J.; Muñoz‐Páez, A., Nature of metal binding sites in Cu(II) complexes with histidine and related N‐coordinating ligands, as studied by EXAFS. Inorg. Chem. 2004, 43, 6674‐6683. (36) Penner‐Hahn, J. E., Characterization of "spectroscopically quiet" metals in biology. Coord. Chem. Rev. 2005, 249, 161‐177. (37) Yoon, S.‐J.; Diener, L.; Bloom, P. R.; Nater, E. A.; Bleam, W. F., X‐ray absorption studies of CH3Hg
+‐binding sites in humic substances. Geochim. Cosmochim. Acta 2005, 69, 1111‐1121. (38) Corbeil, M.‐C.; Beauchamp, A. L., Methylmercury(II) complexes with tryptophan and its N‐acetyl derivative. Can. J. Chem. 1988, 66, 2458‐2464. (39) Isaure, M. P.; Laboudigue, A.; Manceau, A.; Sarret, G.; Tiffreau, C.; Trocellier, P.; Hazemann, J. L.; Chateigner, D., Quantitative Zn speciation in a contaminated dredged sediment by mPIXE, mSXRF, EXAFS spectroscopy and principal component analysis. Geochim. Cosmochim. Acta 2002, 66, 1549‐1567. (40) Panfili, F.; Manceau, A.; Sarret, G.; Spadini, L.; Kirpichtchikova, T.; Bert, V.; Laboudigue, A.; Marcus, M. A.; Ahamdach, N.; Libert, M. F., The effect of phytostabilization on Zn speciation in a dredged contaminated sediment using scanning electron microscopy, X‐ray fluorescence, EXAFS spectroscopy and principal components analysis. Geochim. Cosmochim. Acta 2005, 69, 2265‐2284. (41) Potter, R. W.; Barnes, H. L., Phase relationsin the binary Hg‐S. Am. Mineral. 1978, 63, 1143‐1152. (42) Kasama, T.; Church, N. S.; Feinberg, J. M.; Dunin‐Borkowski, R. E.; Harrison, R. J., Direct observation of ferrimagnetic/ferroelastic domain interactions in magnetite below the Verwey transition. Earth Planet. Sci. Lett. 2010, 297, 10‐17.