Page 1
Maddox, R. A., M. S. Gilmore, C. A. Doswell III, R. H. Johns, C. A. Crisp, D. W. Burgess, J. A. Hart, and
S. F. Piltz, 2013: Meteorological analyses of the Tri-State tornado event of March 1925. Electronic J.
Severe Storms Meteor., 8 (1), 1–27.
1
Meteorological Analyses of the
Tri-State Tornado Event of March 1925
ROBERT A. MADDOX,* MATTHEW S. GILMORE,+ CHARLES A. DOSWELL III,
# ROBERT H.
JOHNS,@
CHARLIE A. CRISP,@
DONALD W. BURGESS,@
JOHN A. HART,~ AND STEVEN F. PILTZ
>
*Tucson, Arizona +Department of Atmospheric Sciences, University of North Dakota, Grand Forks, North Dakota
#Doswell Scientific Consulting, Norman, Oklahoma
@Norman, Oklahoma
~NOAA/NWS/Storm Prediction Center, Norman, Oklahoma
>NOAA/NWS Forecast Office, Tulsa, Oklahoma
(Submitted 30 July 2012; in final form 30 March 2013)
ABSTRACT
Severe thunderstorms occurred across portions of the central United States on 18 March 1925. The
deadly, long-track Tri-State tornado was the most publicized storm event of 18 March and remains the most
significant single tornado in the nation’s history. There has been only one formal paper regarding the Tri-
State tornado and its meteorological setting. Several reports concerning the tornado and its setting had
inaccurate surface analyses and incorrectly stated that the tornado had formed in cold air well west of a
surface cyclone. Results are presented from a study of the event using all relevant Weather Bureau data
that could be obtained. The storms of 18 March were associated with a rapidly moving, synoptic cyclone
that was not unusually intense. New analyses indicate: a) the tornado was produced by a long-lived
supercell that developed very near the center of the cyclone, possibly at the intersection of a warm front and
a distinct dryline; b) the south-to-north temperature gradient ahead of the cyclone was very pronounced due
to cooling produced by early morning storms and precipitation; c) the tornadic supercell tracked east-
northeastward very rapidly [from ≈250 degrees at an average speed of ≈59 mph (≈26 m s–1
)], moving
farther away from the cyclone with time; and d) the storm remained very close to the surface warm front. It
is likely that the tornadic supercell remained isolated from other storms throughout its life. There was no
singular feature of the meteorological setting that would explain the extreme character of the Tri-State
tornado; however, as the supercell and dryline moved rapidly eastward, the northward advance of the warm
front kept the tornadic supercell within a very favorable storm environment for several hours. Apparently,
this consistent time and space concatenation of the supercell, warm front, and dryline for more than three
hours was extremely unusual.
––––––––––––––––––––––––
1. Introduction
On 18 March 1925 the most significant
tornado in the nation’s history occurred. The
tornado tracked from southeastern Missouri,
across southern Illinois, and into southwestern
___________________________
Corresponding author address: Robert A.
Maddox, 2979 E. Placita Santa Lucia, Tucson,
AZ, 85716. E-mail: [email protected]
Indiana. This event is referred to as the Tri-State
tornado because of three states being affected.
The tornado’s path length has been reported as
219 mi (352 km) by Henry (1925), which is the
longest continuous track on record (Grazulis
1993). The tornado’s approximate path is shown
in Fig. 1. The number of fatalities caused by the
tornado was approximately 695, which remains
the greatest death toll to occur with a single
tornado (Changnon and Semonin 1966).
Page 2
MADDOX ET AL. 30 March 2013
2
Figure 1: Track of the Tri-State tornado as published by Changnon and Semonin (1966). Speeds they
deduced for the tornado’s progression are shown, as well as various details regarding damage and fatalities
along the track. Click image to enlarge.
Although a number of other tornadoes and severe
thunderstorms occurred on 18 March, the focus
through the years has been upon the deadly Tri-
State tornado (e.g., Felknor 1992; Akin 2002).
Because of the authors’ interests, as well as
limited literature about this extreme event, a new
study of the meteorological aspects of the Tri-
State tornado, and the related severe weather
outbreak, was undertaken even though 80 years
had passed. The initial motivation was to
examine the unusual synoptic setting and spatial
relationships between the tornado and the
associated surface low reported in the past. The
scope of the study gradually expanded to
consider possible reasons for the extremely long
track of this tornado and to include fieldwork to
attempt a new mapping of the damage path
(Johns et al. 2013). This paper presents results
from our examination of the meteorological
conditions associated with the Tri-State tornado
event.
2. Background
By the middle of the 19th
century, the general
population of the United States (U.S.) was well
aware of the dangers of tornadoes (Galway
1985a). However, during the first half of the 20th
century, the U.S. Weather Bureau (WB) did not
try to forecast tornado events; in fact, the use of
the word “tornado” in forecasts was explicitly
banned (Galway 1992). Surface conditions that
appeared to favor tornado occurrences had been
studied during the late 1800s by the Signal
Corps, particularly by Lt. Finley (Galway
1985a,b). However, efforts in the Signal Corps
to forecast tornadoes had waned and were not
carried into the WB of the early 1900s. Upper-
air sounding systems were being developed
during the 1920s and there was no way to study
important tornado events, except by using
surface observations. This situation would
change little until after World War II (Galway
1992). The WB began severe-storm forecasting
Page 3
MADDOX ET AL. 30 March 2013
3
Figure 2: Surface chart for 1300 CST (1900 UTC) 18 March 1925, as published by Henry (1925). Surface
wind directions are indicated by red arrows; isotherms (10s of degrees F) are dashed lines; and isobars (in
Hg, labeled with leading “2” not shown) are solid lines drawn at 0.05 in Hg (1.7 hPa) intervals. Tracks of
all tornadoes documented on the 18th
by the WB are indicated by the black arrows, with start and end times.
It is not known what the heavy, dashed red line was meant to indicate. The black “C” and “X” have been
added to the figure to indicate where Henry stated that the cyclone associated with the tornado was located
at 1300 CST. Click image to enlarge.
in the 1950s. There were a large number of
studies done for severe local storms during the
early 1950s (Galway 1992), and significant
research continues to the present. However,
there has been little research exploring possible
reasons for the Tri-State tornado’s unusual
severity and very long path length.
The fields of synoptic and mesoscale
meteorology have advanced tremendously since
1925, as has the understanding of severe
thunderstorm structures and tornadoes. The
Norwegian cyclone model and frontal concepts
were being developed in the 1920s (e.g.,
Bjerknes and Solberg 1922), and there had been
a failed attempt to convince the WB to use
frontal analysis techniques in 1926 (Namias
1980). The supercell thunderstorm was
identified as an important, distinct type of deep,
moist convection during the early 1960s
(Browning 1962), and the Tri-State tornado was
produced by a long-lived, supercell thunderstorm
(Johns et al. 2013). Interested readers can find
overviews of modern knowledge of tornadoes
and supercells in Church et al. (1993) and in
Doswell (2001). Because long-track tornadoes
are extremely rare (Section 5e), there is no focus
on conditions associated with such events in
either monograph.
The one paper published in the formal
scientific literature regarding the Tri-State
tornado was by Henry (1925), which appeared in
the April 1925 issue of Monthly Weather
Review1, shortly after the event. Henry’s 1300
Central Standard Time (CST2, referred to by the
WB in 1925 as “90th
meridian time”) surface
analysis is shown in Fig. 2. This chart indicated
1 Alfred J. Henry was a Principal
Meteorologist at Weather Bureau Headquarters,
Washington, D. C., in 1925. His primary
assignment at that time was as Editor, Monthly
Weather Review, then published by the WB. 2 UTC = CST + 6 h; CST is used hereafter for
brevity.
Page 4
MADDOX ET AL. 30 March 2013
4
that the center of lowest pressure was about half
way between Cairo, Illinois (IL) and St. Louis,
Missouri (MO). At this time the tornado had just
begun, well to the west-southwest of the center
of observed lowest pressure, in a region where
Henry’s analysis indicated surface temperatures
as low as 50°F (10°C). The observed station
winds, however, indicate a cyclonic circulation
centered somewhere in southeastern Missouri.
Indeed, Henry noted the following:
“The center of the cyclone at 1 p. m., 90th
meridian time, was probably 100 miles or
thereabouts west-southwest of Cairo, possibly in
Ripley County, Mo., or 40 miles south of
Reynolds County, where the tornado was first
seen.”
The difference between the surface isobars
and Henry’s description of where the cyclone
probably was located seems strange (the original
figure has been modified to show the
approximate cyclone location that Henry
described). He apparently considered the
observed winds and concluded that there was a
cyclonic circulation centered west of Cairo. The
fact that the pressure analysis indicated a
different location for the lowest pressure was
apparently not of concern for WB synoptic
analysts in 1925. Henry realized that the
cyclonic circulation west of Cairo was directly
associated with the Tri-State tornado. Namias
(1980) commented on the backward state of the
WB in the 1920s and noted that Chief
Forecasters worked with a series of surface
charts that each showed a synoptic plot of a
different weather element. This complicated
procedure may partially explain the lack of
consistency between the observed winds and the
pressure analysis.
Changnon and Semonin (1966) redid the WB
0700 CST synoptic chart and Henry’s afternoon
surface analyses, adding frontal features, for
their article in Weatherwise magazine. In their
version of the 1300 CST surface chart (Fig. 3),
they showed a simplified chart that did not
include plots of the actual surface observations.
The figures in their article indicate that the Tri-
State tornado developed far to the west of the
cold front and the surface low pressure center. It
appears that Changnon and Semonin used
Henry’s isobar analysis to define the cyclone and
fronts, while neglecting winds and temperatures.
They also lowered surface pressures drastically
(apparently based solely on a barograph trace
from the edge of the tornado damage path
through West Frankfort, IL). Their surface
isobars are seriously in error, disagreeing
markedly with Henry’s charts and with the WB
surface observations across the region. Their
low-pressure bias was nearly equal to the
difference between the background pressure and
the low-pressure spike observed with the
tornado. The surface charts shown in Changnon
and Semonin have been reproduced in a number
of other publications (e.g., Akin 2002).
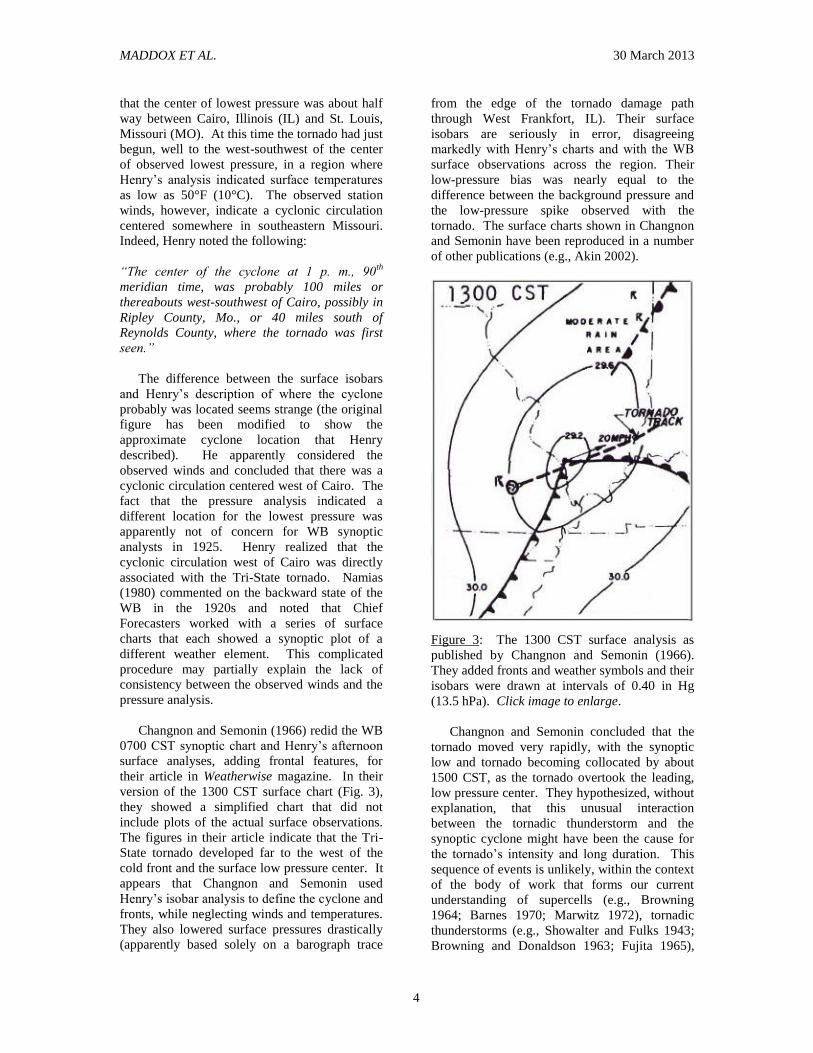
Figure 3: The 1300 CST surface analysis as
published by Changnon and Semonin (1966).
They added fronts and weather symbols and their
isobars were drawn at intervals of 0.40 in Hg
(13.5 hPa). Click image to enlarge.
Changnon and Semonin concluded that the
tornado moved very rapidly, with the synoptic
low and tornado becoming collocated by about
1500 CST, as the tornado overtook the leading,
low pressure center. They hypothesized, without
explanation, that this unusual interaction
between the tornadic thunderstorm and the
synoptic cyclone might have been the cause for
the tornado’s intensity and long duration. This
sequence of events is unlikely, within the context
of the body of work that forms our current
understanding of supercells (e.g., Browning
1964; Barnes 1970; Marwitz 1972), tornadic
thunderstorms (e.g., Showalter and Fulks 1943;
Browning and Donaldson 1963; Fujita 1965),
Page 5
MADDOX ET AL. 30 March 2013
5
and their synoptic settings (e.g., Fawbush and
Miller 1954; Beebe and Bates 1955; Miller 1959;
Miller 1967; Galway 1977).
3. Observations and methodology
During the 1920s, the WB was an agency of the
Department of Agriculture. Because of this,
surface observing procedures, and reporting of
significant weather events, had evolved primarily to
support agriculture operations and climatological
studies. There were many differences between
procedures used in the 1920s versus synoptic and
aviation observation procedures during the middle
to late 20th century. The procedures used for WB
observations3, and forms analyzed in the
reconstruction of surface charts for the Tri-State
study, are summarized here.
The WB had no official severe thunderstorm
forecasting or reporting procedures during the
first half of the 20th
century. If a tornado was
reported within 25 mi (40 km) of a WB office,
the official-in-charge was supposed to
investigate and report his findings as part of the
station’s monthly record. Storms that produced
hail were usually noted in WB records, but hail
was typically categorized as light, moderate, or
heavy, based upon the degree of crop or property
damage that had occurred.
Comprehensive surface observations were
taken at primary WB offices only twice per day,
at 0700 and 1900 CST. These observations
included temperature and dewpoint, station
pressure, surface pressure reduced to sea level
(SLP), and a 5-min average wind (observed any
time within 20 min of the hour), as well as
weather and sky conditions. Unfortunately,
surface wind directions were observed only to an
eight-point compass (north, northeast, east, etc.).
The WB did its first reanalysis project during
the early 1940s (U.S. Weather Bureau 1944;
Namias 1980) and produced 0700 CST surface
charts that depicted frontal features, as well as
pressure analyses. These reanalyzed surface
3 Observing procedures of the WB during the
1920s were described in a document we
obtained, “Instructions for Preparing
Meteorological Forms, Climatological Division.”
We used pages 3–17 of this document. The first
few pages were missing and we were unable to
find a complete copy. The document we used
was bound with WB forms from 1925 and was
found at the Cairo, IL, Public Library.
charts are useful for documenting the large-scale
features that moved across the U.S. and Canada
during the days surrounding the Tri-State event,
and will be discussed in the next section.
a. Observational forms used
Copies of many WB forms were obtained
from the National Climatic Data Center (NCDC)
through hardcopy data requests and from their
online archives. We were able to obtain copies
of WB surface observation Forms 1001 and 1014
for many stations in the central U.S., and these
have provided the bulk of the data analyzed. We
also obtained copies of original barograph and
thermograph traces for a number of WB stations
located near the path of the surface low and the
track of the tornado. Cooperative observer
climatological reports also have been used. The
WB was taking a limited amount of upper-air data
in 1925, during kite and pilot balloon (pibal)
flights, and we obtained some of these data from
three stations: Groesbeck, TX; Broken Arrow,
OK; and Royal Center, IN. We also located data
from a single pibal flight at Memphis, TN. These
upper-air data were considered in the study.
The 13-page WB Form 1001 was used
primarily to record the 0700 and 1900 CST
synoptic observations, other parameters, and to
summarize key aspects of the station’s weather.
These forms were prepared monthly and were
most complete for major WB stations (e.g., St.
Louis, MO, or Indianapolis, IN). Many smaller
stations (e.g., Cairo, IL, or Terre Haute, IN) only
completed some of the pages of the Form 1001.
Many stations reported hourly average winds on
the form and some reported the observed
temperature at the top of each hour. Some
stations recorded their 1001 observation only at
0700 or at 1900 CST. Most stations did take a
special noon observation that included the
temperature and the dewpoint (thus, information
on the surface dewpoint was available, at most,
for three times during a given day). These special
observations were taken at solar noon (1200 local
mean time) and are asynchronous data.
A single-page form, WB Form 1014, was
completed daily at most stations, to record
hourly temperature, wind, cloud cover, and
precipitation observations. A local noon
observation, a summary of the day, and
comments regarding local weather such as
thunderstorms, hail, extreme winds, etc. were
also recorded. The beginning and ending times
(to the minute) of precipitation and its type were
Page 6
MADDOX ET AL. 30 March 2013
6
noted on both 1001 and 1014 forms (many
stations were not staffed through the night,
leading to situations where the beginning or
ending time was recorded as “unknown”). The
times of occurrence of thunder sometimes were
noted on the 1001 monthly summaries, but were
recorded more frequently on the 1014 forms.
Barograph and thermograph traces were included
as part of this form. Generally, the information
on the WB Form 1014 was more detailed than
that entered on the 1001 (the local 1014 forms
were used to prepare the 1001 forms, which were
mailed monthly to WB Headquarters in
Washington, D. C.).
Winds reported on the surface observation
forms were hourly-averaged speed (mph) and
eight-point compass direction (except at 0700
CST and 1900 CST as noted above). The hourly
average winds included a notation if the
maximum, 5-min average speed, during a given
hour, exceeded a specific threshold. The
thresholds were determined based on station
climatology and differed from site-to-site.
Nevertheless, specific information on high wind
speeds proved useful, especially since some
observers noted the time and direction.
Additionally, an extreme wind speed was
recorded for each day. The extreme wind was
defined as the speed of the fastest mile of air flow
[i.e., an average wind of 60 mph (27 m s–1
) for 1
min equals 1 mi (1.6 km) of air flow] observed
during the day. Again, some observers would
note the time and direction of the extreme wind.
The difference between information reported
on the two WB surface observation forms can be
illustrated by comparing the hail reported at
Lexington, KY, on 18 March 1925. The form
1001 reports only that hail occurred on that day;
whereas, the 1014 form reports that there were
four separate thunderstorms during the day and
that around 1915 CST hail fell in Lexington with
a circumference of up to 4.5 in (11.4 cm). In
contrast, the 1014 form for Columbia, MO,
illustrates extreme inconsistencies in reporting
detail among various WB stations. This form
reports only that thunderstorms occurred from
0718–1915 CST on the 18th
, providing no details
on when individual storms actually occurred at
the station.
We were able to obtain both of these forms
for about 70% of the WB stations in the central
U.S. Since the 1014s were primarily for local
use, most of them were not archived at NCDC.
Many of these forms were located during field
trips by some of the authors to National Weather
Service (NWS) offices, local libraries and
university libraries in the primary study area
(Missouri, Illinois, and Indiana). Postal mail, e-
mail, and electronic queries and searches also
were used.
b. Methodology
Converting the various WB surface
observations to synoptic-like plots was difficult,
given the averaged or asynchronous character of
much of the data. The surface observations for
18 March were plotted on charts in as high detail
as possible from 0700–1900 CST (at 3-h
intervals and at each hour during the period of
the tornado). The averaged wind masks changes
during each hourly period and determining the
precise time of wind shifts is not possible. The
times of wind shifts and/or significant speed
changes rarely were noted on the forms.
Temperature was observed at the hour. The
beginning and ending times for precipitation
allowed determination of whether precipitation
was falling at the top of each hour. Dewpoints
could be plotted only at 0700 and 1900 CST, and
on the complicated noon chart.
The surface charts were plotted essentially as
a synoptic chart is today. We were able to find
observation forms for more stations than were
plotted on the WB surface charts, and analyzed
more detailed charts than have been examined
previously for this event. The temperature and
pressure (when available) and current weather
were plotted at the station locations. The winds
were considered representative of conditions at
the half hour4, and were space-shifted relative to
the station location using the translation vector
4 The WB’s use of hourly average winds
makes synoptic analysis difficult. Consider an
hour during which there was a change in
direction (e.g., from southeast to southwest). If
the wind shift occurred before the half hour, then
the hourly average wind direction would be
southwest, but if the shift occurred after the half
hour then the average direction would be from
the southeast. For most hours, the average wind
direction would best represent the wind at the
half hour. Changes in speed during an hour were
only reflected in the average speed. Obviously,
caution must be used in interpreting the winds
reported on the WB forms of 1925.
Page 7
MADDOX ET AL. 30 March 2013
7
of the synoptic cyclone [i.e., from 235° at 48
mph (21 m s–1
)]. Two winds were plotted on
these charts: the average wind for the hour
ending at the time of the map was plotted 24 mi
(39 km) to the northeast of the station, and the
average hourly wind for the next hour was
plotted 24 mi (39 km) to its southwest.
The determination of approximate SLP was the
most difficult challenge the 1925 data presented.
Each WB station had a specific set of tables and
adjustment charts to use in reducing station
pressure to sea level. These charts and tables have
not survived in the data archives. Station SLP was
estimated for the sites for which a barograph trace
was available. We had hard copies of the original
barographs for 17 stations along the track of the
surface low, and the 1014s for other stations also
had barograph traces. Additionally, we had to have
the 0700 and 1900 CST observations, which
included both the SLP and the recorded barograph
pressure. The SLP correction relative to the
station barograph trace was noted for 0700 and
1900 CST. These corrections then were
interpolated linearly across the intervening 11 h
and applied to the hourly barograph readings.
This procedure results in an estimated SLP that
does not reflect actual, nonlinear, intervening
temperature trends. Nevertheless, analyses of the
resulting pressure fields were consistent and
displayed reasonable time–space continuity,
indicating that the estimated SLPs are probably
accurate to within ±1 hPa.
The surface plot for “noon” was complicated,
since there were observational data for both 1200
CST and noon local mean time. The plotted chart
used the procedures described above for LST
observations of weather, winds, and SLP.
However, the local mean noon temperature and
dewpoint were plotted at each station. This
produces a chart that has asynchronous data mixed
with synoptic data. The time difference of the local
mean noon observations (4 min per degree of
longitude) is only significant far from the 90th
meridian. Since the important features at noon
were close to the 90th west meridian (the longitude
of Memphis, TN), this approximation had minimal
impacts on the accuracy of the noon analysis.
Detailed meteograms were constructed for all
the reporting stations surrounding the region
where the synoptic low and the tornado tracked.
The event occurred across a region that was, and
remains, relatively devoid of surface observation
sites (i.e., southern Missouri, southern Illinois,
and southwestern Indiana). The only WB station
in 1925 that was located relatively close to the
tornado track was Evansville, IN, about 25 mi
(40 km) south of the track and near the end of the
damage path. Cairo, IL, was a bit more than 50
mi (80 km) south of the tornado track when the
tornado was just east of De Soto, IL (Fig. 1), and
Terre Haute, IN, was about 70 mi (113 km) north
of the end of the tornado track. The meteograms
were used to establish continuity for the fast-
moving, synoptic cyclone and associated
features. These plots also facilitated
extrapolation of the analyses into the data void.
4. Synoptic conditions
The late winter and early spring of 1925 had
been unusually warm and dry over most of the
central U.S. The tracks of cyclones for March
1925 (Fig. 4), from Monthly Weather Review,
appear to indicate a mean ridge along the west
coast, with a broad trough over central portions
of the country. The path of the synoptic cyclone
(labeled VIII) eventually associated with the Tri-
State tornado began in northwestern Montana
and then moved south-southeastward to northern
Oklahoma. The cyclone then turned eastward
and northeastward and accelerated across the
eastern Great Lakes region and into Canada.
In retrospect, it is likely that a short-wave
trough in the middle and upper troposphere
approached the northwest coast of the U.S.,
moved rapidly through the top of the persistent
ridge, and then tracked southeastward across the
northern Great Basin and central Rocky
Mountains. The lowest surface pressures, within
a lee trough east of the mountains, gradually
shifted southward as the short wave approached
Colorado. Our analyses (not shown) indicated
that the surface low and a distinct cyclonic
circulation developed in the classic “Colorado
Low” genesis region of southeastern Colorado
(Hosler and Gamage 1956; Whittaker and Horn
1981). The cyclone moved eastward onto the
southern Plains as the short-wave trough crossed
the mountains. Recent upper-air reanalyses
support this hypothesized scenario—see
Appendix A.
Page 8
MADDOX ET AL. 30 March 2013
8
Figure 4: Tracks of surface cyclones for March 1925, from the March 1925 issue of Monthly Weather
Review, as determined by the WB. The track of the cyclone associated with the Tri-State tornado has been
highlighted in red. Pressures shown on this figure are in Hg and are missing the leading “2”. Times in
circles are: “A” for 0700 CST and “P” for 1900 CST. Meaning of the double circles is not known. Inset
shows change in average monthly pressure (in Hg) from February to March 1925. Click image to enlarge.
Surface charts for 0700 CST, reanalyzed by
the WB for this period, are presented in Fig. 5.
The lowest pressure at 0700 CST on 17 March
(Fig. 5a) was at Denver, CO, within a typical lee
trough. No distinct cyclonic circulation was
present in the observed surface winds, although
cyclogenesis likely was occurring over
southeastern Colorado. Occluded fronts were
indicated from Hudson Bay southwestward
across the northern Plains and within the lee
trough. A warm front along the Gulf Coast lay
south of a large area of damp, foggy, and
showery weather that stretched from northern
Texas to the Carolinas. Our surface analyses
(not shown) indicated the presence of early-
season, continental tropical (cT) air over western
Texas and northern Mexico. At 1900 CST on
the 17th
El Paso, TX, reported a temperature of
73°F (23°C) and a dewpoint of 2°F (–17°C),
while Abilene, TX, had 81°F (27°C) with a
dewpoint of 6°F (–14°C). To the east and
northeast of this hot, dry air mass, maritime
tropical (mT) air was advected northward behind
the warm front into eastern Oklahoma and
northwestern Arkansas during the 17th
. The
surface low moved eastward during the night,
passing just to the north of Oklahoma City, OK.
By 0700 CST 18 March, the surface low had
moved to northeastern Oklahoma (Fig. 5b) and
the warm front had moved northward into its
circulation. The analysis indicates a Pacific cold
front across eastern Texas; however, the actual
frontal position is difficult to determine because
of the presence of cT air (i.e., a dryline) ahead of
the maritime Pacific (mP) air mass, a typical
spring situation over the southern Plains. The
synoptic situation was further complicated by the
fact that the short-wave trough at 500 hPa, and
the associated Pacific front, had traversed the
mountain states from northwest to southeast.
Page 9
MADDOX ET AL. 30 March 2013
9
(a) 17 March
(b) 18 March
Page 10
MADDOX ET AL. 30 March 2013
10
(c) 19 March
Figure 5: Reanalyzed surface charts for 0700 CST on: a) 17, b) 18, and c) 19 March 1925. Frontal features
are shown and isobars are in hPa. Copies of these WB maps were obtained from the Dept. of Commerce,
Boulder Labs Library. Click each image to enlarge.
The mP air likely underwent considerable
subsidence before it moved onto the southern
Plains. The maritime mP air was not easily
distinguished from the cT air by either
temperature gradients or wind shifts. [Doswell
(1982) and Sanders and Doswell (1995) discuss
the problems of surface analysis when a dryline
is involved.] To the northeast, the old occlusion
had moved slowly southward across the Great
Lakes region and extended southwestward
toward the cyclone.
An area of early morning thunderstorms and
rain had developed north of both the cyclone and
the warm front from southeastern Kansas
eastward to Kentucky and Indiana. Rain-cooled
air north of the warm front would play an
important role in the evolution of subsequent
weather events. The first severe thunderstorms
of 18 March already had occurred during the pre-
dawn hours over southeastern Kansas, where
several storms produced damaging hail and
possibly a tornado. During the early morning
hours, cooperative observers reported
thunderstorms and hail (size unknown) over far
northeastern Oklahoma. These nocturnal and
early-morning storms likely occurred within a
layer of lower-tropospheric warm advection
north and northeast of the surface low.
By 0700 CST on the 19th
(Fig. 5c) the surface
low had deepened and moved rapidly
northeastward into southern Canada. During the
18th
, colder air from Canada and the western
Great Lakes region advected southward into the
cyclone’s circulation, resulting in periods of
snow and sleet from eastern Iowa into central
Michigan. The WB positioning of the Pacific
cold front was complicated by a squall line that
had developed late on the 18th
and moved
eastward ahead of the front. It appears that the
cold front indicated on this figure was actually
the position of the prefrontal squall line.
The thunderstorm outbreak of 18 March was
associated with a synoptic cyclone whose central
pressure was around 998 hPa during the period
of intense storms. The strength of this low
Page 11
MADDOX ET AL. 30 March 2013
11
pressure system was not similar to, for example,
the surface lows associated with the Palm
Sunday tornadoes of 1965 (U.S. Weather Bureau
Survey Team 1965) and the 3–4 April 1974
tornado outbreak (Hoxit and Chappell 1975).
These surface lows had central pressures of
about 983 hPa, almost 15 hPa deeper than the
low associated with the Tri-State tornado event.
However, pressure gradients near the core of the
Tri-State cyclone were strong from the morning
of the 18th
to the morning of the 19th
. Surface
winds on the afternoon of the 18th
reached speeds
(i.e., fastest mile) of 66 mph (30 m s–1
) at Cairo,
IL, and Evansville, IN, as the low moved by to
the north. Wind speeds at Buffalo, NY, reached
an extreme, fastest mile of 84 mph (38 m s–1
) on
the morning of the 19th
.
Figure 6: Area of thunderstorms and hail on 18
March 1925 (red line) from WB forms, Monthly
Climate Summaries by state, and WB
cooperative observer reports. Weather symbols
indicate approximate locations of reported
thunderstorms and hail. Known severe
thunderstorms are marked “SVR”. Black lines
indicate tornado tracks with approximate times
[as per Henry (1925), except that two new
tornadoes, from Johns et al. (2013) and the
Kansas Climate Summary for March 1925 have
been added]. Tornado tracks have been modified
slightly based on newspaper reports and Grazulis
(1993). Several key WB stations are shown. The
gray line indicates the extent of the 3–4 April
1974 outbreak. Click image to enlarge.
The Tri-State tornado has been the focus of
attention over the years; however, a number of
other destructive tornadoes occurred (Fig. 6).
There were numerous reports of hail on this day
and some thunderstorms produced high winds.
The general area experiencing thunderstorms
(many known to have been severe) and hail
(sizes mostly unknown) extended from
southeastern Kansas eastward to western Ohio
and southward to portions of Louisiana,
Mississippi, Alabama and Georgia. Had there
been systematic documentation of severe
thunderstorms in 1925, the overall Tri-State
tornado and severe thunderstorm event would
have been considered a widespread outbreak.
The area of the 3–4 April 1974 tornado outbreak
is indicated on Fig. 6 for comparison.
5. New analyses
Surface maps, plotted as described in
Section 2, have been analyzed and are
considered relative to the conditions and features
associated with the long-track, Tri-State tornado.
The synoptic cyclone, the supercell, and the
tornado moved across a data-void region,
complicating analysis efforts. Also considered
in this section are barograph traces and detailed
meteograms.
a. Surface charts
Seven members of our research team
independently analyzed surface charts for the
critical period from 1200–1700 CST. The spread
of the individual results was fairly substantial
and is discussed in Appendix B. The figures
shown in this subsection represent one possible
interpretation of the observations.
At 0700 CST (Fig. 7) the surface low, with
central pressure ≈1003 hPa, was located in
extreme northeastern Oklahoma. A dryline and
cold front extended southward and
southwestward from the low, but the exact
positions are difficult to determine—a common
situation as described by Doswell (1982). A
warm front extended eastward from the low. An
area of rain and thunderstorms was north of the
surface low and the warm front. A mesoscale
outflow boundary appeared to have moved
slightly south of the warm front over
northwestern Tennessee and northeastern
Arkansas. The cool air sector over the north-
central U.S. exhibited a number of weak pressure
troughs, and the overall analysis was quite
complicated. Moist mT air with surface
dewpoints of 60–65°F (~16–18°C) extended
northward to the warm frontal zone. The overall
situation is typical of synoptic settings conducive
to springtime severe thunderstorms (e.g., a
synoptic type B pattern, as per Miller 1967).
Page 12
MADDOX ET AL. 30 March 2013
12
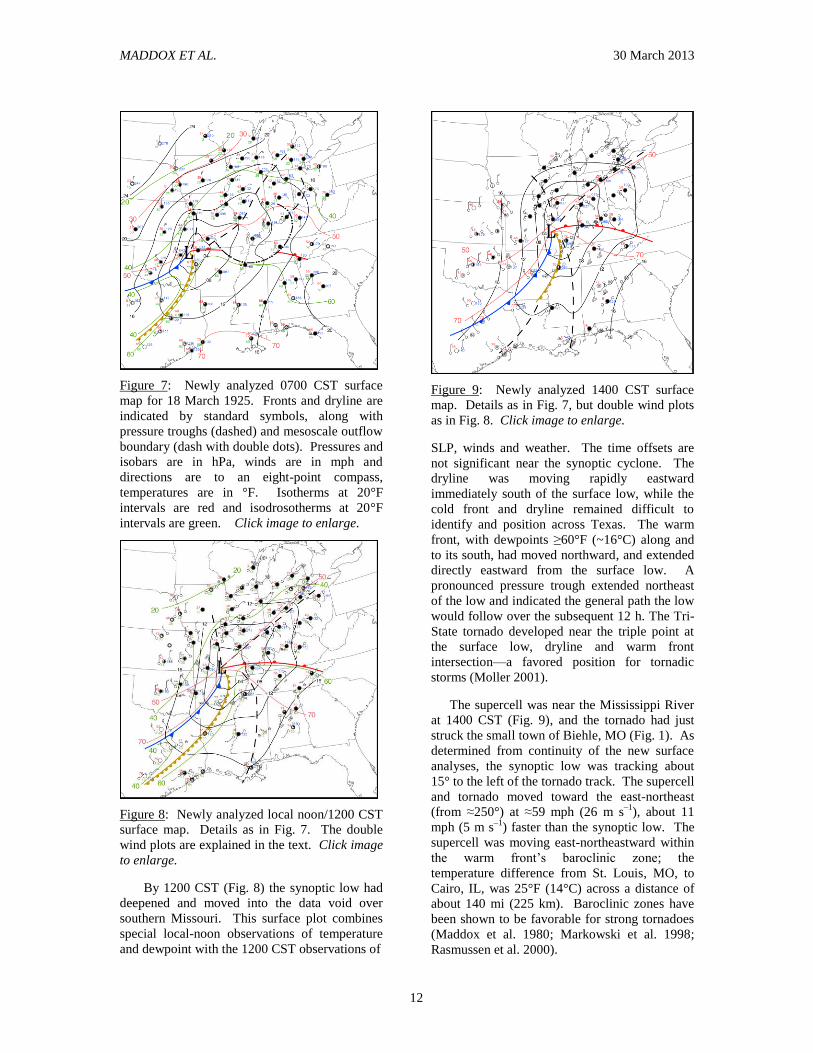
Figure 7: Newly analyzed 0700 CST surface
map for 18 March 1925. Fronts and dryline are
indicated by standard symbols, along with
pressure troughs (dashed) and mesoscale outflow
boundary (dash with double dots). Pressures and
isobars are in hPa, winds are in mph and
directions are to an eight-point compass,
temperatures are in °F. Isotherms at 20°F
intervals are red and isodrosotherms at 20°F
intervals are green. Click image to enlarge.
Figure 8: Newly analyzed local noon/1200 CST
surface map. Details as in Fig. 7. The double
wind plots are explained in the text. Click image
to enlarge.
By 1200 CST (Fig. 8) the synoptic low had
deepened and moved into the data void over
southern Missouri. This surface plot combines
special local-noon observations of temperature
and dewpoint with the 1200 CST observations of
Figure 9: Newly analyzed 1400 CST surface
map. Details as in Fig. 7, but double wind plots
as in Fig. 8. Click image to enlarge.
SLP, winds and weather. The time offsets are
not significant near the synoptic cyclone. The
dryline was moving rapidly eastward
immediately south of the surface low, while the
cold front and dryline remained difficult to
identify and position across Texas. The warm
front, with dewpoints ≥60°F (~16°C) along and
to its south, had moved northward, and extended
directly eastward from the surface low. A
pronounced pressure trough extended northeast
of the low and indicated the general path the low
would follow over the subsequent 12 h. The Tri-
State tornado developed near the triple point at
the surface low, dryline and warm front
intersection—a favored position for tornadic
storms (Moller 2001).
The supercell was near the Mississippi River
at 1400 CST (Fig. 9), and the tornado had just
struck the small town of Biehle, MO (Fig. 1). As
determined from continuity of the new surface
analyses, the synoptic low was tracking about
15° to the left of the tornado track. The supercell
and tornado moved toward the east-northeast
(from ≈250°) at ≈59 mph (26 m s–1
), about 11
mph (5 m s–1
) faster than the synoptic low. The
supercell was moving east-northeastward within
the warm front’s baroclinic zone; the
temperature difference from St. Louis, MO, to
Cairo, IL, was 25°F (14°C) across a distance of
about 140 mi (225 km). Baroclinic zones have
been shown to be favorable for strong tornadoes
(Maddox et al. 1980; Markowski et al. 1998;
Rasmussen et al. 2000).
Page 13
MADDOX ET AL. 30 March 2013
13
Figure 10: Newly analyzed 1600 CST surface
map. Details as in Fig. 9. Click image to enlarge.
Figure 11: Newly analyzed 1900 CST surface
map. Details as in Fig. 7. Click image to
enlarge.
By 1600 CST (Fig. 10) the synoptic low had
deepened to near 998 hPa and was over southern
Illinois. The supercell and tornado had remained
in the “sweet spot” along the baroclinic zone of
the warm front and had just moved into Indiana.
Strong thunderstorms had developed within the
warm sector and the dryline was coincident with
a line of severe thunderstorms. At 1900 CST
(Fig. 11) the synoptic low was near Indianapolis,
IN. Numerous thunderstorms were occurring
east and south of the low center, and a line of
storms was moving into the southeastern U. S.
Figure 12: Positions of the synoptic low (black
dots: 0700, 1200–1900 CST) and boundaries
adjacent to the warm sector (dryline, warm front,
and convective outflows) are shown. The Tri-
State tornado (colored triangles) and extrapolated
supercell positions (stars; 1200, 1700 and 1900
CST) are indicated. The tornado track, traced
from the data points in Johns et al. (2013), is in
dark brown. A thin black line connects the
synoptic low pressure center and the tornado (or
extrapolated supercell) position at each time.
Supercell positions at 1200, 1700, and 1900 CST
were estimated using the average speed of the
tornado. Only a portion of the outflow boundary
is shown for 0700 CST. Click image to enlarge.
A continuity chart, shown in Fig. 12, was
constructed using the new surface analyses from
0700 CST through 1900 CST. The chart also
shows estimated positions (at 1200, 1700, and
1900 CST) of the supercell associated with the
tornado. Continuity indicates that the tornado,
because of its different track and faster movement,
advanced farther away from the synoptic low
during the afternoon. However, the supercell, and
associated tornado, remained very near the warm
front through their lifetimes. An analysis of
reported maximum temperatures on 18 March
(Fig. 13) shows that the long-lived supercell and
tornado had moved east-northeastward within a
substantial baroclinic zone.
The pre-existing, mesoscale pool of rain-
cooled air had slowed the northward motion of
the synoptic-scale warm front, helping to
maintain the strong temperature gradient.
Maddox et al. (1980) noted that tornadoes
moving along preexisting thermal boundaries
tended to have longer tracks. Markowski et al
(1998) reported that during the VORTEX field
program, nearly 70% of the significant tornadoes
Page 14
MADDOX ET AL. 30 March 2013
14
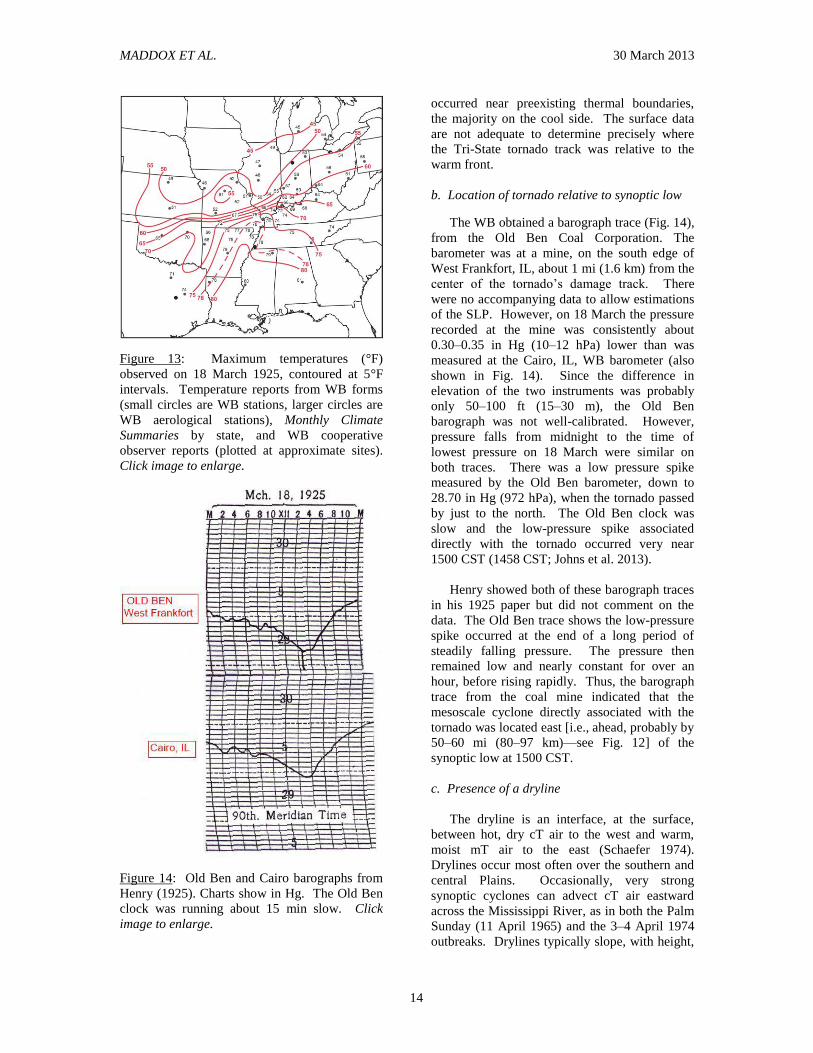
Figure 13: Maximum temperatures (°F)
observed on 18 March 1925, contoured at 5°F
intervals. Temperature reports from WB forms
(small circles are WB stations, larger circles are
WB aerological stations), Monthly Climate
Summaries by state, and WB cooperative
observer reports (plotted at approximate sites).
Click image to enlarge.
Figure 14: Old Ben and Cairo barographs from
Henry (1925). Charts show in Hg. The Old Ben
clock was running about 15 min slow. Click
image to enlarge.
occurred near preexisting thermal boundaries,
the majority on the cool side. The surface data
are not adequate to determine precisely where
the Tri-State tornado track was relative to the
warm front.
b. Location of tornado relative to synoptic low
The WB obtained a barograph trace (Fig. 14),
from the Old Ben Coal Corporation. The
barometer was at a mine, on the south edge of
West Frankfort, IL, about 1 mi (1.6 km) from the
center of the tornado’s damage track. There
were no accompanying data to allow estimations
of the SLP. However, on 18 March the pressure
recorded at the mine was consistently about
0.30–0.35 in Hg (10–12 hPa) lower than was
measured at the Cairo, IL, WB barometer (also
shown in Fig. 14). Since the difference in
elevation of the two instruments was probably
only 50–100 ft (15–30 m), the Old Ben
barograph was not well-calibrated. However,
pressure falls from midnight to the time of
lowest pressure on 18 March were similar on
both traces. There was a low pressure spike
measured by the Old Ben barometer, down to
28.70 in Hg (972 hPa), when the tornado passed
by just to the north. The Old Ben clock was
slow and the low-pressure spike associated
directly with the tornado occurred very near
1500 CST (1458 CST; Johns et al. 2013).
Henry showed both of these barograph traces
in his 1925 paper but did not comment on the
data. The Old Ben trace shows the low-pressure
spike occurred at the end of a long period of
steadily falling pressure. The pressure then
remained low and nearly constant for over an
hour, before rising rapidly. Thus, the barograph
trace from the coal mine indicated that the
mesoscale cyclone directly associated with the
tornado was located east [i.e., ahead, probably by
50–60 mi (80–97 km)—see Fig. 12] of the
synoptic low at 1500 CST.
c. Presence of a dryline
The dryline is an interface, at the surface,
between hot, dry cT air to the west and warm,
moist mT air to the east (Schaefer 1974).
Drylines occur most often over the southern and
central Plains. Occasionally, very strong
synoptic cyclones can advect cT air eastward
across the Mississippi River, as in both the Palm
Sunday (11 April 1965) and the 3–4 April 1974
outbreaks. Drylines typically slope, with height,
Page 15
MADDOX ET AL. 30 March 2013
15
to the east, resulting in a strong capping layer
aloft. This dry layer suppresses development of
thunderstorms (Lanicci and Warner 1991) except
in regions of intense forcing for upward motion.
For the Tri-State case it appears likely that an
inversion aloft, ahead of the surface dryline,
acted to suppress thunderstorm development
across much of the warm sector until about 1500
CST. Thunderstorm development only occurred
within the warm sector, near and east of the
Mississippi River, where low-level air apparently
was not as strongly capped by cT air aloft.
The best evidence for the presence of a strong
dryline during the Tri-State event is provided by
the surface data from Little Rock, AR, and
secondarily from stations in northeastern
Louisiana and eastern Texas (see analyses above
in subsection a), as well as pibal data from
Memphis, TN. A meteogram constructed for
Little Rock (not shown) indicates that at 0700
CST the dewpoint was 62°F (17°C; RH = 85%)
with southerly winds. At local noon the
temperature was 77°F (25°C) and the dewpoint
was 42°F (6°C; RH = 29%). Winds had become
southwesterly shortly before 1000 CST, with
speeds of around 35 mph (16 m s–1
). The cold
front passed Little Rock around 1230 CST, with
westerly winds that became northwesterly by
1330 CST. It is clear that a dryline indeed had
passed Little Rock before noon. At local noon,
Shreveport reported west to southwest winds at
about 15 mph (7 m s–1
), and the relative humidity
was 45% [dewpoint was 53°F (12°C)]. Thus, the
dryline was less pronounced over northwestern
Louisiana than at Little Rock.
The closest surface observations east-
northeast of Little Rock were taken at Cairo, IL.
A meteogram constructed from all the data
available there is shown in Fig. 15. Cool, damp
conditions prevailed at Cairo, where early
morning storms kept temperatures in the upper
50s °F (around 14°C). Just before noon the
temperature began a fairly rapid rise after a wind
shift to the south.
The barograph trace was unsteady before
0800 CST, apparently due to elevated
thunderstorms (i.e., thunderstorms whose
updrafts were not rooted in the cool, stable
surface layer). By 1500 CST winds had shifted
to southwesterly, and skies cleared for a brief
period. The average 5-min wind for the period
beginning at 1455 CST was from the southwest
at 40 mph (18 m s–1
). These rapid changes were
associated with stronger winds aloft being mixed
to the surface behind the dryline (Schaefer
1974). Pressure remained low until just before
1600 CST when it started a rapid rise,
accompanied by falling temperatures, after
passage of the cold front. The fastest mile of
wind observed at Cairo on 18 March was 66 mph
(30 m s–1
) at 1602 CST. The WB observer at
Cairo noted:
“Second thunderstorm—Only one peal of
thunder was heard—at 2:50 pm. The storm was
north of the station. Though the wind reached a
great velocity no deaths or material damage
occurred in Cairo or its immediate vicinity. Hail
up to as large as birds eggs occurred in upper
Alexander and Pulaski Counties.”
These remarks on the Form 1014 indicate
that there was, at this time (1450 CST), at least
one severe thunderstorm located well to the
south of the Tri-State supercell [northern
Alexander and Pulaski Counties are only about
20 mi (30–35 km) north of Cairo]. It is likely
that this storm had formed along the dryline.
A brief, light shower was observed at
Memphis, TN, around noon, and this may have
indicated initial development of deep convection
within the warm sector of the synoptic cyclone.
Memphis (meteogram not shown) observed its
fastest mile of wind [48 mph (21 m s–1
) from the
southwest] around 1455 CST, indicating that the
dryline passed Memphis about the same time as
at Cairo. The temperature at Memphis remained
above 70°F (21°C) until 1600 CST when its high
temperature of 77°F (25°C) was observed. The
temperature then fell rapidly.
Evansville, IN, was just south of the final
portion of the track of the Tri-State tornado, and
its meteogram is shown in Fig. 16. Conditions
were similar to those at Cairo, with occasional
rain and thunderstorms through the morning.
Temperatures remained below 60°F (16°C) until
after 1330 CST, when the warm front passed the
station. There was a small dip in pressure when
the tornado passed by 26 mi (42 km) to the
north, striking Princeton, IN, at 1618 CST
(Fig. 1). The pressure then continued to fall until
1700 CST, when it began to rise rapidly.
Page 16
MADDOX ET AL. 30 March 2013
16
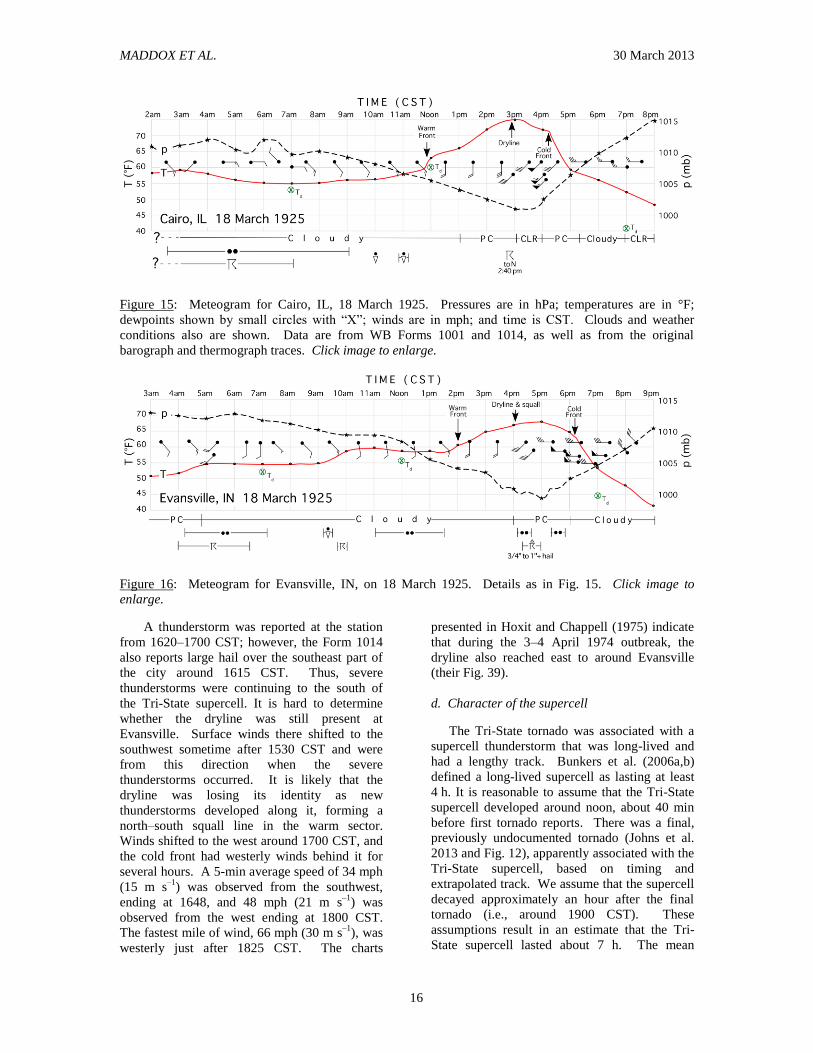
Figure 15: Meteogram for Cairo, IL, 18 March 1925. Pressures are in hPa; temperatures are in °F;
dewpoints shown by small circles with “X”; winds are in mph; and time is CST. Clouds and weather
conditions also are shown. Data are from WB Forms 1001 and 1014, as well as from the original
barograph and thermograph traces. Click image to enlarge.
Figure 16: Meteogram for Evansville, IN, on 18 March 1925. Details as in Fig. 15. Click image to
enlarge.
A thunderstorm was reported at the station
from 1620–1700 CST; however, the Form 1014
also reports large hail over the southeast part of
the city around 1615 CST. Thus, severe
thunderstorms were continuing to the south of
the Tri-State supercell. It is hard to determine
whether the dryline was still present at
Evansville. Surface winds there shifted to the
southwest sometime after 1530 CST and were
from this direction when the severe
thunderstorms occurred. It is likely that the
dryline was losing its identity as new
thunderstorms developed along it, forming a
north–south squall line in the warm sector.
Winds shifted to the west around 1700 CST, and
the cold front had westerly winds behind it for
several hours. A 5-min average speed of 34 mph
(15 m s–1
) was observed from the southwest,
ending at 1648, and 48 mph (21 m s–1
) was
observed from the west ending at 1800 CST.
The fastest mile of wind, 66 mph (30 m s–1
), was
westerly just after 1825 CST. The charts
presented in Hoxit and Chappell (1975) indicate
that during the 3–4 April 1974 outbreak, the
dryline also reached east to around Evansville
(their Fig. 39).
d. Character of the supercell
The Tri-State tornado was associated with a
supercell thunderstorm that was long-lived and
had a lengthy track. Bunkers et al. (2006a,b)
defined a long-lived supercell as lasting at least
4 h. It is reasonable to assume that the Tri-State
supercell developed around noon, about 40 min
before first tornado reports. There was a final,
previously undocumented tornado (Johns et al.
2013 and Fig. 12), apparently associated with the
Tri-State supercell, based on timing and
extrapolated track. We assume that the supercell
decayed approximately an hour after the final
tornado (i.e., around 1900 CST). These
assumptions result in an estimate that the Tri-
State supercell lasted about 7 h. The mean
Page 17
MADDOX ET AL. 30 March 2013
17
lifetime of long-lived supercells studied by
Bunkers et al. (2006a,b) was 5.5 h. The duration
of the Tri-State supercell ranks 32nd
(top 15%) if
added to the Bunkers sample. The estimated
path of the Tri-State supercell was ≈413 mi (664
km). Because of its high speed of movement,
the Tri-State supercell would have the 6th
longest
track (top 5%) in the Bunkers et al. sample (M.
Bunkers 2012, personal communication).
Compared to other long-lived supercells, the Tri-
State storm was both unusually long-tracked and
of relatively long duration.
Bunkers et al. (2006a) found that long-lived
supercells tend to be discrete (68% of sample)
and isolated (79% of sample). By discrete they
mean identifiable thunderstorm cells that were
distinct from one another, and by isolated they
mean storms that were separated from others by
at least one storm diameter. It is impossible to
know the character of the Tri-State supercell, but
observations suggest that it was the only severe
thunderstorm on 18 March until around 1500
CST. At this time, observations from Cairo
indicate another severe thunderstorm,
considerably south of the Tri-State storm. It is
likely that the Tri-State storm was isolated and
discrete, similar to many of the long-lived
supercells studied by Bunkers et al. (2006a).
The Tri-State supercell also tracked near a
surface baroclinic zone, as did 51% of the long-
lived supercells studied by Bunkers et al.
e. Similar events
Long-track tornadoes are extremely rare, and
the NOAA “ONETOR” database (available
online from the Storm Prediction Center), lists
only 60 tornadoes with path lengths >100 mi
(161 km) since 1950. Since 1980 there have
been only 12 such tornadoes. The authors
briefly examined the synoptic settings of four
significant events that occurred since 1980. Two
events (28 March 1984 in the Carolinas, and 29
March 1998 in southern Minnesota) had
tornadoes occurring along a warm front, but
these produced series of tornadoes. Other long-
track tornadoes occurred within the warm sector
of two synoptic cyclones (24 April 2010 in
Louisiana and Mississippi, and 27 April 2011 in
the Southeast U. S.). The synoptic cyclones
associated with these events all had considerably
lower central pressures than did the Tri-State
surface low. None of these events could be
considered an analog to the Tri-State event.
6. Upper-air data
During 1925 pibal observations of winds
aloft were taken at some WB stations. We were
able to obtain copies of March 1925 pibal data
from three stations (refer to Fig. 6 for locations):
Broken Arrow, OK (flights at 0700 and 1500
CST); Royal Center, IN (at 0700 and 1400 CST);
and Memphis, TN (at 1500 CST). Some WB
aerological stations used instrumented kites to
measure upper-air conditions (including
Groesbeck, TX; Broken Arrow, OK; and Royal
Center, IN). Wind directions for upper-level
wind data were determined for a 16-point
compass and speeds were recorded in m s–1
.
Data taken at these stations on 17 and 18 March
are discussed below.
a. Pilot balloon winds
On 17 March at 0700 CST there was no flight
at Broken Arrow because of low clouds, but
there was a flight at 1500 CST (data for the two
relevant Broken Arrow pibal flights on the 17th
and 18th
are shown in Table 1). The lower-
tropospheric wind profile on the afternoon of the
17th
indicated strong winds (>20 m s–1
at levels
≤3 km MSL) that veered with height. Such a
wind profile would be expected ahead of the
synoptic low, which was located over the Texas
and Oklahoma Panhandles at the time of the
flight. The veering winds at higher levels of the
flight indicate warm advection aloft.
Table 1: Pibal data taken at Broken Arrow, OK.
Data on left are from 1500 CST, 17 March 1925,
and data on right are from 0700 CST 18 March
1925. “M” stands for missing data. Click image
to enlarge.
The flight the next morning at 0700 CST
(Table 1) was taken just west of the synoptic
low. Low-level winds were northerly to
northwesterly and backed with height, indicating
cold advection. The cold front had passed the
kite station, and there was a pronounced
Page 18
MADDOX ET AL. 30 March 2013
18
northerly jet of 26 m s–1
below 1.0 km MSL. It
is possible that wind speeds at Broken Arrow
had been enhanced by outflows from an area of
thunderstorms located over southeastern Kansas
and northeastern Oklahoma, north of the station.
Table 2: Pibal data taken on 18 March 1925.
Data on left are from Royal Center, IN, at 0700
CST. Data on right are from Memphis, TN, at
1500 CST. Click image to enlarge.
Royal Center, in northern Indiana, was
located within the cold and rainy air mass north
of the warm front. There was a pibal flight at
0700 CST on the 18th
, but no flight was made at
1400 CST due to rain and low clouds. The
morning flight (Table 2) indicated east to
northeast winds above the surface, but the wind
direction had veered to southwest by the time the
balloon reached 2.0 km. From 2.5–3.5 km winds
were west-southwest at 17–19 m s–1
, indicating
strong west-southwest winds above the cold air
mass.
A pibal was taken at Memphis at 1500 CST
18 March (Table 2). The flight was made just
behind the dryline. The data indicated a deep
boundary layer with winds from the WSW at all
levels measured. The speed at 1.5 km MSL
reached 23 m s–1
. This was the highest altitude
for which a wind was obtained. The pibal data
fit reasonably well with the surface analyses and
the speed of surface winds immediately
following dryline passage.
c. Kite-flight observations
We found limited upper-air data (not shown)
from kite flights at Groesbeck (location on
Fig. 6). At 1445 CST 17 March, there were
veering winds, warm advection aloft, and
moderately strong winds to the southeast of the
developing cyclone. The air aloft was very dry,
probably indicating a strong capping inversion
above moist, low-level air. A morning kite flight
at Groesbeck on 18 March indicated west-
southwest winds aloft and low RH. The
Groesbeck data support the hypothesis that the
warm sector of the Tri-State synoptic cyclone
was characterized by Type I severe thunderstorm
soundings (Fawbush and Miller 1954).
At Broken Arrow, a kite was flown on the
18th
from 0926–1214 CST (location shown on
Fig. 6). The data for this flight, made in the cold
air mass just behind the cyclone, are shown in
Table 3. The flight reached 3395 m MSL
(666 hPa) at 1109 CST, where winds were
westerly at 16.6 m s–1
and the RH was 34%. The
upper-air data were characterized by winds
backing with height and strong cooling during
the period of the flight. The layer from the
surface to about 900 hPa cooled by 5°C during
the flight.
The limited upper-air observations support
the surface analyses presented in this paper, the
presence of a distinct dryline, and the
hypothesized strong, elevated capping inversion
that suppressed storm development in the warm
sector west of the Mississippi River.
Table 3: Kite-flight data taken at Broken Arrow,
OK, on 18 March 1925. Data were taken while
the kite was ascending (left side), and also while
it was being brought down (right side). Click
image to enlarge.
d. Estimated hodographs
The Tri-State supercell was long-lived and
moved along a nearly straight-line path from
≈250 degrees at ≈59 mph (26 m s–1
) (Johns et al.
2013). Because of its nearly steady velocity, it is
possible to estimate environmental hodographs
near the storm. Bunkers et al. (2000) developed
an empirical technique that uses the
environmental hodograph to predict the velocity
vector of supercell thunderstorms (see their
Section 3a). Their procedure has been used to
Page 19
MADDOX ET AL. 30 March 2013
19
obtain estimates of the Tri-State hodograph. The
velocity vector of the storm was well-
documented and the nearby surface winds can be
estimated from surface observations. Using
these two fixed values, subjective iteration of
estimated winds aloft can produce hodographs
that yield the Tri-State storm’s velocity, via the
Bunkers et al. technique. Although there can be
an infinite number of solutions, the actual spread
of possible, physically realistic estimates is fairly
constrained.
Results from this exercise are shown in
Fig. 17. Two of the plots are subjectively
estimated hodographs. Curve A uses the surface
wind observed at Cairo, Illinois, and curve B
uses an estimated surface wind north of Cairo,
near the warm front. Curve C, for comparison, is
the mean F5 tornado hodograph from Colquhoun
and Riley (1996), rotated and magnified to match
the Tri-State storm’s velocity. Estimates A and
C have the same general shape and wind
velocities, with some differences from 5–6 km.
Estimate B has a weaker, south-southeasterly
surface wind with a pronounced low-level jet just
below 1 km AGL. Naylor and Gilmore (2012)
have found that longer durations and intensities
of simulated tornadoes best relate to higher
values of 0–3 km storm-relative environmental
helicity (SREH). Values for 0–3 km SREH are:
curve A, 232 m2
s–2
; curve B, 340 m2
s–2
; and
curve C, 243 m2 s
–2.
Figure 17: Estimated hodographs for about 1500
CST on 18 March 1925. Curves A and B were
derived using the technique of Bunkers et al.
(2000) and curve C was adapted from
Colquhoun and Riley (1996). Circle is
estimated velocity V of a right-moving (RM)
supercell, which was the observed motion of the
Tri-State supercell. Numbers along hodographs
indicate height (km AGL). Click image to
enlarge.
The estimated hodographs indicate that winds
aloft in the lower half of the troposphere were
very strong. The winds probably veered rapidly
within the lowest 3 km, contributing to
substantial SREH near the rapidly moving
supercell. Winds above 3 km were probably
west-southwesterly at about 30 m s–1
near
700 hPa and around 40–50 m s–1
near 500 hPa.
7. Final comments
A widespread thunderstorm outbreak affected
much of the south-central U.S. on the afternoon
of 18 March 1925. The deadly, long-track Tri-
State tornado was the most severe storm event of
the 18th
. Past reports had inaccurate surface
analyses and indicated, erroneously, that the
tornado had formed in cold air west of a synoptic
cyclone. However, the Tri-State tornado was
directly associated with a fast-moving cyclone
whose central pressure was not unusually low.
Winds aloft appear to have been very strong.
Although the synoptic pattern would indicate the
likelihood of severe weather, there is no singular
aspect of the setting that explains the long track
and persistent, violent intensity of the Tri-State
tornado. Indeed, the somewhat mundane
character of the synoptic situation leads one to
wonder why very long-track tornadoes do not
occur more frequently. Mesoscale analyses
along the track of the tornado reveal that:
The tornadic supercell developed very near
the center of the synoptic cyclone, possibly at
the triple point intersection of the warm front
and the dryline.
The north–south temperature gradient near
the triple point and north of the warm front
remained strong during the afternoon due to
air that had been cooled by earlier
precipitation.
The tornadic supercell moved east-
northeastward at ≈59 mph (26 m s–1
) away
from the center of the slower-moving
cyclone.
The long-lived, tornadic supercell remained
close to the surface warm front during most
of its life.
These analyses indicate that, as the surface
cyclone and dryline moved rapidly eastward, the
northward movement of the warm front kept the
Tri-State supercell within a very favorable storm
environment for several hours. Apparently, this
consistent time and space concatenation of the
supercell, the warm front, and the dryline during
Page 20
MADDOX ET AL. 30 March 2013
20
most of the afternoon of 18 March 1925 was
extremely unusual.
ACKNOWLEDGMENTS
The authors extend their thanks to the
following people who assisted us during this
decade-long project. Matthew Bunkers, NWS
Rapid City, read a draft manuscript and provided
comments and suggestions to the lead author.
Gil Compo, Tom Hamill, and Jeff Whitaker, all
of NOAA ESRL, provided access to special
upper-air reanalyses for March 1925. Reviewers
Kevin Goebbert, John Lewis, and Ernest Ostuno
provided useful advice for how to improve the
manuscript. We appreciate their efforts on our
behalf. We thank Roger Edwards and Amos
Magliocco, EJSSM editors, for their comments
and suggestions. Patrick Marsh, Univ. of
Oklahoma CIMMS/NSSL, helped the authors
identify other long-track tornadoes. J. J.
Gourley, NOAA NSSL, helped the authors
obtain some of the surface data used during the
project. Gary Grice, NWS retired, helped the
lead author document 1925 WB procedures.
Katie Hirschboeck of the University of Arizona
helped the lead author interact with the widely
dispersed team. She also read the draft
manuscript and provided comments and
suggestions. Steve Kahn of WGN-TV, Chicago,
steered the lead author to information regarding
A. J. Henry. National Science Foundation grants
ATM-0003869, ATM-0339519, ATM-0449753,
and AGS-0843269 funded portions of Matthew
Gilmore's efforts on this project and AGS-
0843269 helped fund data digitizing efforts by
Univ. of North Dakota students: Melissa
Becker, Jason Naylor, Marc Provencher, and
Justin Weber. The other seven authors received
no formal support and accomplished this project
on their own time, using personal resources.
The following people and/or organizations
helped the authors locate 1925 WB Forms:
Allen County Public Library (Ft. Wayne, IN)
Judy Bolton (Louisiana State Univ. at Baton
Rouge)
Chris Buonnano (NWS, Little Rock, AR)
John Distefano (NWS, retired)
Steve Doty (NCDC, retired)
Ken Falk (NWS, Shreveport, LA)
Stuart Foster (Kentucky Climate Center)
David Gaede (NWS, Springfield, MO)
Bob Graham (Jerome Library, Bowling Green
State Univ., OH)
Randy Gray (NWS, Pueblo, CO)
Pat Guinan (Missouri State Climatologist)
Steve Hodanish (NWS, Pueblo, CO)
Daniel Huckaby (NWS, Ft. Worth, TX)
Donald Hughes (NWS, Cincinnati, OH)
Logan Johnson (NWS, Indianapolis, IN)
Troy Kimmel (Univ. of Texas at Austin)
Mary Knapp (Kansas State Climatologist)
Louisiana State Univ. at Shreveport Library
Bill Marshall (Univ. of Kentucky at Lexington)
Jim Moore (St. Louis Univ., MO)
Nashville, TN, Public Library
Felix Navejar (NWS, Lake Charles, LA)
Dev Niyogi (Indiana State Climatologist)
Gregory Patrick (NWS, Ft. Worth, TX)
Peoria, IL, Public Library
Ron Przbylinski (NWS, St. Louis, MO)
Brian Raitz (Parkersburg & Wood County Public
Library, WV)
Bill Read (NWS, retired)
Marilyn Schuster (Atkins Library, Univ. of
North Carolina at Charlotte)
Patricia Sides (Willard Library, Evansville, IN)
Monica Smith (Cairo, IL, Public Library)
Univ. of Texas at San Antonio Library, Special
Collections
Paul Wolyn (NWS, Pueblo, CO)
Richard Wynne (NWS, Amarillo, TX)
Jon Zeitler (NWS, Austin/San Antonio, TX)
APPENDIX A
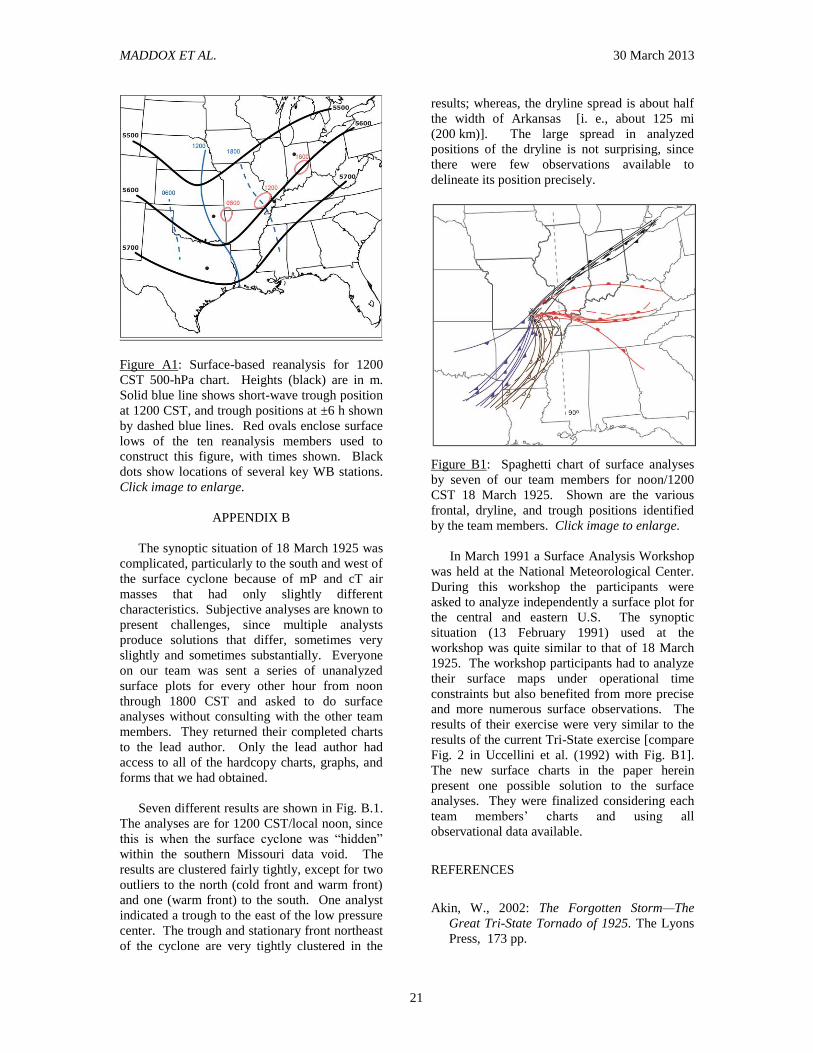
We have examined recent upper-air
reanalyses based upon only surface data
(Whitaker et al. 2004; Compo et al. 2006). A
surface-based, reanalysis 500-hPa chart (Fig.
A.1) indicates that the short-wave trough
associated with the Tri-State event remained a
fast-moving, open wave, with some degree of
negative tilt likely, during the period of interest.
Figure A.1 was constructed by choosing 10 of
100 reanalysis ensemble members (J. Whitaker
2006 personal communication) and averaging the
500-hPa height fields. The ten reanalyses were
chosen subjectively from the 100 members
because they had the most accurate positioning
and central pressure for the surface low at 1200
CST 18 March 1925. The reconstructed 500-hPa
charts for 18 March depict an evolution of the
large-scale setting that is in general agreement
with the discussions and hypotheses of this
paper.
Page 21
MADDOX ET AL. 30 March 2013
21
Figure A1: Surface-based reanalysis for 1200
CST 500-hPa chart. Heights (black) are in m.
Solid blue line shows short-wave trough position
at 1200 CST, and trough positions at ±6 h shown
by dashed blue lines. Red ovals enclose surface
lows of the ten reanalysis members used to
construct this figure, with times shown. Black
dots show locations of several key WB stations.
Click image to enlarge.
APPENDIX B
The synoptic situation of 18 March 1925 was
complicated, particularly to the south and west of
the surface cyclone because of mP and cT air
masses that had only slightly different
characteristics. Subjective analyses are known to
present challenges, since multiple analysts
produce solutions that differ, sometimes very
slightly and sometimes substantially. Everyone
on our team was sent a series of unanalyzed
surface plots for every other hour from noon
through 1800 CST and asked to do surface
analyses without consulting with the other team
members. They returned their completed charts
to the lead author. Only the lead author had
access to all of the hardcopy charts, graphs, and
forms that we had obtained.
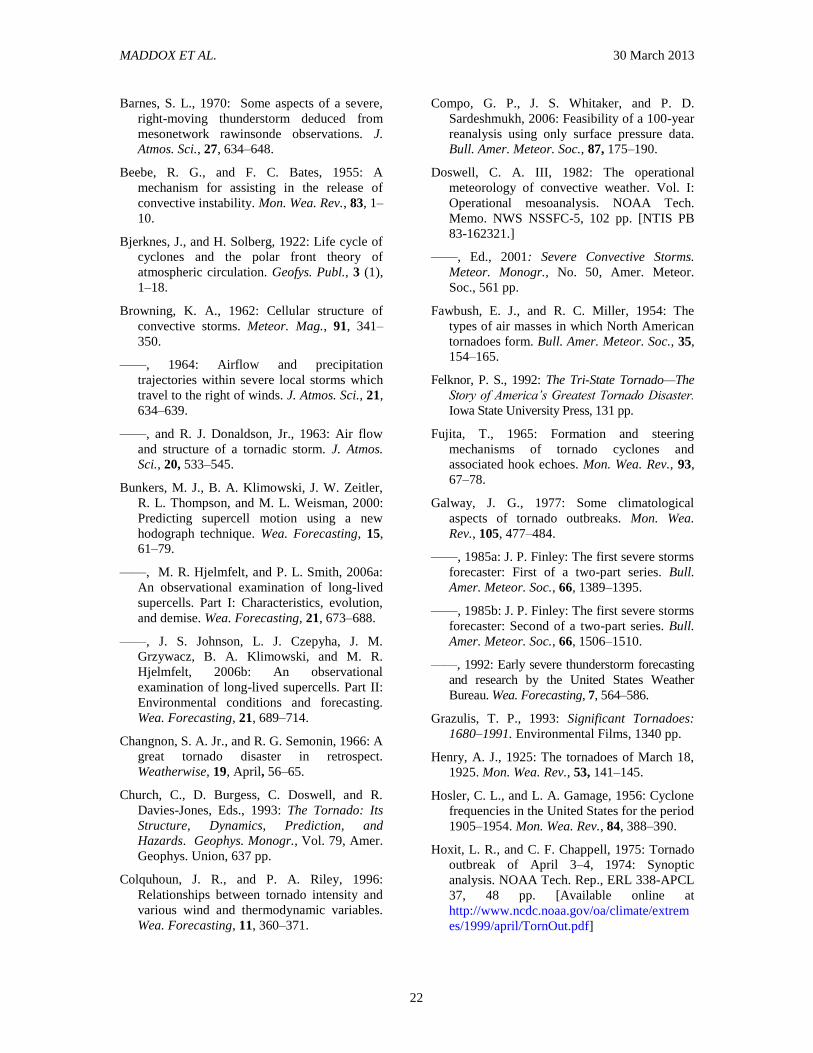
Seven different results are shown in Fig. B.1.
The analyses are for 1200 CST/local noon, since
this is when the surface cyclone was “hidden”
within the southern Missouri data void. The
results are clustered fairly tightly, except for two
outliers to the north (cold front and warm front)
and one (warm front) to the south. One analyst
indicated a trough to the east of the low pressure
center. The trough and stationary front northeast
of the cyclone are very tightly clustered in the
results; whereas, the dryline spread is about half
the width of Arkansas [i. e., about 125 mi
(200 km)]. The large spread in analyzed
positions of the dryline is not surprising, since
there were few observations available to
delineate its position precisely.
Figure B1: Spaghetti chart of surface analyses
by seven of our team members for noon/1200
CST 18 March 1925. Shown are the various
frontal, dryline, and trough positions identified
by the team members. Click image to enlarge.
In March 1991 a Surface Analysis Workshop
was held at the National Meteorological Center.
During this workshop the participants were
asked to analyze independently a surface plot for
the central and eastern U.S. The synoptic
situation (13 February 1991) used at the
workshop was quite similar to that of 18 March
1925. The workshop participants had to analyze
their surface maps under operational time
constraints but also benefited from more precise
and more numerous surface observations. The
results of their exercise were very similar to the
results of the current Tri-State exercise [compare
Fig. 2 in Uccellini et al. (1992) with Fig. B1].
The new surface charts in the paper herein
present one possible solution to the surface
analyses. They were finalized considering each
team members’ charts and using all
observational data available.
REFERENCES
Akin, W., 2002: The Forgotten Storm—The
Great Tri-State Tornado of 1925. The Lyons
Press, 173 pp.
Page 22
MADDOX ET AL. 30 March 2013
22
Barnes, S. L., 1970: Some aspects of a severe,
right-moving thunderstorm deduced from
mesonetwork rawinsonde observations. J.
Atmos. Sci., 27, 634–648.
Beebe, R. G., and F. C. Bates, 1955: A
mechanism for assisting in the release of
convective instability. Mon. Wea. Rev., 83, 1–
10.
Bjerknes, J., and H. Solberg, 1922: Life cycle of
cyclones and the polar front theory of
atmospheric circulation. Geofys. Publ., 3 (1),
1–18.
Browning, K. A., 1962: Cellular structure of
convective storms. Meteor. Mag., 91, 341–
350.
——, 1964: Airflow and precipitation
trajectories within severe local storms which
travel to the right of winds. J. Atmos. Sci., 21,
634–639.
——, and R. J. Donaldson, Jr., 1963: Air flow
and structure of a tornadic storm. J. Atmos.
Sci., 20, 533–545.
Bunkers, M. J., B. A. Klimowski, J. W. Zeitler,
R. L. Thompson, and M. L. Weisman, 2000:
Predicting supercell motion using a new
hodograph technique. Wea. Forecasting, 15,
61–79.
——, M. R. Hjelmfelt, and P. L. Smith, 2006a:
An observational examination of long-lived
supercells. Part I: Characteristics, evolution,
and demise. Wea. Forecasting, 21, 673–688.
——, J. S. Johnson, L. J. Czepyha, J. M.
Grzywacz, B. A. Klimowski, and M. R.
Hjelmfelt, 2006b: An observational
examination of long-lived supercells. Part II:
Environmental conditions and forecasting.
Wea. Forecasting, 21, 689–714.
Changnon, S. A. Jr., and R. G. Semonin, 1966: A
great tornado disaster in retrospect.
Weatherwise, 19, April, 56–65.
Church, C., D. Burgess, C. Doswell, and R.
Davies-Jones, Eds., 1993: The Tornado: Its
Structure, Dynamics, Prediction, and
Hazards. Geophys. Monogr., Vol. 79, Amer.
Geophys. Union, 637 pp.
Colquhoun, J. R., and P. A. Riley, 1996:
Relationships between tornado intensity and
various wind and thermodynamic variables.
Wea. Forecasting, 11, 360–371.
Compo, G. P., J. S. Whitaker, and P. D.
Sardeshmukh, 2006: Feasibility of a 100-year
reanalysis using only surface pressure data.
Bull. Amer. Meteor. Soc., 87, 175–190.
Doswell, C. A. III, 1982: The operational
meteorology of convective weather. Vol. I:
Operational mesoanalysis. NOAA Tech.
Memo. NWS NSSFC-5, 102 pp. [NTIS PB
83-162321.]
——, Ed., 2001: Severe Convective Storms.
Meteor. Monogr., No. 50, Amer. Meteor.
Soc., 561 pp.
Fawbush, E. J., and R. C. Miller, 1954: The
types of air masses in which North American
tornadoes form. Bull. Amer. Meteor. Soc., 35,
154–165.
Felknor, P. S., 1992: The Tri-State Tornado—The
Story of America’s Greatest Tornado Disaster.
Iowa State University Press, 131 pp.
Fujita, T., 1965: Formation and steering
mechanisms of tornado cyclones and
associated hook echoes. Mon. Wea. Rev., 93,
67–78.
Galway, J. G., 1977: Some climatological
aspects of tornado outbreaks. Mon. Wea.
Rev., 105, 477–484.
——, 1985a: J. P. Finley: The first severe storms
forecaster: First of a two-part series. Bull.
Amer. Meteor. Soc., 66, 1389–1395.
——, 1985b: J. P. Finley: The first severe storms
forecaster: Second of a two-part series. Bull.
Amer. Meteor. Soc., 66, 1506–1510.
——, 1992: Early severe thunderstorm forecasting
and research by the United States Weather
Bureau. Wea. Forecasting, 7, 564–586.
Grazulis, T. P., 1993: Significant Tornadoes:
1680–1991. Environmental Films, 1340 pp.
Henry, A. J., 1925: The tornadoes of March 18,
1925. Mon. Wea. Rev., 53, 141–145.
Hosler, C. L., and L. A. Gamage, 1956: Cyclone
frequencies in the United States for the period
1905–1954. Mon. Wea. Rev., 84, 388–390.
Hoxit, L. R., and C. F. Chappell, 1975: Tornado
outbreak of April 3–4, 1974: Synoptic
analysis. NOAA Tech. Rep., ERL 338-APCL
37, 48 pp. [Available online at
http://www.ncdc.noaa.gov/oa/climate/extrem
es/1999/april/TornOut.pdf]
Page 23
MADDOX ET AL. 30 March 2013
23
Johns, R. H., D. W. Burgess, C. A. Doswell III,
M. S. Gilmore, J. A. Hart, and S. F. Piltz,
2013: The 1925 Tri-State tornado damage
path and associated storm system.
Electronic J. Severe Storms Meteor., in press.
Lanicci, J. M., and T. T. Warner, 1991: A
synoptic climatology of the elevated mixed-
layer inversion over the southern Great Plains
in spring. Part I: Structure, dynamics, and
seasonal evolution. Wea. Forecasting, 6,
181–197.
Maddox, R. A., L. R. Hoxit, and C. F. Chappell,
1980: A study of tornadic thunderstorm
interactions with thermal boundaries. Mon.
Wea. Rev., 108, 322–336.
Markowski, P. M., E. N. Rasmussen, and J. M.
Straka, 1998: The occurrence of tornadoes in
supercells interacting with boundaries during
VORTEX-95. Wea. Forecasting, 13, 852–
859.
Marwitz, J. D., 1972: The structure and motion
of severe hailstorms. Part I: Supercell storms.
J. Appl. Meteor., 11, 166–179.
Miller, R. C., 1959: Tornado-producing synoptic
patterns. Bull. Amer. Meteor. Soc., 40, 465–
472.
——, 1967: Notes on analysis and severe-storm
forecasting procedures of the Military
Weather Warning Center. AWS Tech. Rep.
200, 94 pp. [Available online at:
http://www.dtic.mil/cgi-bin/GetTRDoc?AD=
0744042]
Moller, A. R., 2001: Severe local storms
forecasting. Severe Convective Storms,
Meteor. Monogr., No. 50, Amer. Meteor.
Soc., 433–480.
Namias, J., 1980: The early influence of the
Bergen School on synoptic meteorology in
the United States. Pure Appl. Geophys., 119,
492–500.
Naylor, J., and M. S. Gilmore, 2012:
Environmental factors influential to the
duration and intensity of tornadoes in
simulated supercells. Geophys. Res. Lett., 39,
L17802, doi:10.1029/2012GL053041.
Rasmussen, E. N., S. Richardson, J. M. Straka,
P. M. Markowski, and D. O. Blanchard,
2000: The association of significant
tornadoes with a baroclinic boundary on 2
June 1995. Mon. Wea. Rev., 128, 174–191.
Sanders, F., and C. A. Doswell III, 1995: A case
for detailed surface analysis. Bull. Amer.
Meteor. Soc., 76, 505–521.
Schaefer, J. T., 1974: The life cycle of the
dryline. J. Appl. Meteor., 13, 444–449.
Showalter, A. K., and J. R. Fulks, 1943:
Preliminary report on tornadoes. U.S.
Weather Bureau, 162 pp.
Uccellini, L. W., S. F. Corfidi, N. W. Junker, P.
J. Kocin, and D. A. Olson, 1992: Report on
the Surface Analysis Workshop held at the
National Meteorological Center 25–28 March
1991. Bull. Amer. Meteor. Soc., 73, 459–472.
U.S. Weather Bureau, 1944: Daily Synoptic
Series, Historical Weather Maps, Northern
Hemispheric Sea-Level, January 1899 to
June 1939. Cooperative project of the U.S.
Army, Air Force, and Weather Bureau
Statistics Division, 41 Vols.
——, 1965: Report of Palm Sunday tornadoes of
1965, 64 pp. [Available online at
http://www.nws.noaa.gov/os/assessments/pdf
s/palmsunday65.pdf.]
Whitaker, J. S., G. P. Compo, X. Wei, and T. M.
Hamill, 2004: Reanalysis without
radiosondes using ensemble data
assimilation. Mon. Wea. Rev., 132, 1190–
1200.
Whittaker, L. M., and L. H. Horn, 1981:
Geographical and seasonal distribution of
North American cyclogenesis. Mon. Wea.
Rev., 109, 2312–2322.
Page 24
MADDOX ET AL. 30 March 2013
24
REVIEWER COMMENTS
[Authors’ responses in blue italics.]
REVIEWER A (Ernest J. Ostuno):
Initial Review:
Recommendation: Accept with minor revisions.
Substantive comments: This is a well-written paper and there is little in the way of substantive changes
that I feel need to be made to what is already here. I do believe that a few more things could be added to
enhance the text and illustrations, which I describe below.
1 - I feel the main question to be answered is why this tornado remains unique in terms of path length and
intensity. The paper answers this by stating:
“There appear to be no outstanding aspects of the meteorological setting that would explain the extreme
character of the Tri-State tornado.”
Then goes on to say:
“As the supercell and dryline moved rapidly eastward, the northward movement of the warm front kept the
tornadic supercell within a very favorable storm environment for several hours. Apparently, this consistent,
time and space concatenation of the supercell, the warm front, and the dryline for more than three hours
was extremely unusual.”
We have done the following to correct this inconsistency—the Abstract and the Summary have been
rewritten to state that there were no singular features or synoptic aspects apparent for the Tri-State event.
We have emphasized the time and space concatenation of important features. We have also emphasized the
likelihood that the Tri-State supercell remained isolated from other storms during its life.
2 - I would like to see at least a brief discussion added about whether similar synoptic conditions were
present in other long track tornadoes or tornado families, such as the 9 April 1947 Woodward tornado
family and the 5 February 2008 long track tornado in Arkansas. Were there any analogues to this event in
terms of a long track destructive tornado that evolved in a similar way?
We have examined a number of events that produced significant tornadoes and/or long-track tornadoes.
These have been from the 1980s and later, since basic documentation was relatively easy to find. Some
events produced long-track tornadoes within the warm sector while other events produced supercells
moving along warm fronts, but with a series of tornadoes. We have found no events that are very similar,
in all aspects, to the Tri-State tornado event. A short subsection has been added to the paper describing
the extreme rarity of long-track tornadoes and several of the other events we considered.
3 - It would be helpful to have an illustration showing the path of the tornado and surface low during the
course of this event. Ideally, I would like to see an animated sequence showing the positions of the low
and tornado in one or two hour increments along with their path tracks overlaid on Fig. 12.
We have added a new figure that shows the continuity of selected surface features from 0700–1900 CST.
The approximate position of the tornado and its parent supercell are also shown.
[Minor comments omitted...]
Second Review:
Recommendation: Accept with minor revisions.
Page 25
MADDOX ET AL. 30 March 2013
25
Substantive comments: The re-organization of the paper looks good, although I thought the first draft
flowed smoothly as it was.
All the modifications have sufficiently addressed the first draft concerns I had. I appreciate the inclusion of
Fig. 12a since this really helps illustrate the location of the supercell/tornado with respect to the track of the
surface low and positions/evolution of the surface features. Section 5c briefly describes some other long-
track tornado events. The final sentence is:
"The only common feature of the Tri-State tornado and the events examined was that the hodographs
indicated very strong winds aloft."
I would only ask if it were possible to quantify how strong the winds aloft were for the 1925 event and
compare them to winds aloft in the vicinity of the long-track tornadoes in the events mentioned (28 Mar
1984, 29 Mar 1998, 24 Apr 2010, 27 Apr 2011).
It is important to note that there were only very limited observational data available for the Tri-State event
from aloft. The hodographs we presented for the event were estimates developed subjectively. Comparing
Fig. 16 with modern, observed hodographs would not be a direct comparison. We prefer not to use the
Bunkers et al. technique to develop subjective estimates of hodographs for these modern events, since the
purpose of the added paragraph was to point out that we had found no analogs for the Tri-State synoptic
setting and its evolution in time.
In response to Reviewer A’s question we have done the following: In Section 5e—Similar events—we have
deleted the final sentence (“The only common feature of the Tri-State…”) and moved the sentence (“None
of these events could be considered an analog to the Tri-State event.”) to the end of the section.
REVIEWER B (John M. Lewis)
Recommendation: Accept.
Overview: This contribution represents a supreme effort to understand the mechanisms that produced the
infamous long-tracked tri-state (Missouri, Illinois, Indiana) tornado of 1925. Eight severe-storm
meteorologists with a wealth of experience constitute the team of authors. The study is commendable for
its access and interpretation of surface data and upper-air observations (from kite stations). The paper is
most appropriate for publication in Electronic Journal of Severe Storms Meteorology (EJSSM). Comments
and suggestions are basically aimed at: 1) re-organization issues, 2) pedagogical issues—summarizing
limited knowledge about tornadoes in 1925 compared to the current age, and 3) guidance to the weather
forecaster.
Comments and Suggestions:
1. Reorganization issues/pedagogy
The Introduction includes significant discussion of earlier results from Henry (1925) and Changnon and
Semonin (1966). It would seem appropriate to have a concise Introduction where re-examination of the tri-
state tornado is justified based on incomplete earlier work and the continued interest to understand long-
tracked tornadoes. A second section could then summarize results from the two papers mentioned above
including mention of state-of-knowledge about tornadoes in 1925 (citing information in Joseph Galway’s
seminal papers on the history of severe storm forecasting including the review of J. P. Finley’s work at the
end of the 19th century).
We have done as suggested above. The Introduction was rewritten as two short paragraphs. Section 2 now
starts with some background on the “state-of-art” knowledge back in 1925. Galway’s three papers have
Page 26
MADDOX ET AL. 30 March 2013
26
been cited, and some information regarding Finley and tornado forecasting in the Signal Corps has been
included.
Although the paper includes two appendices, I believe much of the material in section 2 (Observations and
Methodology) could be relegated to an appendix. This section threw me off my quest to keep track of the
paper’s main theme. I think Appendix B could be included in the main body of the paper as a subsection in
“New Analysis”. This was one of the most interesting parts of the paper for me and it reminded me of the
Fred Sanders/Bob Burpee contribution (Sanders and Burpee, 1968, JAM) where five teams of students in
the synoptic meteorology class were required to produce initial fields for barotropic track forecasts of
Hurricane Donna (September 1960). It was the outlier forecast, not the consensus forecast, which most-
closely matched the actual track!
This suggestion is interesting, since early versions of the paper were structured just as suggested. We
found that the information in Section 2 was not as effective when it was set off in an appendix. The
information in this section is critical if synoptic meteorologists and forecasters are to follow what we’ve
had to do because of the much different observing procedures used in 1925. Indeed, we feel that our
unraveling of the observing procedures and figuring out how best to plot and analyze the data were
important accomplishments during this lengthy study. We also ended up deciding that the analysis exercise
was not a good “fit” when it was part of the body of the paper.
2. Pedagogical issues
With a little effort, this contribution can serve as a stimulating article for the novice as well as the
experienced meteorologist. To serve the novice or meteorologist outside the severe storm community, it
would be valuable to review our current state of knowledge regarding tornadoes before discussion in “New
Analyses” and “Upper Air” sections. Some of this information is scattered throughout the paper, but I
think it more valuable to primarily include at a single place. For example, characteristics of a supercell and
the crucial importance of helicity (and the associated display on a hodograph) could be included in such a
summary.
We certainly understand what the reviewer is suggesting here; however, it leads to several dilemmas. First
we have written the paper essentially for the primary readership of the EJSSM, i.e., the severe storm
research and forecasting community. Second, the paper is already quite long and adding background and
review section(s) would make the paper far too lengthy. What we have done instead is to add references to
monographs that would provide the interested reader access to important background information on
tornadoes and supercells. Additionally, several of our authors are planning, or already working on,
additional articles or books for the broader community.
3. Guidance
With the great effort that has gone into this study and with the team’s knowledge of earlier work, the
readers would benefit from an itemization of key “signatures” in meteorological fields that portend long-
tracked tornadoes. Of course, this also allows the authors to highlight the weaknesses in our current
understanding of synoptic/mesoscale circulations and linkages to the supercell and the tornado.
This suggestion essentially recommends new research. Long-track tornadoes are extremely rare and “key
signatures that portend long-track tornadoes” are not known. We have added information about the rarity
of such events and have emphasized more the information cited about the character of long-track
supercells.
Second Review:
Recommendation: Accept.
Substantive comments: The paper meets with my approval. My suggestion for re-organization was one
that would fit my approach to the study but it's certainly not the only way to handle it.
Page 27
MADDOX ET AL. 30 March 2013
27
REVIEWER C (Kevin Goebbert):
Initial Review:
Reviewer recommendation: Accept.
General Comments: This paper re-analyzes the synoptic weather pattern surrounding the 18 March 1925
Tri-State tornado event. They accomplish this through the integration of all known available data from the
remaining records and do a thorough job presenting a new coherent and justified surface synoptic pattern.
Even with the limitations in available surface and upper-air data the authors go to great lengths to indicate
that their analyses are consistent in both space and time. This paper also rectifies a misconception about
this specific case that has persisted for over 40 years. The new analysis is presented clearly and is well
justified. This paper is an excellent contribution for this journal and will be widely read by those who are
interested in famous tornado events.
Review Criteria Comments:
Based on the review criteria the authors do a fine job of referencing the appropriate work, especially with
the sources of old Weather Bureau analyses and the state of the bureau in 1925. The scientific arguments
that they make in the paper are well justified and their procedures are sufficiently detailed to allow others to
independently verify their results.
The paper has high quality figures that are easy to read and link to larger versions. The paper is well
written, following a clear and logical order. Their explanations and descriptions are clear and
straightforward while addressing the important issues of the limitations of the available data.
Thank you, we appreciate your comments.
[Minor comments omitted…]
Second Review:
Recommendation: Accept.
General Comments: Finally had a chance to read through the manuscript. Looks good to me. No further
comments and I'm excited to see this paper published. I think there will be great interest from many people
for this work.