22
Meteorological data in MRT Guadalupe Station IGNACIO, RICHELLE ANGELIKA E. 3Bio2 January 1, 2009- December 12, 2009
| Date post: | 09-Jul-2016 |
| Category: |
Documents |
| Upload: | richelle-ignacio |
| View: | 27 times |
| Download: | 4 times |
Meteorological data in MRT Guadalupe Station
IGNACIO, RICHELLE ANGELIKA E. 3Bio2
January 1, 2009- December 12, 2009

IntroductionMeteorology is the science that deals with the
atmosphere and its phenomena. Major area's of research concern the weather, weather forecasting and atmospheric composition.
Through meteorological variables, specific weather conditions are derived in a certain location at a specific time.
In this presentation, meteorological data in MRT Guadalupe Station from January 1, 2009 to December 12, 2009 are shown and interpreted

Definition of terms:Temperature is a measure of the average heat
or thermal energy of the particles in a substance. Relative humidity is the amount of moisture in
the air compared to what the air can "hold" at that temperature.
Dew point is the temperature at which air is saturated with water vapor, which is the gaseous state of water
Wind speed is the speed of the weather related air movement from one place to the next.
Heat index, also known as the apparent temperature, is what the temperature feels like to the human body when relative humidity is combined with the air temperature.

Definition of terms:Atmospheric pressure is the pressure exerted
by the weight of air in the atmosphere of Earth.Rainfall rate is a measure of the intensity of
rainfall.Solar radiation is the radiation, or energy we
get from the sun.Solar energy is, simply, energy provided by the
sun.UV Index is a forecast of the amount of skin
damaging UV radiation expected to reach the earth's surface at the time when the sun is highest in the sky (around midday).

Results and Discussion
The following data shows the averages of each meteorological variable from January 1, 2009 to Dec. 12, 2009
Table 1. Tabular Data of the Averages of each Meteorological Variable

Results & Discussion
Table 2. Tabular Data of the Averages of Meteorological Variables for January 2009

Results & Discussion
Table 3. Tabular Data of the Averages of Meteorological Variables for February 2009

Results & Discussion
Table 4. Tabular Data of the Averages of Meteorological Variables for March 2009

Results & Discussion
Table 5. Tabular Data of the Averages of Meteorological Variables for April 2009
Results & Discussion
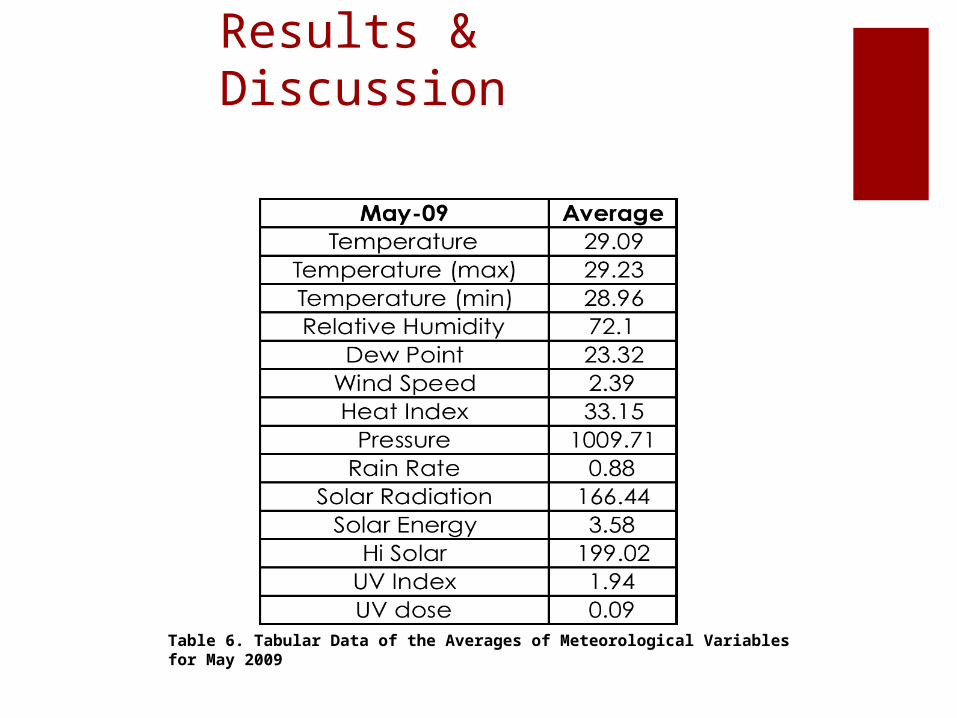
Table 6. Tabular Data of the Averages of Meteorological Variables for May 2009

Results & Discussion
Table 7. Tabular Data of the Averages of Meteorological Variables for June 2009
Results & Discussion
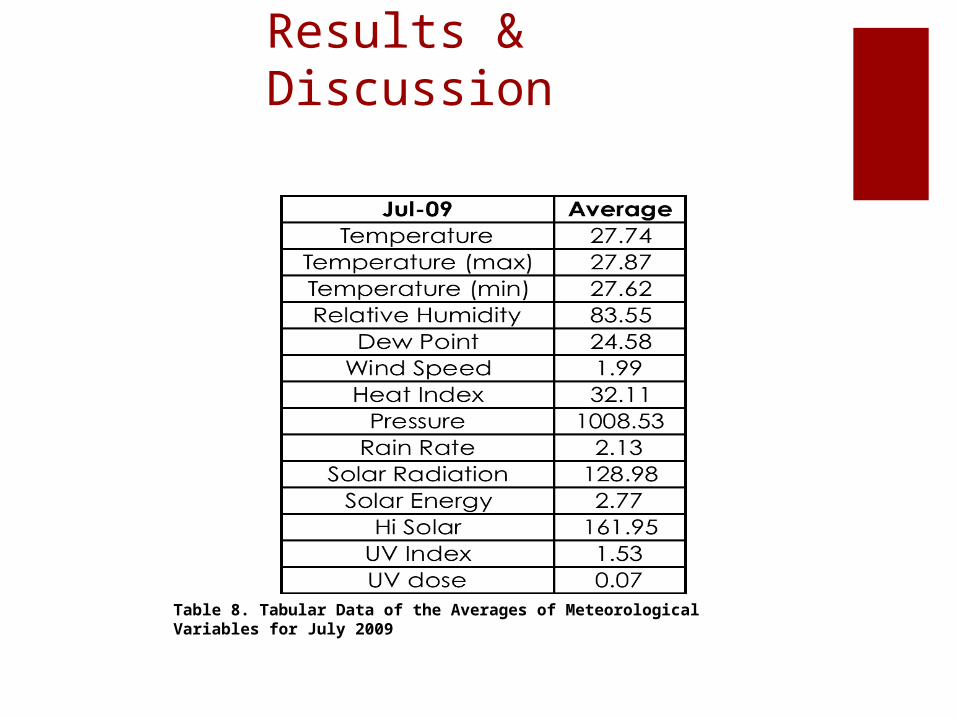
Table 8. Tabular Data of the Averages of Meteorological Variables for July 2009

Results & Discussion
Table 9. Tabular Data of the Averages of Meteorological Variables for August 2009

Results and Discussion
From the preceding tables from January to December 2009 some of the conclusions we can infer are:It is coldest during the month of January and hottest during the month of May.Also, rain rate has been lowest during January and highest during August

Results and Discussion
Figure 1. Line Representation of the Monthly Temperatures at 12:00PM
Results and Discussion
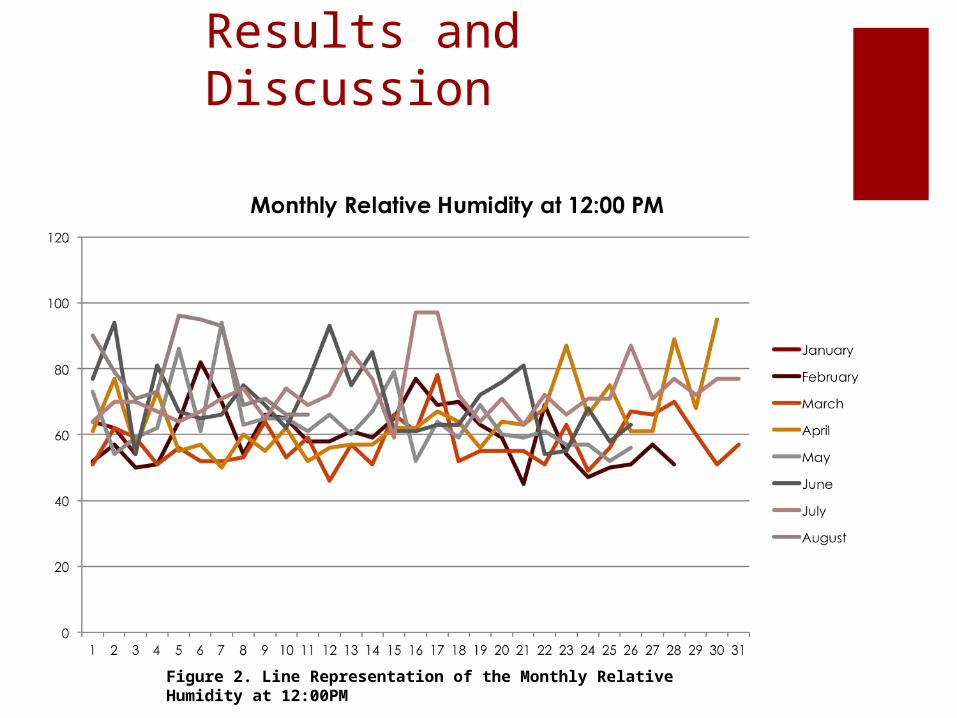
Figure 2. Line Representation of the Monthly Relative Humidity at 12:00PM

Results and Discussion
Figure 3. Line Representation of the Monthly Dew Point at 12:00PM

Results and Discussion
Figure 4. Line Representation of the Monthly Solar Radiation at 12:00PM

Results and Discussion
From the pie chart, we can deduce that: Majority of the time, east is the wind direction being favored with 33%.The least favored wind directions are approximately north, north east, and south with 1%.
Figure 5. Pie Representation of the Wind Direction

Results and Discussion
From the column graph, we can deduce that:August is the month wherein the rain rate is highestMarch is the month wherein the rain rate is lowest
Figure 6. Column Representation of the Monthly Rain Rate

SUMMARY
The meteorological data in MRT Guadalupe Station from January 1, 2009 to December 12, 2009 showed fluctuations in each meteorological variable.
Evidently, during August, the rain rate is highest.The wind favors the east direction most of the time.The month with the highest temperature is March.

References: http://www.meteo-technology.com/metvar.htm
coolcosmos.ipac.caltech.edu/cosmic_classroom/light.../temperature.html
hyperphysics.phy-astr.gsu.edu/hbase/kinetic/relhum.html
www.livescience.com/43269-what-is-dew-point.html
https://simple.wikipedia.org/wiki/Wind_speed
http://www.srh.noaa.gov/ama/?n=heatindex
https://en.wikipedia.org/wiki/Atmospheric_pressure
http://disc.gsfc.nasa.gov/hydrology/data-holdings/parameters/rainfall_rate.shtml
www.mymobilebay.com/stationdata/whatissolarrad.htm
http://www.greenoughsolarfarm.com.au/solar-energy/what-solar-energy
www.weatheronline.co.uk/reports/wxfacts/The-UV-Index.htm


