AL)-A156 t34 METEOROLOGICAL DATA FROM THE OPTOMA IOCEAN PREDICTIOW IN THROUGH OBSERVATION..I NAVAL POSTGRADUATE SCHOOL MONTEREY CA U C COLTON ET AL. MAY 85 NPS'SS-8-0i7 IfNC A IFIFFn F 1/ 2 I lllllllllllll IIIIIIIIrIIuu
Transcript
AL)-A156 t34 METEOROLOGICAL DATA FROM THE OPTOMA IOCEAN PREDICTIOW INTHROUGH OBSERVATION..I NAVAL POSTGRADUATE SCHOOLMONTEREY CA U C COLTON ET AL. MAY 85 NPS'SS-8-0i7
IfNC A IFIFFn F 1/ 2 I
lllllllllllll
IIIIIIIIrIIuu
|1111I5
2.2
La lli-wo
JIID JJfl Izl III1.611111j.25 1'.__4'
MICROCOPY RESOLUTION TEST CHARTNATIONAL BUREAU OF STANDARDS- %63 A
'4
NPS-68-85-017
NAVAL POSTGRADUATE SCHOOLMonterey, California
(V)
W) DTICELECTE
METEOROLOGICAL DATA FROM THE OPTOMA PROGRAMOPTOMA1I, Leg DII
30 June - 10 July, 1984
by
Marie C. ColtonChristopher N.K. Mooers
May 1985
Approved for public release; distribution unlimited.
Prepared for:Office of Naval ResearchEnvironmental Sciences Directorate .(Code 420)
Arlington, VA 22217
5 06 10 1 32
NAVAL POSTGRADUATE SCHOOL
Rear Admiral R. H. Shuinaker David A. SchradySuperintendent Provost
This report is for the research project Ocean PredictionThrough Observations, Modeling, and Analysis sponsored by thePhysical Oceanography Program of the Office of Naval Researchunder Program Element 6J1153N. Reproduction of any or all ofthis report Is authorized.
This report was prepared by:
L Aclcession ?or -- A-(
P)TIC TAB Marie C. -olTonVU:,annoimeod 03 Oceanographer/EngineerJust1fict~ic Department of Oceanography
Availability Codes . /LAvail and/or _________
Christopher N. oe rsProfessor and ChairmanDepartment of Oceanography
Revie by: Released by:
Christopher N. K. Mooers, Chairman John N. EfyerDepartment of Oceanography Dean of Science and Engineering
UNCLASSIFIEDSECuRITY CLASSIFICATION OF THIS PAGE fWhon Doe Entered)
REPORT DOCUMENTATION PAGE READ INSTRUCTIONSBEFORE COMPLETING FORM
4. TITLE[ (and Subtlle) S. TYPE OF REPORT A PERIOD COVERED
METEOROLOGICAL DATA FROM THE OPTOMA PROGRAM Report for October 1982OPTOMAll, Leg DII to May 1985.30 June - 10 July 1984 5 PERFORMING ORG. REPORT NUMBER
7. AUTHOR(s) 6, CONTRACT OR GRANT NUMBER(Ie)
Marie C. ColtonChristopher N.K. Mooers
S. PERFORMING ORGANIZATION NAME AND ADDRESS I0. PROGRAM ELEMENT. PROJECT. TASK
AREA & WORK UNIT NUMBERSNaval Postgraduate SchoolDepartment of Oceanography 611 53NMonterey, CA 93943 NOOO148R24051
I. CONTROLLING OFFICE NAME AND ADDRESS 12. REPORT DATEMay 1985
Office of Naval Research %3. NUMBER OF PAGESArlington, VA 22217 72
14. MONITORING AGENCY NAME 6 AODRESS(II different from Controllitg OIffice) IS. SECURITY CLASS. (of thie report)
Unclassifed
S. DECLASSIFICATION, DOWNGRADINGSCHEDULE
IS. DISTRIBUTION STATEMENT (of this Report)
Approved for public release; distribution unlimited.
17. DiSTRiBUTiON STATEMENT (of the abstract entered n Block 20, II dilflerent frogn Report)
II. SUPPLEMENTARY NOTES
IS., KEY WORDS (CelrtJwee on reverse aide II necentv and identify by block snber)
/Radiosonde .U~ta ; ,,Oceanic Mixed Layer)',Coastal .Meteorology', California Current .System . -
Air/Sea InteractionAtmospheric Boundary Layer, -
20. ABSTRACT (Coefttume an rices, ite Ift ntceseay md Idetify by block number)
--- " This report presents the meteorological data acquired by twenty-sixradiosondes launched during the hydrographic cruise OPTOMAII, Leg DII (30 Juneto 10 July, 1984). To compare the prevailing atmospheric and oceanic conditionsthe radiosonde potential temperature and specific humidity profiles are plottedwith nearly coincident XBT temperature profiles. Also included are: 1) timeseries plots of hourly dry-btilb and wet-bulb temperatures and hourly windvelocities, 2) an AVHRR image, and 3) National Weather Service surface pressureanalyses for the cruise period. rP kV,, 4rf j ,
DD I )ARTS 1473 EITION oi I NOV 6 is osoL iE UNCLASSIFIEDI 'M 0102. LF. 014. 6601 SECURITY CLASSIFICATION OF THIS PAGE (*Wen Dae Entereg)
Meteorological Data from the OPTOMA Program:
OPTOMA11 Leg DII30 June - 10 July, 1984
by
Marie C. Colton
Christopher N. K. Mooers
Chief Scientist:
C. N. K. Mooers
The OPTOMA Program is a joint program of
Department of Oceanography Center for Earth and Planetary PhysicsNaval Postgraduate School Harvard University
Monterey, CA 93943. Cambridge, MA 02138.
TABLE OF CONTENTS
PAGE
LIST OF FIGURES ii
LIST OF TABLES iWl
INTRODUCTION 1
DATA ACQUISITION 3
DATA PROCESSING 4
DATA PRESENTATION 4
ACKNOWLEDGEMENTS 46
APPENDIX A: NWS SURFACE PRESSURE ANALYSES 47
INITIAL DISTRIBUTION LIST 68
I
LIST OF FIGURES
Figure No. Caption Page
1. The NOCAL and CENCAL subdomains of the OPTOMA 2Program. Isobaths are shown in meters.
2. Cruise track for OPTOMAlI, Leg DII. 7The second traversal along the interiordiagonal lines is shown as a broken line.
3. Radiosonde positions for OPTOMAll, Leg DII. 8
4. Radiosonde station numbers for OPTOMAll, Leg DII. 9
5 XBT/CTD station numbers for OPTOMAll, Leg DII. 11
6(a)-(m). Potential temperature and specific humidity 16profiles to 3000m from the radiosondes.The votential temperature is shown in degreesCelsius (OPTOMAli, DII).
7. Profile of mean potential temperature T(z) with 29+ and - the standard deviation (OPTOMA11,DII).
8(a)-(l). Radiosonde profiles to 750m (800m) and 30nearly coincident XBT temperature profilesto 500m (750m) to show the air/sea interfaceand boundary layers (OPTOMAll, DII).
9. Time-series of hourly dry-bulb and wet-bulb 42temperatures (OPTOMAll,DII).
10. Time-series of hourly true wind speed with 43true wind velocity sticks below the curve toindicate wind direction. The time axis isannotated with the radiosonde station numbersat their approximate launch times (OPTOMAII, DII).
11. NOAA-7 AVHRR infrared image from 7 July 84. 44
12. NOCAL domain superposed on the salient 45features of the infrared image.
ii
LIST OF TABLES
Table No. Caption Page
I.Specifications and sensor accuracies of the 6AIR, Inc. radiosonde system.
Ii. Radiosonde station listing for OPTOMAll, Leg DII. 10
III. XBT/CTD station listing for OPTOMAll, Leg DII. 12
INTRODUCTION
/The OPTOMA (Ocean Prediction Through Observations, Modeling and
Analysis) Progran a joint NPS/Harvard program sponsored by ONR> seeks to
understand the mesoscale (front, eddies, and jets) variability and dynamics of
the California Current System and to determine the scientific limits to practical
mesoscale ocean forecasting. \ To help carry out the aims of this project, a
series of cruises and flights his been planned in two subdomains, NOCAL and
CENCAL, shown in Figure 1. This report summarizes the meteorological data
acquired during OPTOMAll, cruise Leg DII (described below), especially the
atmospheric profiles from radiosondes which were recorded using a new AIR,
Inc. data acquisition system.
The six cruises and one AXBT flight comprising OPTOMAll were
undertaken, during June, July, and August 1984, in the R/V ACANIA (Legs
AI, All, AIII), the USNS DE STEIGUER (Legs DI, DII, DIII) and a Navy
Reserve Patrol Wing P3A aircraft (Leg P). Hydrographic data were acquired off
the coast o' California in an area which covered and extended the NOCAL
region. The sampling was concentrated in a central 150 km square domain
centered about 190 km off the coast between Pt. Reyes and Pt. Arena in the
NOCAL domain.
Leg Al was carried out from 5 to '5 June, Leg All from 21 June to 30
June and Leg AIN from i to 13 July. These three legs sampled the central
domain with additional transects to and from the domain. Leg DI was carried
out from 23 to 30 Junn, Leg DII from 30 June to 10 July, and DIII from 27
July to 5 August. Leg DI sampled areas to the north, south and inshore of
the central domain. Leg DII sampled the central domain area with additional
legs to the west and south of the area, as shown in Figure 2. Leg DIII,
hr~ eoo" 0e'jn j* Ic sp C iat.rs are lor Ir P ~ s omit ,en urrO *r ma,. AIR rorurrd Sdronr c a t-ela~ eron-er' It hcihoaes al s-rCPS 0 er,' 10 a j :a COh ibae"rrea lat a
SENSORSTemperature (Wet and Dry Bulb) Humidity (From psychrometic equation)Range +e b 0 Cto - 70'C Range: 3%to 100%Precision: 0 5'C tor + 40'C toa 40'C Precision: 3% tor 00 C to 50'C
(I, P_ a, a- ar'0 racC I2%R.,ra :,,,a,.- I It I d"QC IrUao 0'e
1 0 C for +50' C o - 70' C 5%tfor - 10'C toO0*C
Thermistor Match: 0 V0 Cfor +±35 C to - 20'CI or-2^Ct-1O'Pressure (Absolute Barometric)
Resolution: 0010 - Range: 1050 to 250 mb
Total System RMS Noise 0 04' C ,~rs r,Io. Precisin:r3 c
Noise Equivalent: o'i reaC Resolution: 0 1mbTemperature Compensation: Bead Inermistor with
Response Time: Dry Bulb 3sec aulomaiic correction computedWet Bulb 12 sec b AIR ground station
Figure 4: Radiosonde station numbers for OPTOMAl, Leg DII.
8
41N
Eureka
* . Cape Mendocino
39N ............ Pt. Arena
3 7 N. ... . .. . . .
.. ... . . . . .. .. . . . . .. . .. .
Monterey
Pt. Sur
Sonde: .1 Morro
35N128W 126W 124W 122W 120W
Figure 3 Radiosonde positions for OPTOMAII, Leg DtI.
7
41N
* * Eureka
* * Cope Mendocino
3 ......9............ ..
35N:39N W .... W ... 2.....W. ... 22W... PI20Wen
FGur 2 hVrietakfrOTMlLgDI hseodtrvrd o h ntro sm-igoasiHsonaa. brke line..
6
the radiosondes are shown in Figures 6 (a)-(m). The positions of these
profiles may be found by reference to the station number plot, Figure 4. The
mean potential temperature profile from the radiosondes is shown in Figure 7.
To compare the atmospheric profiles to the oceanic profiles, the radiosondes
to 700m or 800m and the XBT profiles to 500m or 750m, depending on the
depth rating of the XBT, are plotted together in Figures 8 (a)-(1). The
potential temperature is shown In degrees Celsius to allow the two temperature
and humidity profiles to be plotted on the same abscissa. The specific humidity
is in cgs units.
The hourly dry-bulb and wet-bulb temperatures plotted for the period 1 to
10 July are shown in Figure 9. A time series of the hourly true wind speed
is shown in Figure 10, with true wind velocity below the curve to indicate
direction. The directed segments all originate on the abscissa and they all
point in the direction to which the wind is blowing.
The data presentation section concludes with a reproduction of a NOAA-7
AVHRR infrared image obtained on 7 July 84 (Figure 11), and a tracing which
shows the superposition of the NOCAL domain on the salient features of the
infrared image (Figure 12). The image shows the cool, offshore jet which was
present in the NOCAL domain for the duration of OPTOMAll, Leg DII.
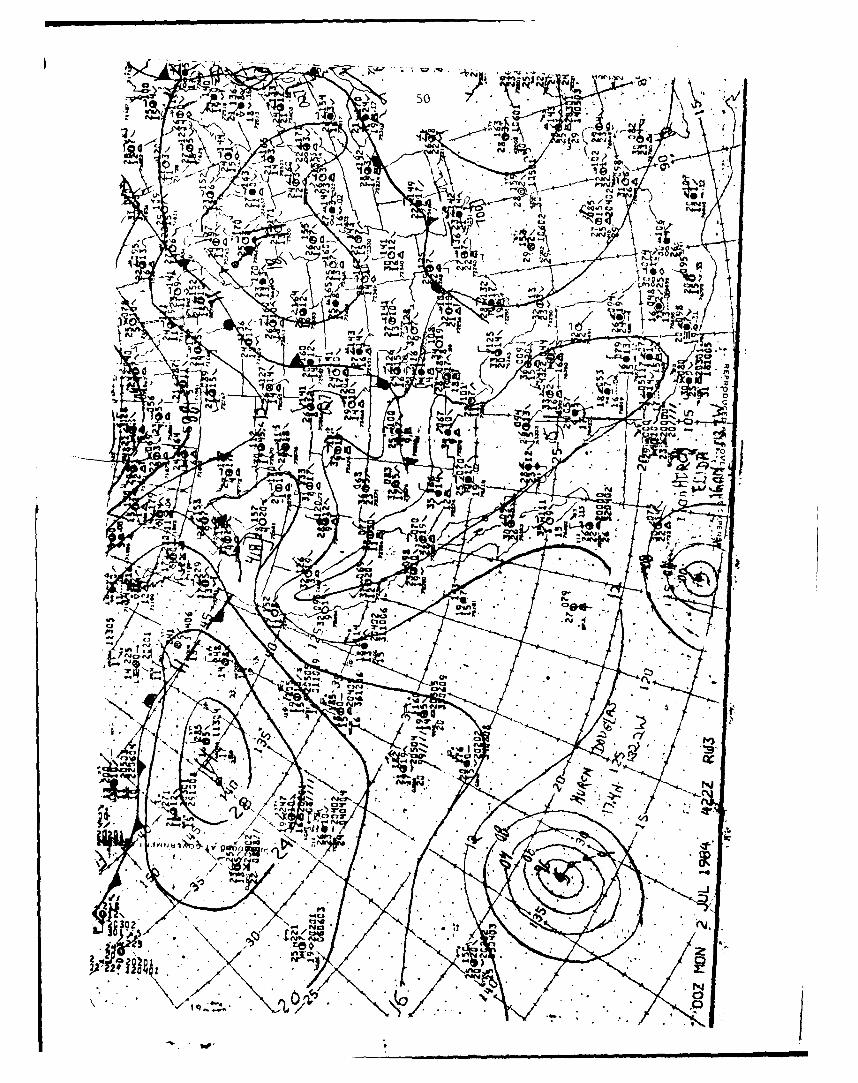
National Weather Service surface pressure analyses at synoptic times OOOOZ
and 1200Z for the period 1 to 10 July 84 are provided in Appendix A.
20
an 0
anIn
N 0
0)0
in 0
0
NN
o 0 0
N -N
(w) Mumjy
21
NN
0
d 0 -01 o
oO
0-
(W) Naiil
" " ._ .. ... o..
/.'a-J
*1
(I)) / n2Oa
o0 0 0 10 .o o 0o 0 0 o 0 0
N'7 N - -"
(w) 3anxlu-Van 0U,
22
an
Ul C
L&JJ
Lain
o 0 0 0 0 0 0 0 0o 0 0 0 0 0 0 0
OR d 0 w f t
(W) 30nijj~
0
moo
I Li
L&J I-0(/)Q
00
0a 0 0 0 0 0eq o to N c
NM 3 N - -
23
0
CL
ui
(00
0 0
0 0 0 a 0 0 0 0 0 C =0 0 0 0 0 0 0 0
()0
o 0-
00
II
0 I ' I , 0
0 0 0 0 0 0 0 0 0
S Go 0 0 0 0 0 0
e4 0 (n '
(w 3ajnjjj (-
24
Sn
eq 0
0)0
0
a-
L o~ , -, !
0 0 0 0 0 0. 0 0 00 0 0 0 0 0 0 004 co0 C4 G
04.(w) 3(Inil17v b
Moo
CL o 0
0) a
V(W Kum~
-J 0
0 I . I I I 0
0 0 0 0 0 0 0 0 0o 0 0 0 0 0 0 0N 60 It 0 (0 N @0 It
(w) cianizv
25
U,)
0(.4
0
0) -0
7 C
C44
0 10
o o 0 0o 0o 0 0 0
(W) aniiv
Ul)
0
CL 0CL
0 0 00Li 0 00
N
(W) 3aniiiiv
26
0
0)04
0 0 IV
L&J
N 0-
N7
o 0 0 0 0 0 0 0 00 0 0 0 0 0 0 004 00 c
NLU 3ciN - i
27
0
U,)
N
L~LO
O~Ln 0-
.4..4
a-- u,. Jan
0 00 0 0 0 0 0 0 0 000 0 0 0 0 0 0N* co 0 c0 V .s
0)
U)~~~~~~~~ V__ _ _ _ _ _ _ _ _ _ _ _ _ _ _
In
0- 0
C'4
in
0)0
0~~ 0 00
W) . ___NC
(W) 3(niiIn
28
Snn 0
- nCL
(.44
0)0
Mo u
L&JL
0~ Ln
Lgi 0
0 0 0 00 0 0 0 0o o 0 0 0 0 0N 0 0 to co V
N
(W) 0oim
29
7200
6400
5600
I I
4800
o I,
I I
4000I I
I I
I I
3200 ,
I I
I I/ ,
/ I
2400
1600 '/ /
800 " ,
0280 300 320 340
POT TEMP (deg K)
Figure 7 Profile of mean potential temperature
with + and - the standard deviation (OPTOMAII, DII).
30
-. -
anainw
00
0o 0 J
a'4 0 C)r
I') 4-)
UZ4
C Z
.X OD a) a
0-
00
(w aniiiiv dO Hld3O -
C-~ r
0 a
o 0
aD 0
*l 00 -
a') 0
ob~ r4
so 4N V- vf 1.
3aniinvr- Hl~
31
UgF4h
oo N
Go 40- F - O 0
InI
00
o >' 0
010
0 0
o 04 V
(w3aniiiv do Hid3O
. . .. . . . .. . . .. .. '...
32
N C4
0
aV 00
N 0
In in
so v 4
0 I
(wU) 3anmhiY8 0 Hld3O
33
co 0-
(00
00 0 00 "
40 0-co
co _
a' 40
00
o00 0 0 0 0o0 0 0 0 a
40 C0 4 (4 v0
(wU) 3 aniUJV ?O HUdM
47
APPENDIX A
The following charts are from the National Weather Service northern
hemisphere surface pressure analyses at synoptic times OOOOZ and 1200Z for the
period 1 to 10 July, 1984 (synoptic times 0600Z and 1200Z for 6 July 84), as
noted in the bottom left-hand corner of each map.
46
ACKNOWLEDGEMENTS
This research was sponsored by the ONR Physical Oceanography Program.
The success of the fieldwork was strongly dependent on the competent, willing
support of the crew of the USNS DE STEIGUER and Mr. Robert Sylvia, LSU,
who independently maintained the radiosonde launch operations.
Members of the scientific cruise party were:
Prof. C'.N.K. Mooers, Chief Scientist, NPSMs. Marie C. Colton, Party Chief, NPSMr. Luke Chung, HarvardAG3 Mary Robinette, FNOCAG3 Lisa Campbell, FNOCDP2 Marianne Drewett, FNOCMr. Robert Sylvia, LSU
REFERENCES
Wittmann, P.A.; Rienecker, M.M.; Kelley, Jr., E.A.; Mooers, C.N.K,Hydrographic Data from the OPTOMA Program, OPTOMA11, 5 June to 5August, 1984, NPS Technical Report No. NPS-68-85-011, March, 1985.
• a -rm .m. 1m l m m m
mm m m
45
00
0 U,
o .
CLI
•-,-.
•"4" '4-
•U'
- S C
44
43
:k
eJ0 0 m
.0
r-IlJr
m >, -4
C14 -. (
-H- -4
(N - x
Q) a)Ca00C'4 (1
-M a) wo -
00
ca '
- ,-~ * ca
-~ 40
ta2 "-
A' -
0 V_
Q)~ U
- 4 -4 .,4a4
- Q A
u ()
0"- 0
E-U 0-4 -
C4NN I N
(s / w) 033dS ONIM ONY A110O13A ONIM
------------(~)
II
I -.
~ I1'~
a ~
127. A-J
.0
-4.
0
C
-4
I-
-4
N H
"-4
I - Lj~
N 0 '0 N 0N N - - -
(~ B.o) ~v~jjd~± ~rv'
41
oNt'C4
0 Nn V!
to
W)
Nin4 N
N
C G
) 70 0
00
000*
S3.... 1....
ob
o0 0 0 0 0
I I4
II-I
() N
I II
C4
NN
N)o
40W)
a 0 I
so
00
40 m 0 0
I II
.-. 3ai Y 0 l~
40
4
C44
0 00
40
44
o No
N 0
40U 3Nmi8 l~
U,,
N>
04
400
0 0 0
o o 0 0 0 0
o 0 0 0
(wU) 3Qflinyl NO Hid3a -
0
pn 0IA
too
0a a 0
0 '
0 00044
(L)3nuiS l3
38
()
0
0 0
0
to Ch
(L0 3ai N 80Hd30$
UF4
£00
4mn
go N 1
aU)3n lS i3
37
0
N
r-. a 0
u's In
0
pd))
C4 In
o 0 0 0 0to 40 1* C4 N
(wU) 3anliinv8 O HidJO
36
W)d
W))
~ Iin
N C4
(w) 7Ol5lv O l
int01
0 0 a o04
0c
3 anirivNOHid)
In,
to
(00
co k
01 -4
0 ID N' ('4 V
(wU) 3OflhnvY O HIMJ
35
040
t-) NN
0)0
0 0 aN
003anlY0 Hd3
06
co,
V ccc .
C4
abn
4 0 10 N 4 4
0 0so NN
(W) 3nmlY8 HldN
34
U(go -0N
o 0
40
enn
404
0
L
__ ~-4cC'--
484
'X -6o.1 o
~ ~o\o '~-~~ OiC4
* - TT. 0,,
Yua ..... j 4 4 A.
~~~e - W ''T.ff 1 I.
LI CJ- m
_7''
V 'Cab*
'v'-4
'. 11 - 0 I
49.0 . fC2
CDRANY
on C2
®r r
00
IVo C3
so, n8r
ra irk 'j,
gyso on an SolNkk -1
&An P,%= Il
=& co"C'
14Uj C-A- ,so
jr-P so 7
knk cy-I " Ir4cr i
Va- -
so Nam - am cp .0
4nozoowt
cv? ZAr loFF
Vot. A? 3r
camm
cyN
c4.b. dy..
-do,
Fn
kn-r,\j dI
wwcyw Af
A,.
4D,ij
NI
CAGcyck
! 3 Ni N83 9 hc,
VT
'ik; Aj
110,
dy
v so
C3 0.14V,
Za
Irk -2
fit
dy
10, a
o1riC4 gn
oy
Na jr:r M-Ri I :-s
C3 1040
Tn ts I /-;Z:l Lin
94fm--,Xe Ill
43wm
C2 F cl
ci .14ty. WfyC7
Own
C,3C3 ry
47,
ill L
CVA
4%14 C3
CPVA wpn .44n""S
C-P C3Fill
cc
to
4:77,
9
'el9:rpral"
Coc:p
leifill
IOUr4o 0
-~Zu 74'~ \ 4
ri I
P_ rM CYC rTV
-49 04
* 4
.. ,-0 In- 4
.~* C.
1). -e -. V . 5
co
/4 -
t* Fe. *;j.- *./ D
e.z'
NI
_04" lei
Ila I
53 1
00C2 CY
C2cmv 2ftf in
-0 F- -,Vj
-4 cymi
h-
CIcz
W,
fydy
W
P4cy cwu
ce I,-fy -Z.,Fn
-1 . .inin 06
1-7 59.1 1 . "-
C4
C4 lull--zz -4
Pm --AAA -- %A
20"CIS- rn em
T-r cm
cm
CMI
it
toon\ pun:-CV
>1
VIA-
.00*P%.4
76. mcs,c\j Ln
clrNv
At
A
cj cunc1c
cl,
3dxj N nto
pv
v LLL
GS03 -
7. .- 54
400 7 4,Jp-
., ~ M%~ T..
I Ito~.. 1_
r/r
-_7 Oj /7e., :4
44a T0
-'.3 3
* * .4- I 444q
~"4AI- ~13.0 'J
-. Lo*
/rA("-
'1 4414).
44 )
4/ /4ijs ~' ;0
I 4y I4f3 6 IV 03.c tii
-'4.. j. 4
17 55I~
7,
04 0
o LO.
oil"*
-7 0.
%0 ..7
*. 2.
Pt.
54 -
0a O
-~ - /
) - *~:4~56
40 4c'' '"N N "AN , I -
L 1 7, -'
NN0
'.rj
r ~ I -A
> ~ " 11-'
ej Lfl
E)1 1 N
CU Y. -
MM I . ! "" PIQ1 J--- .i4n .j'a*
-3 --W
CIAp 7'N
a- / -
- yi..-0 a.,
(
4 '-.C'. Cr - I 7i. .,
* .0.
J1 'I ,
..
02IC" a -
- 'V 7- A
Si f
'S)4~~~10 u-0 .- 4 - oe. fM.!.
"404
(J -Q I PW- 4
* UN
_ Ii
, . 4G
;go/t
'iil
i'ek
144
/ ~1~ k 58
soKry O J
LJ J
*~1 . 04,'h -
-eU ~ ~ n 1O.7Lvi
0-"
I- Inc '7'
f- g-~
4C /Im~
'f7- /
04- I jr b o 00,
,l A 'L V r-"
j /4 7--. - C'
20 'C~~.d I~ '0 J ti
@4*Z~-. - o / * ~q' :
r.. 4. e I " .z~ IN
C--' ~~ ~ k,. 3dT.C ~ .-L. ~ - 'S
4 ~ -*~~30. ,
to,- 1-/l ,
! Z J -
C - 1 V
rJE:- ~~-~:' ~-(Z gN L \_4
Y6____ ~. .m j n7
-. I9 o.. N
-'je
*/** f
\, ,.t 60
-. 03.
'4k 7--.
_a et-
D1C 1' 0G
/..
* e r~-,,~- .. . Li'
''-I,--..
4- -~~ RT ,
v c
'Jr~ on
'C' IF
0:4, -- Jog61 4X
Zia
C, 9tI'M14- CMN "Gpn9
= '-f-tur4a
Ir clN Clb- " ev"Aj- -Cr
WWIZ*
it 1114 . Ica,;
-S,/ C3:rv'
AAMLn so ; /, say Ir #Ina
Jana av.
C%4
tv
J C'j
MCI:!
Fn Inc
Ln el nCi .2 -Z
md
I^v
AD
on,
rl)40
rq
cryON
apt
AV oa---ncow
C42 4JZ
o hn Zin 00 62
C4 11 f-ione4 Ar-
-CY
AW4
cr.. n
dy nPMU pjj
-"?. 4- pwyl / 7' a 11
in04 alt- 1 0 I , : .
p'"I
oft&- in/ -rwP.D.-O
WWII
Nam !r
fn 00
ps ,n C.Alc C
7 C5
0
C31-Go
10
4e,,- ron mCIA
If
r4cp fnr
flan a,on C3M5
ll a
V co
C', C3 7
CrIci
Wrcy
I" rim
-con
C30%
CKI.
Ar
I eybo
TV CO bi
NV cz
Mi. -
p 63Cgy
4~J (fn
- lb44 y.
-4a-
~~r~n
\meT~~ CNO
64 -J
N 'OT /,.-i I-co
mp~~ I... . 7-
- Az
-I J I
c 10
tv CZ,.va -
K , U/
In' fN.l
e, - I
hp f4
~..PeA^p
65:22-
r- E3
C3=
cam owyl : X% .1,10-; fm \
ri lool- -44'
C?
pa 'A .MON-C3
d
V3 on
44') W10
em C3C2
ze inLn
U,=
10 fum
C3%
ongy
low, cl
canLo
ey
ANY
IN7. -CA" cx4m
fl"
.hn /C3
clC3 vn
N cyIne eb 61 at
HAAO V C)
-~~~ 1')*.. ~-
00 i" ", "; co
; Sn
I~ A_ 46
T5tJO, -(~g. . .. Sn I ',
*..*e /00 -, -..- .- :" I'5'~~d ' -' _j \ ~ -
tSJ *-D 1,)ruJ/ .S L
M ~ .~ Iryl - /;M 4k,~
Vt. * ,0 . v,
4. * %.. -5r~ / t * '
** I tK .*> 4Aj I. I IN
.
89.67 I" - " v
C3dyC2
CYC3
pnei ey va r4on-
Ow/ri Op
CF. go-top
-* I on
an
cp" n Is 1 :.1 0Icy -An C2 IMP 1)f1j = T CO
>P=vu,!
J§
3-C3 an 9 W* Ca*
C46 fu
aP__ C:2
"rip,f 304rp Afy
-k...
C:vINV
C4 :23
INU')L-tn
is 31qm A 09 'onc,
0-4
47
Uhl
68
INITIAL DISTRIBUTION LIST
1. Naval Postgraduate SchoolDepartment of OceanographyMonterey, CA 93943
Prof. Christopher N.K. Mooers 30Dr. Michele M. Rienecker 1Dr. Edward A. Kelley 1Ms. Marie C. Colton 1Mr. Paul A. Wittmann 1Dr. Mary L. Batteen 1Dr. Laurence C. Breaker 1LCDR J. Edward Johnson, USN IProf. James L. Mueller IProf. Kenneth L. Davidson IDr. Gary Geernaert 1Prof. Roland W. Garwood IProf. Robert L. Haney 1Prof. Dale F. Leipper IProf. Robert D. Renard 1Prof. Glenn H. Jung 1
2. Harvard UniversityDivision of Applied SciencesPierce Hall, Room IOODCambridge, MA 02138
Prof. Allan R. Robinson 1Dr. James A. Carton 1Dr. Everett F. Carter 1Mr. Leonard J. Walstad 1Mr. Wayne G. Leslie 1Ms. Nadia Pinardi 1Prof. Myron B. Fiering 1
3. Office of Naval Research (ONR)800 N. Quincy St.Arlington. VA 22217
Dr. Thomas W. Spence 1Dr. Thomas B. Curtin 1Dr. Robert Abbey 1Dr. Kenneth H. Brink 1
4. College of OceanographyOregon State UniversityCorvallis, OR 97331
Prof. Robert L. Smith 1Dr. Adrian Huyer 1
69
5. Jet Propulsion Laboratory (JPL)California Institute of Tech.4800 Oak Grove RoadPasadena, CA 91109
Dr. Denise E. Hagan (Code 183-501) 1Dr. Mark Abbott (also at Scripps) i
6. Commanding OfficerFleet Numerical Oceanography Center (FNOC)Monterey, CA 93943
CDR John F. Pfeiffer, USN 1Mr. R. Michael Clancy 1Mr. Ken Pollak 1Ms. Evelyn Hesse 1LCDR Michael R. Frost, RN 1
7. Sandia National LaboratoriesDiv. 6334Albuquerque, NM 97185
Dr. Mel Marietta 1Dr. Eugene S. Hertel 1Dr. Stuart L. Kupferman 1


![An analytical computation of asymptotic Schwarzschild ......41n(3)Gjv, one of the values 41n(fc)G7v favored by Bekenstein and Mukhanov [7] because of their ability to describe the](https://static.documents.pub/doc/80x56/606df523e5973f3bd31732a4/an-analytical-computation-of-asymptotic-schwarzschild-41n3gjv-one-of.jpg)


