Preparation, Characterization and In - Vitro Evaluation of Metformin HCl and Glipizide Loaded Microspheres of Different polymers by Using Emulsion Solvent Evaporation Technique Submitted by: Md. Maksud Al- Hasan Registration no: 14107095 Session: Spring- 2014.
Transcript
Preparation, Characterization and In-Vitro
Evaluation of Metformin HCl and Glipizide
Loaded Microspheres of Different polymers by
Using Emulsion Solvent Evaporation Technique
Submitted by:
Md. Maksud Al- Hasan
Registration no: 14107095
Session: Spring- 2014.
AIM, SCOPE AND OBJECTIVES OF THE
STUDY
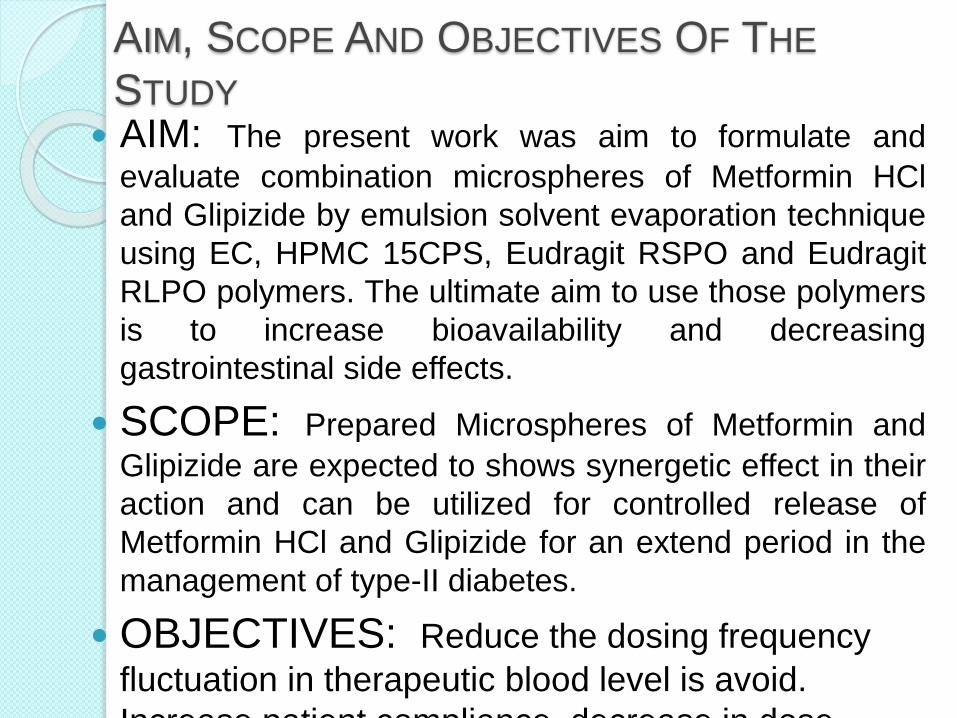
AIM: The present work was aim to formulate and
evaluate combination microspheres of Metformin HCl
and Glipizide by emulsion solvent evaporation technique
using EC, HPMC 15CPS, Eudragit RSPO and Eudragit
RLPO polymers. The ultimate aim to use those polymers
is to increase bioavailability and decreasing
gastrointestinal side effects.
SCOPE: Prepared Microspheres of Metformin and
Glipizide are expected to shows synergetic effect in their
action and can be utilized for controlled release of
Metformin HCl and Glipizide for an extend period in the
management of type-II diabetes.
OBJECTIVES: Reduce the dosing frequency
fluctuation in therapeutic blood level is avoid.
Increase patient compliance, decrease in dose
Preparation of Metformin HCl and Glipizide
Microspheres
Ethanol and DCM
Polymer, Ethanol and DCM
Polymer, Ethanol and DCM.
Polymer
Metformin HCl & Glipizide
Homogenization for 4 hrs 30 min.
450 RPM, 50ml Liquid Paraffin with
1% Tween 80.
Settle for few minutes
Washing
Drying at Room Temperature
Store
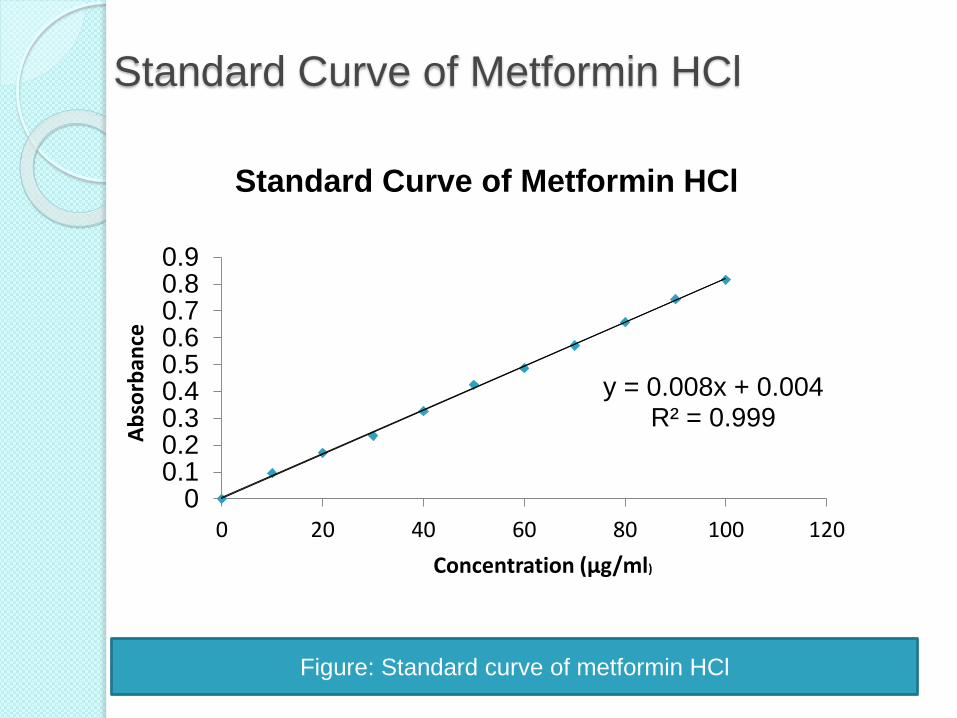
Standard Curve of Metformin HCl
y = 0.008x + 0.004R² = 0.999
00.10.20.30.40.50.60.70.80.9
0 20 40 60 80 100 120
Ab
sorb
ance
Concentration (µg/ml)
Standard Curve of Metformin HCl
Figure: Standard curve of metformin HCl
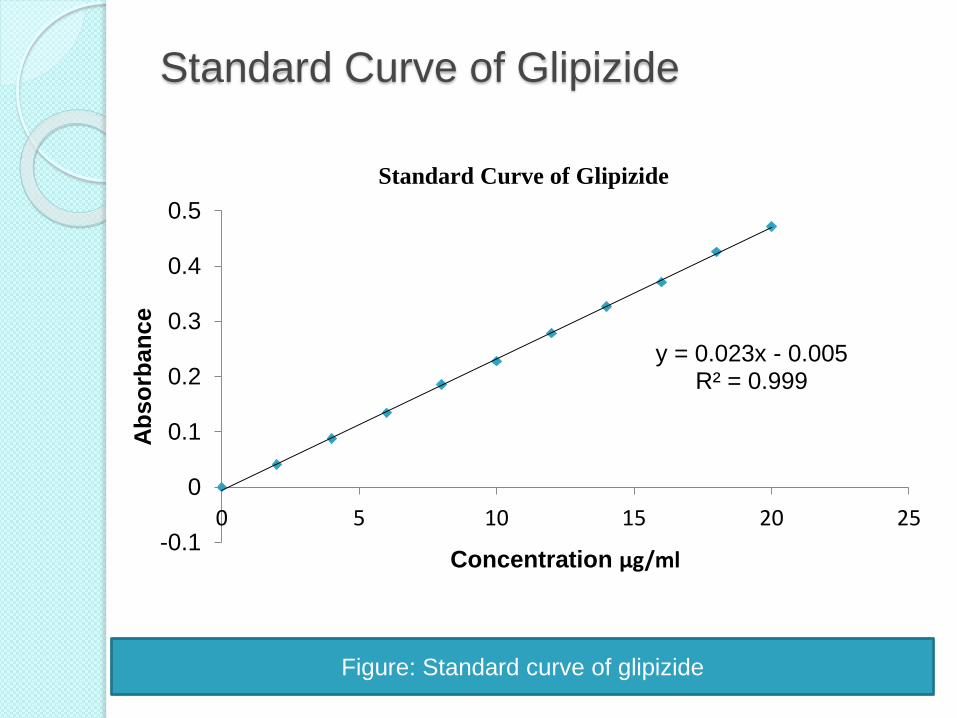
Standard Curve of Glipizide
y = 0.023x - 0.005R² = 0.999
-0.1
0
0.1
0.2
0.3
0.4
0.5
0 5 10 15 20 25
Ab
so
rban
ce
Concentration µg/ml
Standard Curve of Glipizide
Figure: Standard curve of glipizide
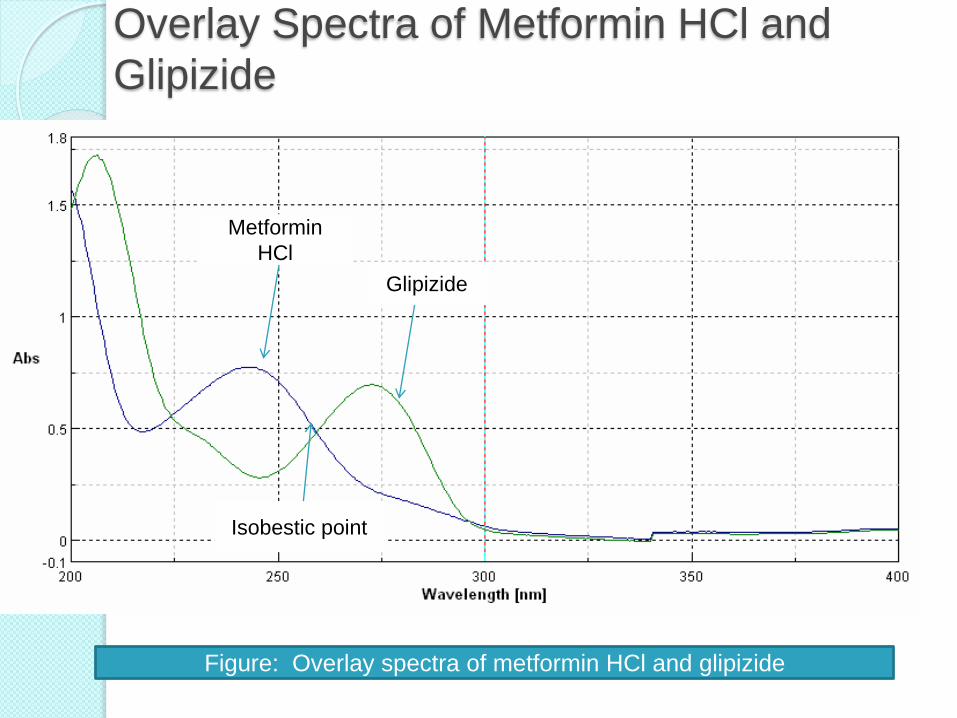
Overlay Spectra of Metformin HCl and
Glipizide
Figure: Overlay spectra of metformin HCl and glipizide
Metformin
HCl
Glipizide
Isobestic point
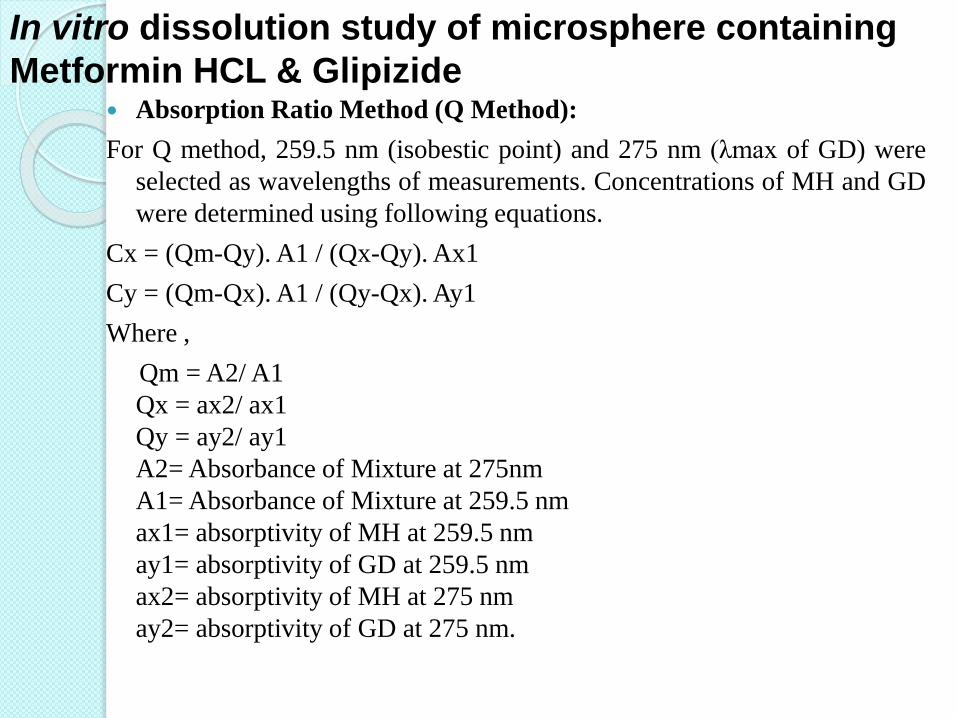
In vitro dissolution study of microsphere containing
Metformin HCL & Glipizide Absorption Ratio Method (Q Method):
For Q method, 259.5 nm (isobestic point) and 275 nm (λmax of GD) were
selected as wavelengths of measurements. Concentrations of MH and GD
were determined using following equations.
Cx = (Qm-Qy). A1 / (Qx-Qy). Ax1
Cy = (Qm-Qx). A1 / (Qy-Qx). Ay1
Where ,
Qm = A2/ A1
Qx = ax2/ ax1
Qy = ay2/ ay1
A2= Absorbance of Mixture at 275nm
A1= Absorbance of Mixture at 259.5 nm
ax1= absorptivity of MH at 259.5 nm
ay1= absorptivity of GD at 259.5 nm
ax2= absorptivity of MH at 275 nm
ay2= absorptivity of GD at 275 nm.
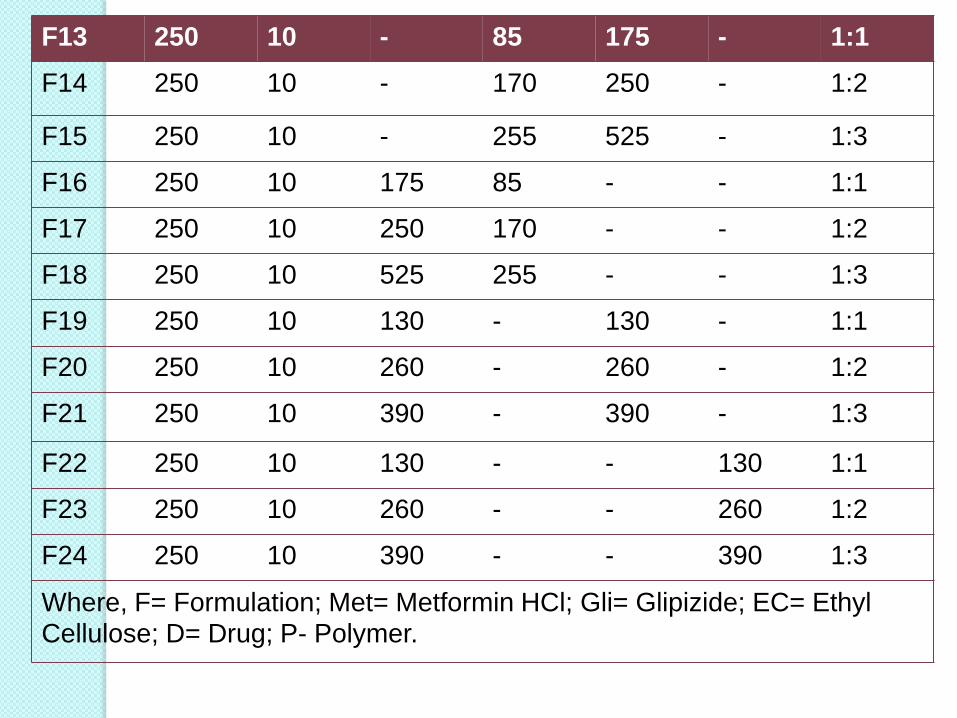
Table-1: Composition of drug loaded
microspheresF- Code Drug (mg) Polymers (mg) Ration
Figure: Drug entrapment efficiency of formulation F1 to F24.
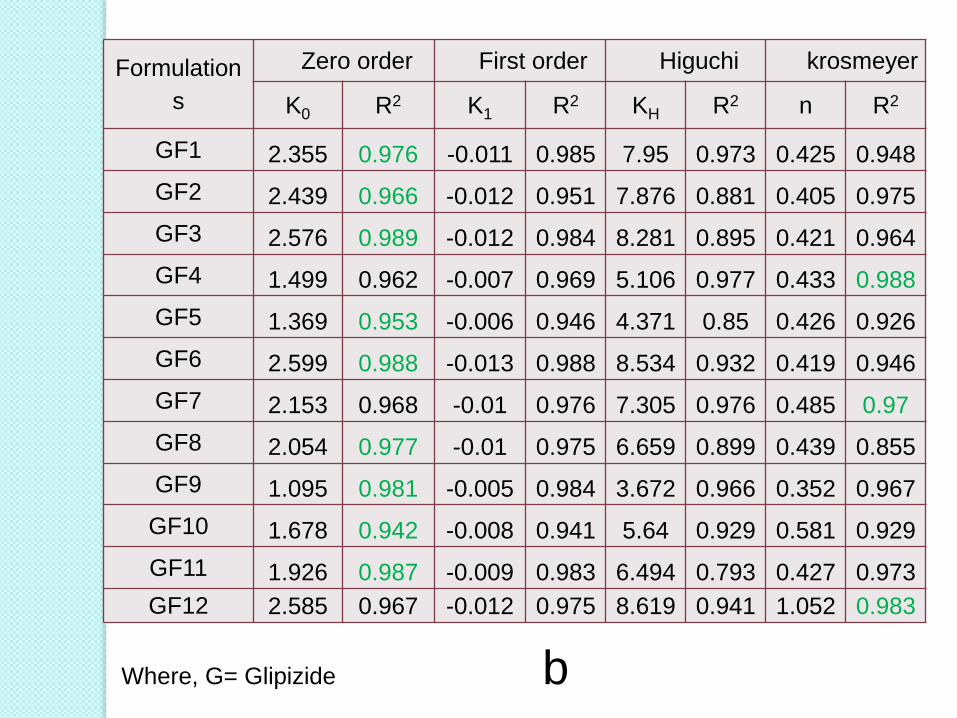
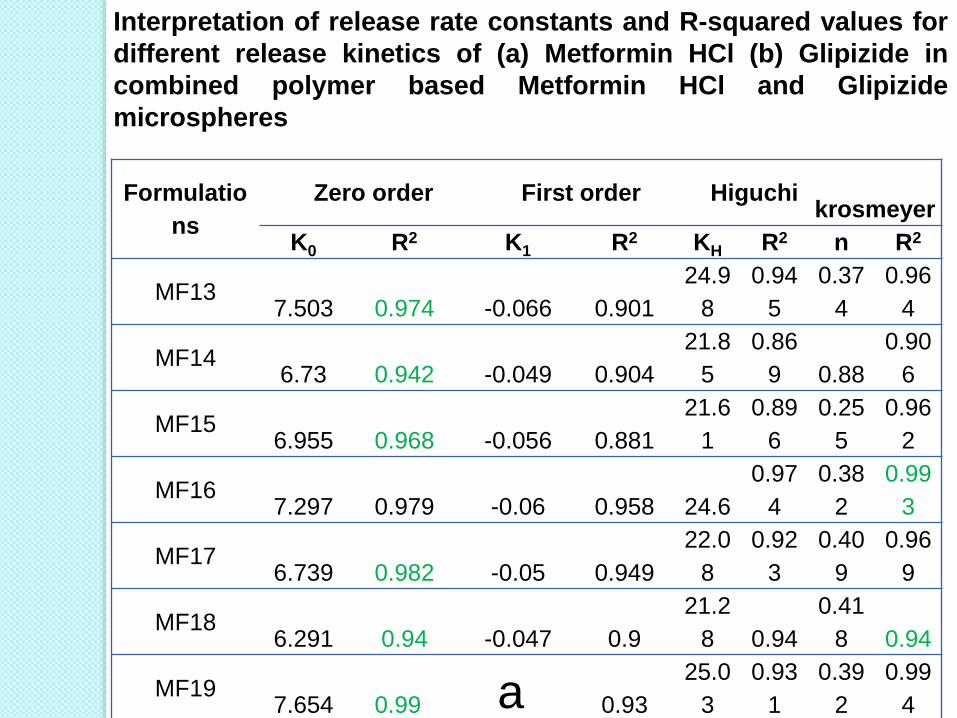
Discussion
It was found in the range of 56.56% to 88.02% Formulation F11 containing eudragit RLPO
showed maximum drug loading about 88.02% Formulation F6 containing HPMC 15CPS shows
minimum drug loading about 56.56% Microspheres of HPMC 15CPS are irregular
shape therefore more drug loss from surface during washing leads to less drug entrapment efficiency
Rank order of % drug loading of various formulations:F11>F4>F16>F17>F19>F14>F13>F20>F10>F5>F7>F21>F22>F12>F24>F15<F8>F1>F2>F18>F9>F23>F3>F6
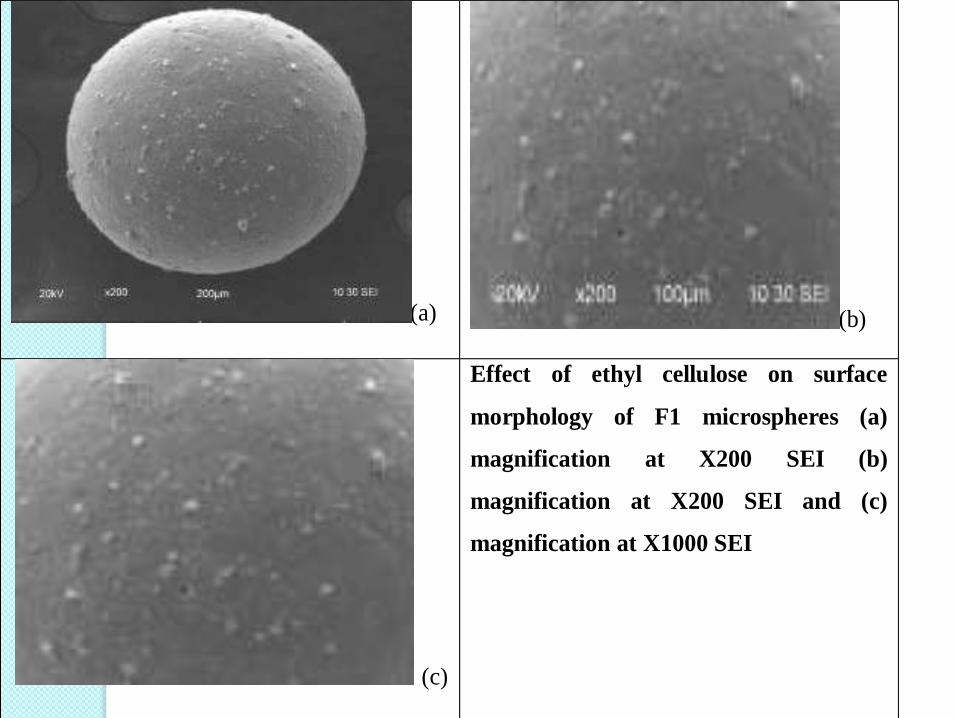
(a) (b)
(c)
Effect of ethyl cellulose on surface
morphology of F1 microspheres (a)
magnification at X200 SEI (b)
magnification at X200 SEI and (c)
magnification at X1000 SEI
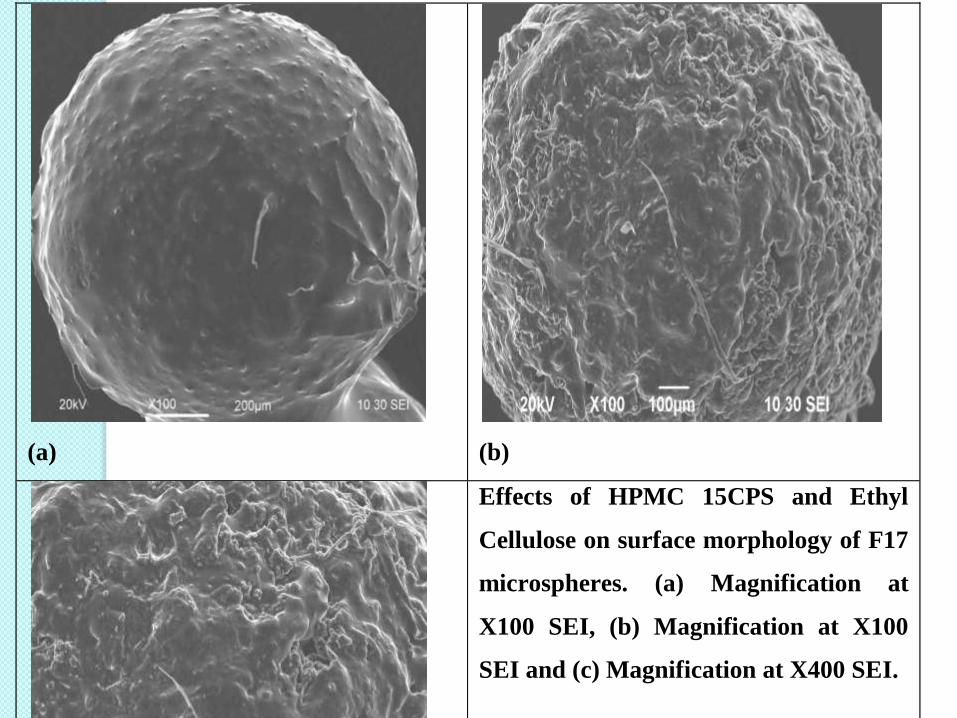
(a)
(b)
(c)
Effects of HPMC 15CPS and Ethyl
Cellulose on surface morphology of F17
microspheres. (a) Magnification at
X100 SEI, (b) Magnification at X100
SEI and (c) Magnification at X400 SEI.
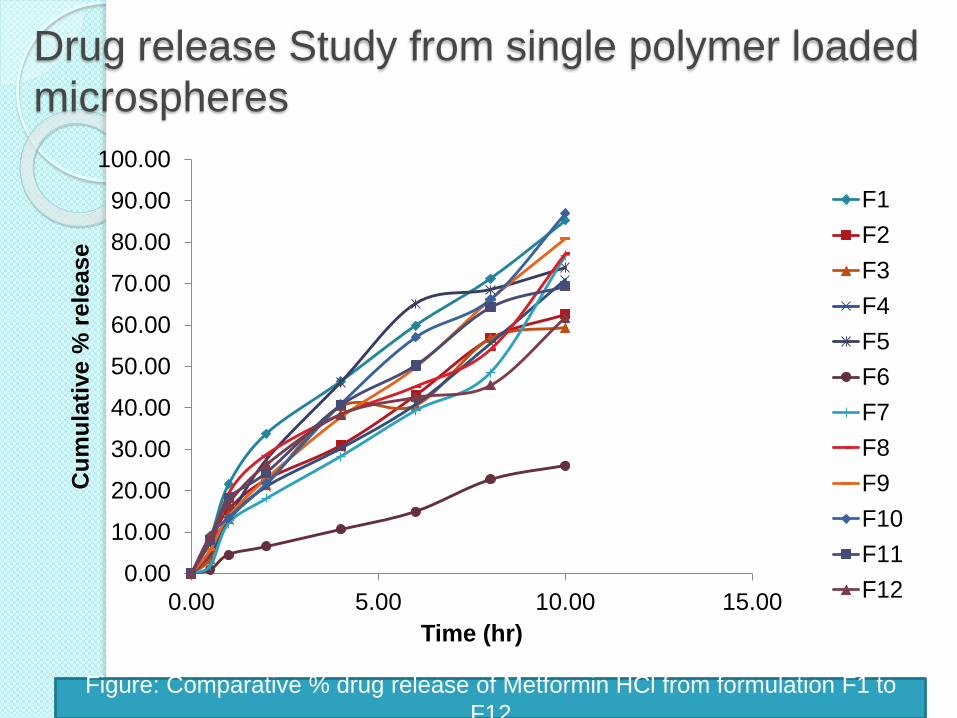
Drug release Study from single polymer loaded
microspheres
0.00
10.00
20.00
30.00
40.00
50.00
60.00
70.00
80.00
90.00
100.00
0.00 5.00 10.00 15.00
Cu
mu
lati
ve %
rele
ase
Time (hr)
F1
F2
F3
F4
F5
F6
F7
F8
F9
F10
F11
F12
Figure: Comparative % drug release of Metformin HCl from formulation F1 to
F12
0.00
5.00
10.00
15.00
20.00
25.00
30.00
0.00 2.00 4.00 6.00 8.00 10.00 12.00
Cu
mu
lati
ve %
Rele
ase
Time (hr)
F1
F2
F3
F4
F5
F6
F7
F8
F9
F10
F11
F12
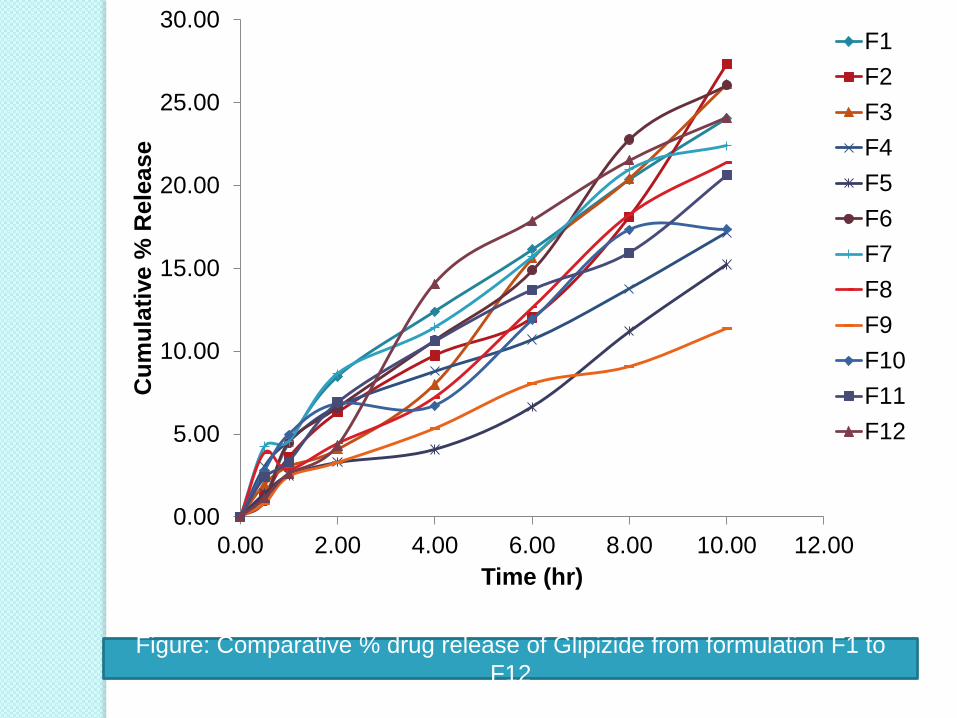
Figure: Comparative % drug release of Glipizide from formulation F1 to
F12
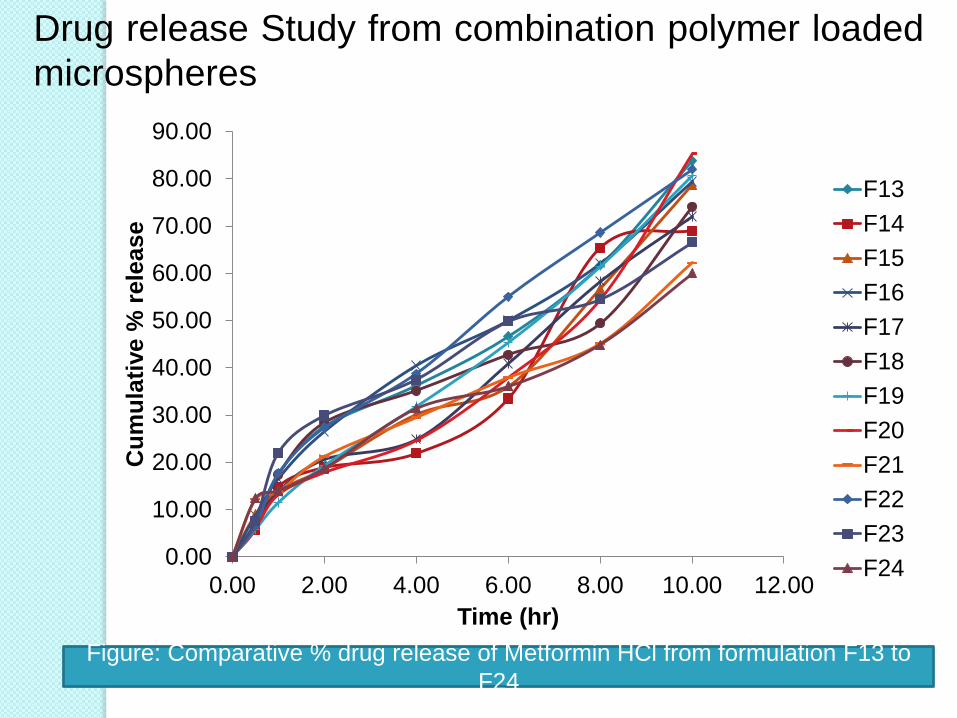
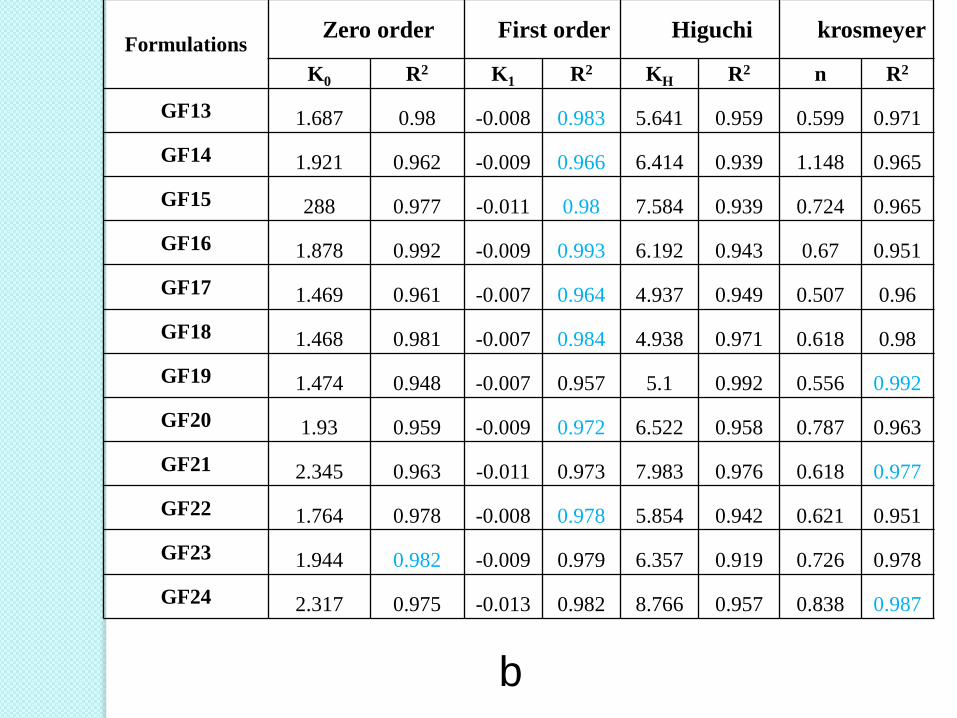
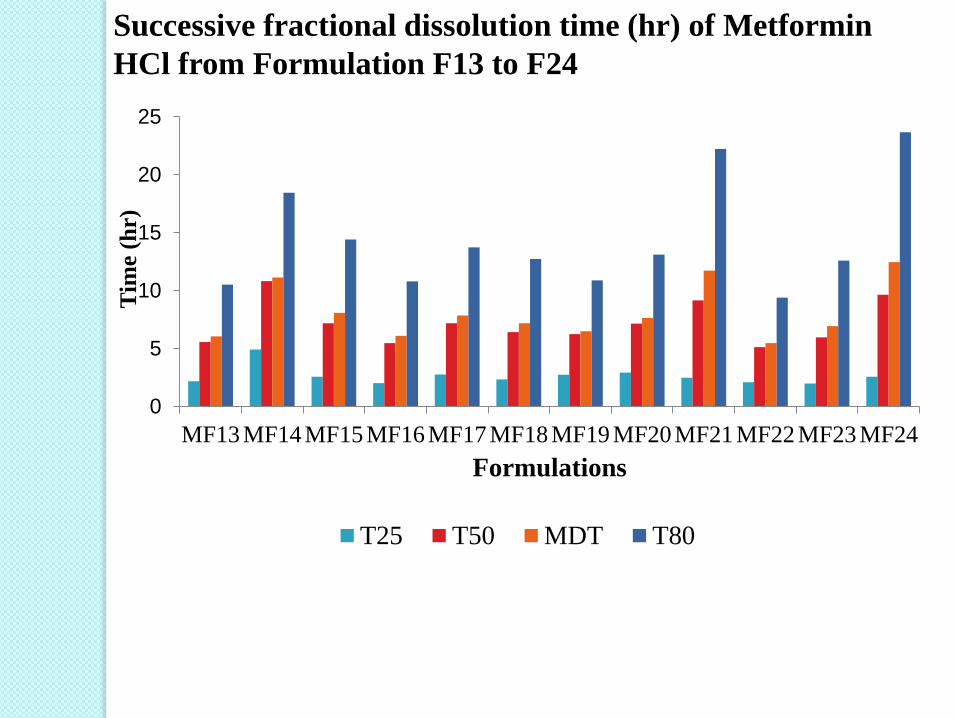
Figure: Comparative % drug release of Metformin HCl from formulation F13 to
F24
0.00
10.00
20.00
30.00
40.00
50.00
60.00
70.00
80.00
90.00
0.00 2.00 4.00 6.00 8.00 10.00 12.00
Cu
mu
lati
ve %
rele
ase
Time (hr)
F13
F14
F15
F16
F17
F18
F19
F20
F21
F22
F23
F24
Drug release Study from combination polymer loaded
microspheres
0.00
5.00
10.00
15.00
20.00
25.00
30.00
0.00 2.00 4.00 6.00 8.00 10.00 12.00
Cu
mu
lati
ve %
Rele
ase
Time (hr)
F13
F14
F15
F16
F17
F18
F19
F20
F21
F22
F23
F24
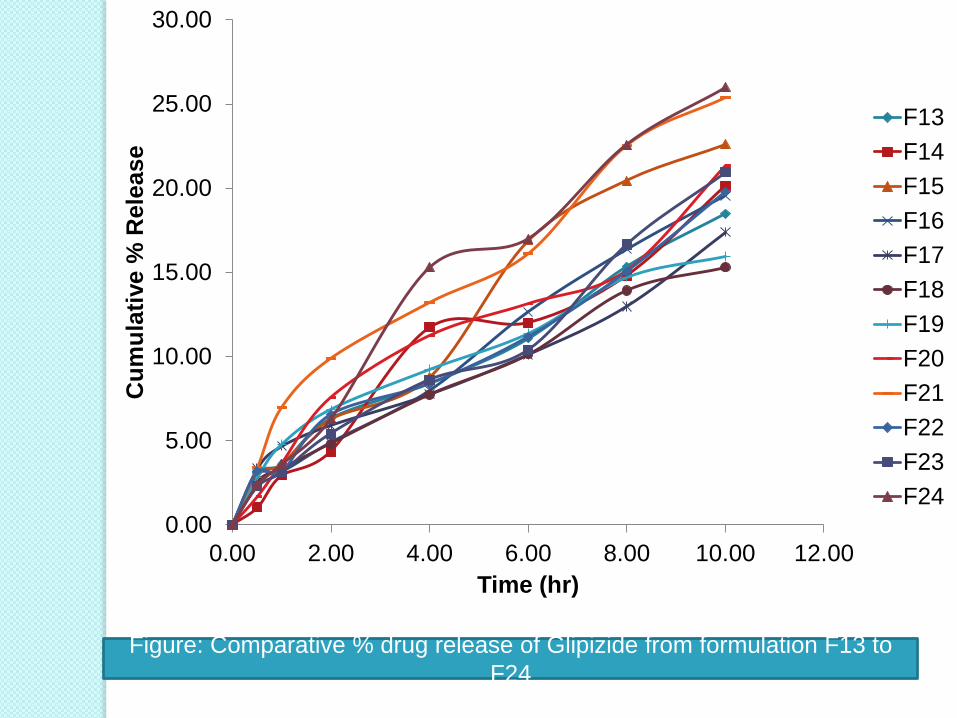
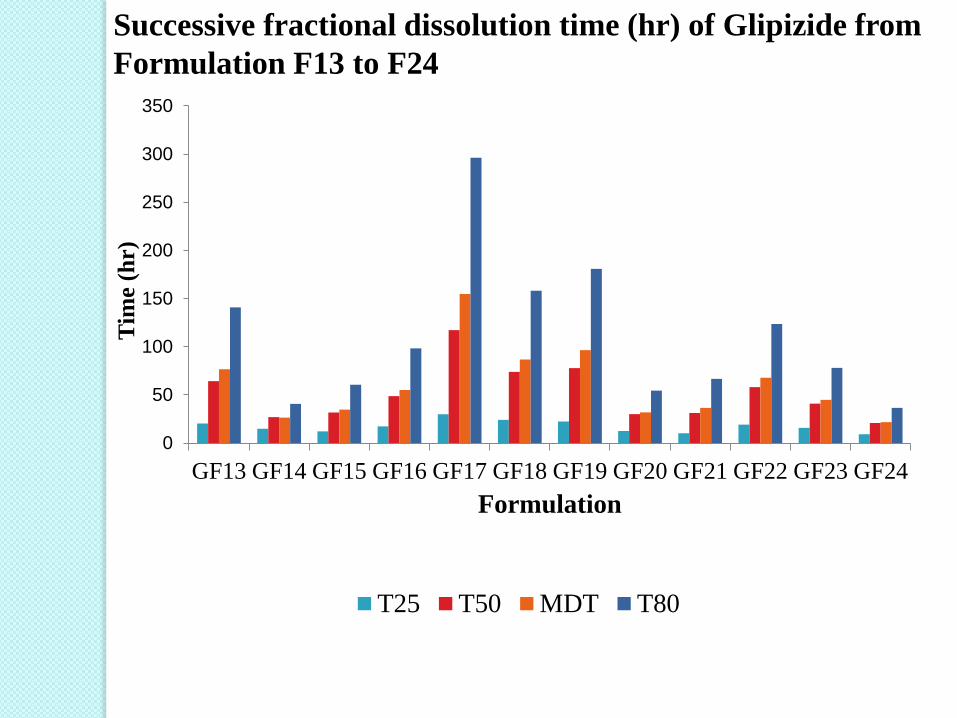
Figure: Comparative % drug release of Glipizide from formulation F13 to
F24
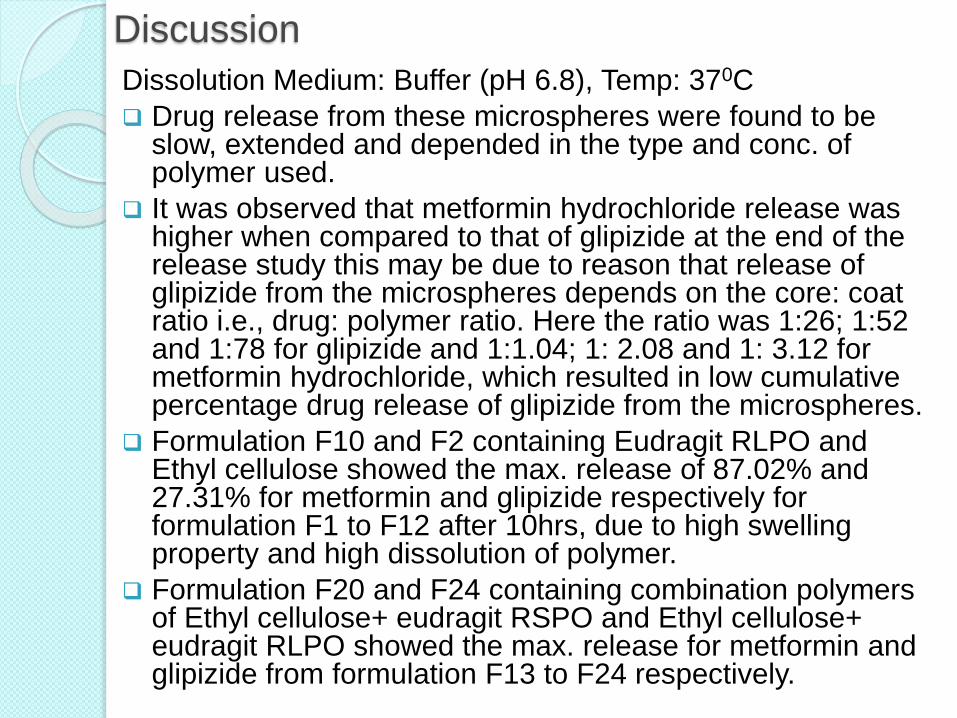
Discussion
Dissolution Medium: Buffer (pH 6.8), Temp: 370C
Drug release from these microspheres were found to be slow, extended and depended in the type and conc. of polymer used.
It was observed that metformin hydrochloride release was higher when compared to that of glipizide at the end of the release study this may be due to reason that release of glipizide from the microspheres depends on the core: coat ratio i.e., drug: polymer ratio. Here the ratio was 1:26; 1:52 and 1:78 for glipizide and 1:1.04; 1: 2.08 and 1: 3.12 for metformin hydrochloride, which resulted in low cumulative percentage drug release of glipizide from the microspheres.
Formulation F10 and F2 containing Eudragit RLPO and Ethyl cellulose showed the max. release of 87.02% and 27.31% for metformin and glipizide respectively for formulation F1 to F12 after 10hrs, due to high swelling property and high dissolution of polymer.
Formulation F20 and F24 containing combination polymers of Ethyl cellulose+ eudragit RSPO and Ethyl cellulose+ eudragit RLPO showed the max. release for metformin and glipizide from formulation F13 to F24 respectively.


![Bioavailability File: Glipizide - FABADdergi.fabad.org.tr/index/issue/pdf/volum31/issue3/151-161.pdf152 Kaynak, Öner phenyl] sulfonyl] urea7,10.The molecular formula of Glipizide](https://static.documents.pub/doc/80x56/611c2256124aeb0d326e6abd/bioavailability-file-glipizide-152-kaynak-ner-phenyl-sulfonyl-urea710the.jpg)


