Page 1
Metformin: Mechanistic Absorption
Modeling and IVIVC Development
Maziar Kakhi*, Ph.D.
FDA
Silver Spring, MD 20993 [email protected]
AAPS Annual Meeting and Exposition
Orlando FL, October 25-29, 2015
1
Viera Lukacova, Ph.D.
Simulations Plus
Lancaster, CA 93534 [email protected]
* Disclaimer: The views expressed in this presentation are those of the author and do not reflect the opinion nor
the policy of the FDA.
Page 2
Presentation Overview
• Metformin – general considerations
• Validation study database
• Metformin absorption model
• IVIVC development/validation
• Conclusions
2
Page 3
Metformin – General Considerations
• Used in the treatment of type 2 diabetes mellitus.
• Highly soluble.
• Incompletely absorbed with an oral bioavailability ranging from 40 to
60%.
• Undergoes site-dependent absorption primarily in the upper part of
the intestine.
• Carrier-mediated transport known to play active role in drug
absorption and disposition.
• Poses a challenge for classical level A in vitro – in vivo correlation
(IVIVC) approaches.
3
Page 4
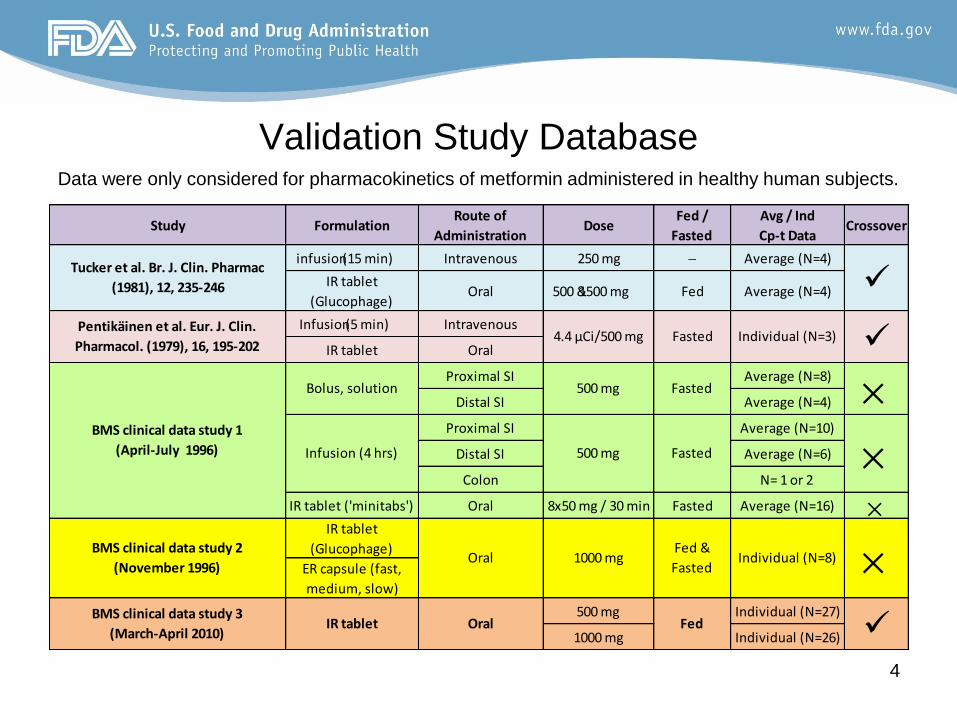
Validation Study Database
4
Data were only considered for pharmacokinetics of metformin administered in healthy human subjects.
Study FormulationRoute of
AdministrationDose
Fed /
Fasted
Avg / Ind
Cp-t DataCrossover
infusion (15 min) Intravenous 250 mg - Average (N=4)
IR tablet
(Glucophage)Oral 500 &1500 mg Fed Average (N=4)
Infusion (5 min) Intravenous
IR tablet Oral
Proximal SI Average (N=8)
Distal SI Average (N=4)
Proximal SI Average (N=10)
Distal SI Average (N=6)
Colon N= 1 or 2
IR tablet ('minitabs') Oral 8x50 mg / 30 min Fasted Average (N=16) IR tablet
(Glucophage)
ER capsule (fast,
medium, slow)
500 mg Individual (N=27)
1000 mg Individual (N=26)
BMS clinical data study 3
(March-April 2010)IR tablet Oral Fed
4.4 μCi/500 mg
Tucker et al. Br. J. Clin. Pharmac
(1981), 12, 235-246
Pentikäinen et al. Eur. J. Clin.
Pharmacol. (1979), 16, 195-202
BMS clinical data study 2
(November 1996)1000 mg
Fed &
FastedIndividual (N=8)Oral
BMS clinical data study 1
(April-July 1996) Infusion (4 hrs)
Bolus, solution 500 mg
500 mg Fasted
Fasted
Individual (N=3)Fasted
Page 5
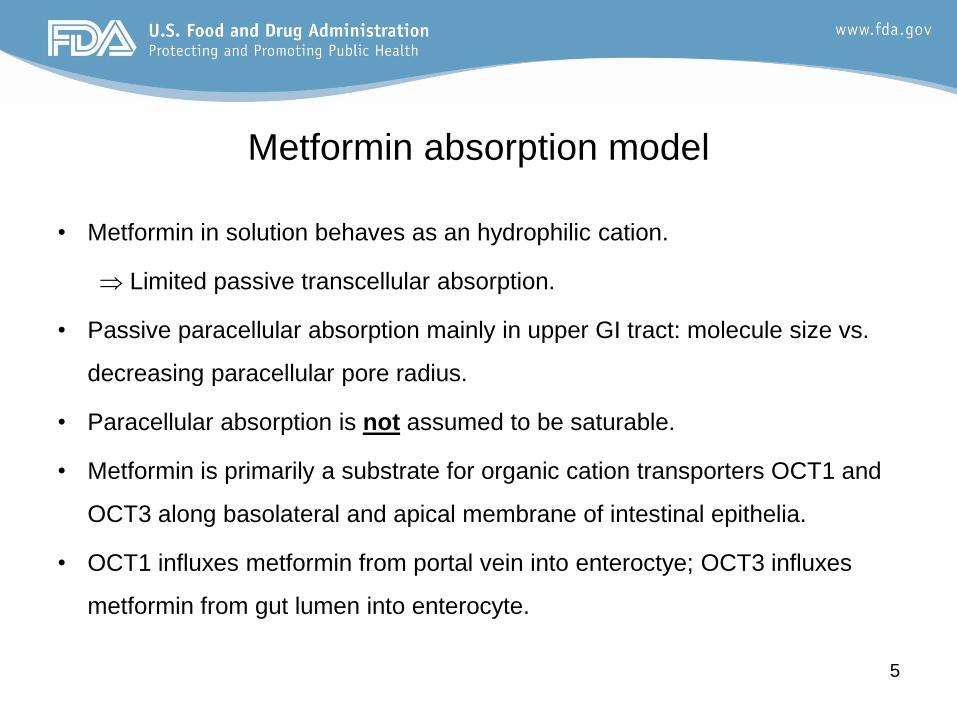
Metformin absorption model
5
• Metformin in solution behaves as an hydrophilic cation.
Limited passive transcellular absorption.
• Passive paracellular absorption mainly in upper GI tract: molecule size vs.
decreasing paracellular pore radius.
• Paracellular absorption is not assumed to be saturable.
• Metformin is primarily a substrate for organic cation transporters OCT1 and
OCT3 along basolateral and apical membrane of intestinal epithelia.
• OCT1 influxes metformin from portal vein into enteroctye; OCT3 influxes
metformin from gut lumen into enterocyte.
Page 6
Metformin absorption model – contd.
6
• Carrier-mediated transport modeled using Michealis-Menten kinetics.
• Disposition of metformin modeled using compartmental mammillary PK
model.
• Major route of elimination is secretion in urine.
Page 7
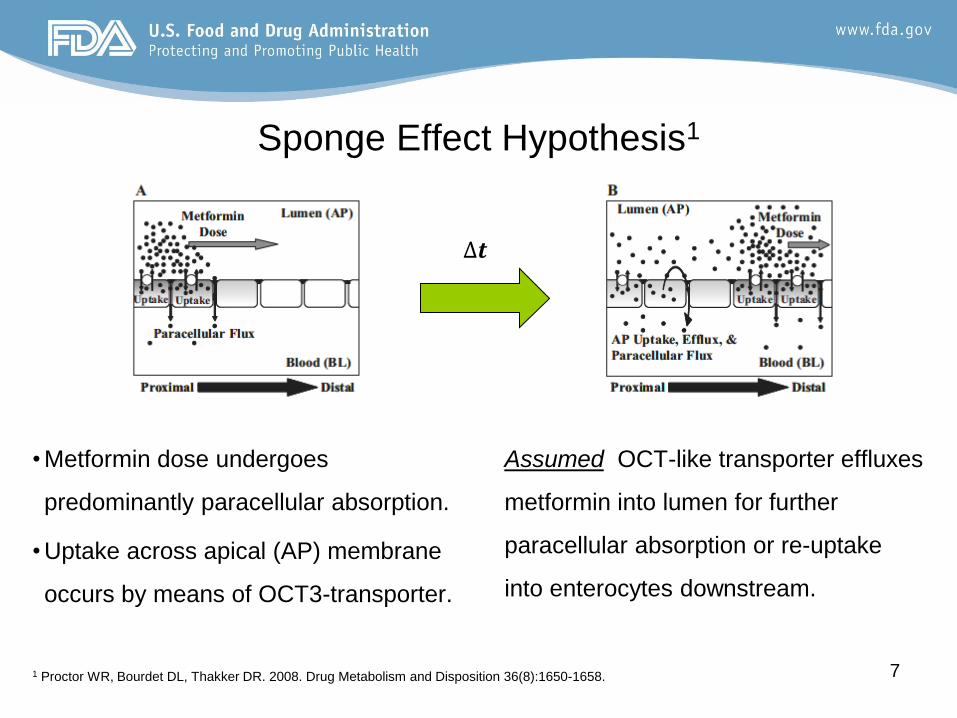
Sponge Effect Hypothesis1
7 1 Proctor WR, Bourdet DL, Thakker DR. 2008. Drug Metabolism and Disposition 36(8):1650-1658.
• Metformin dose undergoes
predominantly paracellular absorption.
• Uptake across apical (AP) membrane
occurs by means of OCT3-transporter.
Assumed OCT-like transporter effluxes
metformin into lumen for further
paracellular absorption or re-uptake
into enterocytes downstream.
∆𝒕
Page 8
8
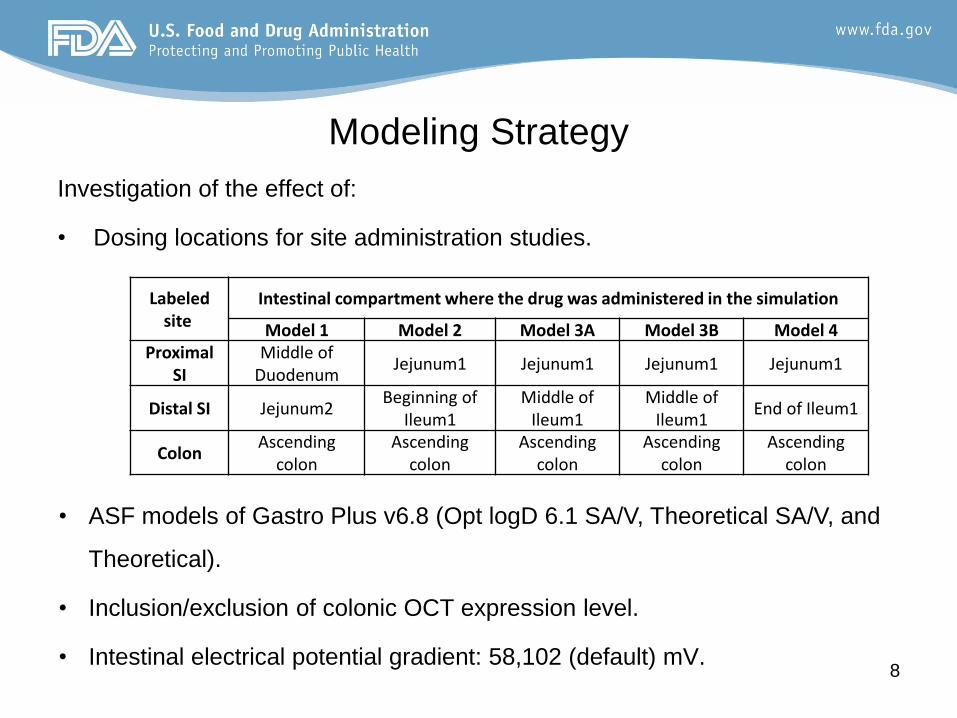
Modeling Strategy
Investigation of the effect of:
• Dosing locations for site administration studies.
Labeled site
Intestinal compartment where the drug was administered in the simulation
Model 1 Model 2 Model 3A Model 3B Model 4
Proximal SI
Middle of Duodenum
Jejunum1 Jejunum1 Jejunum1 Jejunum1
Distal SI Jejunum2 Beginning of
Ileum1
Middle of Ileum1
Middle of Ileum1
End of Ileum1
Colon Ascending
colon
Ascending colon
Ascending colon
Ascending colon
Ascending colon
• ASF models of Gastro Plus v6.8 (Opt logD 6.1 SA/V, Theoretical SA/V, and
Theoretical).
• Inclusion/exclusion of colonic OCT expression level.
• Intestinal electrical potential gradient: 58,102 (default) mV.
Page 9
9
Modeling Strategy - cont.
• Fit CLr, Total Peff, and Vmax values for intestinal transporters for each set of
model options (administration sites, ASF model, EPG, presence of OCT in
colon).
• Models screened for:
• Fitted ratio Peff,Trans/Peff,Para across site administration studies.
• Quality of prediction of Cp-t observations from PO-administration studies.
Page 10
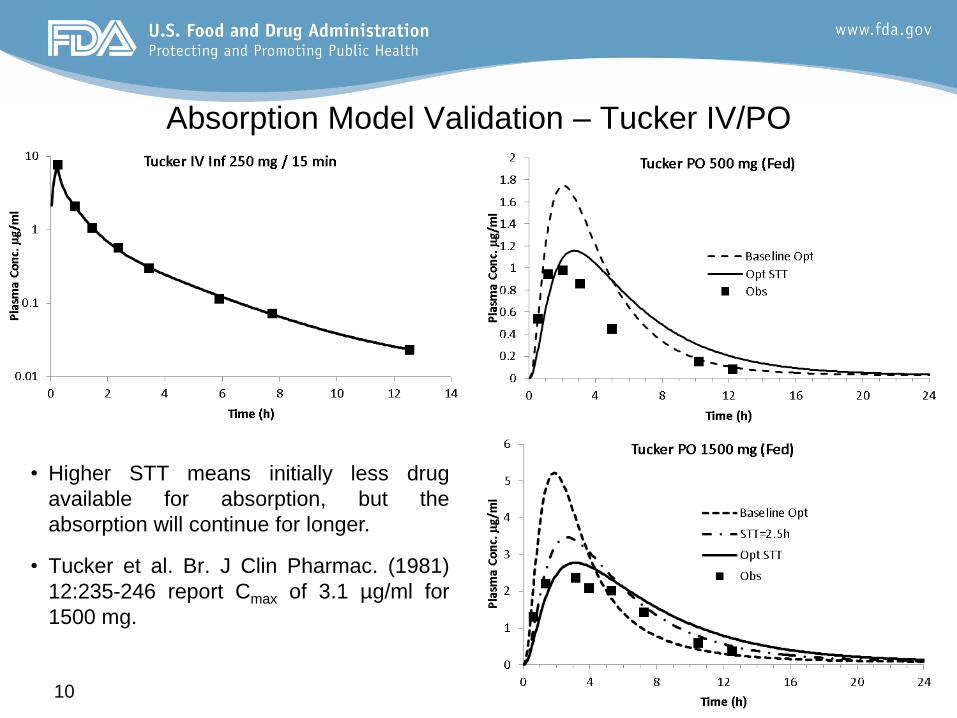
Absorption Model Validation – Tucker IV/PO
10
• Higher STT means initially less drug
available for absorption, but the
absorption will continue for longer.
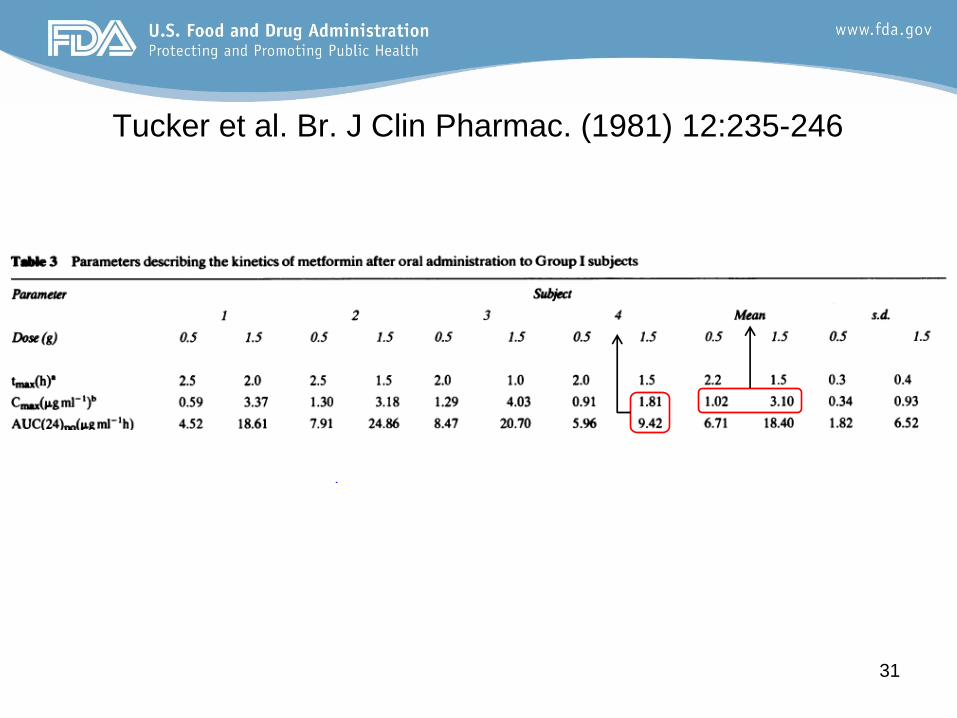
• Tucker et al. Br. J Clin Pharmac. (1981)
12:235-246 report Cmax of 3.1 µg/ml for
1500 mg.
Page 11
11
Absorption Model Validation – Pentikäinen IV/PO
• Little observed variability in renal
clearance between 3 subjects.
• Simulations based on default STT of
0.25h.
Page 12
12
Absorption Model Validation – BMS Study 3
• STT fixed at 1h for both simulations.
• CLr and Vmax scaling factors fitted against both IR doses.
Page 13
13
ER Formulation – BMS Study 3 / In Vitro Data
Fast-Medium 22
Fast-Slow 17
Medium-Slow 35
f2 Analysis
Apparatus
Medium
Volume
Paddle speed
USP 2
Phosphate buffer, pH 6.8
1000 ml
100 rpm
Average
(N=6)
• Tmax,Fed < Tmax,Fasted
• Cmax,Fasted-Fast > Cmax,Fasted-IR
• Fasted IR & Fast formulation Cp-t curves exhibit
similar initial rate of increase.
• Balan et al. 2001. JPS. 90(8):1176-1185: use of
numerical deconvolution failed for fasted data
set.
• ‘Extended’ convolution method required to
achieve (internally) predictive level A correlation.
Page 14
14
Procedure for Mechanistic Deconvolution
• Mechanistic deconvolution performed for fed and fasted arm of BMS clinical
data study 2.
• In vivo dissolution profile assumed to behave as double Weibull function.
• Initial estimate for in vivo dissolution profile obtained from in vitro data.
• STT, Vmax scaling factors and CLr fitted to average and individual Cp-t
profiles for IR formulation.
• STT additionally fitted to individual Cp-t profiles for ER formulations to study
effect on resulting IVIVC.
Page 15
15
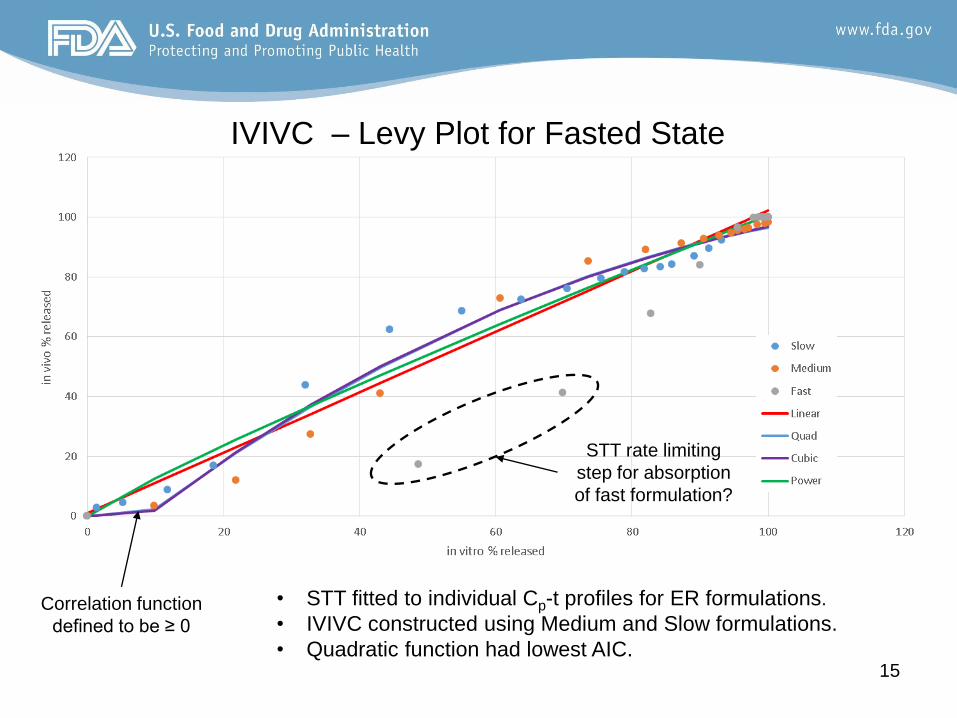
IVIVC – Levy Plot for Fasted State
• STT fitted to individual Cp-t profiles for ER formulations.
• IVIVC constructed using Medium and Slow formulations.
• Quadratic function had lowest AIC.
Correlation function
defined to be ≥ 0
STT rate limiting
step for absorption
of fast formulation?
Page 16
16
IVIVC – Validation Fasted State
STT=1.69 h
STT=1.63 h
STT=2.58 h
Average deconvolution, STT fitted to Avg ER profiles
Individual deconvolution, STT fitted to Ind ER profiles
Individual deconvolution, STT fitted to IR profile
Study Formulation Parameter %PE
AUC(0-t) ng h/ml 19.2
Cmax ng/ml 4.5
AUC(0-t) ng h/ml 12.4
Cmax ng/ml -10.3
AUC(0-t) ng h/ml 15.8
Cmax ng/ml 7.4
AUC(0-t) ng h/ml 5.7
Cmax ng/ml -14.0Fast Ext
Fasted
Slow Int
Medium Int
Avg Abs %PE Int
Study Formulation Parameter %PE
AUC(0-t) ng h/ml 3.9
Cmax ng/ml -23.0
AUC(0-t) ng h/ml -10.1
Cmax ng/ml -22.6
AUC(0-t) ng h/ml 7.0
Cmax ng/ml 22.8
AUC(0-t) ng h/ml -9.1
Cmax ng/ml -16.9
Avg Abs %PE Int
Fast Ext
Fasted
Slow Int
Medium Int
Study Formulation Parameter %PE
AUC(0-t) ng h/ml 10.5
Cmax ng/ml 7.0
AUC(0-t) ng h/ml 16.0
Cmax ng/ml -7.9
AUC(0-t) ng h/ml 13.2
Cmax ng/ml 7.4
AUC(0-t) ng h/ml 1.7
Cmax ng/ml -19.6
Avg Abs %PE Int
Fast Ext
Fasted
Slow Int
Medium Int
Page 17
17
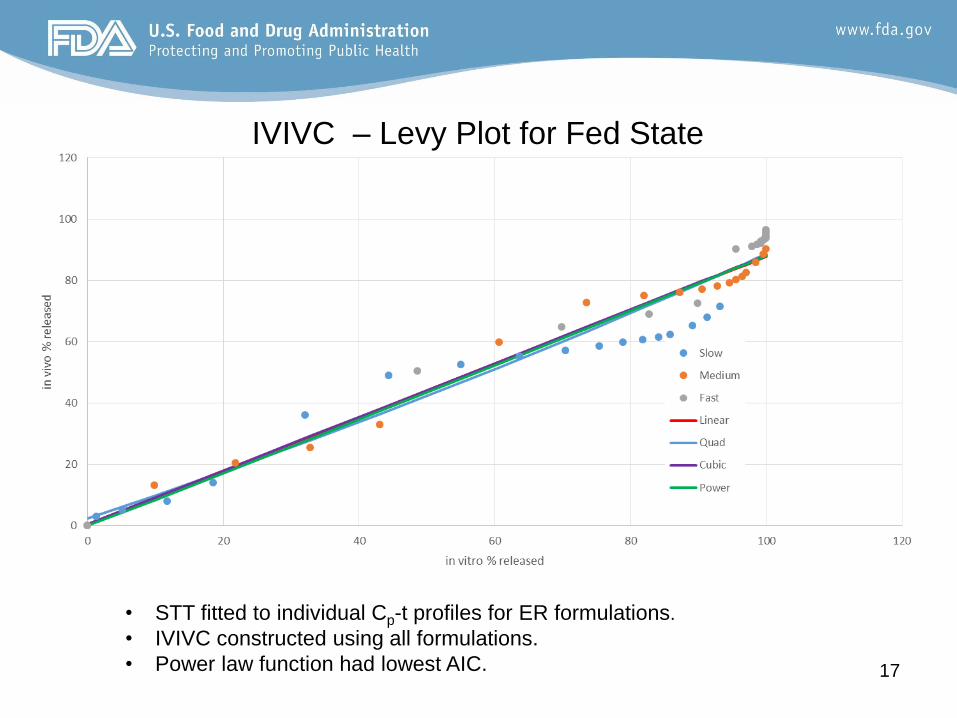
IVIVC – Levy Plot for Fed State
• STT fitted to individual Cp-t profiles for ER formulations.
• IVIVC constructed using all formulations.
• Power law function had lowest AIC.
Page 18
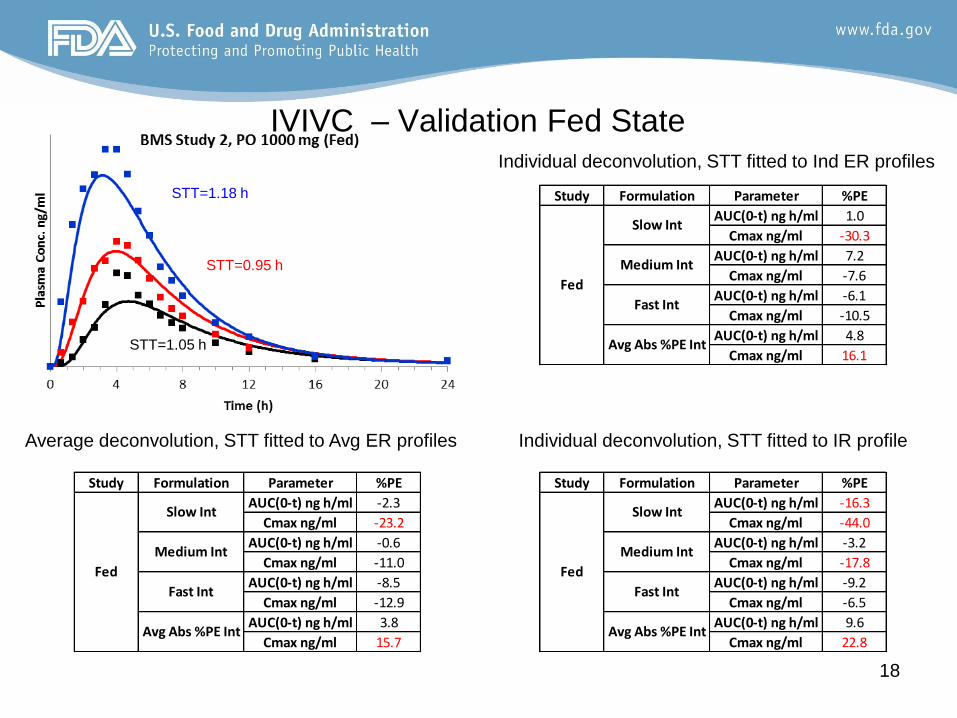
18
IVIVC – Validation Fed State Individual deconvolution, STT fitted to Ind ER profiles
Average deconvolution, STT fitted to Avg ER profiles Individual deconvolution, STT fitted to IR profile
STT=1.18 h
STT=0.95 h
STT=1.05 h
Study Formulation Parameter %PE
AUC(0-t) ng h/ml 1.0
Cmax ng/ml -30.3
AUC(0-t) ng h/ml 7.2
Cmax ng/ml -7.6
AUC(0-t) ng h/ml -6.1
Cmax ng/ml -10.5
AUC(0-t) ng h/ml 4.8
Cmax ng/ml 16.1Avg Abs %PE Int
Medium Int
Fast Int
Fed
Slow Int
Study Formulation Parameter %PE
AUC(0-t) ng h/ml -2.3
Cmax ng/ml -23.2
AUC(0-t) ng h/ml -0.6
Cmax ng/ml -11.0
AUC(0-t) ng h/ml -8.5
Cmax ng/ml -12.9
AUC(0-t) ng h/ml 3.8
Cmax ng/ml 15.7Avg Abs %PE Int
Medium Int
Fast Int
Fed
Slow Int
Study Formulation Parameter %PE
AUC(0-t) ng h/ml -16.3
Cmax ng/ml -44.0
AUC(0-t) ng h/ml -3.2
Cmax ng/ml -17.8
AUC(0-t) ng h/ml -9.2
Cmax ng/ml -6.5
AUC(0-t) ng h/ml 9.6
Cmax ng/ml 22.8Avg Abs %PE Int
Slow Int
Medium Int
Fast Int
Fed
Page 19
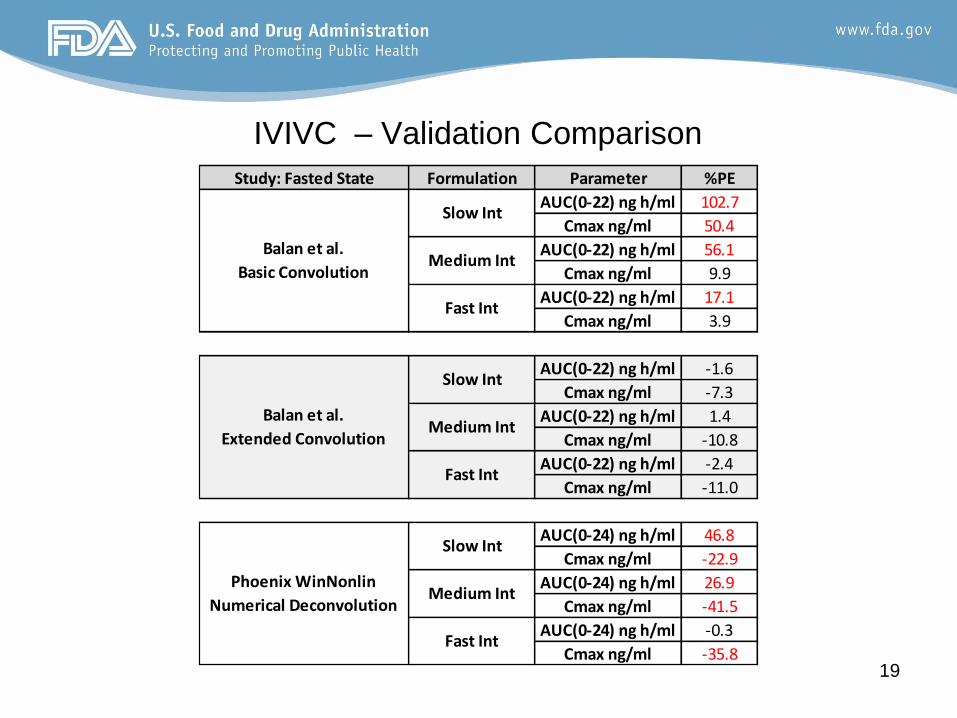
19
IVIVC – Validation Comparison
Study: Fasted State Formulation Parameter %PE
AUC(0-22) ng h/ml 102.7
Cmax ng/ml 50.4
AUC(0-22) ng h/ml 56.1
Cmax ng/ml 9.9
AUC(0-22) ng h/ml 17.1
Cmax ng/ml 3.9
AUC(0-22) ng h/ml -1.6
Cmax ng/ml -7.3
AUC(0-22) ng h/ml 1.4
Cmax ng/ml -10.8
AUC(0-22) ng h/ml -2.4
Cmax ng/ml -11.0
AUC(0-24) ng h/ml 46.8
Cmax ng/ml -22.9
AUC(0-24) ng h/ml 26.9
Cmax ng/ml -41.5
AUC(0-24) ng h/ml -0.3
Cmax ng/ml -35.8
Phoenix WinNonlin
Numerical Deconvolution
Slow Int
Medium Int
Fast Int
Balan et al.
Basic Convolution
Slow Int
Medium Int
Fast Int
Balan et al.
Extended Convolution
Slow Int
Medium Int
Fast Int
Page 20
20
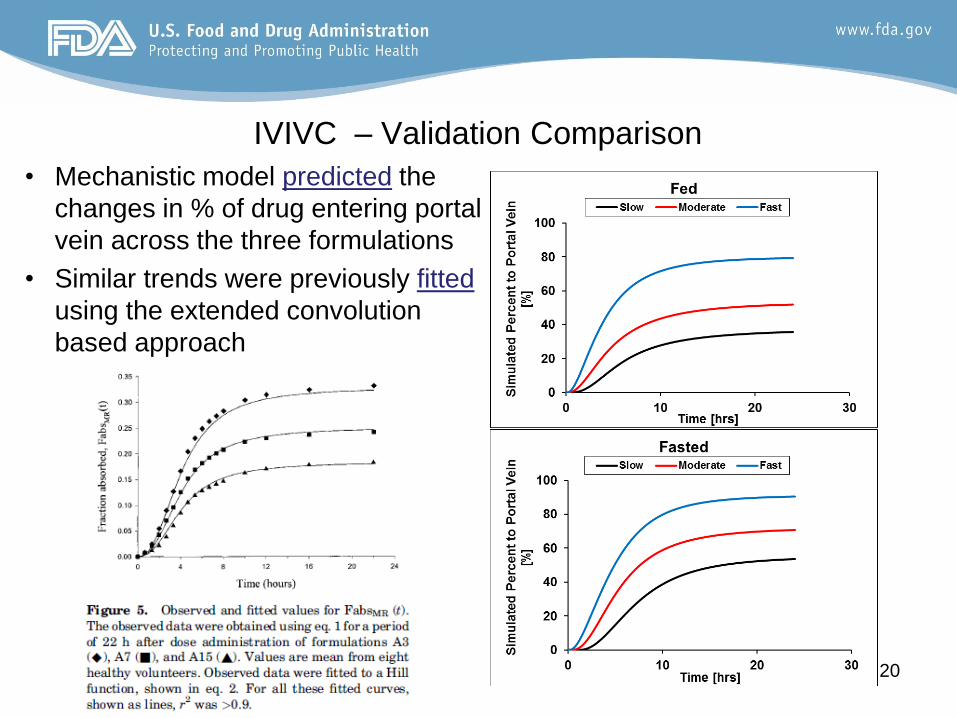
IVIVC – Validation Comparison
• Mechanistic model predicted the
changes in % of drug entering portal
vein across the three formulations
• Similar trends were previously fitted
using the extended convolution
based approach
Page 21
Conclusions
21
• Developed level A IVIVC is currently not adequately predictive but
even the preliminary IVIVC based on mechanistic model:
• performs better than numerical deconvolution and basic one-
stage direct convolution methods.
• does not require adjustment of bioavailable fraction to dose, as
required in extended convolution.
• Model predictions show that stomach transition time plays a critical
role in absorption behavior of metformin.
• Mechanistic absorption model predicts Cmax roughly proportional to
dose.
Page 22
22
Acknowledgments
• Peter Timmins Ph.D., Drug Product Science and Technology,
Bristol-Myers Squibb, Moreton, United Kingdom
• Jonathan Brown, Ph.D., Drug Product Science and Technology,
Bristol-Myers Squibb, Moreton, United Kingdom
• John Crison, Ph.D., formerly Drug Product Science and
Technology, Bristol-Myers Squibb, New Brunswick, NJ, USA
Page 23
23
Back Up slides
Page 24
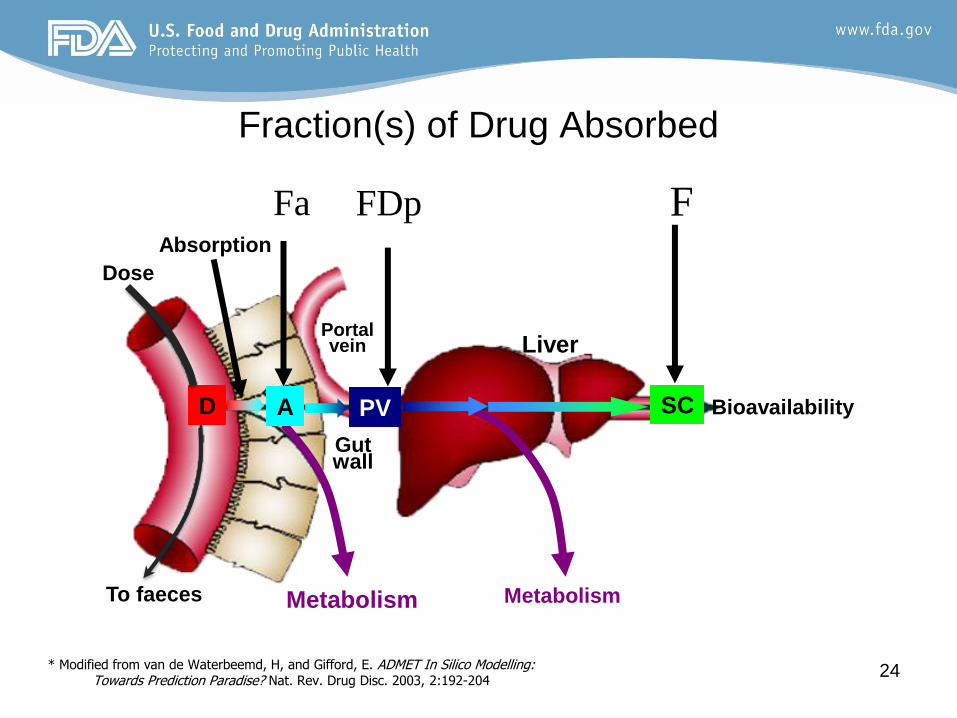
Fraction(s) of Drug Absorbed
24
F Fa
D PV
FDp Absorption
Metabolism Metabolism
A SC Bioavailability
Liver Portal vein
Gut wall
Dose
To faeces
* Modified from van de Waterbeemd, H, and Gifford, E. ADMET In Silico Modelling: Towards Prediction Paradise? Nat. Rev. Drug Disc. 2003, 2:192-204
Page 25
25
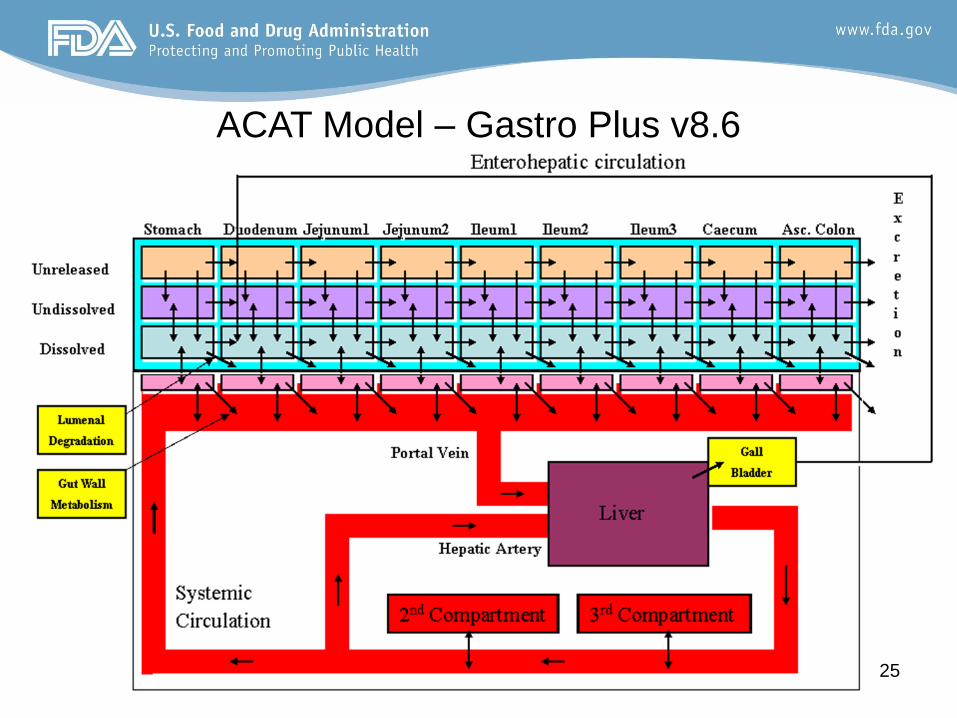
ACAT Model – Gastro Plus v8.6
Page 26
26
Permeability
Blood
Tight
Junction
Influx
Transporter
Efflux
Transporter
Paracellular
Transport
Passive
Diffusion
Page 27
27
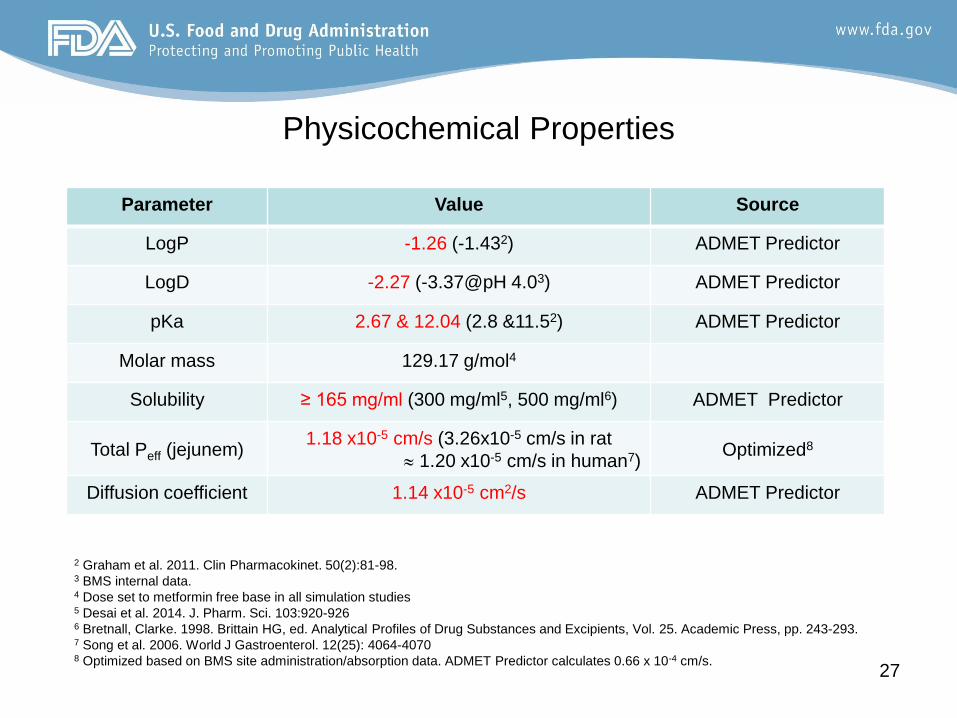
Physicochemical Properties
Parameter Value Source
LogP -1.26 (-1.432) ADMET Predictor
LogD -2.27 (-3.37@pH 4.03) ADMET Predictor
pKa 2.67 & 12.04 (2.8 &11.52) ADMET Predictor
Molar mass 129.17 g/mol4
Solubility ≥ 165 mg/ml (300 mg/ml5, 500 mg/ml6) ADMET Predictor
Total Peff (jejunem) 1.18 x10⁻⁵ cm/s (3.26x10⁻⁵ cm/s in rat
1.20 x10⁻⁵ cm/s in human7) Optimized8
Diffusion coefficient 1.14 x10⁻⁵ cm2/s ADMET Predictor
2 Graham et al. 2011. Clin Pharmacokinet. 50(2):81-98. 3 BMS internal data. 4 Dose set to metformin free base in all simulation studies 5 Desai et al. 2014. J. Pharm. Sci. 103:920-926 6 Bretnall, Clarke. 1998. Brittain HG, ed. Analytical Profiles of Drug Substances and Excipients, Vol. 25. Academic Press, pp. 243-293. 7 Song et al. 2006. World J Gastroenterol. 12(25): 4064-4070 8 Optimized based on BMS site administration/absorption data. ADMET Predictor calculates 0.66 x 10⁻⁴ cm/s.
Page 28
28
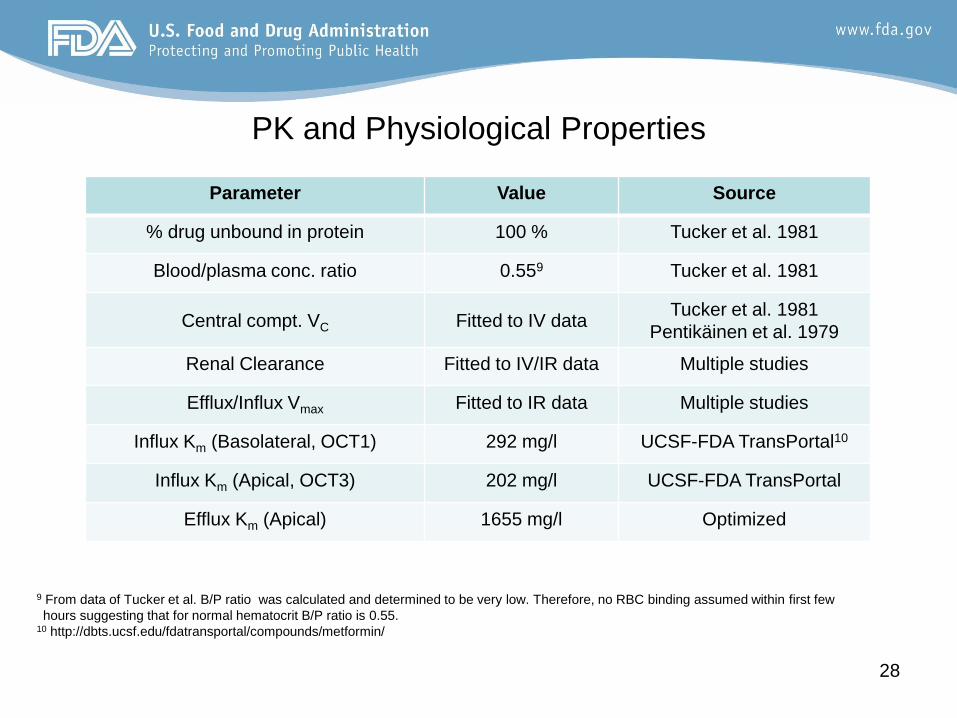
PK and Physiological Properties
Parameter Value Source
% drug unbound in protein 100 % Tucker et al. 1981
Blood/plasma conc. ratio 0.559 Tucker et al. 1981
Central compt. VC Fitted to IV data Tucker et al. 1981
Pentikäinen et al. 1979
Renal Clearance Fitted to IV/IR data Multiple studies
Efflux/Influx Vmax Fitted to IR data Multiple studies
Influx Km (Basolateral, OCT1) 292 mg/l UCSF-FDA TransPortal10
Influx Km (Apical, OCT3) 202 mg/l UCSF-FDA TransPortal
Efflux Km (Apical) 1655 mg/l Optimized
9 From data of Tucker et al. B/P ratio was calculated and determined to be very low. Therefore, no RBC binding assumed within first few
hours suggesting that for normal hematocrit B/P ratio is 0.55. 10 http://dbts.ucsf.edu/fdatransportal/compounds/metformin/
Page 29
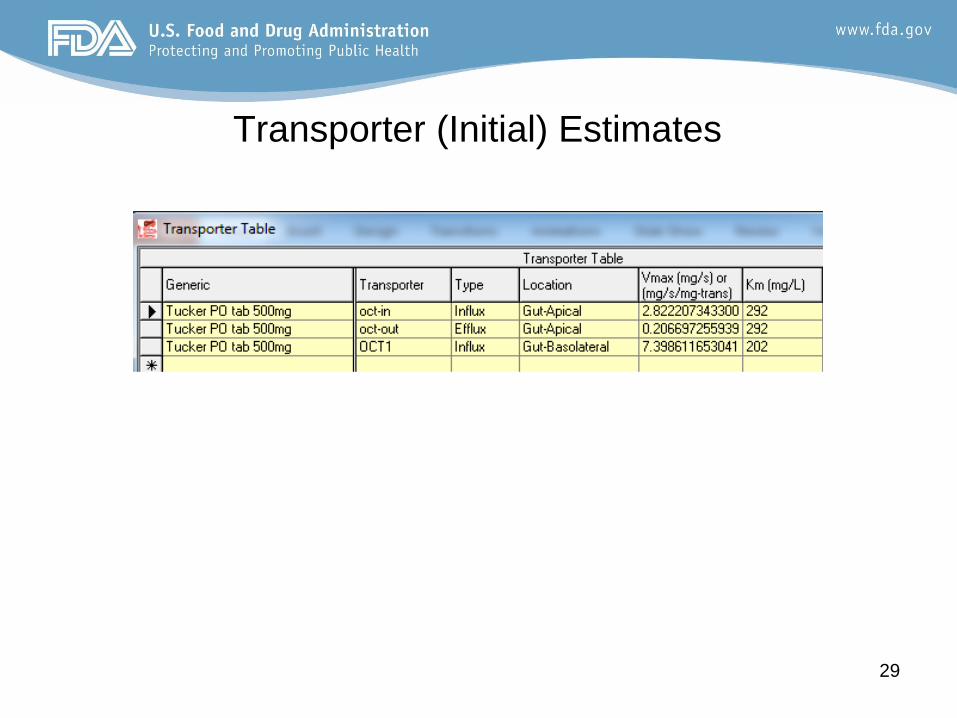
Transporter (Initial) Estimates
29
Page 30
Tucker et al. Br. J Clin Pharmac. (1981) 12:235-246
30
Page 31
Tucker et al. Br. J Clin Pharmac. (1981) 12:235-246
31
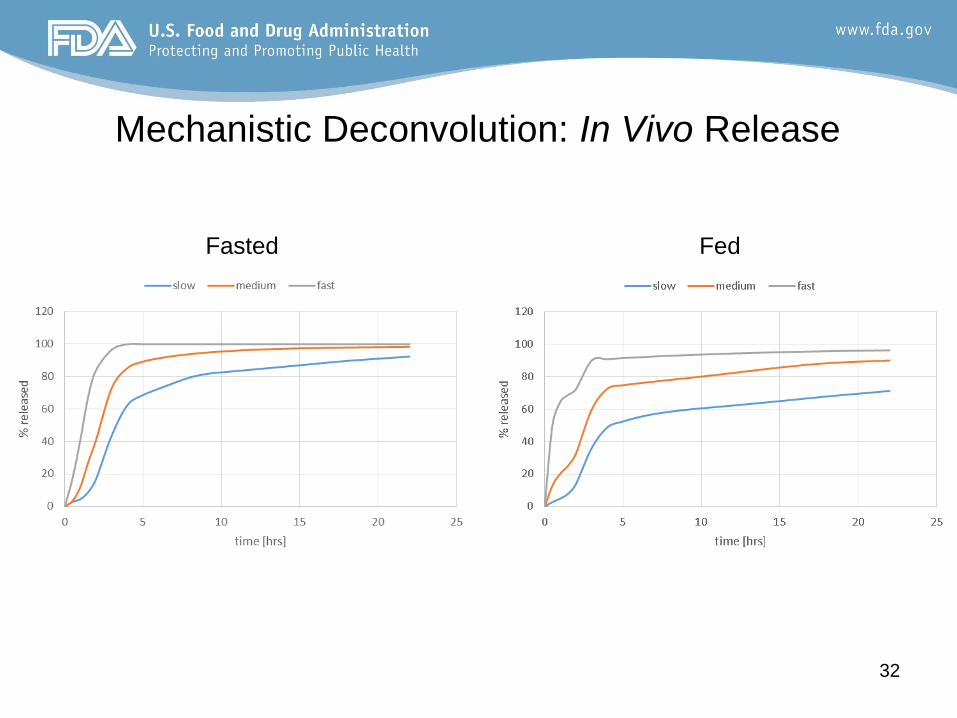
Page 32
32
Mechanistic Deconvolution: In Vivo Release
Fasted Fed