+ All Categories
Home > Documents > Methane emission during municipal wastewater...

Methane emission during municipal wastewater...

Date post: 15-Apr-2018
Category:
Upload: doankhanh
View: 216 times
Download: 2 times
Share this document with a friend
14
Methane emission during municipal wastewater treatment Matthijs R.J. Daelman a,b, *, Ellen M. van Voorthuizen c , Udo G.J.M. van Dongen a , Eveline I.P. Volcke b , Mark C.M. van Loosdrecht a,d a Department of Biotechnology, Delft University of Technology, Julianalaan 67, 2628 BC Delft, Netherlands b Department of Biosystems Engineering, Ghent University, Coupure links 653, 9000 Gent, Belgium c Royal Haskoning, P.O. Box 151, 6500 AD Nijmegen, Netherlands d KWR Watercycle Research Institute, P.O. Box 1072, 3433 PE Nieuwegein, Netherlands article info Article history: Received 29 December 2011 Received in revised form 14 March 2012 Accepted 16 April 2012 Available online 22 April 2012 Keywords: Digestion Greenhouse gas Methane Activated sludge Climate footprint abstract Municipal wastewater treatment plants emit methane. Since methane is a potent green- house gas that contributes to climate change, the abatement of the emission is necessary to achieve a more sustainable urban water management. This requires thorough knowl- edge of the amount of methane that is emitted from a plant, but also of the possible sources and sinks of methane on the plant. In this study, the methane emission from a full- scale municipal wastewater facility with sludge digestion was evaluated during one year. At this plant the contribution of methane emissions to the greenhouse gas footprint were slightly higher than the CO 2 emissions related to direct and indirect fossil fuel consump- tion for energy requirements. By setting up mass balances over the different unit processes, it could be established that three quarters of the total methane emission orig- inated from the anaerobic digestion of primary and secondary sludge. This amount exceeded the carbon dioxide emission that was avoided by utilizing the biogas. About 80% of the methane entering the activated sludge reactor was biologically oxidized. This knowledge led to the identification of possible measures for the abatement of the methane emission. ª 2012 Elsevier Ltd. All rights reserved. 1. Introduction During wastewater treatment, the greenhouse gases carbon dioxide (CO 2 ), methane (CH 4 ) and nitrous oxide (N 2 O) can be emitted to the atmosphere (Hofman et al., 2011). Carbon dioxide is produced indirectly as a result of fossil fuel combustion to generate the energy required for the operation of the wastewater treatment plant, or it is produced directly during the respiration of organic matter. In the latter case it concerns short-cycle carbon dioxide that does not contribute to increased atmospheric carbon dioxide concentrations. Nitrous oxide is expected to be emitted during biological nitrogen removal from wastewater, through nitrification and subsequent denitrification (Kampschreur et al., 2009). Since nitrous oxide has a global warming potential of 300 CO 2 - equivalents over a 100 year time horizon (IPCC, 2007), even a low emission contributes significantly to a WWTP’s green- house gas footprint. Not in the least due to its high impact, nitrous oxide emission from wastewater treatment processes recently received a lot of attention. Methane, having a global warming potential of 25 CO 2 -equivalents over a 100 year time horizon, is expected to be formed in the sewer system (Guisasola et al., 2008) and in those parts of the WWTP where anaerobic conditions prevail. Hitherto, the emission of * Corresponding author. Department of Biotechnology, Delft University of Technology, Julianalaan 67, 2628 BC Delft, Netherlands. Tel.: þ31 152781482. E-mail address: [email protected] (M.R.J. Daelman). Available online at www.sciencedirect.com journal homepage: www.elsevier.com/locate/watres water research 46 (2012) 3657 e3670 0043-1354/$ e see front matter ª 2012 Elsevier Ltd. All rights reserved. doi:10.1016/j.watres.2012.04.024
Transcript

ww.sciencedirect.com

wat e r r e s e a r c h 4 6 ( 2 0 1 2 ) 3 6 5 7e3 6 7 0

Available online at w

journal homepage: www.elsevier .com/locate/watres

Methane emission during municipal wastewater treatment

Matthijs R.J. Daelman a,b,*, Ellen M. van Voorthuizen c, Udo G.J.M. van Dongen a,Eveline I.P. Volcke b, Mark C.M. van Loosdrecht a,d

aDepartment of Biotechnology, Delft University of Technology, Julianalaan 67, 2628 BC Delft, NetherlandsbDepartment of Biosystems Engineering, Ghent University, Coupure links 653, 9000 Gent, BelgiumcRoyal Haskoning, P.O. Box 151, 6500 AD Nijmegen, NetherlandsdKWR Watercycle Research Institute, P.O. Box 1072, 3433 PE Nieuwegein, Netherlands

a r t i c l e i n f o

Article history:

Received 29 December 2011

Received in revised form

14 March 2012

Accepted 16 April 2012

Available online 22 April 2012

Keywords:

Digestion

Greenhouse gas

Methane

Activated sludge

Climate footprint

* Corresponding author. Department of BioTel.: þ31 152781482.

E-mail address: [email protected]/$ e see front matter ª 2012 Elsevdoi:10.1016/j.watres.2012.04.024

a b s t r a c t

Municipal wastewater treatment plants emit methane. Since methane is a potent green-

house gas that contributes to climate change, the abatement of the emission is necessary

to achieve a more sustainable urban water management. This requires thorough knowl-

edge of the amount of methane that is emitted from a plant, but also of the possible

sources and sinks of methane on the plant. In this study, the methane emission from a full-

scale municipal wastewater facility with sludge digestion was evaluated during one year.

At this plant the contribution of methane emissions to the greenhouse gas footprint were

slightly higher than the CO2 emissions related to direct and indirect fossil fuel consump-

tion for energy requirements. By setting up mass balances over the different unit

processes, it could be established that three quarters of the total methane emission orig-

inated from the anaerobic digestion of primary and secondary sludge. This amount

exceeded the carbon dioxide emission that was avoided by utilizing the biogas. About 80%

of the methane entering the activated sludge reactor was biologically oxidized. This

knowledge led to the identification of possible measures for the abatement of the methane

emission.

ª 2012 Elsevier Ltd. All rights reserved.

1. Introduction nitrogen removal from wastewater, through nitrification and

During wastewater treatment, the greenhouse gases carbon

dioxide (CO2), methane (CH4) and nitrous oxide (N2O) can be

emitted to the atmosphere (Hofman et al., 2011). Carbon

dioxide is produced indirectly as a result of fossil fuel

combustion to generate the energy required for the operation

of the wastewater treatment plant, or it is produced directly

during the respiration of organic matter. In the latter case it

concerns short-cycle carbon dioxide that does not contribute

to increased atmospheric carbon dioxide concentrations.

Nitrous oxide is expected to be emitted during biological

technology, Delft Univer

(M.R.J. Daelman).ier Ltd. All rights reserved

subsequent denitrification (Kampschreur et al., 2009). Since

nitrous oxide has a global warming potential of 300 CO2-

equivalents over a 100 year time horizon (IPCC, 2007), even

a low emission contributes significantly to a WWTP’s green-

house gas footprint. Not in the least due to its high impact,

nitrous oxide emission from wastewater treatment processes

recently received a lot of attention. Methane, having a global

warming potential of 25 CO2-equivalents over a 100 year time

horizon, is expected to be formed in the sewer system

(Guisasola et al., 2008) and in those parts of the WWTP where

anaerobic conditions prevail. Hitherto, the emission of

sity of Technology, Julianalaan 67, 2628 BC Delft, Netherlands.

.

wat e r r e s e a r c h 4 6 ( 2 0 1 2 ) 3 6 5 7e3 6 7 03658

methane from wastewater treatment received far less atten-

tion than the nitrous oxide emission.

Only two peer reviewed studies investigated the methane

emissions of municipal wastewater treatment plants with

activated sludge. Both studies used grab sampling to monitor

the emissions. Czepiel et al. (1993) studied a small (12,500 PE)

WWTP in Durnham, New Hampshire, USA; while Wang et al.

(2011) investigated the methane emission from a large plant

(1,500,000 PE) in Jinan, China. These WWTPs had no anaer-

obic digestion facility. The Dutch Foundation for Applied

Water Research monitored methane emissions on three

wastewater plants: Papendrecht (40,000 PE), Kortenoord

(100,000 PE) and Kralingseveer (360,000 PE) (STOWA, 2010).

The latter plant e which is also the subject of the present

study e had an anaerobic sludge digestion facility, while the

former two did not. The reported results from these studies

are presented in Table 1. The share of methane in the total

greenhouse gas emission from wastewater handling can

mount up to 75% expressed as CO2-equivalents (Foley and

Lant, 2007).

Methane is emitted from a WWTP after it enters the plant

via stripping from the incoming wastewater, or after it is

formed at the plant itself. The influent of a WWTP contains

dissolvedmethane that is formed in the sewer system. Recent

studies indicate thatmethane formation in sewer systems can

be substantial (Foley et al., 2009; Guisasola et al., 2008), but

actual quantities ofmethane entering aWWTPhave as yet not

been reported. As far asmethane production at the plant itself

is concerned, it can be expected that in anaerobic zones,

sludge thickeners and buffer and storage tanks methane is

formed. In plants equipped with a digester for the anaerobic

digestion of the surplus sludge, this can be expected to be

a major source of methane. The biogas from the digester is

usually combusted in a gas engine or flared, resulting in

methane emissions with the off-gas (Liebetrau et al., 2010;

Woess-Gallasch et al., 2010). Dissolved methane that leaves

the digester, sludge thickeners and storage tankswill either be

stripped during downstream processing (e.g. dewatering of

the digested sludge) or will remain dissolved in the reject

water and as such it will end up in the aeration tanks of the

WWTP, as does the methane in the influent stream. There it

Table 1 e Normalized methane emissions for the present studyas the methane emission factors used in the Netherlands by V

g CH4 person�1 year

Present study 306

Czepiel et al. (1993),a e Durnham WWTP 39

Wang et al. (2011),a e Jinan WWTP 11

STOWA (2010) e Papendrecht 266

STOWA (2010) e Kortenoord 140

STOWA (2010) e Kralingseveer (October) 310

STOWA (2010) e Kralingseveer (February) 230

VROM (2008)

WWTP with anaerobic sludge digestion

VROM (2008)

WWTP without anaerobic sludge digestion

a Based on grab samples.

b Expressed as kg CH4 (kg BOD5)�1.

can be stripped during aeration, or it can be biologically

oxidized by the microorganisms in the activated sludge. The

potential methane oxidation of activated sludge systems has,

to the authors’ best knowledge, not been reported in the

literature.

The objective of this study was to determine the contri-

bution of methane to the greenhouse gas footprint of

a wastewater treatment plant and to suggestmeasures to curb

methane emissions. To obtain these goals, a one-year

measurement campaign was carried out. The WWTP under

study is fully covered, except for the secondary settling tanks,

and all ventilation air is discharged through one stack. Gas

measurements allowed estimation of total methane emis-

sions, except for the exhaust of the biogas-based combined

heat and power facility. Mass balances were used to reveal the

sinks and sources of methane in this WWTP. Therefore,

additional gaseous and liquid sampling was performed. To

achieve reliable liquid sampling particular attention was paid

to the sampling method.

2. Materials and methods

2.1. Wastewater treatment plant process scheme

The measurements and sampling were done at Kralingseveer

WWTP, located in the municipality of Capelle aan den IJssel,

near Rotterdam, the Netherlands (51� 540 3000 N 4� 320 3500 E).The plant treats the domestic wastewater of 360,000 pop-

ulation equivalents (PE). The excess sludge of the plant is

treated in an anaerobic digester, operating at 34 �C. The

resulting biogas is used in a combined heat and power

installation that fulfills about 60% of the energy requirements

of the plant. The remainder of the plant’s energy needs is met

by electricity and natural gas from the grid.

Kralingseveer WWTP receives mainly domestic sewage,

with an average COD concentration of 339 mg L�1, an average

Total Kjeldahl Nitrogen concentration of 41 mg L�1 and an

average phosphorous concentration of 6 mg L�1. The removal

efficiencies are 87%, 92% and 77%, respectively. The average

sludge loading rate was 0.21 kg COD kg VSS�1 d�1.

and the other full-scale studies found in literature, as wellROM.�1 kg CH4 (kg CODinfluent)

�1 g CH4 (m3 influent)�1

1.13% 3.44

0.16%b 0.14

0.08% 0.16

0.87% 2.44

0.53% 1.56

1.20% 2.73

0.80% 2.03

0.85%

0.70%

wat e r r e s e a r c h 4 6 ( 2 0 1 2 ) 3 6 5 7e3 6 7 0 3659

Fig. 1 displays theWWTP’s process scheme, while an aerial

picture of the plant with the different unit processes is

provided in Supplementary material 1. The incoming waste-

water first passes through a bar screen and subsequently it

goes to a primary settler. The primary sludge is sent from the

primary settler to a gravitary thickener. The understream of

the thickener is fed to the anaerobic digester, while the

supernatant is returned to the primary settler. The water from

the primary settler enters a selector (4800 m3) and from there

it goes to an activated sludge reactor. This tank is a plug flow

reactor that consists of an anoxic part for denitrification

(3600 m3) and an aerated part for nitrification (8,000 m3). The

aeration is achieved with bubble aeration. From the aerated

zone, the mixed liquor is recycled to the anoxic zone at

a recycle ratio of three. From this plug flow reactor, the mixed

liquor flows into two parallel carousel reactors (2 � 13,750 m3)

that are aeratedwith surface aerators. From the carousels, the

mixed liquor goes to the secondary clarifiers. The secondary

sludge from the clarifiers is partially recycled to the selector

and the anoxic part of the second activated sludge system,

while the waste sludge is fed to a belt thickener and subse-

quently to the anaerobic digester, together with the thickened

primary sludge. Coming from the digester, the digested sludge

is stored in a buffer tank with a maximum residence time of

Influent

Effluent

Flu

9

88

2

0

0

0

0

1

2

12

8

8

12

1

11

2

0

0

0

Sludge

Water / Mixed liquor

Gas

Sampling point for on-line monitoring

Primary settling tank

Headworks

Selector tank

Anoxic plug flow tank

Aerated plug flow tank

Carousel tank

Secondary settlingtanks

Gravitar

OzoneCompost filter

Header

Outside air

Reject water

9

Fig. 1 e Process scheme of the Kralingseveer WWTP with the es

unit processes.

five days and from there it goes to a centrifuge. The dewatered

sludge is stored in a storage tank, from where it is loaded on

a truck for transport to an incineration facility. The reject

water from the belt thickener and the centrifuge are returned

to the primary settler.

Except for the secondary clarifiers, all process elements of

this WWTP are covered in order to collect the off-gas for gas

treatment. Apart from the off-gas coming from the plug flow

reactor and the carousel, all off-gas is collected and first

directed to a compost filter to avoid odor nuisance. The air

coming from the compost filter is blown into the headspace of

the covered carousel reactor. The off-gas from the plug flow

reactor and the carousel are finally disinfected in an ozone

washer before it is released through the flue gas stack. Since

the air coming from the compost filter is used to aerate the

carousel, the gas flow to the ozone washer makes up the off-

gas of the entire plant (except for emissions from the

secondary clarifiers).

2.2. On-line measurements of the plant’s total off-gas

From 14 October 2010 until 28 September 2011, gas was

withdrawn from the off-gas pipes going from the carousel and

the plug flow reactor to the ozone washer. After passing

e gas

Flue gas

12

0

0

0

0

0

0

0

0

4

1

2

2

1220

1

y thickener

washer

Belt thickeners

Anaerobic digester Digested sludgebuffer tank

Centrifuges

Dewatered sludgestorage tank

Cogeneration

timated mass flow rates (kg CH4 hL1) between the different

wat e r r e s e a r c h 4 6 ( 2 0 1 2 ) 3 6 5 7e3 6 7 03660

through a condenser, the gas was directed to an on-line Ser-

vomex 4900 infrared gas analyzer, resulting in an estimation

of methane in the overall off-gas flow leaving the water line

and the sludge line of the plant. The gas flow rates in the off-

gas pipes were measured weekly using a Tesco 435 hot wire

anemometer. Since the blowers of the off-gas collection

system were operated at constant power, the gas flow rates

were constant. By multiplying the measured concentrations

with the prevailing flow rate in the off-gas pipes, the methane

fluxes from the plug flow reactor and the carousel were

calculated.

2.3. Mass balances over each unit process

In order to identify the sources and sinks of methane on the

plant, a mass balance was set up over each unit process.

Therefore, the methane load in every single liquid and gas

stream had to be calculated from themeasured flow rates and

corresponding concentrations. A detailed overview of these

calculations is provided in Supplementary material 2. The

required measurements and sampling took place five times

between 4 March and 12 August 2011, except for the exhaust

gas of the cogeneration unit, which was measured only once.

Flow rates of the gaseous streams were measured using an

anemometer, while gas samples were collected with gas bags.

The concentrationof the content of the gas bagswasmeasured

with a Varian 3800 gas chromatograph equipped with a flame

ionization detector (GC-FID). Flow rates of liquid streamswere

either available from the plant’s SCADA system, or could be

calculated from available data. Dissolved methane concen-

trationsweremeasuredwith the salting-outmethoddescribed

below. For each stream, themethane loads determined during

the five measurement campaigns were averaged.

For each unit process, the difference between the average

methane load coming in and going out is the amount of

methane that is produced or converted. In other words, it is

possible to identify sources and sinks ofmethane on the plant,

respectively. A unit process was only positively identified as

a methane source or sink if the standard deviation of the load

was smaller than the methane production or consumption.

2.4. Salting-out method for sampling methane in theliquid phase

For sampling dissolved methane, the salting-out method of

Gal’chenko et al., (2004) was slightly adapted. The protocol

that was used in this study can be found in Supplementary

material 3. Before the start of each sampling round, serum

bottles of 120 mL were filled with 20 g NaCl. At the different

sampling locations at theWWTP, sampleswere collectedwith

a sampling beaker. From this beaker, 50 mL of sample was

added carefully to a serum bottle filled with salt, using

a syringe with a catheter tip and a 10 cm silicone tube. While

emptying the syringe into the bottle, the silicon tube was held

under the rising liquid surface in order to keep the liquidegas

interface as small as possible to avoid stripping. Immediately

after adding the syringe content to the bottle, the bottle was

sealed with a rubber stopper and an aluminum cap. The

sealed bottle was shaken vigorously in order to speed up the

dissolving of the salt.

At 20 �C the solubility of NaCl in water is about 360 g L�1, so

these samples, containing 400 g NaCl L�1, were over-

saturated. As a consequence of the high salt concentration,

the microbial activity in the sludge samples is halted, and the

dissolved gases are salted out. Gal’chenko et al., (2004) also

added potassium hydroxide and/or merthiolate to the sample

as a bactericide, but this was omitted in the samples from the

WWTP since high salt concentrations (even far below satu-

ration) are known to inhibit microbial activity both in the

activated sludge (Pernetti and Di Palma, 2005; Zobell et al.,

1937) and in the anaerobic digestion process (Feijoo et al.,

1995).

Dissolvedmethane, but also the other dissolved gases such

as carbon dioxide escape from the liquid phase to the head-

space of the serum bottles. This results in a pressure build-up

in the headspace. Gal’chenko et al., (2004) neglected this

pressure build-up, but for the samples of the present study,

the pressure build-up was clearly noticeable since they con-

tained substantially higher amounts of dissolved gases.

Therefore it was necessary to take into account the pressure

build-up due to the salting-out of the dissolved gases. Before

sampling the headspace of the samples for analysis with GC-

FID, the pressure in the headspace was equilibrated with the

atmosphere by allowing the gas in the headspace to expand in

a submerged graduated syringe. The increase in gas volume

was used to calculate the pressure build-up in the headspace.

After the gas pressure in the headspace was brought to

atmospheric pressure, the headspace was sampled with a gas

syringe and analyzed. The amount of methane in the head-

space before expansion was calculated from the concentra-

tion, the measured volume of the headspace of the sealed

bottle and the headspace pressure after the pressure build-up

that was calculated from the volume expansion of the head-

space. Before the sample was saturated with salt, this amount

of methane was completely dissolved in the liquid sample. By

dividing this amount by the sample volume (50 mL) the orig-

inal methane concentration in the liquid was established.

In order to compare the salting-out method with another

method that had been used to sample dissolved methane,

seventeen liquid streams with a solids content that was low

enough to allow easy filtering were sampled using both the

salting-out method of the present study and the vacuum tube

method of Guisasola et al. (2008). According to the latter

method, a syringe was filled with the sampled liquid. With

a syringe driven filter unit and a hypodermic needle, the liquid

was injected in an 11 mL Vacutainer blood serum tube (BD

Diagnostics #367896).With a sample volume of 5mL, ca. 97%of

the methane is transferred to the headspace (Guisasola et al.,

2008). The headspace was sampled with GC-FID. The amount

of methane in the Vacutainer was calculated using Henry’s

law and a mass balance. The volume of the sample in the

Vacutainer was determined by weight. This validation was

also performed in the laboratory by sampling two prepared

solutions of methane dissolved in water with both the salting-

out method and the vacuum tube method. The solutions had

an approximate concentration of 0.5 and 2.5 mg L�1. For each

solution and for eachmethod, samplingwas done in triplicate.

It was observed that empty Vacutainers after equilibrating

with the atmosphere already contained about 400 ppm of

methane. This methane possibly originated from the clot

wat e r r e s e a r c h 4 6 ( 2 0 1 2 ) 3 6 5 7e3 6 7 0 3661

activator coating on the inside of the tube wall. In order to

verify this, a number of uncoated Vacutainer urine collection

tubes (BD Bioscience #364915) were tested for the presence of

methane. Also these uncoated tubes contained about 400 ppm

of methane. These measurements were done with GC-FID,

and corroborated with the infrared gas analyzer that was

used for the on-line methane measurements at the WWTP.

Both in the field and in the laboratory validation, the total

amount of methane in the sample tubes was reduced with the

average amount of methane that was measured in six empty

Vacutainer tubes.

3. Results

3.1. Total methane emission from the WWTP

The daily average methane emission from the entire treat-

ment plant at Kralingseveer during the measuring campaign

(from 14 October 2010 until 28 September 2011) was

302 kg CH4 d�1, with a standard deviation of 83 kg CH4 d

�1. The

reported totalmethane emission comprises allmethane in the

off-gas that is collected in the plant’s ventilation system and

sent to the ozonewasher, but the plant has two parts of which

the off-gas is not collected for disinfection in the ozone

washer: the uncovered secondary settlers and the exhaust of

the gas engines of the cogeneration plant. The secondary

settlers may emit some methane, but from the mass balance

over the secondary settlers it appears that this amount will be

very low (Table 2). The measured methane slip due to

incomplete combustion in the gas engines was 1.3%, resulting

in an additional methane emission of 38 kg CH4 d�1.

The Dutch Ministry of Housing, Spatial Planning and the

Environment (VROM, 2008) provided emission factors that are

based on the IPCC inventory guidelines (IPCC, 2006). In order to

allow comparison with these emission factors and with the

results from other studies, the plant’s total methane emission

can be normalized in several ways: by population served, by

wastewater flow or by incoming COD. Table 1 summarizes the

resulting emission factors, as well as the emission factors

from the other reported full-scale studies and the VROM

emission factors. Apparently, about 1% (0.53e1.20%) of the

incoming COD is emitted as methane in the Dutch treatment

plants. At the Durnham plant, 0.16% of the incoming BOD5

was emitted as methane, while at the Jinan plant, the emis-

sion factor was 0.08% of the incoming COD.

3.2. Sinks and sources of methane

All the methane containing streams of the WWTP are sum-

med up in Table 2, while Fig. 1 shows the KralingseveerWWTP

lay-out with the estimated methane mass flow rates between

the different unit processes. Using these mass flow rates,

mass balances of methane were constructed over every unit

process. From these mass balances, sources and sinks of

methane could be identified.

For sampling dissolved methane, a method was used that

consisted of salting-out the methane and analyzing the head-

space of the recipient with gas chromatography. The method

was validated by sampling a number of streams with both the

salting-out method and with a vacuum tube method. Fig. 2

shows the result for the validation. The results obtained by

both methods correlate extremely well (R2 ¼ 0.99). The valida-

tion in the laboratory also yielded satisfactory results (Table 3).

Sources of methane at the plant itself are the primary

sludge thickener, the exhaust gas of the cogeneration plant,

the buffer tank for the digested sludge and the storage tank for

the dewatered sludge. The latter two contribute substantially

to the methane emission from the plant. From Table 2, it can

be calculated that the buffer tank is responsible for 40� 15% of

the emission from the carousel reactor and 35 � 13% in the

total methane emission, while the dewatered sludge storage

tank has a share of 17 � 8% in the emission from the carousel

and 15 � 6% in the total methane emission. Expressed as

specific methane production rate, the buffer tank for the

digested sludge produced about 3.5 g CH4 kg�1 TSS d�1, while

the storage tank for the dewatered sludge produced about

1 g CH4 kg�1 TSS d�1. To compare, the digester had a produc-

tion rate of 9 g CH4 kg�1 TSS d�1.

Besides themethane produced on the plant itself, methane

also enters the plant from outside via the influent. The

influent contains methane that has been formed in the sewer.

The methane load was estimated as 1% of the influent COD

load. From the measurements it was clear that a significant

amount (roughly 80% of the dissolvedmethane in the influent,

cf. Table 2 and Fig. 1) of methane is oxidized in the plug flow

reactor. From Fig. 3 it appears that methane was removed in

the aerated part of the plug flow tank only.

3.3. Methane emission dynamics

Fig. 4 shows the variation of the daily average methane

emissions from the full treatment plant during the entire

measurement period. Of the total methane emission, about

12% on average comes from stripping of methane in the plug

flow reactor, while the remaining 88% is coming from the

headspace of the carousel reactor. The methane in the off-gas

from the plug flow reactor is only methane that is stripped

after it enters the tank, since the tank is aerated with fresh air

only. The emission from the carousel reactor is higher than

the emission from the plug flow reactor, because the carousel

is aerated with methane containing air coming from the

compost filter. The compost filter treats the off-gas from all

covered parts of the plant, except for the plug flow and the

carousel reactor. It can reasonably be expected that that most

of themethane coming from the carousel reactor is effectively

derived from this ventilation air.

Fig. 5 shows the on-line methane emission from the plug

flow reactor and the on-line flow rate of the influent. The

graph shows the diurnal variation of both variables during one

arbitrary week in the measurement period. The coefficient of

determination R2 between influent flow rate and methane

emission from the plug flow reactor was 0.20 for the entire

measurement period.

Fig. 6 compares the on-line methane emission from the

carousel reactor, which amounts to the off-gas from the

ventilation system, with the on-line sludge content of the

dewatered sludge storage tank. Again, the graph shows an

arbitrary week in the measurement period. For the entire

measurement period, the linear correlation (R2) between the

Table 2 e Methane mass balances over the various unit processes (kg CH4 hL1).

In Out Balance

x � s x � s x � s

Headworks Influent 9 � 3 Water to primary

settling tank

8 � 3

Off-gas 0 � 0

Total 9 � 3 Total 8 � 3 �1 � 4

Primary settler Water from headworks þ reject

water from centrifuges,

belt thickeners and gravitary

thickener for primary sludge

8 � 2 Water to selector tank 8 � 3

Primary sludge 0 � 0

Off-gas 1 � 1

Total 8 � 2 Total 9 � 3 2 � 4

Selector Water from primary settling tank 8 � 3 Liquor to plug flow reactor 8 � 3

Return sludge 0 � 0 Off-gas 2 � 1

Total 8 � 3 Total 9 � 3 1 � 4

Plug flow reactor Liquor from selector 8 � 3 Liquor to carousel reactor 0 � 0

Return sludge 1 � 1 Off-gas 2 � 1

Total 9 � 3 Total 2 � 1 �7 � 3

Carousel reactor Liquor from plug flow reactor 0 � 0 Liquor to secondary

settling tank

0 � 1

Air from compost filter 12 � 3 Off-gas 11 � 3

Total 12 � 3 Total 11 � 3 �1 � 5

Secondary

settling tank

Liquor from carousel reactor 0 � 1 Effluent 0 � 0

Secondary sludge 2 � 1

Total 0 � 1 Total 2 � 1 1 � 1

Belt thickeners Excess sludge supply 0 � 0 Thickened sludge

to digester

0 � 0

Reject water to primary

settling tank

0 � 0

Off-gas 0 � /

Total 0 � 0 Total 0 � 0 0 � 0

Gravitary thickener

for primary sludge

Primary sludge 0 � 0 Overflow to primary

settling tank

0 � 0

Thickened primary sludge 0 � 0

Off-gas 1 � 1

Total 0 � 0 Total 1 � 1 1 � 1

Anaerobic digester Total sludge supply 0 � 0 Effluent to buffer tank 0 � 0

Gas to cogeneration 122 � 28

Total 0 � 0 Total 122 � 28 122 � 28

Digested sludge

buffer tank

Effluent from digester 0 � 0 Digested sludge to

centrifuges

0 � 0

Off-gas 4 � 1

Total 0 � 0 Total 5 � 1 4 � 1

Centrifuges Digested sludge from

buffer tank

0 � 0 Dewatered sludge to

storage tank

0 � 0

Reject water to primary

settling tank

0 � 0

Off-gas 1 � 5

Total 0 � 0 Total 0 � 5 0 � 0

Dewatered sludge

storage tank

Dewatered sludge from

centrifuges

0 � 0 Dewatered sludge for

incineration

0 � 0

Off-gas 2 � 1

Total 0 � 0 Total 2 � 1 2 � 1

Compost filter Off-gas to filter 12 � 4 Gas to carousel reactor 12 � 3

Total 12 � 4 Total 12 � 3 0 � 5

Cogeneration Biogas from digester 122 � 28 Methane slip 2 � 0

Additional natural gas from grid 3

Total 125 � 28 Total 2 � 0 �123 � 28

x � s designates mean � standard deviation.

wat e r r e s e a r c h 4 6 ( 2 0 1 2 ) 3 6 5 7e3 6 7 03662

dewatered sludge content in the storage tank and the emis-

sion from the carousel reactor was 0.44.

In order to explain the long-term variation of the methane

emission during the measurement period, the possible

correlations between the daily emission and the daily values

of a number of relevant process variables were checked (Table

4). The emission from the plug flow reactor was only slightly

correlated with the temperature of the mixed liquor (which

y = 0.9276x + 0.0732R² = 0.9926

0.0

1.0

2.0

3.0

4.0

5.0

0.0 1.0 2.0 3.0 4.0 5.0

Con

cent

ratio

n Va

cuta

iner

m

etho

d (m

g/L)

Concentration salting-out method (mg/L)

Fig. 2 e Scatter plot of dissolvedmethane concentrations as

determined with the salting-out method and with the

vacuum tube method.

0.00.10.20.30.40.50.60.70.80.91.0

0 50 100 150 200 250 300

Distance along the plug flow pattern (m)

Dis

solv

ed m

etha

ne (m

g L-1

) ANOXIC AERATED

Fig. 3 e Dissolved methane concentration along the path of

the plug flow.

wat e r r e s e a r c h 4 6 ( 2 0 1 2 ) 3 6 5 7e3 6 7 0 3663

ranged from 8.7 to 21.4 �C). For the emission from the carousel

reactor and the ventilation system (i.e. after the compost

filter), there was only a (weak) correlation with the amount of

sludge that was stored in the dewatered sludge storage tank.

For the digested sludge buffer tank, data about the stored

amount of sludge were not available.

During the monitoring period, the anaerobic digester had

anaverage residence timeof 26days. Thismay cause a time lag

between the effect of the anaerobic digestion related process

variables on the actual methane emissions. To suppress the

effect of this time lag, the relationships between the emission

and the variables related to the anaerobic digestion process on

the plant were also verified using themoving averages over 26

days. The results are shown in Table 5. Indeed, the correlations

for the moving averages over 26 days turned out higher than

the correlations between the daily values. The emission from

the carousel and the ventilation system appears to correlate

relatively well with the residence time of the sludge in the

anaerobic digester, with the amount of sludge that is fed to the

dewatering centrifuges and with the amount of sludge stored

in the dewatered sludge storage tank.

4. Discussion

4.1. Sampling method for dissolved methane

The validation of the salting-out method by comparing the

method with the vacuum tube method yielded very good

Table 3e Results from laboratory validation of salting-outmethod and vacuum tube method.

Approximateconcentrationof preparedsolution (mg L�1)

Concentrationdetermined bysalting-out

method (mg L�1)

Concentrationdeterminedby vacuumtube method

(mg L�1)

x � s x � s

0.5 0.51 � 0.02 0.48 � 0.05

2.5 2.78 � 0.09 2.36 � 0.21

x � s designates mean � standard deviation.

results, both in the field and in the laboratory. The salting-out

method is accurate, and since the standard deviation of the

replicas of the salting-out method was smaller than the

standard deviation of the replicas of the vacuum tubemethod,

it is in fact even more precise.

The Vacutainers that were used for the validation were

blood serum tubes with a clot activator coating (BD Bioscience

#367896) similar to the ones used by Foley et al. (2009) (BD

Bioscience #367895). It was found out that empty Vacutainers

after equilibrating with the atmosphere already contained

about 400 ppmmethane. The supplier of the Vacutainer tubes

could not give any information regarding the presence of

methane. Nonetheless, Genge (1991) showed that coated ster-

ilizedVacutainer tubes (BectonDickinson) indeedcontainedup

to 248 ppm of methane. According to Genge, the gamma ster-

ilization applied to the tubes cross-links the silicone polymers

in the coating. During thisprocess,methane is split out causing

contamination.However,uncoatedVacutainerurinecollection

tubes (BD Bioscience #364915) also contained about 400 ppmof

methane. Possibly themethane comes from the rubber septum

or the plastic of which the tube itself is made instead of from

the coating, but that is irrelevant for the present study.

The salting-out method has some practical advantages

over other methods. No toxic compounds are used for stop-

ping the biological consumption or production of methane. In

previous studies, this is usually obtained by using inhibiting

compounds, such as mercury chloride (Hatamoto et al., 2010;

Wang et al., 2011). However, the use of toxic inhibiting

compounds may have a harmful effect on the environment

and also puts the scientist at risk for harmful exposure to

these chemicals. Another way to inhibit biological activity

after taking the sample is by filtering the sample before it is

brought into the recipient (Foley et al., 2009; Guisasola et al.,

2008, 2009), but filtration is only possible for liquids with low

solids content, like settled wastewater or treated effluent. On

the contrary, the salting-out method can also be applied to

slurries like digested sludge or thickened sludge.

4.2. Methane emission compared to carbon dioxideemission

The plant’s total methane emission, 2728 ton year�1 expressed

as CO2-equivalents, exceeded the carbon dioxide emission

0

100

200

300

400

500

600

700

Oct-10

Nov-10

Dec-10

Jan-11

Feb-11

Mar-11

Apr-11

May-11

Jun-11

Jul-11Aug-11

Met

hane

em

issi

on (k

g d

)

Plug flow reactor Carousel + Ventilation

Sep-11

Fig. 4 e Daily methane emission from the plug flow reactor, and from the carousel and the ventilation system.

wat e r r e s e a r c h 4 6 ( 2 0 1 2 ) 3 6 5 7e3 6 7 03664

related to electricity and natural gas consumption

(1500 ton year�1). In the other two Dutch plants, the methane

emission was far lower than the carbon dioxide emission

(STOWA, 2010). In theKortenoord plant, themethane emission

amounted to 960 ton CO2-equivalents year�1, while carbon

dioxide was emitted at a rate of 5820 ton year�1. In Papen-

drecht, the methane emission was 730 ton CO2-

equivalents year�1 and the carbon dioxide was 3458 ton year1.

Since thenormalizedmethane emissions from the threeDutch

plants did not differ that much from each other in comparison

with the emission from the Jinan and theDurhamplants (Table

1), the higher emission of carbon dioxide from Papendrecht

and Kortenoord compared to those plants’ methane emission

was due to their higher indirect carbon dioxide emission.

Kortenoord and Papendrecht emitted about 0.41 and

0.46 kg CO2 m3 wastewater, respectively, while Kralingseveer

emitted only 0.05 kg CO2 m3 wastewater. This difference was

due to the presence of the anaerobic digester at Kralingseveer.

It produced enough biogas to provide about 60% of the plants

energy requirements, while Kortenoord and Papendrecht took

all required energy from the gas and power grid.

0

1

2

3

4

5

6

7Methane emission

Fig. 5 e On-line methane emission from the plug flow reactor an

The vertical gridlines indicate midnight. 18 March 2011 was a w

For the Durham and Jinan plants, the ratio between the

methane and the carbon dioxide emission could not be

calculated. Wang et al. (2011) did not measure carbon dioxide.

Czepiel et al. (1993) only measured methane and the biologi-

cally produced carbon dioxide that was emitted from the

reactors, but not the carbon dioxide that was produced indi-

rectly as a result of fossil fuel combustion to generate the

energy required for the operation of thewastewater treatment

plant. Only the latter contributes to increased atmospheric

carbon dioxide concentrations.

4.3. Sinks and sources of methane

4.3.1. The headworksAt the Kralingseveer WWTP, quite some methane entered the

plant via the incoming wastewater. The amount that was

stripped in the headworks was negligible. Most of the

methane that was formed in the sewer went through the

headworks to the primary settler, to the selector and finally to

the plug flow reactor. The total methane emission from these

four parts amounted to 31 � 16% of the total methane

0

2000

4000

6000

8000

10000

12000

Influ

ent f

low

rate

(m3

h- 1)

Influent flow rate

d on-line influent flow rate during one week in March 2011.

et weather day.

Stor

ed d

ewat

ered

slu

dge

(m³)

Met

hane

em

issi

on (m

³ h-1

)

Methane emission Stored dewatered sludge

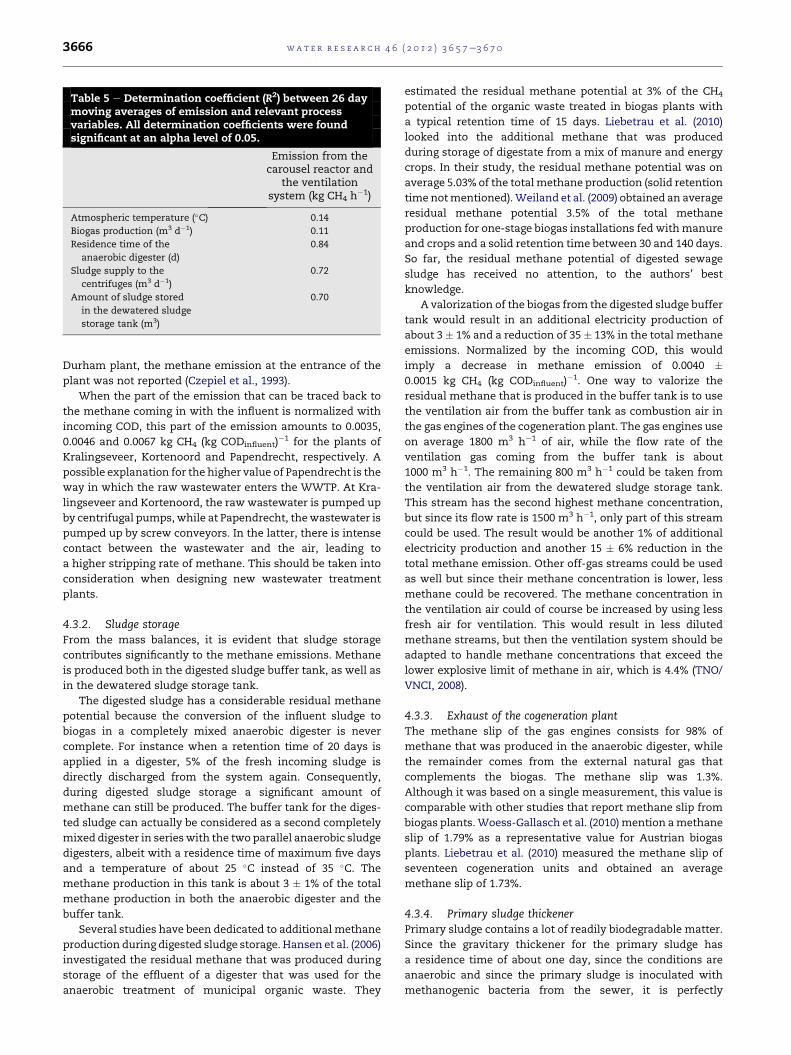
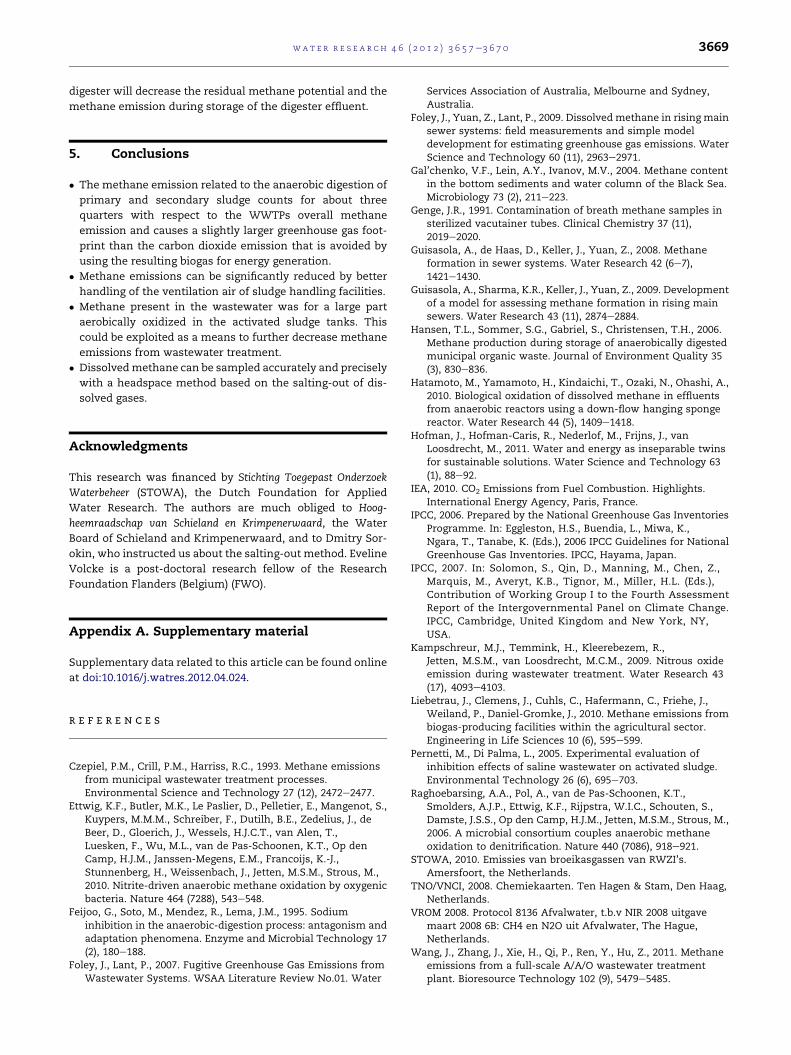
Fig. 6 e On-line methane emission from the carousel reactor and the ventilation system, and on-line volume of the

dewatered sludge storage tank content during one week in April 2011. The vertical gridlines indicate midnight.

wat e r r e s e a r c h 4 6 ( 2 0 1 2 ) 3 6 5 7e3 6 7 0 3665

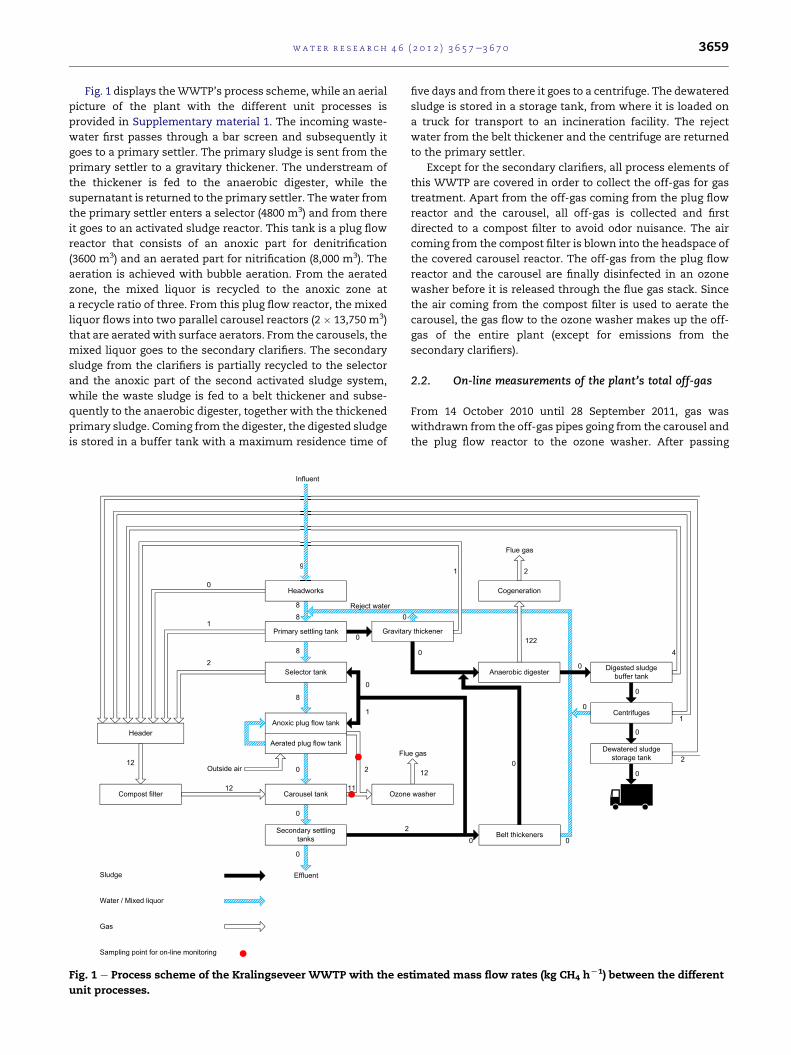
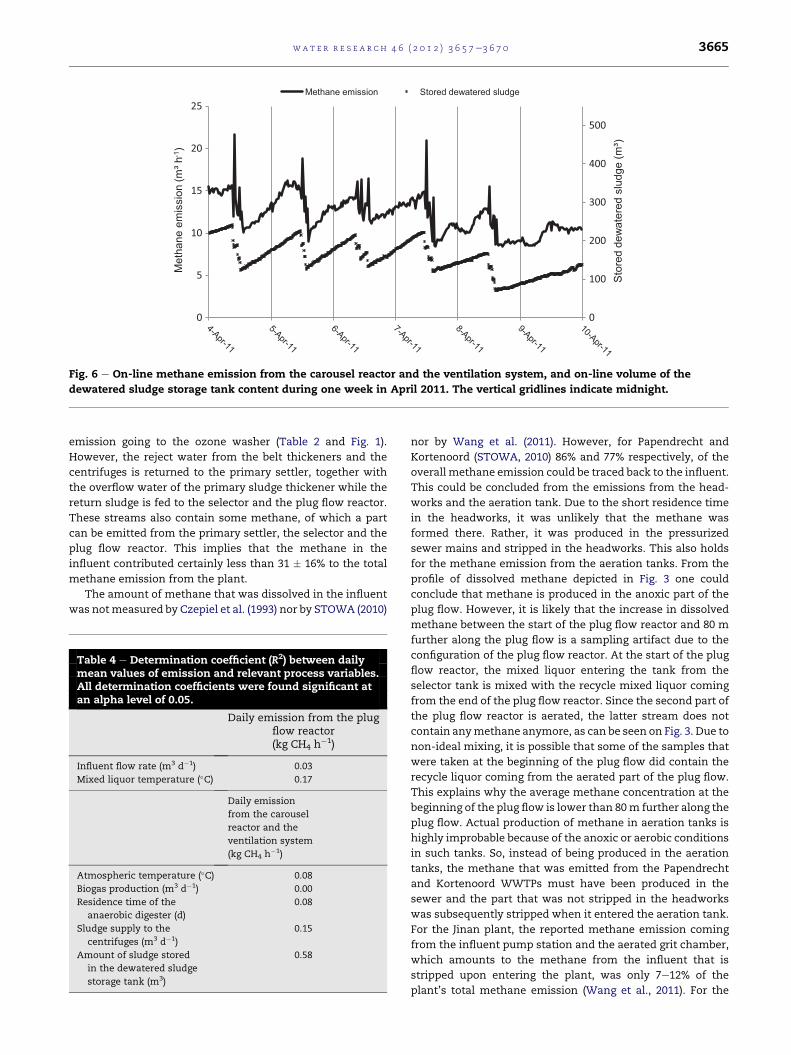
emission going to the ozone washer (Table 2 and Fig. 1).

However, the reject water from the belt thickeners and the

centrifuges is returned to the primary settler, together with

the overflow water of the primary sludge thickener while the

return sludge is fed to the selector and the plug flow reactor.

These streams also contain some methane, of which a part

can be emitted from the primary settler, the selector and the

plug flow reactor. This implies that the methane in the

influent contributed certainly less than 31 � 16% to the total

methane emission from the plant.

The amount of methane that was dissolved in the influent

was notmeasured by Czepiel et al. (1993) nor by STOWA (2010)

Table 4 e Determination coefficient (R2) between dailymean values of emission and relevant process variables.All determination coefficients were found significant atan alpha level of 0.05.

Daily emission from the plugflow reactor(kg CH4 h

�1)

Influent flow rate (m3 d�1) 0.03

Mixed liquor temperature (�C) 0.17

Daily emission

from the carousel

reactor and the

ventilation system

(kg CH4 h�1)

Atmospheric temperature (�C) 0.08

Biogas production (m3 d�1) 0.00

Residence time of the

anaerobic digester (d)

0.08

Sludge supply to the

centrifuges (m3 d�1)

0.15

Amount of sludge stored

in the dewatered sludge

storage tank (m3)

0.58

nor by Wang et al. (2011). However, for Papendrecht and

Kortenoord (STOWA, 2010) 86% and 77% respectively, of the

overall methane emission could be traced back to the influent.

This could be concluded from the emissions from the head-

works and the aeration tank. Due to the short residence time

in the headworks, it was unlikely that the methane was

formed there. Rather, it was produced in the pressurized

sewer mains and stripped in the headworks. This also holds

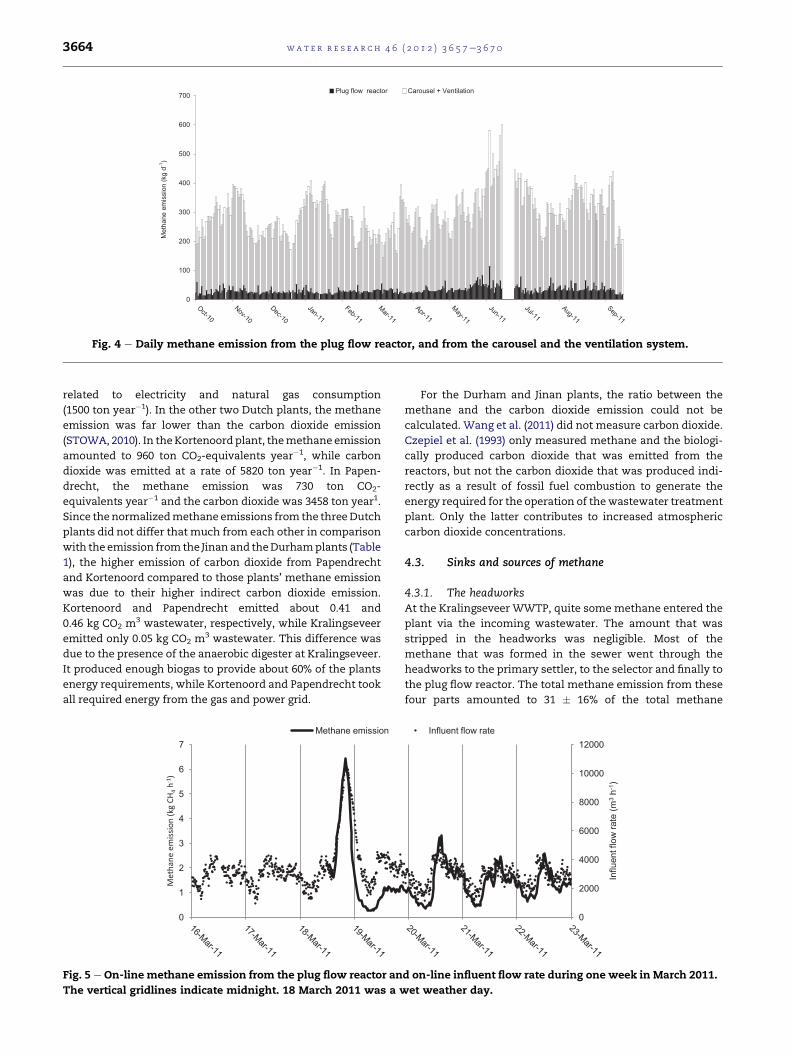
for the methane emission from the aeration tanks. From the

profile of dissolved methane depicted in Fig. 3 one could

conclude that methane is produced in the anoxic part of the

plug flow. However, it is likely that the increase in dissolved

methane between the start of the plug flow reactor and 80 m

further along the plug flow is a sampling artifact due to the

configuration of the plug flow reactor. At the start of the plug

flow reactor, the mixed liquor entering the tank from the

selector tank is mixed with the recycle mixed liquor coming

from the end of the plug flow reactor. Since the second part of

the plug flow reactor is aerated, the latter stream does not

contain anymethane anymore, as can be seen on Fig. 3. Due to

non-ideal mixing, it is possible that some of the samples that

were taken at the beginning of the plug flow did contain the

recycle liquor coming from the aerated part of the plug flow.

This explains why the average methane concentration at the

beginning of the plug flow is lower than 80m further along the

plug flow. Actual production of methane in aeration tanks is

highly improbable because of the anoxic or aerobic conditions

in such tanks. So, instead of being produced in the aeration

tanks, the methane that was emitted from the Papendrecht

and Kortenoord WWTPs must have been produced in the

sewer and the part that was not stripped in the headworks

was subsequently stripped when it entered the aeration tank.

For the Jinan plant, the reported methane emission coming

from the influent pump station and the aerated grit chamber,

which amounts to the methane from the influent that is

stripped upon entering the plant, was only 7e12% of the

plant’s total methane emission (Wang et al., 2011). For the

Table 5 e Determination coefficient (R2) between 26 daymoving averages of emission and relevant processvariables. All determination coefficients were foundsignificant at an alpha level of 0.05.

Emission from thecarousel reactor and

the ventilationsystem (kg CH4 h

�1)

Atmospheric temperature (�C) 0.14

Biogas production (m3 d�1) 0.11

Residence time of the

anaerobic digester (d)

0.84

Sludge supply to the

centrifuges (m3 d�1)

0.72

Amount of sludge stored

in the dewatered sludge

storage tank (m3)

0.70

wat e r r e s e a r c h 4 6 ( 2 0 1 2 ) 3 6 5 7e3 6 7 03666

Durham plant, the methane emission at the entrance of the

plant was not reported (Czepiel et al., 1993).

When the part of the emission that can be traced back to

the methane coming in with the influent is normalized with

incoming COD, this part of the emission amounts to 0.0035,

0.0046 and 0.0067 kg CH4 (kg CODinfluent)�1 for the plants of

Kralingseveer, Kortenoord and Papendrecht, respectively. A

possible explanation for the higher value of Papendrecht is the

way in which the raw wastewater enters the WWTP. At Kra-

lingseveer and Kortenoord, the raw wastewater is pumped up

by centrifugal pumps, while at Papendrecht, thewastewater is

pumped up by screw conveyors. In the latter, there is intense

contact between the wastewater and the air, leading to

a higher stripping rate of methane. This should be taken into

consideration when designing new wastewater treatment

plants.

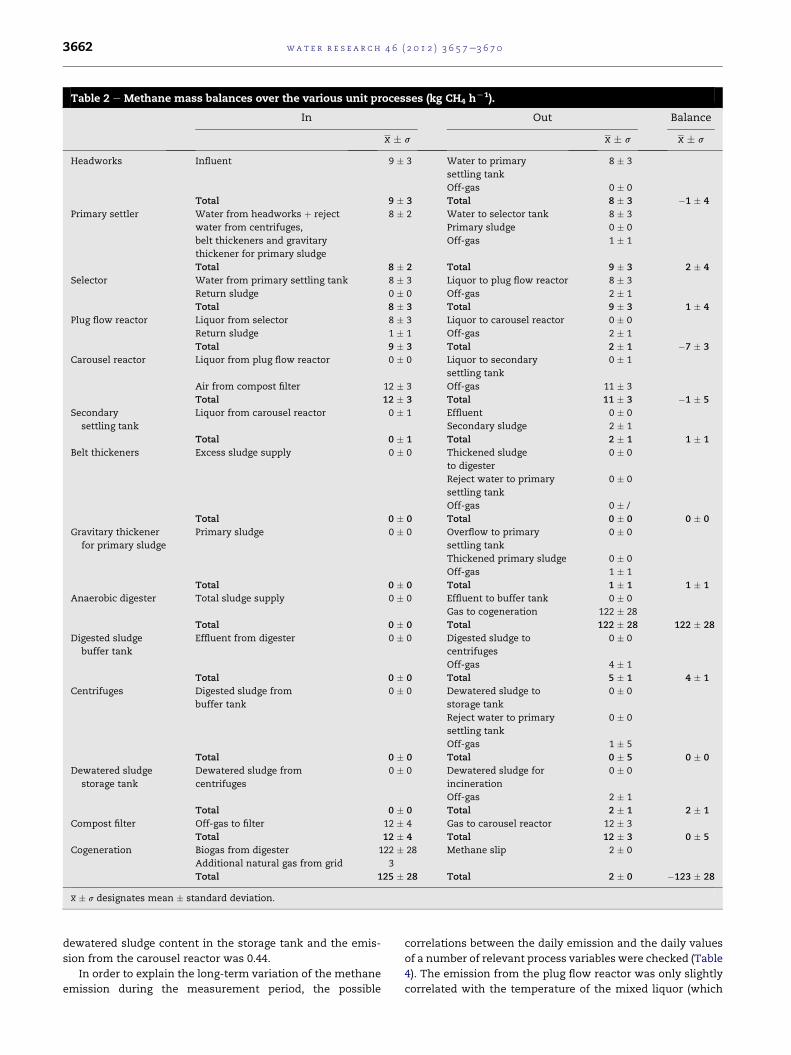
4.3.2. Sludge storageFrom the mass balances, it is evident that sludge storage

contributes significantly to the methane emissions. Methane

is produced both in the digested sludge buffer tank, as well as

in the dewatered sludge storage tank.

The digested sludge has a considerable residual methane

potential because the conversion of the influent sludge to

biogas in a completely mixed anaerobic digester is never

complete. For instance when a retention time of 20 days is

applied in a digester, 5% of the fresh incoming sludge is

directly discharged from the system again. Consequently,

during digested sludge storage a significant amount of

methane can still be produced. The buffer tank for the diges-

ted sludge can actually be considered as a second completely

mixed digester in serieswith the two parallel anaerobic sludge

digesters, albeit with a residence time of maximum five days

and a temperature of about 25 �C instead of 35 �C. The

methane production in this tank is about 3 � 1% of the total

methane production in both the anaerobic digester and the

buffer tank.

Several studies have been dedicated to additional methane

production during digested sludge storage. Hansen et al. (2006)

investigated the residual methane that was produced during

storage of the effluent of a digester that was used for the

anaerobic treatment of municipal organic waste. They

estimated the residual methane potential at 3% of the CH4

potential of the organic waste treated in biogas plants with

a typical retention time of 15 days. Liebetrau et al. (2010)

looked into the additional methane that was produced

during storage of digestate from a mix of manure and energy

crops. In their study, the residual methane potential was on

average 5.03% of the totalmethane production (solid retention

time notmentioned).Weiland et al. (2009) obtained an average

residual methane potential 3.5% of the total methane

production for one-stage biogas installations fed withmanure

and crops and a solid retention time between 30 and 140 days.

So far, the residual methane potential of digested sewage

sludge has received no attention, to the authors’ best

knowledge.

A valorization of the biogas from the digested sludge buffer

tank would result in an additional electricity production of

about 3 � 1% and a reduction of 35 � 13% in the total methane

emissions. Normalized by the incoming COD, this would

imply a decrease in methane emission of 0.0040 �0.0015 kg CH4 (kg CODinfluent)

�1. One way to valorize the

residual methane that is produced in the buffer tank is to use

the ventilation air from the buffer tank as combustion air in

the gas engines of the cogeneration plant. The gas engines use

on average 1800 m3 h�1 of air, while the flow rate of the

ventilation gas coming from the buffer tank is about

1000 m3 h�1. The remaining 800 m3 h�1 could be taken from

the ventilation air from the dewatered sludge storage tank.

This stream has the second highest methane concentration,

but since its flow rate is 1500 m3 h�1, only part of this stream

could be used. The result would be another 1% of additional

electricity production and another 15 � 6% reduction in the

total methane emission. Other off-gas streams could be used

as well but since their methane concentration is lower, less

methane could be recovered. The methane concentration in

the ventilation air could of course be increased by using less

fresh air for ventilation. This would result in less diluted

methane streams, but then the ventilation system should be

adapted to handle methane concentrations that exceed the

lower explosive limit of methane in air, which is 4.4% (TNO/

VNCI, 2008).

4.3.3. Exhaust of the cogeneration plantThe methane slip of the gas engines consists for 98% of

methane that was produced in the anaerobic digester, while

the remainder comes from the external natural gas that

complements the biogas. The methane slip was 1.3%.

Although it was based on a single measurement, this value is

comparable with other studies that report methane slip from

biogas plants.Woess-Gallasch et al. (2010)mention amethane

slip of 1.79% as a representative value for Austrian biogas

plants. Liebetrau et al. (2010) measured the methane slip of

seventeen cogeneration units and obtained an average

methane slip of 1.73%.

4.3.4. Primary sludge thickenerPrimary sludge contains a lot of readily biodegradable matter.

Since the gravitary thickener for the primary sludge has

a residence time of about one day, since the conditions are

anaerobic and since the primary sludge is inoculated with

methanogenic bacteria from the sewer, it is perfectly

wat e r r e s e a r c h 4 6 ( 2 0 1 2 ) 3 6 5 7e3 6 7 0 3667

understandable that this is a source ofmethane, be it less than

the other sources (Table 2).

4.3.5. Activated sludge as a methane sinkDissolvedmethane which enters an activated sludge tank can

either be biologically converted to carbon dioxide andwater or

it can be stripped. Since methane has a global warming

potential of 25 CO2-equivalents, conversion of methane to

carbon dioxide leads to a smaller greenhouse gas footprint.

Therefore, efforts should bemade to promote conversion over

stripping. In the case of Kralingseveer WWTP, 80% of the

dissolved methane entering the plug flow reactor was con-

verted. If this tank would be a CSTR instead of a plug flow, the

dissolved methane in the tank would be more diluted. As

a result, the driving force for stripping would be smaller,

allowing more methane to stay in solution and to be biologi-

cally converted. The methane oxidizing capacity of activated

sludge could also be applied for the conversion of gaseous

methane, provided that the mass transfer of methane from

the gas phase to the liquid phase is enhanced, for instance by

using the methane containing off-gases in a bubble aeration

system instead of surface aeration.

It has been suggested that methane can act as an electron

donor during the denitrification process (Ettwig et al., 2010;

Raghoebarsing et al., 2006). That would imply a saving in

aeration costs, since no oxygen has to be supplied for the

oxidation ofmethane. However, along the length of the anoxic

part of the plug flow reactor, the methane concentration did

not decrease (Fig. 3). This indicates that methane is not

consumed during the denitrification process. When realizing

that already a very significant fraction of the methane is

converted aerobically, it is likely that attention to design can

further optimize the aerobic methane removal and minimize

the emissions.

4.4. The role of anaerobic digestion in the plant’smethane emission

While the methane emission of the Kortenoord and the

Papendrecht WWTP could be mainly attributed to the

methane in the influent, the methane emission from the

Kralingseveer WWTP was mainly due the anaerobic sludge

treatment. This also explains this plant’s higher emission in

comparison with the Jinan and the Durnham plant, both

without anaerobic sludge treatment. 72 � 23% of the total

methane emissions came from the unit processes that are

related to the anaerobic digestion facility: the gravitational

thickener for the primary sludge, the centrifuge, the buffer

tank for the effluent of the digester, the storage tank that

contains the dewatered sludge and the methane slip from the

gas engines. Therefore, the anaerobic digestion facilities

should certainly be taken into account when determining the

greenhouse gas footprint of a WWTP.

Because the biogas is used to provide part of the energy

requirement of Kralingseveer WWTP, some fossil fuel

consumption and its concomitant carbon dioxide emission is

avoided. The International Energy Agency (IEA, 2010) esti-

mates the carbon dioxide emission from energy and heat

production in the Netherlands at 0.395 kg CO2 kWh�1 (using

the typical Dutch mix of energy resources). Based on the

electricity production from biogas in the WWTP’s cogenera-

tion unit (13 MWh d�1), the plant’s avoided amount of carbon

dioxide emission was calculated to be 5.2 ton CO2 d�1.

However, the methane emitted by the unit processes related

to anaerobic sludge treatment (i.e. the gravitational thickener

for the primary sludge, the centrifuge, the buffer tank for the

effluent of the digester, the storage tank that contains the

dewatered sludge and the methane slip from the gas engines)

amounted to 230 kg CH4 d�1. Taking into account that

methane has a GWP of 25 CO2-equivalents (IPCC, 2007), the

amount of methane that is emitted from the anaerobic sludge

treatment corresponds to an emission of 5.7 ton CO2 d�1. In

other words, the methane emitted from the anaerobic diges-

tion facility exceeds the carbon emission that is avoided by

valorizing the biogas. Besides, the methane that is emitted to

the atmosphere not only contributes to the greenhouse gas

footprint of a WWTP, it also implies a waste of energy since

the methane emitted from the unit processes that are related

to the anaerobic digestion (7 � 2% of the produced methane)

could potentially have been used as a fuel for the cogeneration

plant.

Although biogas production from waste sludge may be

a sustainable technology fromanenergypoint of view, it has in

this case no benefits over fossil fuel-derived energy regarding

greenhouse gas emissions. Nonetheless it should be empha-

sized that the emission of methane is not intrinsic for anaer-

obic digestion, but that a better design and good housekeeping

may lead to a drastic mitigation of the emission.

4.5. Dynamic behavior of the methane emissions

4.5.1. Diurnal variabilityThe diurnal pattern of the emission from the plug flow reactor

coincided with the diurnal pattern of the influent flow (Fig. 5).

The morning peak of influent flow is closely followed by an

increase in methane emission, and on wet weather days, the

emission also appeared to be higher than on dryweather days.

Despite the similarity between the emission and the influent

flow rate patterns, the correlation was not really high

(R2 ¼ 0.20). Indeed, Fig. 7 reveals that a low influent rate

corresponds with a low methane emission from the plug flow

reactor, but at a high influent flow rate, the emission can be

both high and low. This can be explained by taking into

account the dynamic behavior of the methane emission

during periods with a high influent flow rate. Fig. 8 shows the

pattern of the methane emission and the influent flow rate

during a prolonged wet weather period (characterized by an

influent flow rate higher than 6000 m3 h�1). It is clear that the

start of a prolonged rain event coincides with a methane

emission peak from the plug flow reactor. However, while the

influent flow rate remains high for about two days, the

methane emission, after showing an initial peak, drops down

to a low level after a few hours. This pattern can be explained

by considering the presence of biodegradable material in the

sewer system. Only if biodegradable material is present in the

sewer, methane can be produced. At the beginning of a rain

event, a lot of biodegradable material is still present in the

sewer and as a consequence, a lot of methane enters the

WWTP via the influent, resulting in an emission peak.

However, as the rain persists, biodegradable material is

Fig. 7 e Scatter plot of methane emission from the plug

flow reactor vs. the influent flow rate.

wat e r r e s e a r c h 4 6 ( 2 0 1 2 ) 3 6 5 7e3 6 7 03668

flushed out of the sewer, leaving relatively clean water in the

sewer. The lack of biodegradable material results in less

methane being formed in the sewer and less methane that

enters the plant. This is reflected in the emission pattern

during a prolonged rain event and during a short period after

the rain event.

As can be seen in Fig. 6, the short-term emission pattern

from the carousel, mainly coming from the off-gas from the

ventilation system, is in line with the content of the dewa-

tered sludge storage tank (R2 ¼ 0.44). Every day at about 7 AM,

except during the weekend, the dewatered sludge is trans-

ferred from the storage tank to a truck. The steady increase in

the sludge volume over the day parallels the rising methane

emission, while the unloading of the sludge into the truck

causes a sharp peak. The correlation is not that strong, but

that is because the dewatered sludge storage tank contributes

only for 17 � 8% to the emission from the carousel reactor.

4.5.2. Seasonal variabilityAs far as daily values are concerned (Table 4), the only

meaningful correlation was between the daily average

amount of sludge stored in the dewatered sludge storage tank

and the daily emission from the carousel and the ventilation

system (R2 ¼ 0.58). Especially considering the limited contri-

bution of the off-gas from the dewatered sludge storage tank

0

1

2

3

4

5

6

7

8

9

Methane emission

Fig. 8 e On-line methane emission from the plug flow reactor a

The vertical gridlines indicate midnight.

to the emission from the carousel and the ventilation system

(17 � 8%) this correlation is high. The correlation between the

daily values corroborates the correlation between the on-line

values.

Regarding the 26 day moving average values (Table 5),

a relatively high correlation (R2 ¼ 0.70) was found between the

moving average of the emission from the carousel and the

moving average of the sludge content in the dewatered sludge

storage tank. This was also the case for the on-line measure-

ments and the daily averages, so it is obvious that the amount

of sludge that is storedhere, influences the emissions. Keeping

less sludge in the dewatered sludge storage tank may be an

option to decrease this contribution to the total methane

emissions.

The 26 day moving average of the emission from the

carousel and the ventilation system had a strong negative

correlation with the moving average of the residence time in

the digester (R2 ¼ 0.84). The amount of sludge that is degraded

is inversely proportional to the residence time. The less

material that is degraded in the digester, the higher the

residual methane potential of the digester effluent will be.

Since this effluent is stored in the buffer tank, more methane

will be produced there, and since the buffer tank contributes

for 40� 15% to the emission from the carousel this emission is

influenced by the residence time in the digester.

The digester is operated as a CSTR with fixed volume,

which implies that the residence time is determined by the

flow rate. The effluent of the digester is first sent to the buffer

tank with a maximum residence time of 5 days and subse-

quently to the dewatering centrifuges. The 26 day moving

average of the flow rate to the centrifuges is expected to

correlate with the average emission from the carousel,

because a higher average flow rate to the centrifuges corre-

sponds with a shorter average residence time in the digester

and a concomitant higher residual methane potential. This

hypothesis was confirmed by the relatively high correlation

that was found between the moving average values of the

emission from the carousel on the one hand and the flow rate

to the centrifuges on the other hand (R2 ¼ 0.72). As a conse-

quence, increasing the sludge residence time in the anaerobic

0

2000

4000

6000

8000

10000

12000

14000

Influ

ent f

low

rate

(m3

h-1)

Influent flow rate

nd on-line influent flow rate during a wet weather period.

wat e r r e s e a r c h 4 6 ( 2 0 1 2 ) 3 6 5 7e3 6 7 0 3669

digester will decrease the residual methane potential and the

methane emission during storage of the digester effluent.

5. Conclusions

� The methane emission related to the anaerobic digestion of

primary and secondary sludge counts for about three

quarters with respect to the WWTPs overall methane

emission and causes a slightly larger greenhouse gas foot-

print than the carbon dioxide emission that is avoided by

using the resulting biogas for energy generation.

� Methane emissions can be significantly reduced by better

handling of the ventilation air of sludge handling facilities.

� Methane present in the wastewater was for a large part

aerobically oxidized in the activated sludge tanks. This

could be exploited as a means to further decrease methane

emissions from wastewater treatment.

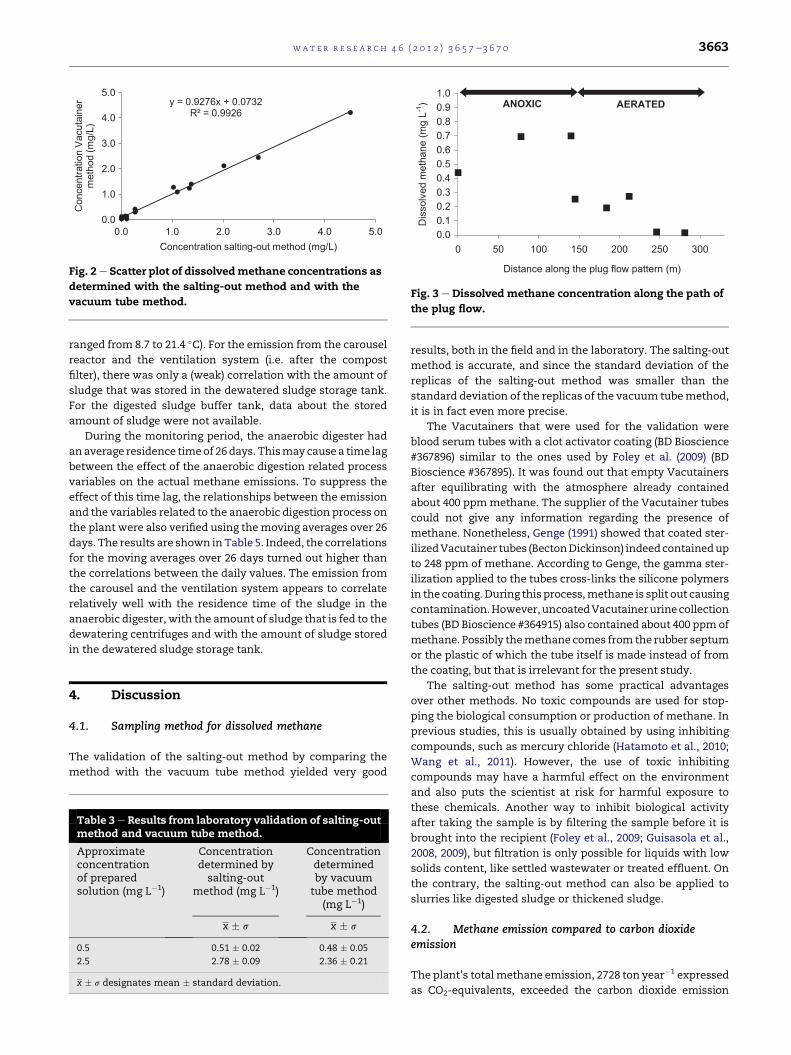
� Dissolvedmethane can be sampled accurately and precisely

with a headspace method based on the salting-out of dis-

solved gases.

Acknowledgments

This research was financed by Stichting Toegepast Onderzoek

Waterbeheer (STOWA), the Dutch Foundation for Applied

Water Research. The authors are much obliged to Hoog-

heemraadschap van Schieland en Krimpenerwaard, the Water

Board of Schieland and Krimpenerwaard, and to Dmitry Sor-

okin, who instructed us about the salting-out method. Eveline

Volcke is a post-doctoral research fellow of the Research

Foundation Flanders (Belgium) (FWO).

Appendix A. Supplementary material

Supplementary data related to this article can be found online

at doi:10.1016/j.watres.2012.04.024.

r e f e r e n c e s

Czepiel, P.M., Crill, P.M., Harriss, R.C., 1993. Methane emissionsfrom municipal wastewater treatment processes.Environmental Science and Technology 27 (12), 2472e2477.

Ettwig, K.F., Butler, M.K., Le Paslier, D., Pelletier, E., Mangenot, S.,Kuypers, M.M.M., Schreiber, F., Dutilh, B.E., Zedelius, J., deBeer, D., Gloerich, J., Wessels, H.J.C.T., van Alen, T.,Luesken, F., Wu, M.L., van de Pas-Schoonen, K.T., Op denCamp, H.J.M., Janssen-Megens, E.M., Francoijs, K.-J.,Stunnenberg, H., Weissenbach, J., Jetten, M.S.M., Strous, M.,2010. Nitrite-driven anaerobic methane oxidation by oxygenicbacteria. Nature 464 (7288), 543e548.

Feijoo, G., Soto, M., Mendez, R., Lema, J.M., 1995. Sodiuminhibition in the anaerobic-digestion process: antagonism andadaptation phenomena. Enzyme and Microbial Technology 17(2), 180e188.

Foley, J., Lant, P., 2007. Fugitive Greenhouse Gas Emissions fromWastewater Systems. WSAA Literature Review No.01. Water

Services Association of Australia, Melbourne and Sydney,Australia.

Foley, J., Yuan, Z., Lant, P., 2009. Dissolved methane in rising mainsewer systems: field measurements and simple modeldevelopment for estimating greenhouse gas emissions. WaterScience and Technology 60 (11), 2963e2971.

Gal’chenko, V.F., Lein, A.Y., Ivanov, M.V., 2004. Methane contentin the bottom sediments and water column of the Black Sea.Microbiology 73 (2), 211e223.

Genge, J.R., 1991. Contamination of breath methane samples insterilized vacutainer tubes. Clinical Chemistry 37 (11),2019e2020.

Guisasola, A., de Haas, D., Keller, J., Yuan, Z., 2008. Methaneformation in sewer systems. Water Research 42 (6e7),1421e1430.

Guisasola, A., Sharma, K.R., Keller, J., Yuan, Z., 2009. Developmentof a model for assessing methane formation in rising mainsewers. Water Research 43 (11), 2874e2884.

Hansen, T.L., Sommer, S.G., Gabriel, S., Christensen, T.H., 2006.Methane production during storage of anaerobically digestedmunicipal organic waste. Journal of Environment Quality 35(3), 830e836.

Hatamoto, M., Yamamoto, H., Kindaichi, T., Ozaki, N., Ohashi, A.,2010. Biological oxidation of dissolved methane in effluentsfrom anaerobic reactors using a down-flow hanging spongereactor. Water Research 44 (5), 1409e1418.

Hofman, J., Hofman-Caris, R., Nederlof, M., Frijns, J., vanLoosdrecht, M., 2011. Water and energy as inseparable twinsfor sustainable solutions. Water Science and Technology 63(1), 88e92.

IEA, 2010. CO2 Emissions from Fuel Combustion. Highlights.International Energy Agency, Paris, France.

IPCC, 2006. Prepared by the National Greenhouse Gas InventoriesProgramme. In: Eggleston, H.S., Buendia, L., Miwa, K.,Ngara, T., Tanabe, K. (Eds.), 2006 IPCC Guidelines for NationalGreenhouse Gas Inventories. IPCC, Hayama, Japan.

IPCC, 2007. In: Solomon, S., Qin, D., Manning, M., Chen, Z.,Marquis, M., Averyt, K.B., Tignor, M., Miller, H.L. (Eds.),Contribution of Working Group I to the Fourth AssessmentReport of the Intergovernmental Panel on Climate Change.IPCC, Cambridge, United Kingdom and New York, NY,USA.

Kampschreur, M.J., Temmink, H., Kleerebezem, R.,Jetten, M.S.M., van Loosdrecht, M.C.M., 2009. Nitrous oxideemission during wastewater treatment. Water Research 43(17), 4093e4103.

Liebetrau, J., Clemens, J., Cuhls, C., Hafermann, C., Friehe, J.,Weiland, P., Daniel-Gromke, J., 2010. Methane emissions frombiogas-producing facilities within the agricultural sector.Engineering in Life Sciences 10 (6), 595e599.

Pernetti, M., Di Palma, L., 2005. Experimental evaluation ofinhibition effects of saline wastewater on activated sludge.Environmental Technology 26 (6), 695e703.

Raghoebarsing, A.A., Pol, A., van de Pas-Schoonen, K.T.,Smolders, A.J.P., Ettwig, K.F., Rijpstra, W.I.C., Schouten, S.,Damste, J.S.S., Op den Camp, H.J.M., Jetten, M.S.M., Strous, M.,2006. A microbial consortium couples anaerobic methaneoxidation to denitrification. Nature 440 (7086), 918e921.

STOWA, 2010. Emissies van broeikasgassen van RWZI’s.Amersfoort, the Netherlands.

TNO/VNCI, 2008. Chemiekaarten. Ten Hagen & Stam, Den Haag,Netherlands.

VROM 2008. Protocol 8136 Afvalwater, t.b.v NIR 2008 uitgavemaart 2008 6B: CH4 en N2O uit Afvalwater, The Hague,Netherlands.

Wang, J., Zhang, J., Xie, H., Qi, P., Ren, Y., Hu, Z., 2011. Methaneemissions from a full-scale A/A/O wastewater treatmentplant. Bioresource Technology 102 (9), 5479e5485.

wat e r r e s e a r c h 4 6 ( 2 0 1 2 ) 3 6 5 7e3 6 7 03670

Weiland, P., Gemmeke, B., Rieger, C., 2009. Biogas-MessprogrammIIe61 Biogasanlagen im Vergleich. FachagenturNachwachsende Rohstoffe e.V, Gulzow, Germany.

Woess-Gallasch, S., Bird, N., Enzinger, P., Jungmeier, G.,Padinger, R., Pena, N., Zanchi, G., 2010. Greenhouse GasBenefits of a Biogas Plant in Austria. Joanneum

Research Forschungsgesellschaft mbH. Resources e Instituteof Water, Energy and Sustainability, Graz,Austria.

Zobell, C.E., Anderson, D.Q., Smith, W.W., 1937. The bacteriostaticand bactericidal action of Great Salt Lake water. Journal ofBacteriology 33 (3), 253e262.


Recommended