52
METHANE EMISSIONS FROM BIOGAS PLANTS Methods for measurement, results and effect on greenhouse gas balance of electricity produced IEA Bioenergy Task 37 IEA Bioenergy: Task 37: 2017: 12

Methane eMissions froM biogas plants Methods for measurement, results and effect on greenhouse gas balance of electricity produced
IEA Bioenergy Task 37IEA Bioenergy: Task 37: 2017: 12

Methane emissions Title page
Methane emissions from biogas plants Methods for measurement, results and effect on greenhouse gas balance of electricity produced
Jan LiebetrauTorsten ReineltAlessandro AgostiniBernd Linke
EdiTEd By Jerry d Murphy
Published by iEA Bioenergy
IEA Bioenergy, also known as the Technology Collaboration Programme (TCP) for a Programme of Research, Development and Demonstration on
Bioenergy, functions within a Framework created by the International Energy Agency (IEA). Views, findings and publications of IEA Bioenergy do
not necessarily represent the views or policies of the IEA Secretariat or of its individual Member countries.
Copyright © 2017 IEA Bioenergy. All rights ReservedISBN: 978-1-910154-35-9 (printed paper edition)ISBN: 978-1-910154-36-6 (eBook electronic edition)
Cover photo: Torsten Reinelt
Reviewed byArthur wellinger
Acknowledgements: We acknowledge and thank Arthur Wellinger of the European Biogas Association for reviewing this report.
We would like to thank Tanja Westerkamp and Tina Clauß for contributions and Antje Krücken for formatting and counterchecking.

Table of contents
Methane emissionsTable of contents
1 Executive summary 4
2 Introduction 6 2.1 Background of the report 6
3 Challenges for emission measurements 8 3.1 Type of sources 83.2 General aspects for emission measurements 8 3.2.1 Point sources 93.2.2 Area sources 93.2.3 Diffuse and unknown sources 103.2.4 Time variant emissions 10
4 Devices for emission measurements 11 4.1 Portable imaging infrared camera 114.2 Portable methane laser 124.3 Remote sensing systems 124.4 Portable gas analyser 134.5 Analysis of gas samples 144.6 Measurement of flow rates 15
5 Methods for measuring and calculation of methane emission rates 15 5.1 Single source method 155.1.1 Identification of emission sources – leakage detection 155.1.2 Open/dynamic chambers 165.1.3 Closed/static chamber 18 5.1.4 Pressure relief valves (PRV) 195.1.5 Summation of all single sources 20 5.2 Total emission determination by means of remote sensing 215.3 Other methods 23 5.3.1 Tracer dispersion method 235.3.2 Charm – CH4 airborne remote monitoring 23 5.4 Emissions from open manure/digestate storage facilities 245.5 Conclusions on measurement methods to quantify methane emissions from biogas plants 25
6 Results of methane emission measurements 26 6.1 Substrate storage and feeding systems 266.1.1 Silage storage 266.1.2 Manure storage 276.1.3 Waste receiving hall and storage 276.2 Digestion process 276.2.1 Leakage identification and detection within gas bearing components 276.2.2 Pressure relief valves 296.3 Open/not gastight covered digestate storage tanks 306.4 Gas utilisation 32 6.5 Post composting after anaerobic digestion 336.6 Overall emissions from biogas plants 356.7 Remarks for construction and operation for emissions minimization 35
7 Greenhouse gas balance for assessment of significance of methane emissions 367.1 Principles and framework of GHG balance 36 7.2 Goal and scope of the GHG balance 377.3 Inventory analysis 387.4 Results and interpretation 39 7.5 Limitations of the analysis 44 7.6 Conclusions from the GHG balance 44
8 Conclusion and outlook 45
9 References 47
Methane emissions Executive summary
4
Methane is a potent greenhouse gas with a global warming potential much higher than carbon dioxide. Fugi-tive methane emissions from a renewable energy produc-tion system are not conducive to the ambition of reducing Greenhouse Gas (GHG) emissions. The biogas industry is growing and innovative technologies are associated with the rising numbers of facilities in operation. With new tech-nologies it is essential to ensure minimum fugitive emis-sions; this leads to new challenges regarding emission monitoring, quantification and reduction. Within the biogas sector methane emission quantification is becoming a significant topic for the scientific community but is still under development for the industry sector. The methods used and the interpretation and evaluation of the results obtained is not as yet standardised. This report addresses methods used for evaluation, presents selected results of measurements, proposes mitigation measures and puts methane emissions in a context of a standard greenhouse gas balance in order to evaluate the impact of these emis-sions on the sustainability of the biogas system.
MethodsCurrently several methods are in use and a variety of
data sets have been provided from different international teams. The methods used can be distinguished into two major approaches. The single source method aims at an identification, quantification and summation of every emission source. The overall plant measurement aims at the quantification of the plant emissions in total and is effected by remote sensing. The approaches have different advan-tages and limitations and are therefore applicable for differ-ent purposes.
An additional complexity is that the methods applied by industry and by the scientific community can vary in general approach, execution, data analysis and interpreta-tion; this can lead to non-comparable results. An important task for the future is therefore method harmonization including for documentation and reporting of the results. Factors influencing the results involve: the limitations of the methods used; the duration of measurement (in order to cover time variability of specific emission sources); the completeness of plant components measured and potential sources included but not belonging to the biogas facility (such as barns); and the operational mode of the plant. For a representative emission factor, which covers the average emissions during operation, all aspects need to be suffi-ciently well considered for a sound result.
Results of measurementsThe parameters with the largest influence on the quan-
tity of methane emissions can be distinguished by struc-tural (the technologies deployed) and operational (plant
management) means. The most important sources includ-ed: open storage of the digestate; the combined heat and power (CHP) engine; leaks; and the pressure release valve (PRV). Large quantities of uncontrolled methane emissions have been reported caused by single large leaks or long last-ing pressure relief events.
It is very difficult to give general, average numbers for emissions from components or complete biogas plants. Firstly, the results given in literature have large differences due to the variations within the methodologies applied. Even emissions from the CHP engine show a substantial variability, although the methods for quantification are well defined and engine construction and operation should lead to similar emissions. Secondly, the plants are highly indi-vidualized and any generalisation needs to include a classi-fication considering the plant design and plant operation in order to obtain a general emission factor for the sector. Thirdly, methane emissions need to be seen in context with other factors influencing GHG emissions and sustainability of the bioenergy installation. Looking at the methane emis-sion in isolation will not allow assessment of the full impact of the system on the GHG emissions or sustainability in relation to renewable energy production or waste treat-ment.
The results available show a large variability regarding the amount of emissions from biogas plants. There are not sufficient data for a general assessment of the sector, but trends indicate which components should be monitored and which measures are useful to minimize the amount of released methane.
Reduction measuresThe application of specific monitoring and mainte-
nance and/or the application of specific technologies can reduce emissions. A crucial part of any operation should be a monitoring plan and in particular frequent monitoring of any potential emission sources on site. Some of the poten-tially larger sources (CHP, PRV and large leaks) are depend-ent on operation and time and therefore need to be rou-tinely monitored. In case of high emissions, they can be substantially reduced by operational measures.
Reduction measures can include the following: • Emissions from digestate storage should be minimized
since they are one of the major sources. Either the diges-tate tank should be covered (gas tight with gas utilisa-tion) or the degradation of the substrate should mini-mize the possibility of emissions. As soon as the diges-tate leaves the process its emission potential needs to be minimized. In case the digestate is used to condition substrate for better handling or to support hydrolysis in a pre-treatment step, this should happen within encap-
1. Executive summary

Methane emissionsExecutive summary
5
sulated units and any gas produced during this step should be treated. Any aerobic post-treatment should include a sufficient oxygen supply in order to avoid methanogenic activity. The monitoring of oxygen supply (or methanogenic activity) within the process is recom-mended.
• The exhaust of the CHP can contain high methane con-centrations due to incomplete combustion. Frequent control and documentation of motor settings and fre-quent maintenance and control of methane concentra-tions can help to minimize these emissions. Further reduction can be achieved by means of post combustion of the exhaust gas, but this is an expensive solution. There are no catalysts for methane emission reduction available at the market for lean-burn engines. However, Selective Catalytic Reduction (SCR) is also discussed as an option for optimising the emissions from CHP since it allows the unit to operate with lower lambda (air fuel ratio) leading to lower methane emissions.
• In the case of biogas upgrading technology, depending on the applied type of technology, the concentration of methane in the off gas varies due to varying separation efficiency. In case of significant emissions caused by the off-gas, a post treatment is recommended. Frequent function control and monitoring of the performance of such devices is necessary.
• The biogas containing components should be frequently monitored to identify leakages. This includes surveys with leakage detection systems such as methane cameras and handheld lasers. Such a survey should be carried out every 1 to 3 years, depending on the status (age and number of leaks found) of the plant. Monitoring for elevated methane concentrations within the off-gas streams from air inflated double membrane roofs should be included in routine measures.
• Plant management should aim at avoidance of PRV releases (and flaring events) in order to minimize emis-sions and losses in general. This includes the automatic operation of the flare linked to the filling level of the gas storage. A stationary flare is required, which is opera-tional in parallel to the CHP and kicks in before the PRV opens. The filling level of the gas storage should be well below 80 % during normal operation (in order to com-pensate weather and operation induced changes); a val-ue of around 50 % is recommended. The level indicators need to be capable of delivering precise measurements in any range of filling level. Connected membrane gas stor-age systems need to be adjusted to each other in order to allow controlled filling levels and pressure conditions in all vessels under all process conditions. Accordingly gas
transfer between several gas storage systems needs to be controllable in order to avoid unbalanced filling levels as well as pressure ratios, which might lead to PRV release in one vessel although other vessels have idle or spare capacity. In case flare operation is not set to avoid PRV events, a monitoring system for PRV operation is recom-mended to record the number and duration of release events. The gas management system can also include the adjustment of feeding during shutdown of the gas utilisa-tion or periods of reduced load of the CHP. Adequate dimensions of pipes, blowers in the gas pipes and controllable air pressure in the air inflated roofs are measures to achieve well balanced filling levels in all gas storages.
GHG balanceWhen putting the methane emissions into a context of a
GHG balance of the bioenergy system, it becomes apparent that beside the fugitive methane emissions other important factors (in decreasing order) include: the substrate used; the heat utilization; and the parasitic energy demand. In case of a clear GHG reduction target the plant design needs to be chosen carefully, since some components (such as CHP unit, open digestate storage) cause inevitably certain emissions once in operation.
By using the data and methodology adopted by the European Commission, and assuming 30 % of the Fossil Fuel Comparator (FFC) for electricity as a targeted limit for the operation, it was shown that energy crop based plants will experience difficulties in reaching this reduction target without specific measures (such as heat utilization or exhaust treatment at the CHP) since the energy crops come with a GHG burden associated with the production of the crop. Manure based plants come with a large credit due to avoided emissions from raw manure storage. Consequently, manure digestion reduces emissions significantly and this effect is also to be seen in co-digestion systems.
OutlookThe major task for the future is an improvement of pre-
cision, reproducibility and representativeness of the meth-ods used for emission quantification. A method harmoniza-tion or at least a defined protocol will be necessary to com-pare results from different measurements. An important aspect of the documentation is the definition of the status of the plant and how highly time variant emissions (such as PRV release events) are included in a long-term reference time period. Only comparable results in combination with a sufficient number of plants analysed will lead to a better understanding of the emissions from the whole sector and a reliable data base for emission inventory. A general task for the future is to raise awareness within plant operators and plant manufactures of this issue. Only if the industry is sen-
sitive to the subject, can emissions be further reduced.

Methane emissions Introduction
6
2.1 Background of the reportClimate change is one of the great challenges of the
21st century. The most severe impacts may still be avoid-
able if substantial efforts are made to transform current
energy systems. Renewable energy sources have the
potential to reduce emissions of GHG when compared
to the combustion of fossil fuels and thereby to mitigate
climate change. Bioenergy systems can contribute to
climate change mitigation if they replace traditional fos-
sil fuel use (IPCC, 2012).
Within the bioenergy sector the increased use of
biogas opens up new opportunities in areas where bio-
mass has not played a major role so far (Anonymous,
2009). Biogas production has been growing steadily in
recent years and has made its contribution to renewable
energy generation and reducing negative impacts on the
environment, both in the form of GHG emissions and
the pollution of soil and water courses (Wellinger et al.,
2013). The European Biogas Association estimates that
by 2030 overall annual potential for biogas will be at
least 50 billion m3. Thus, by 2030 with the right policies
in place, the industry could deliver 2–4 % of the EU’s
electricity needs and provide a 15–30 % share of today’s
methane (natural gas) market. The concurrent contribu-
tion to the heat demand as a by-product of the electric-
ity provisions by means of combined heat and power
units has not been recognized adequately yet.
Biogas can be produced by anaerobic digestion of
almost every wet organic feedstock (with the exception
of lignin). The most common substrates used for biogas
production are: animal waste and crop residues; energy
crops; domestic food and garden waste; industrial
wastewater; municipal sewage sludge; and the organic
fraction of Municipal Solid Waste (MSW). Biogas
production and utilisation is recognised as an integrated
process including for feedstock supply and pre-
treatment, gas production, treatment and utilisation as
well as recovery, pre-treatment and use of digestate.
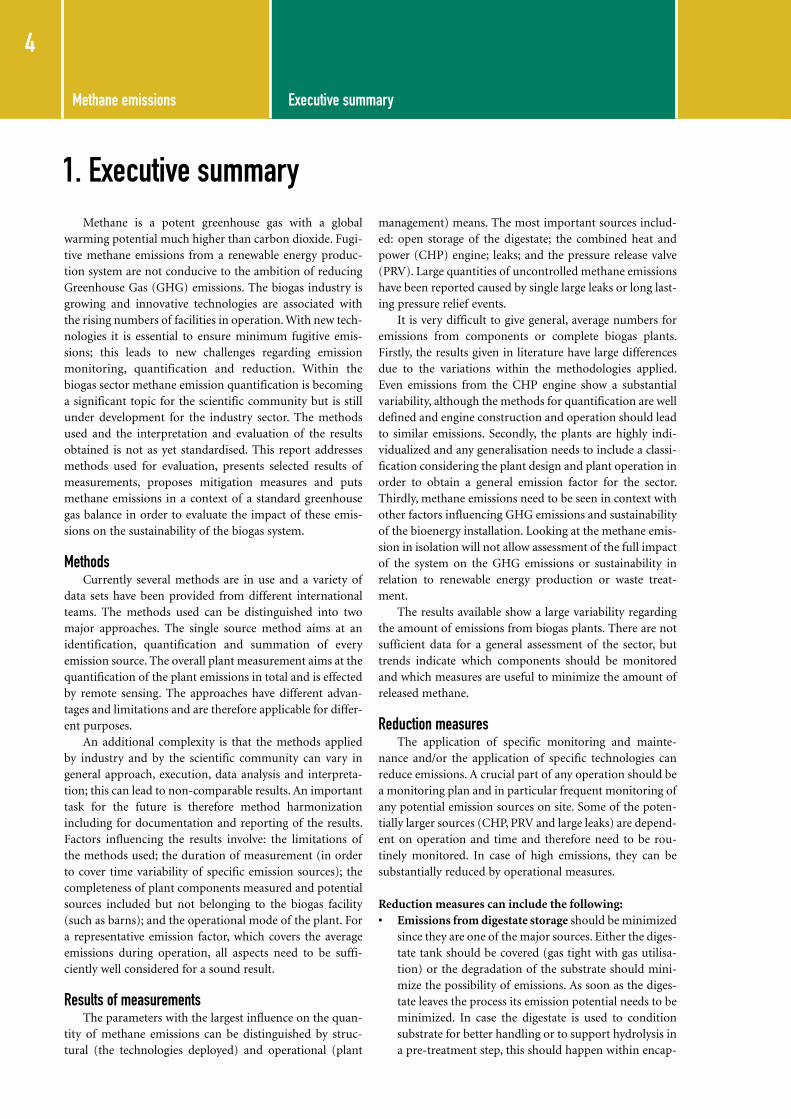
Figure 1 highlights possible process components and
processing pathways for anaerobic digestion.
Although biogas production and use are regarded as
a very sustainable practice that can guarantee GHG sav-
ings (Masse et al. 2011) special attention should be given
to methane emissions within the biogas production and
utilisation chain. If released uncontrolled into the
atmosphere methane represents a very potent GHG, a
safety hazard and last but not least the emission also
represents an economic loss. It should also be mentioned
that the public acceptance of biogas facilities is strongly
dependent on the proof of low emissions. Besides meth-
ane there are other gases such as ammonia and nitrous
oxide (a significant GHG), which might be emitted from
biogas systems. However, this publication focuses on the
methane emissions from the biogas production process,
since the methodology of measurement is different and
the effect of methane on the GHG balances is more pro-
nounced (Agostini et al. 2015). The work in this report
will concentrate on production of electricity from biogas
rather than gas grid injection.
When referring to emissions, a sufficiently precise
determination of the quantity of emitted gases is a cru-
cial point since any practical assessment at a biogas plant
as well as evaluations for authorities, stakeholders from
the energy sector, for certification systems and the
national GHG inventories requires an authoritative
number on the amount of gases emitted. For whatever
reason the investigation of a plant is carried out – any
emission reduction and respective operational optimiza-
tion of biogas facilities depend on the previous identifi-
cation and quantification of emission sources.
During recent years the topic has gained more and
more attention and there are several publications
describing methodology and results of emission meas-
urements. Using these results numerous GHG balances
and life cycle assessments have been carried out. The
results of such assessments depend on additional factors
such as for instance: the origin and production of feed-
stock; the operation of the system and resources used;
credits for by-products and the disposal of wastes from
the process. All these factors have to be considered in the
quest for environmental friendly and sustainable energy
production from biogas and should be properly evalu-
ated when formulating policies regulating the sector or
providing subsidies (Boulamanti et al., 2013).
The report aims at giving an overview of the state of
the art of methane emission measurements at biogas
plants, results obtained, mitigation measures and a per-
spective on the impact of these emissions on GHG bal-
ances and sustainability of biogas production in produc-
ing electricity.
2. Introduction
Methane emissionsIntroduction
7
Figure 1: Possible process components and processing pathways for anaerobic digestion

Methane emissions
8
Biogas plants aim to produce renewable energy with
methane as the energy vector. Consequently, an unwant-
ed and/or inevitable emission from the process is meth-
ane, which is a powerful greenhouse gas. An efficient and
sustainable biogas system must ensure these emissions
are minimised. The first step to a successful emission
mitigation strategy is the identification and quantifica-
tion of emission sources.
3.1 Type of sources Emission sources have certain characteristics, which
determine the possible methodology for identification
and quantification of the source. In the following, cate-
gories are applied, which focus mainly on the method
for the analysis of the emissions source.
Location – Identified (known) and unidentified sourcesIdentified (known) sources, such as the CHP exhaust
or open digestate storage can be investigated directly,
since the location of the source is known. Unknown
sources can be either large sources such as leakages or a
sum of small sources (diffuse sources). In case of a
detailed source analysis the large sources have to be iden-
tified and then analysed individually. Diffuse sources are
as per definition too small and/or too many to investi-
gate individually with reasonable effort. Diffuse emis-
sion sources can only be analysed with an appropriate
method, which comprehends the overall emissions of a
plant.
Size and type– point and area source A second distinction can be made between point and
area sources. Point sources such as the CHP exhaust or
pressure relief valves (PRV) will require different meas-
urement techniques as compared to a large area source
such as an open digestate storage tank, a biofilter surface
or a substrate heap.
Time – constant and temporary/time dependent sourcesLast but not least a consideration of the time depend-
ency of the sources is important. There are almost con-
stant sources such as the CHP exhaust, which can be
measured at any point of time and the emission rate can
be easily transferred to long-term plant operation. On
the other hand, temporary sources with highly unpre-
dictable characteristics such as the release event of an
overpressure valve or emissions from digestate storage
need to be identified and quantified by different strate-
gies. In particular, extrapolation and transfer of such
sources to long-term operation of the plant or the calcu-
lation of emission factors need to be carried out care-
fully.
3.2 General aspects for emission measurementsIn general, there are two different approaches when
it comes to emission measurements. The first approach
is the attempt to identify and quantify every single
source on site. The results of the single source
quantification are added up and the sum represents the
overall emission rate of the plant.
The second approach considers the overall plant as
one single emission source and the overall emissions of
the plant are determined. This is usually achieved by
means of a combination of concentration measurements
(remote sensing or gas sampling) at a defined distance
from the plant and the use of models (e.g. micromete-
orological models) to calculate the emission source.
Table 1 displays the strengths and constraints of the two
measurement concepts.
Challenges for emission measurements
Table 1: Comparison of emission quantification methods
Single source measurement Overall plant measurement
Stre
ngth
s
Identification and quantification of single sources
Emission rates of single sources are analysable and direct mitigation strategies can be deduced
Low detection limit (single source and total emission rate)
Independent of weather conditions
Effort adjustable to the requirements
Long-time measurements with high resolution possible
No influence on plant operation
Time effort quite independent from plant size
All emissions sources are recorded
Time variant emissions are detect-able during long term measure-ments
Cons
trai
nts
Time variant emission sources are difficult to identify
Unknown and diffuse sources are not included
High effort on large plants with many digesters
Influence of measurement on emis-sions (e.g. chamber methods)
No identification of single sources possible
Highly dependent on wind conditions and topology around the plant
Influence of the uncertainties of dis-persion models and/or atmosphe-ric mixing
Difficulties with separation of other sources nearby (e.g. barns)
3. Challenges for emission measurements

Methane emissionsChallenges for emission measurements
9
It can be concluded that the two methods comple-
ment each other. The single source method is the better
choice for leakage identification and mitigation strate-
gies, whereas the remote sensing method delivers the
overall emissions and allows the monitoring of temporal
emissions caused by specific operating modes of the
plant. Depending on the purpose of the plant investiga-
tion, the proper method can be selected. Alternatively
both methods can be used and serve as a check on the
other.
3.2.1 Point sourcesPoint sources have a space limited emission zone and
can therefore be analysed completely. Examples are the
exhaust of combined heat and power units, small and
accessible leakages, the exhaust pipes of overpressure
valves, the outlet of two layer inflated domes, and the
exhaust pipes of contaminated air from encapsulated
plant components (Figure 2). The characteristic of these
sources is a defined area, which can be covered com-
pletely by the measurement. Usually the quantification
of the source can be accomplished by means of flow
measurements in pipes and simultaneously conducted
concentration measurements in the gas stream. In the
case of leakages, the construction of a chamber around
the source might be necessary for the establishment of a
defined and easy to measure flow rate. The emission rate
is calculated based on flow rate and concentration.
3.2.2 Area sourcesArea sources have a defined size, which are too large
to cover completely with one measurement. Examples
are open digestate (Figure 3) and substrate storage tanks
or heaps, large biofilters and open windrows of post
composting processes (if not encapsulated and con-
nected to an air collection system). When applying the
single sources method a defined part of the area is ana-
lysed and the results are extrapolated to the overall area.
Commonly open or closed chamber systems are used to
cover a defined area of the source for emission determi-
nation. Within large tanks the chamber needs to be
installed in several locations in order to get an average
value for the tank. Unfortunately, the emission rate from
the area cannot be assumed to be evenly distributed or
constant over time. Digestate storage tanks are usually
not mixed, the temperature is dependent on ambient air
temperatures and the filling level is variable according to
manure spreading periods (when some of the digestate
is removed from storage and applied to land). Compost
windrows on the other hand have variable emissions
depending on structure of the material, the turnover
frequency and the activity of the material.
These characteristics make it quite difficult to get a
reproducible result, which represents a longer period of
operation. Therefore the measurements, without any
other additional operational data, result in an emission
quantity, which can only represent the very time of the
measurement.
Figure 2: a) Point source pressure relief valve (PRV) (DBFZ) b) vane anemometer for flow measurement in point sources (DBFZ)

Methane emissions Challenges for emission measurements
10
3.2.3 Diffuse and unknown sourcesAccording to the UN-ECE PRTR Protocol (UNECE,
2009) diffuse sources means: “the many smaller or scat-
tered sources from which pollutants may be released to
land, air or water, whose combined impact on those
media may be significant and for which it is impractical
to collect reports from each individual source”.
Even if this has been defined for a much larger frame,
the statement is also applicable for biogas plants. Accord-
ing to this definition diffuse sources would include small
leakages, emissions from spoiled surfaces and unidenti-
fied emission sources. These kinds of sources can only be
identified by the overall plant measurement based on
remote sensing. The single source measurement cannot
quantify diffuse emissions, since they are per definition
too small or too many to collect data from.
The term diffuse is also used for either not confined
or collected and unknown sources, which are not easy to
measure. Such a definition would include every source
except the ones, which can be measured within a pipe.
Within the term diffuse there are further specifications
possible which describe the type and time of occurrence
(VDI, 2005b). In this publication the term diffuse source
is used as per the first definition.
3.2.4 Time variant emissionsSome emissions are dependent on specific opera-
tional conditions. Examples are the release of overpres-
sure valves or emissions from the digestate tank. The
occurrence of an emission event might even be highly
unpredictable and dependent on infrequent operation
modes of the plant as for example in the case of the
release of an overpressure valve. Such emissions can only
be analysed by means of long term measurements of
either the specific potential emission source (provided
the source is known) or the overall plant (includes all
sources).
Figure 3: a) Digestate storage in an open lagoon b) Measurement setup at an open biofilter [DBFZ]
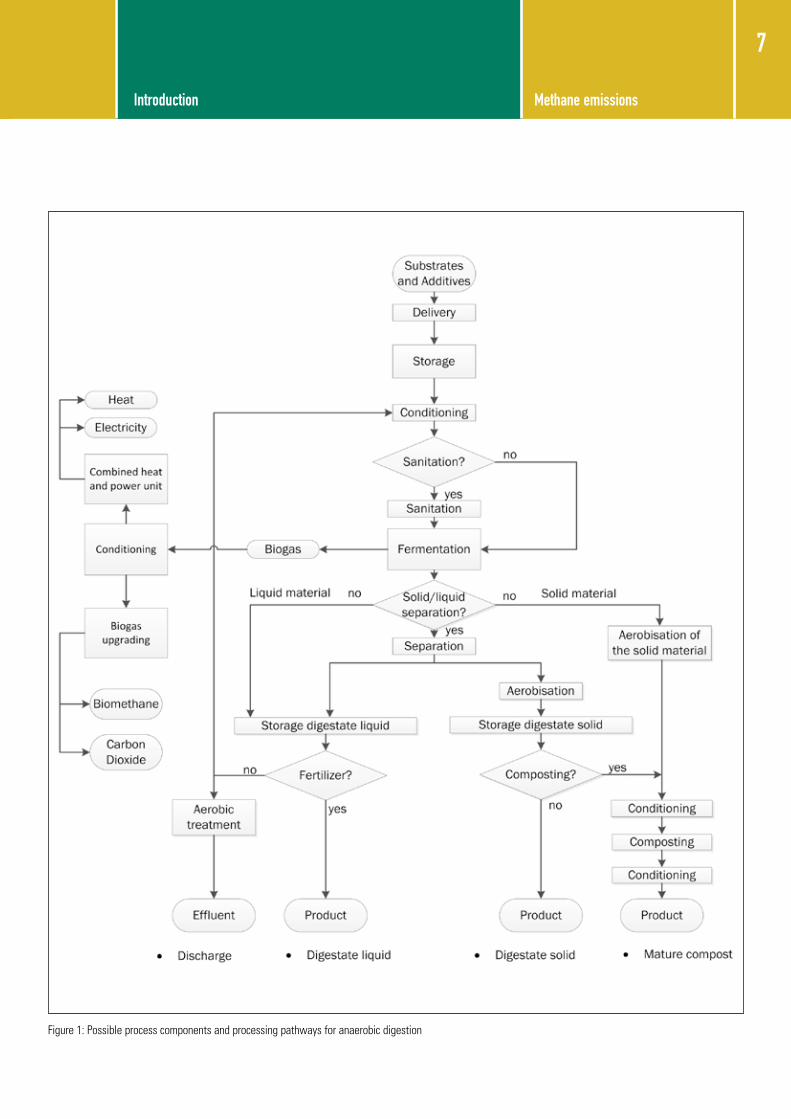
4.1 Portable imaging infrared camera Portable imaging infrared (IR) cameras (Figure 4)
have been developed based on passive remote gas detec-
tion by infrared spectro-radiometry. Based on the spec-
tral analysis of radiation in the infrared spectral range,
which is absorbed and/or emitted by the molecules of a
gas cloud, an IR camera enables the visualization of gas
clouds. The limit of detection of an IR camera (as given
by the manufacturer) amounts to about 50 ppm*m
(Esders GasCam SG). It depends on the background and
the temperature difference between the gas and the back-
ground. By means of the passive infrared method, it is
possible to visualise gas plumes in front of an unrefer-
enced background such as the sky. Box 1 details features
of an FLIR infrared camera system. There are other pro-
ducers of such systems including Esders.
Gas clouds moving in free space can be visualized in
real time and emission sources along the entire biogas
process chain can be located. Typically, leaks at a distance
of 0 up to at least 30 to 40 meters (dependent on the size
of the leak and the conditions) can be detected. The
detection limit (FLIR product) is given by the company
as 8 l h-1 (for GasFindIR, which is the previous model of
GF 320; Benson et al. 2006), users of such equipment give
12 l h-1 (8 m distance, no information about wind condi-
tions) as a threshold (Clemens et al., 2014). The big
advantage here is that large plant sections can be evalu-
ated in a short time. In addition, inaccessible components
of the plant such as elevated gas pipes or rubber domes
can be checked with an IR camera.
When applying these technologies the following
aspects should be considered. The IR camera is not very
suitable for indoor measurements. The actual occurring
methane concentrations need to be confirmed by other
devices since, weather conditions, temperature of the
released gas, and measurement set up, have an influence
on the visibility of the emissions. The camera is easy to
handle and the emission source is visible, which makes
leakage detection easy. The size of the leakage can be
roughly estimated from the visible emission rate.
Methane emissionsDevices for emission measurements
11
Figure 4: a) IR camera during use on the DBFZ exploratory biogas plant (handheld device from FLIR) b) Camera setup GasCam (Esders GmbH, Haselünne)
Box 1: Features of one possible IR camera system:Device:
Producer:
Type:
Measurement principle:
Measurable gases:
Temperature range:
Temperature uncertainty:
Leakage range (declaration for the pre-vious model GasFindIR):
Explosion protection:
Imaging IR camera
FLIR
GF 320
Passive infrared
Methane, Ethane, Propane, Butane, Ethylene and others
- 40 – 350 °C
±1 °C for temperature range 0 – 100 °C and ±2 % of the reading for the range > 100 °C
Depending on temperature difference/distance to source; detection limit for methane (laboratory): about 8 l h-1 (release of pure methane, 3 m distance and 8 km h-1 wind (Benson et al., 2006)
Not protected
4. Devices for emission measurements

Methane emissions Devices for emission measurements
12
4.2 Portable methane laser The portable methane laser is, like the IR camera, a
remote sensing measurement technology. In contrast to
the camera, the laser is based on an active IR measure-
ment principle. From the device an IR laser beam with a
certain wavelength (e.g. 1,653 nm) is emitted and reflect-
ed back from a surface to the detector in the device. The
intensity of the reflected laser light decreases exponen-
tially with raised distance from laser source to reflection
surface. Due to the installed laser diode and the selected
wave length the device is sensitive to methane. From the
measured absorption the device calculates path inte-
grated methane concentration stated in ppm*m. The
measured value has to be divided by the distance to the
reflection surface to get path-averaged concentration in
ppm. This principle is schematically shown in Figure 5.
Box 2 gives features of one possible methane laser.
Brands include Growcon or Sewerin lasers.
The laser is able to determine the methane concen-
tration at the direct leakage spot. However, only path
average results are available. The laser is explosion proof,
applicable for indoor leakage detection, and allows inac-
cessible components to be analysed. It gives an actual
methane concentration value; this is not the case for the
IR camera. It has a low detection limit. The leakage is not
visible, which might make the identification of the
actual leakage point difficult.
4.3 Remote sensing systems Remote sensing systems operate over distances and
are either able to detect path averaged concentrations
over the measuring path or can even give a spatial reso-
lution of gas plumes.
An often used technique to measure gas concentra-
tions on an open path is a tunable diode laser absorption
spectrometry (TDLAS) (Figure 6). The device emits
laser light in near IR, which is reflected by a retroreflec-
tor positioned at a certain distance. Subsequently, the
device detects the reflected light again. The wavelength
emitted by the laser diode is tuned over a certain absorp-
tion line of a specific gas, in this case methane. Depend-
ing on the wavelength, the light is absorbed by the meth-
ane molecules within the measurement path. From the
detected light intensity per wavelength, the number of
molecules, and the path averaged gas concentration can
be determined.
Tuning over one specific absorption line has the
advantage of single gas detection and the risk of interfer-
ences with other present gases is reduced. The response
time is low.
Figure 5: Use of a portable methane laser to detect leakages (left: Holmgren et al., 2015; right: Hermann Sewerin GmbH, Gütersloh)
Box 2: Features of one possible portable methane laserDevice:
Producer:
Type:
Measurement principle:
Measurement range:
Measurement uncertainty:
Calibration:
Explosion proof:
Portable methane laser
GROWCON
LaserMethane® mini Gen2
TDLAS (Tunable Diode Laser Absorption Spectroscopy)
1 – 50.000 ppm m (depending on distance/reflection surface)
± 10 % (1000 ppm m and 2 m distance)
Self-calibrating by integrated gas measuring cell
II 2G Ex ib IIA T1

Methane emissionsDevices for emission measurements
13
The device delivers a path-integrated concentration
(ppm*m). The possible path lengths depend on the setup
and the size of the source area and range usually up to
500 m. The restriction for the system is that one laser can
measure only one target gas, and in case of dust, steam or
fog the laser beam is diminished too much and the analy-
sis will not be possible.
Besides this system there are other options for remote
sensing devices as for instance the open path Fourier
Transform Infrared Spectroscopy (FTIR). This system is
more sophisticated and requires more effort for proper
handling and data evaluation. On the other hand, a vari-
ety of gases can be measured at one time. Both systems
require a (microscale) meteorological model to calculate
emission rates from a source. Additional options are
Light Detection and Ranging (LIDAR) and differential
absorption LIDAR (DIAL), which allow also a spatial
resolution of the measured gases, but require even more
effort for an onsite plant evaluation (Merril et al., 2011).
Another approach of remote sensing is measurement
of gas concentrations on transects in the down-wind
plume of the source using cavity-ring down spectroscopy
(Mønster et al., 2014). The options to use these measure-
ments for emission rate calculation will be discussed in
chapter 5.2.
Box 3 lists features of one potential device for meth-
ane measurements. Other producers of TDLAS systems
include: PKL Technologies; Neo Monitors; Unisearch
Canada.
4.4 Portable gas analyserPortable gas analysis devices used for emission analy-
sis have usually been produced for applications other
than emissions from biogas applications. In comparison
to the open path technologies, these systems take a sam-
ple from ambient air and analyse these inside the device.
Such devices can be used to identify elevated concentra-
tions in the ambient air or within defined flow rates, gas
concentrations for the calculation of the emission rate.
Depending on the sensor or the measurement principle
within the device the measurement range and measure-
ment uncertainty are quite different.
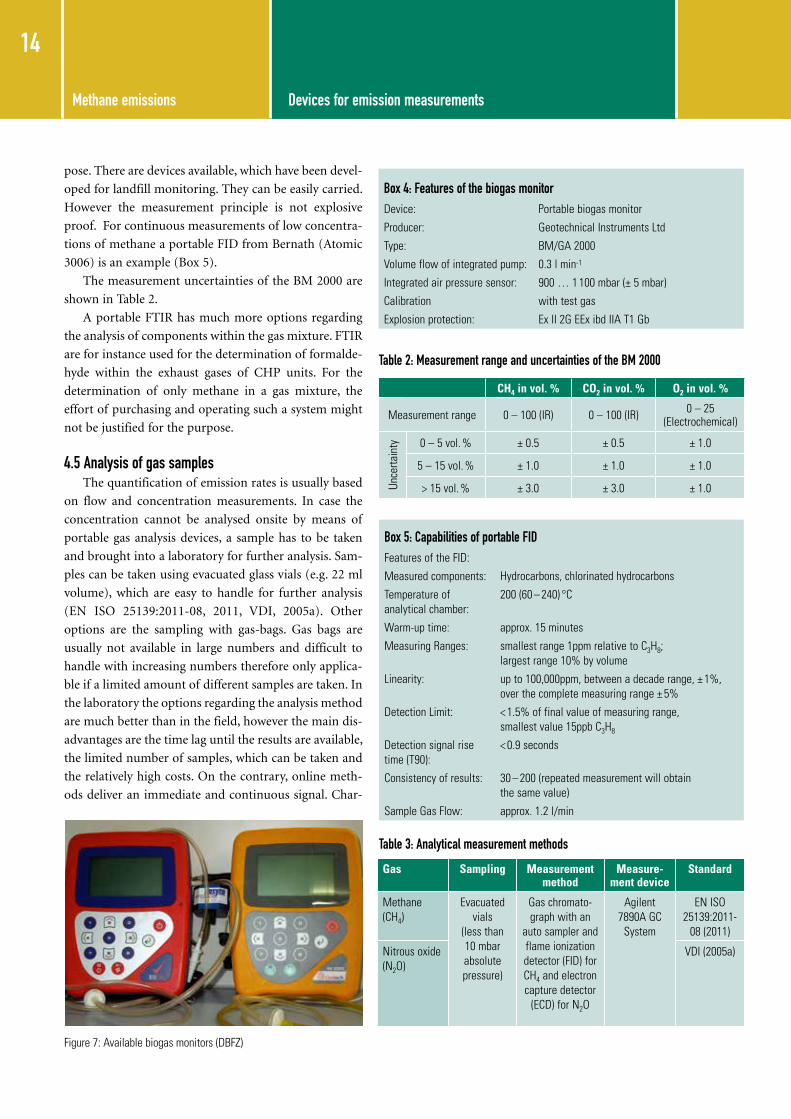
Portable biogas analysers (Figure 7, Box 4) are usually
used for the evaluation of gas composition of biogas,
equipped with infrared sensors for methane and carbon
dioxide and optionally additional gases such as oxygen
and nitrous oxide. Since the main purpose of these
devices is the analysis of biogas they have limited value
for the emission measurements – the measurement preci-
sion in the low concentration range (ppm) is insufficient.
Such analyzers help to identify leakages and to verify the
release of biogas; they can help to identify dangerous
concentrations in the range of the explosion limit. They
are quite commonly in use within the sector. Table 2
outlines the measurement range and the accuracy avail-
able in one optional device. Portable Flame Ionization
Detectors (FID) can provide a much more precise analy-
sis of gases with low content of organic carbon. The FID
gives a good result on combustible hydrocarbons. Since
methane is usually the main component of hydrocarbons
emitted from a biogas plant, other hydrocarbons can be
neglected and the method is precise enough for the pur-
Box 3: Features of one methane laser
Device:
Producer:
Type:
Measurement principle:
Measurement range:
Measurement uncertainty:
Last calibration:
Explosive protection:
Portable methane laser (application is stationary)
Boreal
GasFinder 2.0
TDLAS (Tunable Diode Laser Absorption Spectrometry)
1 to 500m, LDL 1ppmm for methane
1 ppmm
Self-calibrating by integrated gas measuring cell
No
Figure 6 Open path tuneable diode laser systems in use at a biogas plant (DBFZ)
Methane emissions Devices for emission measurements
14
pose. There are devices available, which have been devel-
oped for landfill monitoring. They can be easily carried.
However the measurement principle is not explosive
proof. For continuous measurements of low concentra-
tions of methane a portable FID from Bernath (Atomic
3006) is an example (Box 5).
The measurement uncertainties of the BM 2000 are
shown in Table 2.
A portable FTIR has much more options regarding
the analysis of components within the gas mixture. FTIR
are for instance used for the determination of formalde-
hyde within the exhaust gases of CHP units. For the
determination of only methane in a gas mixture, the
effort of purchasing and operating such a system might
not be justified for the purpose.
4.5 Analysis of gas samplesThe quantification of emission rates is usually based
on flow and concentration measurements. In case the
concentration cannot be analysed onsite by means of
portable gas analysis devices, a sample has to be taken
and brought into a laboratory for further analysis. Sam-
ples can be taken using evacuated glass vials (e.g. 22 ml
volume), which are easy to handle for further analysis
(EN ISO 25139:2011-08, 2011, VDI, 2005a). Other
options are the sampling with gas-bags. Gas bags are
usually not available in large numbers and difficult to
handle with increasing numbers therefore only applica-
ble if a limited amount of different samples are taken. In
the laboratory the options regarding the analysis method
are much better than in the field, however the main dis-
advantages are the time lag until the results are available,
the limited number of samples, which can be taken and
the relatively high costs. On the contrary, online meth-
ods deliver an immediate and continuous signal. Char-
Figure 7: Available biogas monitors (DBFZ)
Box 4: Features of the biogas monitorDevice:
Producer:
Type:
Volume flow of integrated pump:
Integrated air pressure sensor:
Calibration
Explosion protection:
Portable biogas monitor
Geotechnical Instruments Ltd
BM/GA 2000
0.3 l min-1
900 … 1 100 mbar (± 5 mbar)
with test gas
Ex II 2G EEx ibd IIA T1 Gb
Box 5: Capabilities of portable FIDFeatures of the FID:
Measured components:
Temperature of analytical chamber:
Warm-up time:
Measuring Ranges:
Linearity:
Detection Limit:
Detection signal rise time (T90):
Consistency of results:
Sample Gas Flow:
Hydrocarbons, chlorinated hydrocarbons
200 (60 – 240) °C
approx. 15 minutes
smallest range 1ppm relative to C3H8; largest range 10% by volume
up to 100,000ppm, between a decade range, ± 1%, over the complete measuring range ± 5%
< 1.5% of final value of measuring range, smallest value 15ppb C3H8
< 0.9 seconds
30 – 200 (repeated measurement will obtain the same value)
approx. 1.2 l/min
Table 2: Measurement range and uncertainties of the BM 2000
CH4 in vol. % CO2 in vol. % O2 in vol. %
Measurement range 0 – 100 (IR) 0 – 100 (IR) 0 – 25 (Electrochemical)
Unce
rtain
ty 0 – 5 vol. % ± 0.5 ± 0.5 ± 1.0
5 – 15 vol. % ± 1.0 ± 1.0 ± 1.0
> 15 vol. % ± 3.0 ± 3.0 ± 1.0
Table 3: Analytical measurement methods
Gas Sampling Measurement method
Measure-ment device
Standard
Methane(CH4)
Evacuated vials
(less than 10 mbar absolute pressure)
Gas chromato-graph with an
auto sampler and flame ionization detector (FID) for CH4 and electron capture detector
(ECD) for N2O
Agilent 7890A GC
System
EN ISO 25139:2011-
08 (2011)
Nitrous oxide(N2O)
VDI (2005a)
Methane emissionsMethods for measuring and calculation of methane emission rates
15
acteristics of analytical measurements in Gas Chromato-
graphs are outlined in Table 3 and Table 4.
4.6 Measurement of flow ratesThe flow rates can be determined by means of vane
anemometer or pitot tube with a microanemometer.
Based on the cross section area of the investigated pipes
and the measured flow rates the volume flows will be
calculated as per Table 5.
5.1 Single source methodThe method requires the identification and quantifi-
cation of every single emission source on site. Accord-
ingly, the procedure can be described as follows:
1. Identification of emission sources;
2. Setup for emission sources with respective methods for:
• Digestate storage;
• Leakages;
• Upgrading units;
• Pressure relief valves;
• Exhaust pipes (e.g. CHP units or gas
collection systems);
• Open (in case no centralized air collection system
available) post composting windrows.
3. Determination of flow rate;
4. Determination of concentration of target gas;
5. Calculation of emission rates;
6. Summation of all sources.
In the following, several measurement setups at dif-
ferent emission sources are briefly introduced. The on-
site approach and the corresponding methods can be
significantly different. In Holmgren et. al. (2015) results
of measurements carried out by several teams from dif-
ferent countries, who investigated one biogas plant dur-
ing one week are summarized. It became apparent, that
the definition of emission sources can be different, as well
as the approach to measure them. Additionally, the emis-
sions from the investigated plant were shown to be time
variant and the different teams have not identified all
sources. However, even if the single measurements
diverged among them, the overall results were in the
same range. Normally, the possibility to have several
teams on site will not occur under normal conditions and
therefore the plant evaluation has to be carried out with
care. In any case it will never be certain that all emission
sources are recorded.
5.1.1 Identification of emission sources - leakage detection
Leakage detection on biogas sites has been a topic of
increasing interest since development of imaging infra-
red cameras, which allow the visualisation of emissions,
Table 3: Analytical measurement methods
Table 4: Uncertainty of a stationary laboratory GC (DBFZ data)
Gas Sampling Measurement method
Measure-ment device
Standard
Methane(CH4)
Evacuated vials
(less than 10 mbar absolute pressure)
Gas chromato-graph with an
auto sampler and flame ionization detector (FID) for CH4 and electron capture detector
(ECD) for N2O
Agilent 7890A GC
System
EN ISO 25139:2011-
08 (2011)
Nitrous oxide(N2O)
VDI (2005a)
CH4 in Vol. %
Measurement range 1.96 – 39,540 ppm
Unce
rtain
ty 1.96 – 100.09 ppm ± 8 %
100.09 – 2,001 ppm ± 7 %
1,977 – 39,540 ppm ± 3 %
Table 5: Devices for flow rate measurements
device Measurement range
Accuracy
Vane anemometer, e.g. Testo 416
0.6 – 40 m s-1
0.2 m s-1 and ±1.5 % from measurement value
Pitot tube and sensor for pressure diffe-rence, e.g. Ahlborn FDA602
± 1,250 Pa 1 – 40 m s-1 ± 6,800 Pa
2 – 90 m s-1
±0.5 % from upper range value
5. Methods for measuring and calculation of methane emission rates

Methane emissions Methods for measuring and calculation of methane emission rates
16
and makes the process much easier. However, the equip-
ment alone does not ensure a sufficient plant evaluation
and so far no specific standard procedure for leakage
detection for biogas plants has been defined. There are
some approaches from industrial entrepreneurs to define
basic requirements for leakage detection of biogas facili-
ties (Clemens et al., 2014). In any case, it should be
mentioned that the identification of a leak does not
provide information on the emission rate coming from
the leakage nor does a concentration measurement in
the proximity of a leak provide an accurate assessment
of the concentration of the methane in the leak.
In Clemens et al. (2014) basic equipment for any plant
inspection is recommended as follows:
• IRcamera;
• Methanesensitivegasanalyser;
• Devices for documentation of weather conditions
(ambient pressure, temperature, wind speed);
• Devicesfortheevaluationofflowrates.
The documentation of the results according to (Clemens
et al., 2014) should include:
• Weather conditions as ambient pressure, tempera-
ture, wind speed, cloudiness, precipitation;
• Description of the plant with site plan/drawings or
photos;
• Operational state of the plant (gas storage filling level,
gas pressure, CHP performance);
• Site plan of the discovered leaks (leakages need to be
documented based on pictures and film);
• Qualitative evaluation of leakage based on a matrix
containing factors such as estimated flow, location
(closed room or open), accessibility, potential of
expansion of the leak, distance to ignition source.
During the plant evaluation it should be made clear
that all plant components are covered sufficiently dur-
ing the survey. The logging of the camera positions
during the plant survey might help to verify that all
parts of the plants have been evaluated.
5.1.2 Open/dynamic chambersOpen floating chamber methods have been used
extensively to quantify GHG fluxes from liquid manure
storage facilities. Experimental approaches using float-
ing chambers typically have relied on four to six cham-
bers with area ranging between 0.1 to 0.7 m2. The open
chamber method has been also applied for the investiga-
tion of leakages and covered digestate tanks.
The open chamber has an input and output pipe and
a connected blower to produce a constant airflow
through the chamber (Figure 8 and Figure 9). The gas
from the emission source (leakage) and the fresh air are
mixed in the space within the chamber and the concen-
tration of the target gas is analysed by sampling the gas
in the input and output stream of the chamber. The
quantity of the emission source is calculated from the
concentration difference and the flow rate of the blower
by using Equation 1 from (Liebetrau et. al. 2013b).
The equipment and the method need to take into
account, that by applying an open chamber there is the
possibility, depending on the emission source, of reach-
ing the explosion limit. If the concentration reaches a
specific value (e.g. 20 % of the lower explosion limit) the
volume flow of the blower should be increased to lower
Figure 8: Methane emissions from leakage a) graphic account (DBFZ) b) picture documentation (DBFZ)
EV . (Cout – Cin)
A
.
=
E Surface specific emission mass flow in mg CH4 h-1
Air flow in m3Air h-1 STP, dry Gas density of methane in mg ml-1
Exhaust and background methane concentration in ppmv (mlCH4 m-3Air)A Encapsulated surface area of the chamber in m2
V.
Cout and Cin
outgoing air (point of measurement)
inlet air
digester
leakage
blower
Equation 1
Methane emissionsMethods for measuring and calculation of methane emission rates
17
the measured concentration.
In case the open chamber concept is applied at leak-
ages, the identified leakage is encapsulated, thus creating
a “chamber” around the leakage and producing a con-
stant flow by means of a connected blower. The blower
flow rate should be set as low as possible in order to avoid
influence on the emission source.
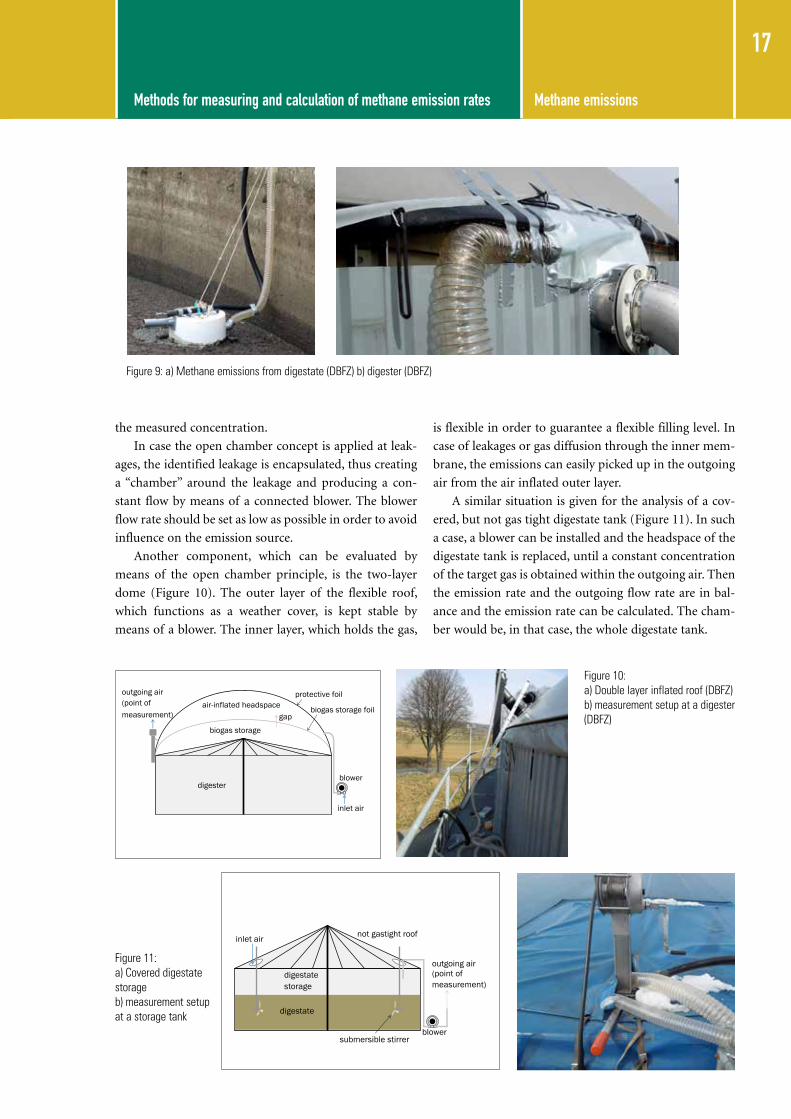
Another component, which can be evaluated by
means of the open chamber principle, is the two-layer
dome (Figure 10). The outer layer of the flexible roof,
which functions as a weather cover, is kept stable by
means of a blower. The inner layer, which holds the gas,
is flexible in order to guarantee a flexible filling level. In
case of leakages or gas diffusion through the inner mem-
brane, the emissions can easily picked up in the outgoing
air from the air inflated outer layer.
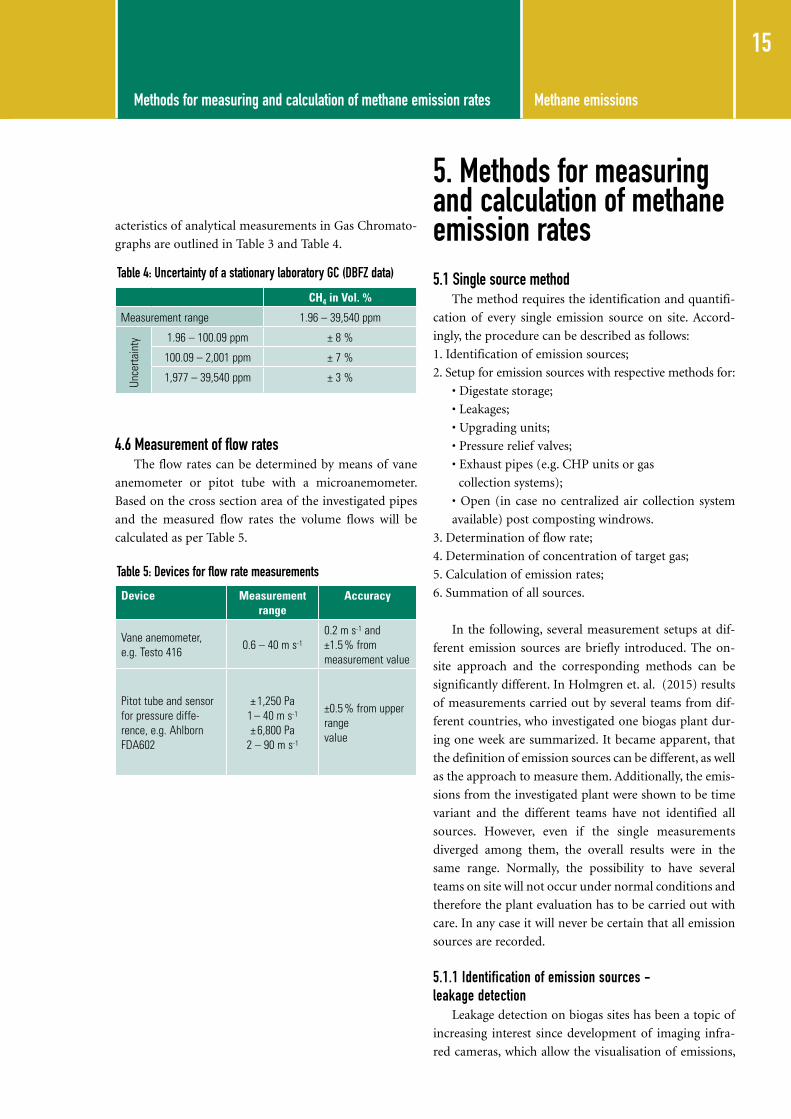
A similar situation is given for the analysis of a cov-
ered, but not gas tight digestate tank (Figure 11). In such
a case, a blower can be installed and the headspace of the
digestate tank is replaced, until a constant concentration
of the target gas is obtained within the outgoing air. Then
the emission rate and the outgoing flow rate are in bal-
ance and the emission rate can be calculated. The cham-
ber would be, in that case, the whole digestate tank.
Figure 11: a) Covered digestate storage b) measurement setup at a storage tank
Figure 9: a) Methane emissions from digestate (DBFZ) b) digester (DBFZ)
Figure 10: a) Double layer inflated roof (DBFZ) b) measurement setup at a digester (DBFZ)
biogas storage
air-inflated headspace
blower
outgoing air (point of measurement)
inlet air
digester
gap
protective foil biogas storage foil
blower
inlet air
digestate storage
not gastight roof
submersible stirrer
outgoing air (point of measurement)
digestate
Methane emissions Methods for measuring and calculation of methane emission rates
18
Large scale open chambers have been used to evalu-
ate the emissions from composting heaps during post
treatment of digestates (Figure 12).
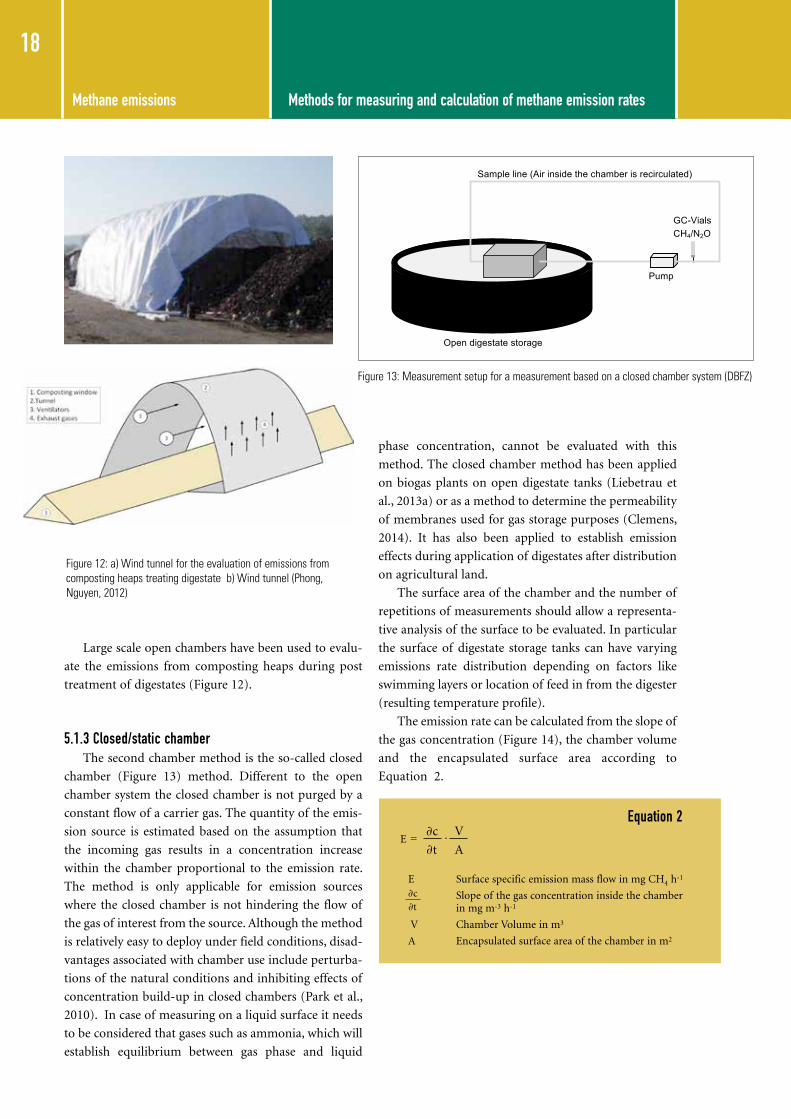
5.1.3 Closed/static chamberThe second chamber method is the so-called closed
chamber (Figure 13) method. Different to the open
chamber system the closed chamber is not purged by a
constant flow of a carrier gas. The quantity of the emis-
sion source is estimated based on the assumption that
the incoming gas results in a concentration increase
within the chamber proportional to the emission rate.
The method is only applicable for emission sources
where the closed chamber is not hindering the flow of
the gas of interest from the source. Although the method
is relatively easy to deploy under field conditions, disad-
vantages associated with chamber use include perturba-
tions of the natural conditions and inhibiting effects of
concentration build-up in closed chambers (Park et al.,
2010). In case of measuring on a liquid surface it needs
to be considered that gases such as ammonia, which will
establish equilibrium between gas phase and liquid
phase concentration, cannot be evaluated with this
method. The closed chamber method has been applied
on biogas plants on open digestate tanks (Liebetrau et
al., 2013a) or as a method to determine the permeability
of membranes used for gas storage purposes (Clemens,
2014). It has also been applied to establish emission
effects during application of digestates after distribution
on agricultural land.
The surface area of the chamber and the number of
repetitions of measurements should allow a representa-
tive analysis of the surface to be evaluated. In particular
the surface of digestate storage tanks can have varying
emissions rate distribution depending on factors like
swimming layers or location of feed in from the digester
(resulting temperature profile).
The emission rate can be calculated from the slope of
the gas concentration (Figure 14), the chamber volume
and the encapsulated surface area according to
Equation 2.
Figure 12: a) Wind tunnel for the evaluation of emissions from composting heaps treating digestate b) Wind tunnel (Phong, Nguyen, 2012)
Figure 13: Measurement setup for a measurement based on a closed chamber system (DBFZ)
VL2014, 18.07.2012
Open digestate storage
Pump
GC-Vials CH4/N2O
Sample line (Air inside the chamber is recirculated)
E∂c V
=
E Surface specific emission mass flow in mg CH4 h-1
Slope of the gas concentration inside the chamber in mg m-3 h-1
V Chamber Volume in m3
A Encapsulated surface area of the chamber in m2
.
∂c∂t
Equation 2
∂t A

Methane emissionsMethods for measuring and calculation of methane emission rates
19
5.1.4 Pressure relief valves (PRV)Quantification of emissions from PRVs represents a
specific challenge. PRVs are safety devices. Therefore the
installation of any additional equipment is strongly regu-
lated. Besides the legal aspects of the installation of
equipment on a safety device the functioning of the
safety equipment shall not be impeded
by the measurement or during installa-
tion in any way.
The evaluation of mass flows within
the pressure relieve valves requires the
installation of a flow velocity sensor.
This reduces the sectional area and
increases consequently the opening
pressure of the PRV. PRVs (Figure 15 &
16) are designed to open at a certain
overpressure and allow a flow rate in
order to prevent damage to the roof.
Before installing measurement equip-
ment the consequences needs to be
evaluated and if necessary the manu-
facturer of the PRV and the biogas
plant need to be consulted.
The installation of a temperature
sensor within the release pipe allows the detection of a
release event, since the biogas temperature in the roof
differs from the ambient temperature. During the release
event, the sensor will detect a sharp temperature change.
The temperature sensor allows only the reckoning of
release events, but no flow quantification.
Figure 15: Schematic representation of the measurement setup for PRV monitoring (adopted from Heeren Hepolan GmbH, Schorba)
Figure 16: Measurement setup for PRV moni-toring (DBFZ)
Figure 13: Measurement setup for a measurement based on a closed chamber system (DBFZ)
Figure 14: Example of a concentration increase within a closed chamber (Holmgren et al., 2015)
Methane emissions Methods for measuring and calculation of methane emission rates
20
According to the construction of a pressure relief
valve and the pressure situation within the gas collection
and storage system the opening characteristics of the
device are set. In case of changes at the device for meas-
urement purposes the resulting pressure and flow char-
acteristics needs to be evaluated and documented in a
test certificate in order to avoid damage to the plant.
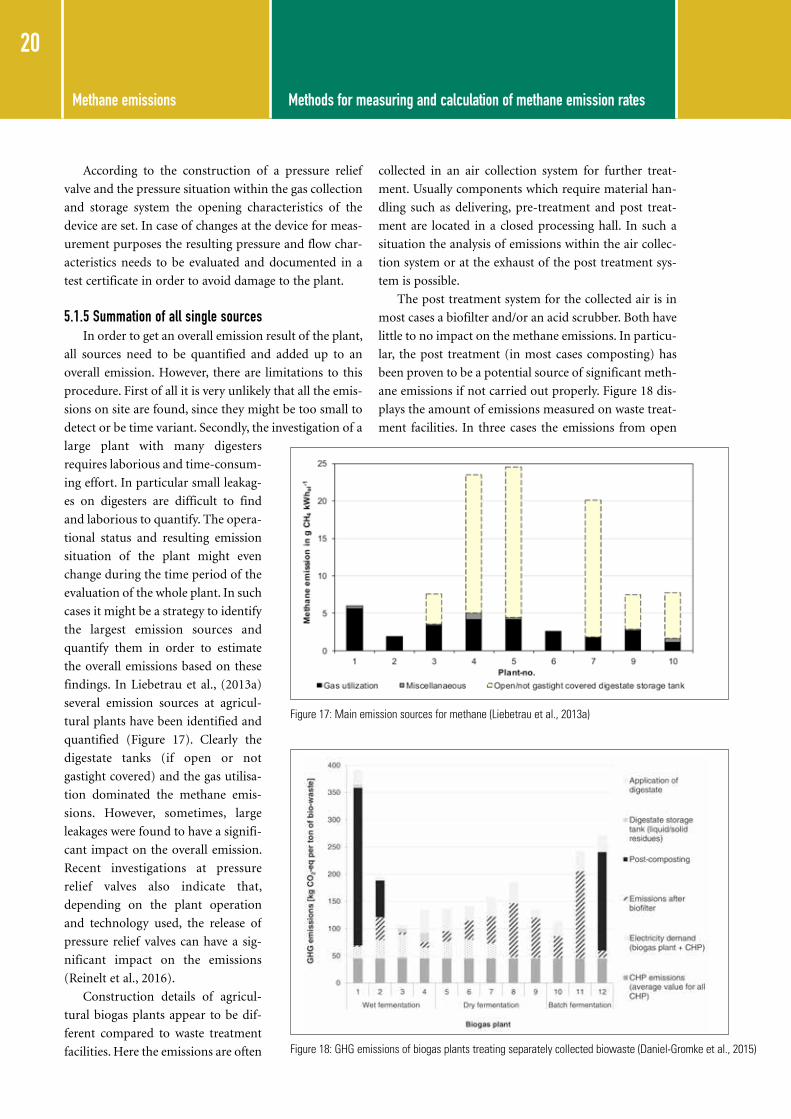
5.1.5 Summation of all single sources In order to get an overall emission result of the plant,
all sources need to be quantified and added up to an
overall emission. However, there are limitations to this
procedure. First of all it is very unlikely that all the emis-
sions on site are found, since they might be too small to
detect or be time variant. Secondly, the investigation of a
large plant with many digesters
requires laborious and time-consum-
ing effort. In particular small leakag-
es on digesters are difficult to find
and laborious to quantify. The opera-
tional status and resulting emission
situation of the plant might even
change during the time period of the
evaluation of the whole plant. In such
cases it might be a strategy to identify
the largest emission sources and
quantify them in order to estimate
the overall emissions based on these
findings. In Liebetrau et al., (2013a)
several emission sources at agricul-
tural plants have been identified and
quantified (Figure 17). Clearly the
digestate tanks (if open or not
gastight covered) and the gas utilisa-
tion dominated the methane emis-
sions. However, sometimes, large
leakages were found to have a signifi-
cant impact on the overall emission.
Recent investigations at pressure
relief valves also indicate that,
depending on the plant operation
and technology used, the release of
pressure relief valves can have a sig-
nificant impact on the emissions
(Reinelt et al., 2016).
Construction details of agricul-
tural biogas plants appear to be dif-
ferent compared to waste treatment
facilities. Here the emissions are often
collected in an air collection system for further treat-
ment. Usually components which require material han-
dling such as delivering, pre-treatment and post treat-
ment are located in a closed processing hall. In such a
situation the analysis of emissions within the air collec-
tion system or at the exhaust of the post treatment sys-
tem is possible.
The post treatment system for the collected air is in
most cases a biofilter and/or an acid scrubber. Both have
little to no impact on the methane emissions. In particu-
lar, the post treatment (in most cases composting) has
been proven to be a potential source of significant meth-
ane emissions if not carried out properly. Figure 18 dis-
plays the amount of emissions measured on waste treat-
ment facilities. In three cases the emissions from open
Figure 17: Main emission sources for methane (Liebetrau et al., 2013a)
Figure 17: Main emission sources for methane (Liebetrau et al., 2013a)
Figure 18: GHG emissions of biogas plants treating separately collected biowaste (Daniel-Gromke et al., 2015)
Methane emissionsMethods for measuring and calculation of methane emission rates
21
windrow composting have been measured separately
(since the composting was carried out in an open envi-
ronment without an air collection system). The results
indicate the substantial impact of the composting process
on the overall emissions (Daniel-Gromke et al., 2015).
The results of the measurement campaign, which also
included ammonia and nitrous oxide measurements,
identified methane as the dominating GHG source.
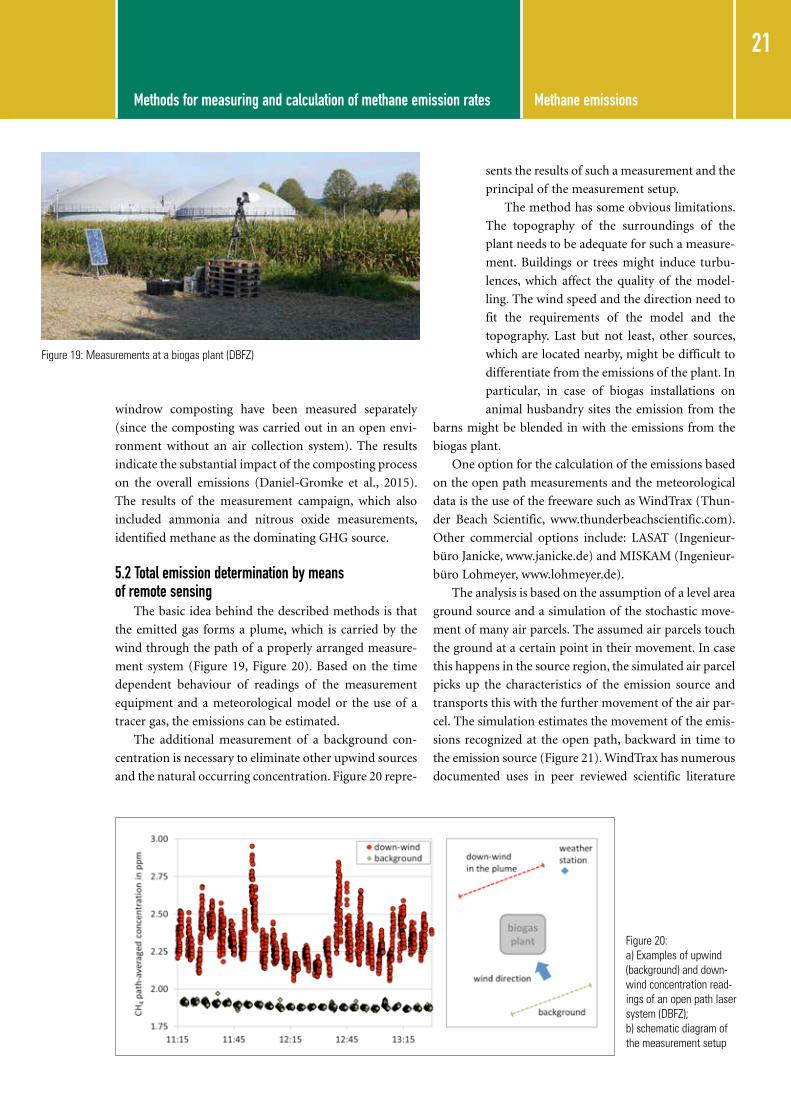
5.2 Total emission determination by means of remote sensing
The basic idea behind the described methods is that
the emitted gas forms a plume, which is carried by the
wind through the path of a properly arranged measure-
ment system (Figure 19, Figure 20). Based on the time
dependent behaviour of readings of the measurement
equipment and a meteorological model or the use of a
tracer gas, the emissions can be estimated.
The additional measurement of a background con-
centration is necessary to eliminate other upwind sources
and the natural occurring concentration. Figure 20 repre-
sents the results of such a measurement and the
principal of the measurement setup.
The method has some obvious limitations.
The topography of the surroundings of the
plant needs to be adequate for such a measure-
ment. Buildings or trees might induce turbu-
lences, which affect the quality of the model-
ling. The wind speed and the direction need to
fit the requirements of the model and the
topography. Last but not least, other sources,
which are located nearby, might be difficult to
differentiate from the emissions of the plant. In
particular, in case of biogas installations on
animal husbandry sites the emission from the
barns might be blended in with the emissions from the
biogas plant.
One option for the calculation of the emissions based
on the open path measurements and the meteorological
data is the use of the freeware such as WindTrax (Thun-
der Beach Scientific, www.thunderbeachscientific.com).
Other commercial options include: LASAT (Ingenieur-
büro Janicke, www.janicke.de) and MISKAM (Ingenieur-
büro Lohmeyer, www.lohmeyer.de).
The analysis is based on the assumption of a level area
ground source and a simulation of the stochastic move-
ment of many air parcels. The assumed air parcels touch
the ground at a certain point in their movement. In case
this happens in the source region, the simulated air parcel
picks up the characteristics of the emission source and
transports this with the further movement of the air par-
cel. The simulation estimates the movement of the emis-
sions recognized at the open path, backward in time to
the emission source (Figure 21). WindTrax has numerous
documented uses in peer reviewed scientific literature
Figure 19: Measurements at a biogas plant (DBFZ)
Figure 20: a) Examples of upwind (background) and down-wind concentration read-ings of an open path laser system (DBFZ); b) schematic diagram of the measurement setup

Methane emissions Methods for measuring and calculation of methane emission rates
22
(Flesch et al., 2011; Harper et al., 2010; Laubach et al.,
2013; Crenna et al., 2008; Gao et al., 2010; Groth et al.,
2015; Hrad et al., 2015; Holmgren et al., 2015).
An inverse dispersion model based on a Backward
Lagrangian Stochastic model is
used within the software (Flesch
et al., 2004). The model assumes
the source to be an area source
and does not consider buildings
or other elevated constructions
in particular. However, the effect
of such elevated structures
becomes less relevant with
increasing distance from the
structure (Gao et al., 2010).
The model also allows the
inclusion of known point sourc-
es. This makes it possible to
improve the accuracy of the cal-
culation.
Windtrax requires the following
input parameters:
• Meteorological conditions
(mean values per ¼ h)
• Concentrations (background
and downwind) (mean values
such as per ¼h)
• Area source geometry.
The result of the simulation is
an emission rate of the defined
area source. The advantage of
such measurements is the visibil-
ity of the overall emissions of a
biogas facility over a long period
of time. All emission sources are
included in the measurement, and time variant emis-
sions caused by specific operational situations as given
in Figure 22 can be identified. The example shows a
switch of compressor units (part of a biomethane grid
injection installation), which releases immediately ca. 50
m³ of biogas. In parallel, the gas utilization was shut
down, which caused pressure relief events. Such short
and specific events are difficult to detect by means of on
site evaluation based on cameras or portable gas detec-
tion systems. They are easy to detect by means of long-
term analysis.
In case of no substantial single emission events, the
method provides reproducible and normally distributed
results. Figure 23 presents the distribution of results
(ordered by size) of 4 measurement campaigns on one
biogas plant. The reason for the variance in results can be
either emission fluctuation or variance in the modelling.
Biogas plant Measurement section
„Touchdown“
Figure 21: Schematic of the concept of WindTrax based simulation (DBFZ)
Figure 22: Open path readings on a biogas plant with pronounced emission events as release of pressure relief events (Westerkamp et al., 2014b)
1,8
2,2
2,6
3,0
3,4
12:00 12:30 13:00 13:30 14:00 14:30 15:00 15:30
Path
ave
rage
d co
ncen
trat
ion
in
ppm
June 2013 d = 85 m Θ = 290°
Over pressure reliefs
Switch between compressor units Background concentration
Figure 23: Emissions from a biogas plant based on open path readings (15 min average, sorted by size) and WindTrax based calculations, adopted from Westerkamp et al. (2014a).

Methane emissionsMethods for measuring and calculation of methane emission rates
23
5.3 Other methodsTwo methods, which have been published in recent
years, are presented here. The authors do not claim to
have covered all possible options for further methods.
5.3.1 Tracer dispersion methodThe following description is derived from Mønster
et al., (2014).
The analysis is based on a mobile tracer dispersion
method, which combines a controlled release of tracer
gas from the biogas facility with concentration measure-
ments downwind of the facility by using a mobile high
resolution analytical instrument. The base assumption is
that the tracer gas, which is released at the source area
(the biogas facility) has the same dispersion characteris-
tics as the methane released from the facility. The concen-
tration ratio of tracer and target gas remains constant
along their atmospheric dispersion and the methane
emissions can be calculated using Equation 3.
The background needs to be considered as well. The
tracer gas should have a sufficiently long atmospheric
lifetime. Often gases such as N20, Acetylene and SF6 are
used. The downwind plume concentrations are measured
driving along transects with analytical equipment, which
is fast and has high sensitivity towards the target gases
down to ppb level. Often devices based on cavity ring
down spectroscopy are used for that purpose. The meas-
ured concentration and the geographical location need to
be logged. The correct simulation of the methane emitted
from the source by means of the tracer gas is very impor-
tant to obtain precise emission rates. The tracer gas
should be released from the part of the plant where the
most elevated methane concentrations are seen/expected
(see Figure 24).
Compared to the open path method the tracer disper-
sion method requires a path or a street, where the meas-
urement device can be transported. The results represent
a discrete evaluation of every sampling point, a continu-
ous observation without a gap of the plant is difficult to
realize. The mobility of the measurements makes it easier
to identify background sources than with the stationary
laser system.
5.3.2 Charm – CH4 airborne remote monitoringThe described method was used for a plant evaluation
and the results have been published in (Wolf, Scherello,
2013). The method described here is taken from this
publication.
The Charm® approach is carried out with a helicopter
based laser measurement system, which was developed by
a consortium around Open grid Europe GmbH in order
to perform airborne tightness checks of natural gas trans-
port pipelines. It was applied for the evaluation of an
upgrading plant (Einbeck, Germany).
The principle of the measurement devices is based on
a differential absorption LIDAR (Light Detection And
Ranging). It compares two different laser signals, where
one of them is influenced by the absorption of the target
gas.
The plant is investigated by a ringlike flight (fenceline
monitoring) around the plant. For the background
assessment a ringlike flight upwind of the plant was tak-
en. The emission rate is calculated based on the rectangu-
lar (to the ringlike measurement path) fraction of the
wind and the average methane concentration. Based on
this, the inflow- and outflow of the target gas into the
ring can be calculated. The path average of the methane
concentration (up to the flight altitude of the helicopter)
Table 6: Measurement results derived from the CHARM system at the biogas plant Einbeck
Figure 24: Schematic overview of the dynamic plume tracer dispersion method(Holmgren et al., 2015)
E∫∫
(CCH4)dx
(Ctr)dx
MWCH4
Equation 3
MWtr
plume end
plume end
plume start
plume start
=
Measurement setup Measured methane emission rate in m3 h-1
Released methane emission rate in m3 h-1
Background (upwind to the biogas plant)
0.0 ± 0.8 0
Biogas plant (without additional methane release)
2.07 ± 0.57 0
Biogas plant (with additional methane release in different rates)
4.86 ± 1.53 2.3
9.43 ± 1.18 6.3
12.27 ± 1.97 8.6

Methane emissions Methods for measuring and calculation of methane emission rates
24
does not resemble the weather conditions, which are
analysed in one height. According to the authors this
might lead to a misinterpretation of the data. During the
measurement flights methane was released in different
rates in order to prove the recovery rate. Details of the
measurement are included in Table 6.
Within the article the authors interpreted a portion
of 0.5 m³ h-1 as a result from the exhaust of the upgrad-
ing facility. The additional 1.5 m³ h-1 have been declared
as a nonpoint, fugitive source. An emission rate of
1.5 m³ h-1 represents 0.3 % of the methane produced at
the investigated plant.
There is an uncertainty within the measurements
and a deviation from the expected values too (Table 6).
However, the linear increase of the measured emission
rate (in the same manner as the additional release of
methane) validates the method according to the authors
of the article.
The method was transferred from leakage investiga-
tion of gas pipelines. It requires, as the other described
remote evaluation methods, a certain topography and
wind conditions. Additionally, the helicopter adds effort
and costs. Last but not least, compared to the stationary
open path system (see Chapter 5.2) the analysis of a
longer period of time (e.g. several hours/days) does not
seem practicable.
5.4 Emissions from open manure/digestate storage facilities
Emissions from open digestate or manure storage
tanks have been analysed in several studies by means of
chamber and remote sensing methods (Flesch et al.,
2013; Gioelli et al., 2011; Hrad et al. 2015; Husted, 1994;
Liebetrau et al., 2013a; Park et al., 2010; Ro et al., 2013).
The challenge of a precise determination of these
emissions is the dependency of the emission rate to the
gas potential of the digestate, the temperature within the
digestate, the retention time in the storage tank and the
non-even distribution of these characteristics in the
tank.
The gas potential of the digestate might be quite
constant over time given a constant substrate composi-
tion and feeding algorithm on the plant. The tempera-
ture of the digestate depends on factors like the design of
the tank, potential covers (gas tight, covered but not gas
tight, straw), topography of the surroundings and ambi-
ent temperature. Due to the lack of mixing the tempera-
ture is usually not evenly distributed within the storage
tank. Consequently, the emissions from the surface are
not evenly distributed over the surface area. The reten-
tion time of digestate depends on the times available for
digestate application on agricultural land and might
vary from year to year.
Several approaches have been taken to measure or
estimate the emissions from storage tanks. In any case,
short term measurements cannot consider the filling
level and the long term temperature behaviour in the
digestate storage and can therefore only give a very lim-
ited picture of the overall and long term emission situa-
tion.
Chamber method:A chamber (open or closed) is placed on the surface
and the emissions from the area covered by the chamber
are used to calculate the overall emissions of the storage
facility. The chamber might be placed on different spots
on the surface or remain installed for longer periods of
time to obtain reproducible results.
Emission potential (batch test of digestate at reduced temperature, e.g. 20°C):
A representative sample of the discharge of the last
vessel connected to the biogas collection system is taken
and incubated at reduced temperature to obtain the gas
production potential at those temperatures. In the opti-
mal case this temperature resembles the average annual
temperature within the digestate storage (FNR, 2010;
VDI, 2010). The result is used to describe an emission
potential of the digestate, a determination of the real
emissions is not possible with this method.
Open path method:The area emission source analysed in this case is the
digestate storage. Requirements on conditions are dis-
cussed in section 5.2.
Model based calculation based on batch tests:The approach aims to simulate the digestate storage
as a further digester and estimates the gas production
according to the gas potential of the digestate (measured
by batch tests), the degradation kinetics at different tem-
peratures (also taken from batch tests), the temperature
in the storage facility (which needs to be measured) and
the retention time (calculated based on the filling level).
This method includes most factors influencing the
results.
A scientific comparison of these methods is as yet
lacking. Table 7 gives a short evaluation of the methods.

Methane emissionsMethods for measuring and calculation of methane emission rates
25
In general, it can be stated that there is no method
available without major shortcomings. A proven method
for a precise determination of the annual emissions from
an open storage tank with a reasonable effort is currently
not available, neither is there a valid means of comparing
the different methods. However, there are several
approaches, which can deliver reasonable results if the
shortcomings and the assumptions to be made are con-
sidered. From the authors’ perspective the “model based
calculation method based on batch tests” tends to be the
method which is most advantageous and with reasonable
effort the most favourable.
5.5 Conclusions on measurement methods to quantify methane emissions from biogas plants
In terms of a brief overview, the measurement meth-
ods described are listed below:
•Source and leakage detection
• Gas camera
• Handheld laser
• Gas concentration measurements based
on gas samples
•Source quantification
• Open chamber
• Closed chamber
• Estimation from flow observation
(gas camera based)
• In pipe measurements
(flow and concentration)
• Open path remote sensing methods
• Tracer dispersion measurements
It should be mentioned that there are standards for
the estimation of emissions as described in EN
15446:2008. They are based on concentration measure-
ments in the vicinity of the leak and a factor based calcu-
lation of the emission rate. For the application within
natural gas containing pipes, Dyakowska et al (2014)
showed that there is no correlation between the EN
15446:2008 measured/calculated emission rate and the
set emission rate within the test system. Obviously, many
factors influence the concentration measurement close to
the leak; therefore such a simple method cannot deliver
precise results. Due to that, this method has not been
considered within this report.
The previous chapters described some general meth-
ods to measure emissions from biogas plants.
There are many publications available, which describe
measurements and measurement methods for the deter-
mination of methane emissions from biogas plants.
Within the investigations, different measurement devices
and different methodologies are used. Additionally, the
methods used can vary in details, the plants and their
operational status are different, ambient conditions can
vary and have an impact on the results. A first compara-
tive investigation presented in Holmgren et al., (2015)
and Reinelt et al., (2017) where several teams analysed a
biogas plant with different approaches and methods
revealed a substantial impact on the results from the
methods used, the necessity to identify and quantify the
largest sources and last but not least the operational state
of the plant. Another point was the importance of a care-
ful evaluation of the background concentrations, which
Table 7: Methods for emission evaluation at open digestate storages
Methods for emission evaluation at open dige-
state storagesAdvantages Shortcomings
Chamber method Limited technical effort, easy to apply Represents only a small fraction of the surface area in a limited period of time
In case of area related non-even distribution of emissions and seve-ral storage tanks it is difficult to get representative results, Tempe-rature and filling level related variations difficult to estimate
Emission potential (Batch test of digestate at reduced temperature, e.g. 20°C)
Easy to measure, can be combined with gas potential analysis, inter-plant comparison is easy to be made
No actual measured emission data, does not resemble filling level and different temperature situation appearing in reality
Open path method Gives the overall emissions of the storage tanks (area)
Long measurement periods (e.g. weeks) result in large effort, sepa-ration of other sources in the background (e.g. biogas plant) might be difficult, high equipment costs
Model based calculation based on batch tests
If including temperature measure-ments at the plant and filling level it approaches the annual course of emissions
No actual measured emission data
Annual measurement of filling level and temperature in the dige-state is necessary (or adequate assumptions need to be made)

Methane emissions Results of methane emission measurements
26
was even for the onsite measurements an important
point.
While looking through literature it becomes clear
that publications also differ in regards to consideration
of sources. Some methods do not include certain sourc-
es; others have issues to separate (background) sources
nearby as for instance barns or drainage ditches (Hol-
mgren et al., 2015). There are publications, which lack a
clear description of the methodology and differentiation
of these facts, which makes the results difficult to com-
pare to other publications.
In general, it needs to be stated that, since there is no
standard available, even if each team applies the “same”
method, it can have a slightly different approach and
execution of the measurement and therefore different
results. Because of this, the interpretation and compari-
son of the results of single measurements is difficult. An
evaluation of a representative number of biogas facilities
with a comparable approach is missing and therefore the
deduction of a general emission estimate for the biogas
sector as a whole is at current state not possible.
When discussing the use of emission data within
GHG balances and life cycle assessments another impor-
tant question arises. The measurement usually repre-
sents the emissions of a limited period of time represent-
ing a particular state of operation at the plant. There
might be other states of operation (e.g. part load opera-
tion, shut down for maintenance, not all components
operational, different filling level of gas storage, transi-
tion phases before and after maintenance measures),
which result in different emissions. First investigations
of pressure relief valves, for example, show that the
operational status has an impact on emissions and can-
not be neglected. From that perspective it is important
to document, how the “representative operational state”
has been defined and measured.
The following chapter discusses some selected results
referring to methane emissions. The overview is far from
complete and does not include all available data. The
idea is to give some trends and categorize the signifi-
cance of the different components. Figure 25 gives an
overview on the potential methane emission sources
from components and processes applied within the
biogas system including production and utilization.
6.1 Substrate storage and feeding systemsBiogas substrates are numerous and consequently
the systems applied to store and handle these substrates
are various. In general solid substrates do not tend to
produce methane quickly on their own; since organic
materials acidify during degradation and the resulting
low pH prevents significant methane production.
The situation is different for manures and slurries. In
particular cow manure will produce methane during
storage due to methanogens already occurring in the
manure. Another source of methane emissions can be
the blending of fresh substrate with digestate (or liquids
after solid/liquid separation) for the adjustment of char-
acteristics necessary for the feed-in technology (mainly
pumps). In case such a mixture is stored in an open
tank, methane emissions are likely to occur.
6.1.1 Silage storageIn agricultural biogas plants silages, most often corn
silage, are used as storable high quality substrate. In
Germany corn silage has a percentage of about 75 % of
the overall input of energy crops (Scheftelowitz et al.,
2014). At biogas plants silages are normally stored in
silage pits. The silage is covered by a foil and only the cut
area is open to the atmosphere. On the surface of the cut
area, emissions can be measured using the open cham-
ber method Liebetrau et al., (2013a). In Liebetrau et al.,
(2013a) it is reported that only negligible amounts of
methane are emitted from stored silage (averaged emis-
sions of eight measured plants is 0.0007 % of the utilized
CH4). Due to the low pH-values (< 5) of silages caused
by the lactic acid produced during the ensiling process
(Yitbarek, Tamir, 2014) the methane formation process
is safely suppressed during storage; methanogenic
archaea need pH-values above 6.5. A review on emis-
6. Results of methane emission measurements

Methane emissionsResults of methane emission measurements
27
sions of volatile organic compounds (VOC) from silage is
provided by (Hafner et al., 2013). It is stated that alcohols
(in particular ethanol) and acids (in particular acetic
acid) contribute most to the overall VOC emission from
corn silage. For biogas plants it is also important to abate
such VOC emissions to reduce odour emissions. In sum-
mary methane emissions from stored silage are negligi-
ble.
6.1.2 Manure storageManure storage and in particular cow and pig manure
is a well-known source of emissions. The retention of
manure from animal husbandry within the barn installa-
tions and the subsequent storage until further applica-
tion causes significant emissions. These are usually
assigned to the animal husbandry within the agricultural
sector. Using manure in a biogas facility reduces the
emissions from storage and consequently this reduction
is calculated as a credit in GHG balance. However, when
storing manure or mixing manure with other substrates
prior to feeding on-site of the biogas facility, the emis-
sions need to be assigned to the biogas process.
6.1.3 Waste receiving hall and storage The receiving area and the bunker for storage before
further processing within waste processing plants are
usually encapsulated, the collected air is then sent through
a biofilter. In general the situation is similar to the silage
storage – the substrates acidify or are already acidified
rather than producing methane. Since the waste handling
is somewhat uncontrolled in comparison to the ensiling
process and the waste material is inhomogeneous, the
occurrence of methane is more likely.
In Liebetrau et al. (2013b) several waste treating
plants were investigated. The receiving and conditioning
components emit methane (and VOCs); measured in the
suctioned exhaust air of halls treated in the biofilter.
However in comparison to other large sources, such as
open handling and storage of digestate, post-treatment of
digestate and emissions from CHP, the receiving, pre-
conditioning and storage of waste is of secondary rele-
vance.
6.2 Digestion process 6.2.1 Leakage identification and detection within gas bearing components
There are a few publications about the occurrence of
leakages on gas-bearing plant components from biogas
plants. In Schreier, (2011) by analysing ten investigated
biogas plants it was shown that biogas losses from leak-
ages are a relevant source. Eight plants had an overall
number of 22 leakages and seven of them were evaluated
Figure 25: Overview about GHG emission sources from components and processes applied within biogas production and utilisation

Methane emissions Results of methane emission measurements
28
as serious leakages. In Sax et al. (2013), 12 agricultural
biogas plant were investigated. In Clemens (2014) a sig-
nificant number of single biogas plants were investigated
and the data were evaluated concerning the frequency
of occurrence of the identified leakages. The summa-
rized results from all three publications are shown in
Figure 26.
Apparently, leaks can be found at almost any compo-
nent of the plant in sections containing biogas. The
numbers show, that a frequent monitoring of the plant
for leaks is absolutely necessary. The occurrence of a
leak does not allow an interpretation of the amount of
gas emitted there. The source “wires to adjust agitators”
has for instance usually a minor flow rate.
The results of the presented investigations show that
the rubber covers of digesters are very often a source of
emissions. Either little leakages in the membrane itself
occur, or the connection of the membrane to the digest-
er is often the reason for methane losses.
It should be mentioned that the membranes used for
the cover allow a certain diffusion of methane through
the material. The interpretation and distinction of the
measured emissions as diffusion or leak has to be done
by means of a threshold for material related maximum
allowed diffusion rates. The analysis of the membrane
roof is easy in case of double membrane covers, since the
inlet and the outlet of the air buffer can be evaluated for
methane concentrations and flow rate and by doing so,
the whole cover can be evaluated. The threshold of 1 L
CH4*(m2*bar*d)-1 is given within the Safety Guidelines
of the German Agricultural Employer’s Liability Insur-
ance Association and used within the sector in Germany
(SVLFG, 2016). It
should be mentioned
that the industrial
tests for the character-
ization of the mem-
brane material (DIN
5 3 3 8 0 - 2 : 2 0 0 6 : 1 1 ,
2006) are carried out
under different condi-
tions than the actual
use of the membranes
on site (different tem-
perature, partial pres-
sure of the gas, gas
humidity etc.).
Figure 27 shows a
variety of membrane
roofs evaluated and it is obvious that some of them do
not meet the limits for permeation and cannot be
described as technically gas tight. It should be men-
tioned that due to the way these roofs are evaluated, it
cannot be distinguished between a general increase of
the diffusion through the foil and a potential minor
leakage in the membrane. The question for the practical
application is at which point the decision for a major
maintenance needs to be made.
Single membrane covers are analysed in a different
way. The diffusion rate of the material can be tested by
means of a closed chamber installed on the membrane,
however small leaks on the surface are next to impossi-
ble to detect since the whole membrane surface cannot
be covered for the measurement process.
Figure 26: Identified leakages from biogas plants in Germany and Switzerland, data from (Schreier, 2011, Sax et al., 2013, Clemens, 2014)
5 8 9 13 13
13 17
20
22 25 28 34 35
61 78
3 3
1 1
3
1 3 1
6
1
5 3
4 3
22
7
2
1
5 3
0
10
20
30
40
50
60
70
80
90
100
Num
ber o
f lea
kage
s
Clemens (2014) Schreier (2011) Sax et al. (2013)
n = 292 (Clemens, 2014) n = 010 (Schreier, 2011) n = 012 (Sax et al., 2013)
n = 292 (Clemens, 2014) n = 010 (Schreier, 2011) n = 012 (Sax et al., 2013)
n = 292 (Clemens, 2014) n = 010 (Schreier, 2011) n = 012 (Sax et al., 2013)
n = 292 (Clemens, 2014) n = 010 (Schreier, 2011) n = 012 (Sax et al., 2013) x x x
Figure 27: Methane emission through membrane covers based on measurement within air of air inflated double membrane roofs (1027 roofs measured, Clemens (2014))

Methane emissionsResults of methane emission measurements
29
Leaks have been quantified separately in a few studies
Liebetrau et al. (2013a), Westerkamp et al., (2014a),
Reinelt et al. (2017). In Liebetrau et al., (2013a) the
numerous little leaks emitted between 0.006 and 0.028 %
of the methane produced at the facility. However, one
major leak, which was a not properly closed maintenance
opening, emitted 5 % of CH4 utilized. In Westerkamp et
al., (2014a) the leaks accumulated to between 0.001 and
0.055 % of total methane production, again as such may
be described as rather minor leaks.
In Reinelt et al. (2017) all leaks were measured by dif-
ferent teams with levels below 0.044 %; the only excep-
tion was on PRV release which was measured at 0.73–
1.11% of CH4.
The general conclusion is that the majority of leaks
are minor leaks with low flow rates. However, there are
single cases of major leaks, which
have not been recognized by the
plant operators. Consequently a
frequent screening of the plants for
leaks is highly recommended.
6.2.2 Pressure relief valvesHitherto the quantity and rea-
sons for release of pressure relief
valves (PRV) has been studied only
sporadically. Therefore the emis-
sions caused by this component are
not very well quantified and under-
stood. Figure 28 shows the behav-
iour of a flow meter and a tem-
perature sensor installed at the
very same pressure relief valves.
The opening events can easily
be identified. It should be stated
that since the monitoring devices
have been installed and provided
data, the operator was surprised
about the releases, since they had
no possibility to recognize the
releases before.
For the purpose of plant opti-
mization a simple logger for the
recording of release events would
be sufficient. This way the reasons
for causing the release events can
be identified and the occurrence
can be reduced by adequate meas-
ures.
For the quantification of emis-
sion, flow rates and concentrations within the released
gas need to be evaluated.
In Reinelt et al. (2016) a method for pressure relief
valve investigation is presented and two biogas plants
have been evaluated. Major reasons for the emission by
pressure relief valve releases have been identified as:
• Unbalanced gas production and utilisation
• Activation of flare too late due to type of activation
of the flare (manual or automated, connected to
filling level in gas storage or CHP operation)
• Sudden changes in atmospheric conditions (see
Figure 29)
An additional reason for PRV releases can be an
improper gas management, in particular a hindered gas
exchange between different gas storages or varying pres-
Atmosperic pressurehPa993,8
980
983
986
989
992
995
0
20
40
60
80
100
0:00 4:00 8:00 12:00 16:00 20:00 0:00
Atm
osph
eric
pre
ssur
e in
hPa
Time in hh:mm
Methane emission Temperature PRV Air temperature Atmosperic pressure
Flow
rate
in m
3 h-1
50
40
30
20
10
Tem
pera
ture
in °C
Figure 28: Opening time and flow characteristics of a pressure relief valve (Data from DBFZ).
Figure 29: Influence of atmospheric conditions on the methane emissions from a PRV of a biogas plant, adopted from (Reinelt et al., 2016)
Methane emissions Results of methane emission measurements
30
sure conditions within the system.
The temperature within the gas storage can change
substantially due to solar radiation as the volume of the
gas stored in the gas storage changes according to the
ideal gas law. Moreover there is an additional water
vapour uptake at higher temperatures which my further
increase the volume/pressure. A change of 30 K in the
gas storage is very likely on summer days
in continental climates; this temperature
change can result in a change of up to
20 % of the gas volume in the storage,
which needs to be compensated by the
available gas storage capacity (Figure 30
and Table 8).
Additionally it should be mentioned
that the precision of most filling level
indication systems for gas storage is
insufficient and the gas transfer between
different storage systems is uncontrolled.
Consequently the options for exact gas
management are limited, which can
result in pressure relief vent release
events.
6.3 Open/not gastight covered digestate storage tanks
The issues with measure-
ment of open digestate storage
tanks have been discussed above.
It should also be highlighted
that any type of cover other than
a gas tight cover is not efficient
in the perspective of reduction
of methane emissions.
As already mentioned the
temperature of the digestate
during storage has a large impact
on gas production. Figure 31
shows the results of a plant sur-
vey in Germany (FNR 2010),
where the gas potential of the
digestate has been evaluated at
different temperatures. It is obvi-
ous and well known that there is
a significant difference of the gas
potential of digestate measured
at 37 and 20 to 22°C (in the sur-
vey 20°C and 22°C were used).
However the temperature (and
filling level) in digestate storage
tanks is far from constant (e.g. Muha et al., 2015 and
Figure 31) and therefore the precise estimation of the
emissions from digestate requires the inclusion of tem-
perature and filling level.
The storage of digestate within the digestion of
manure has a particularly interesting aspect due to the
fact that it reduces the emissions from the otherwise
Table 8: Change of gas storage capacity in relation to temperature change
Methods for emission evaluation at open digestate storages
Advantages Shortcomings
Temperature change in K (Starting point 20.9 °C) 10 20 30
Volume change in % (based on the 20.9 °C scenario) 7 % 13 % 20 %
Figure 31: Gas potential of digestates at different temperatures (Data from FNR (2010))
0,00
2,50
5,00
7,50
10,00
12,50
15,00
17,50
20,00
22,50
0 25 50 75 100 125 150 175 200 225 250 275 300
Gas p
oten
*al digestate
(% of g
as poten
*al of sub
strates)
Hydraulic reten*on *me (d)
Gas poten1al digestate (37°C) Gas poten1al digestate (20…22°C)
0,00
2,50
5,00
7,50
10,00
12,50
15,00
17,50
20,00
22,50
0 25 50 75 100 125 150 175 200 225 250 275 300
Gas p
oten
*al digestate
(% of g
as poten
*al of sub
strates)
Hydraulic reten*on *me (d)
Gas poten1al digestate (37°C) Gas poten1al digestate (20…22°C)
Figure 30: Temperature and gas storage capacity over time (adapted from Mauky et al. (2017))
Methane emissionsResults of methane emission measurements
31
conventional storage of manure. This is usually integrat-
ed in GHG balances by giving the manure digestion a
credit. These credits have a significant impact on the
GHG balance of manure digestion. Assuming that the
situation in a manure lagoon is similar to a digestate
lagoon, the emission factors for manure storage could be
used as indicator for the emissions from digestate storage.
The assumed emission factors vary for different animal
species, animal husbandry systems (or management sys-
tems) and storage temperatures. They range widely for
liquid/slurry, from 17– 80 % of the methane potential of
the manure, depending on temperature and type of
management system (IPCC 2006). In many cases the
amount of manure available on site is not sufficient to
make the digestion process a viable business. In such a
case one solution is the addition of other energy rich
substrates in order to increase the
overall capacity of the plant and
achieve a better economic output
of the plant. Manure based plants,
in particular with high water con-
tent, have a high throughput and a
low specific gas production. The
gas tight operation of all vessels, in
particular the digestate storage, is
often cost intensive. The question
under which conditions the diges-
tion of manure has an environ-
mental benefit, even with open
digestate storage and with addition
of energy rich substrates is
addressed in chapter 7.
In case of co-digestion of manure
with energy rich substrates, such as
energy crops, the impact of the cred-
it on the emissions decreases with
increasing share of energy crops.
First of all, the energy crops contrib-
ute to the biogas production much
more than the manure, so in relation
to the overall energy output, the
credit quickly diminishes with
increasing shares (in wet mass) of
energy crops. Second – if assuming
open digestate storage after diges-
tion, the digestate may, at a certain
point depending on the amount of
energy crops- emit more methane than
the methane avoided by digesting the manure within the
substrate. At this point the digestate storage is not com-
pensated by the manure credit any more (under the
assumption that the methane conversion factor is equal
for manure and digestate).
Within Figure 32 the situation is depicted comparing
several co-digestion scenarios and different retention
times. No other emissions or credits are considered (e.g.
provision of energy crops). It should be mentioned that
the methane conversion factor (MCF), which represents
the emission potential of the manure, is 10 % (of the gas
potential of manure). According to IPCC this is quite
conservative, their values range from 10 % at average
temperature of 10°C to 50 % at 28°C. Assuming a 20 %
MCF all values in the graph would double. The interest-
ing fact to be seen here is the high impact of the portion
Figure 32: Temperature and filling level inside of an open digestate storage tank (temperature measured 0.5 m below the digestate surface) (DBFZ)
Figure 33: The methane emissions saved by means of manure credits in a co digestion scenario manure/maize.

Methane emissions Results of methane emission measurements
32
of energy rich substrates on the relative emission savings
and the low impact of the retention time. Maize is
quickly degraded and therefore the retention time has
no large impact on the emission potential in the diges-
tate. Since the graph shows the emission savings in rela-
tion to the methane utilized, the emission savings are,
for the manure only plant, constant. Higher degradation
due to higher retention times results in less emissions
from the digestate and therefore in higher credits but
also proportionally higher gas production. Therefore the
ratio of both stays constant. In absolute numbers the
longer retention times are of course favourable.
Measurements of open digestate storages have been
carried out for example in Liebetrau et al. (2013a); Hrad
et al. (2015); Gioelli et al. (2011). The emissions (% CH4
(of utilized methane)) are given in the range of 0.2 – 11.2
for a variety of measured vessels (Liebetrau et al., 2013a);
Values of 1 (open storage tank from biogas plant 1 from
Hrad et al., 2015), 1.8 and 4.4 have been measured (cal-
culated from Gioelli, 2011 for non-separated and liquid
fraction of digestate) respectively.
6.4 Gas utilisationGas utilisation is another major GHG emission
source that occurs on biogas plants. There are basically
two different options for utilizing the produced biogas.
The first one is the combustion in a CHP unit to gener-
ate electrical and thermal energy. In CHP units methane
emissions can occur due to leakages at the engine or the
surrounding gas tubes, but this kind of emission source
is usually negligible in comparison to the methane slip
(portion of uncombusted methane) in the exhaust of
CHP plants. The methane slip appears due to incom-
plete combustion in the engines that depends amongst
others on the design of the combustion chamber, the
adjustment of the lambda value (Oxygen fuel ratio,
mostly used to control efficiency and NOx emissions),
the maintenance of the unit, and the capacity utilisation
of the unit (Aschmann, 2014). Concerning the resulting
methane emissions in the literature some results are
given in Figure 34 of the produced gas, the median of the
given results is 1.65 %, the average 1.89 %. There are
some units, which have a substantial higher slipage (see
Figure 34), which is usually caused by poor maintenance
of the CHP unit.
It appears to be obvious that size has no relation to
the emissions within this data set.
Aschmann (2014) states that gas-spark ignition
engines emit about 1 % CH4 whereas compression igni-
tion engines emit 2 – 3 % CH4 because of the higher gas
compression which increases the energy efficiency. For
the reduction of these emissions several options are
available and/or under research.
Catalysts are not able to reduce the methane, since
under lean operation conditions, and the apparent
exhaust gas temperatures currently available, noble
metal oxidation catalysts cannot oxidize the methane
emissions with a sufficient lifetime.
According to the current state of the art methane
emissions from CHP can be reduced by
application of a selective catalytic reduction
(SCR) catalyst (assuming regulations
require a lean operation for NOx reduc-
tion), however, there may be a trade off with
GHG emissions as an incomplete reduction
of NOx may lead to the production of N2O.
A quantification of this effect needs further
investigation.
Another reliable but expensive option
for the reduction of hydrocarbons is post-
combustion systems. Post combustion sys-
tems reduce methane emissions to negligi-
ble values, but have extensive additional
investment and operational costs.
Thresholds for methane (or total C)
emissions from CHP are under discussion.
In the Netherlands there is already a limit
given by the authorities (1,200 mg/m³) and
Figure 34: Methane emissions from CHP units operated with biogas and natural gas (Liebetrau et al., 2013a; Aschmann, 2014, Kretschmann et al., 2012; van Dijk, 2012)

Methane emissionsResults of methane emission measurements
33
in Germany values from 1–1.3 g m-³ are discussed cur-
rently. In any case, a frequent monitoring and a reason-
able limit can help to ensure an operation of the CHP
units, which is according to the state of the art and pre-
vents large emissions from poorly designed or main-
tained units.
Upgrading of biogas to biomethane can also cause
emissions. Every technology for separating the methane
from the biogas leaves a percentage of methane in the off
gas. National regulations define the amount of methane
to be released to the atmosphere. In case of a proper
post-treatment of the off gas, the amount of methane
emitted can be reduced to negligible values.
However, the post treatment needs to be
maintained and monitored for proper func-
tioning otherwise large emissions can occur.
6.5 Post composting after anaerobic digestion
Composting of digestates or separated
solids from digestate is a common practice
within solid waste treatment to ensure
hygienisation and a defined quality of the
end product. Digestates are rich in metha-
nogenic activity and in the case of anaerobic
conditions the methane production will
continue. A crucial part of any post-treat-
ment is the sufficient supply of oxygen to
the material, which is ensured by sufficient
structure in the heap and oxygen supply by
active aeration or frequent turn over. In case
of insufficient operation significant meth-
ane emissions will occur.
Figure 18 shows the results presented in
Daniel-Gromke et al. (2015). It should be
mentioned that post-composting refers to
open composting, which was separately measured. Emis-
sions from composting within a building with air collec-
tion are included in “Emissions after Biofilter”. The vari-
ation of the results is high and shows how difficult it is
to give a representative answer on the emission situation.
But as in the case of PRV release events – the operation
of the facility has a large impact on the emissions. If post
treatment of the digestate is poorly managed and the
oxygen supply for the process is insufficient, the result-
ing methane emissions can be very high.
Table 9: Methane contained in the off gas of upgrading facilities (FNR 2012)
Pressure swing adsorption
Water scrubber
Physical absorption
Chemical absorption
Membrane
Methane contained in the off gas of the upgrading process (% of treated methane)
1– 5 0.5 – 2 1 – 4 0.12 – 8(0.5)*
Table 10: Emission results from on-site measurements
Approach Plant type (Number of
investigated plants )
Measured methane emis-
sion rate
Reference
On-site method (leakage detection, standard methods, dynamic and static chambers)
Agricultural biogas plants
(8) Biogas plants with
upgrading unit (2)
1.1 – 13.7 % CH4 (1.9 – 24.5 g CH4
kWhel-1)
Liebetrau et al. (2013a)
Biowaste treat-ment plants
(10)
15 – 295 kg CO2eq
Mg-1Waste
Daniel-Grom-ke et al. (2015)
On-site method (leakage detection)
Agricultural biogas plants
(292)
(no quantification available, only qualitative leak
evaluation)
Clemens (2014)
On-site method (permanent monitoring of PRVs)
Agricultural biogas plants
(2)
Plant A 0.1 % CH4 Plant B 3.9 % CH4
Reinelt et al. (2016)
On-site method (leakage detection, standard methods, dynamic and static chambers, High volume sampling)Remote sensing approach (IDMM and TDM)
Biowaste treat-ment plant (1)
0.6 – 2.1 % CH4 0.6 – 3.0 % CH4
Holmgren et al. (2015)
Reinelt et al. (2017)
*Different emissions for membranes are given as the technology is developing; 0.5 % CH4 is given by Steentjes (2013) and
Bauer et al. (2013) for the use of membranes (SEPURAN®) from the company EVONIK and gas recirculation.
It should be mentioned that after feeding into the grid the final utilisation of the gas (e.g. as fuel or in CHP) might also
cause emissions, which need to be considered for a GHG balance.

Methane emissions Results of methane emission measurements
34
Table 11: Emission results from remote sensing methods
Rem
ote
sens
ing
appr
oach
Biogas plant
inve
stig
atio
n pe
ri-
od
CH4-Emission
Refe
renc
e
digestate storage Methane production
(m3 h-1)
Substrates Gas utilisa-tion (kWel)
in kg h-1 in % CH4-loss
DIAL + Fenceline Monitoring
Gastight covered digestate storages 500 Energy Crops
Biogas upgrading to biomethane
1 hour 1.49 0.4 Wolf et al. (2013)
IDMMGastight covered and open digestate storage
370 Not mentioned CHP 889 + 526 1 day 10.1 4 Groth et
al. (2015)
IDMM Open digestate storage 70 – 225 Dry manure CHP
1 000
25 days within a
year
3.66 (3.80;
3.54; 2.60; 2.74)
3.1 (2.9; 2.7; 5.2; 1.7)
Flesch et al. (2011)
IDMMPlant 1: Gastight covered and open digestate storages
Pig slurry (40 %) and energy
crops (60 %)
CHP 2x 526
7 days (filled dige-state sto-
rage) 6 days (emptied digestate storage)
7.2(filled
digestate storage)
5.4
4.0(filled
digestate storage)
3.0
Hrad et al. (2015)
IDMM Plant 2: open dige-state storage Energy crops CHP
526 2 days 2.7 – 4.8 3.2 – 5.5 Hrad et al. (2015)
IDMM Plant 3: open dige-state storage
Cattle slurry (40 %) and energy crops (60 %)
CHP 526 2 days 2.7 – 3.1 3.4 – 3.8 Hrad et
al. (2015)
IDMMPlant 4: Gastight covered digestate storage
Bio-waste CHP 360 + 250 2 days 2.3 – 4.2 2.8 – 5.2 Hrad et
al. (2015)
IDMMPlant 5: Gastight covered digestate storage
Bio-waste CHP 580 2 days 2.2 – 3.2 1.6 – 1.9 Hrad et
al.(2015)
IDMMPlant 1: Gastight covered digestate storages
500 – 600 Energy CropsBiogas
upgrading to biomethane
4 days 0.5 ± 0.2
Wester-kamp et
al. (2014a)
IDMMPlant 2: Not gastight covered digestate storages
1 700 – 1 900 Energy CropsBiogas
upgrading to biomethane
10 days 2.0 ± 0.8
Wester-kamp et
al. (2014a)
IDMMPlant 3: Gastight covered digestate storages
1 500 – 3 000Agricultural
residual material
Biogas upgrading to biomethane
9 days 0.22 ± 0.12
Wester-kamp et
al. (2014a)
IDMM Open digestate storage 1 180 Bio-waste
Biogas upgrading to biomethane
3 days 4.9 – 13.9 0.6 – 1.7Reinelt et al. (2017)
TDM Open digestate storage 1 180 Bio-waste
Biogas upgrading to biomethane
3 days 17.9; 24.5 2.2; 3.0Reinelt et al. (2017)

Methane emissionsResults of methane emission measurements
35
6.6 Overall emissions from biogas plantsIt is obvious that the published overall emissions
from biogas plants have the same restrictions as the
methods used to measure them. All the publications from
different groups have varying assumptions and methods
used to evaluate the emissions, and therefore it is difficult
to compare these numbers. The need for harmonization
of the methods has been described before. Table 10 and
Table 11 give an overview of the results published,
according to the issues mentioned above; they cannot be
put into relation to each other.
In general, the single source method will deliver fewer
emissions since the method cannot assess all leaks. The
plants evaluated have very different design and conse-
quently different emissions. Apparently the variety of the
amounts emitted is high; therefore the results do not
allow a general assessment of the technology. The use of
standard values to make an analysis of the sector is ques-
tionable considering these results.
For single plants a plant analysis is recommended and
if needed followed by adequate measures to reduce the
emissions. For the sector a method harmonisation and a
data acquisition is required to get a comprehensive esti-
mation of the emission situation.
6.7 Remarks for construction and operation for emissions minimization
The presented results and trends within the emis-
sions, lead to a number of emission reduction measures.
Many of them are measures within the operation of
biogas plants and can be integrated in daily routines
without installations or additional investment. Major
measures and/or routines are briefly described below.
Gas tight digestate tank or complete degradation: Emissions from digestate storage should be mini-
mized since they are one of the major sources. Either the
digestate tank should be covered (gas tight with gas utili-
sation) or the degradation of the substrate should reduce
the emission potential extensively. German technical
guidelines set limit values for remaining emission poten-
tial (measured at 20°C) at 1–1.5 % (of gas produced)
(VDI, 2010).
CHP unit:The exhaust of the CHP can contain high methane
concentrations due to incomplete combustion. Frequent
control and documentation of motor settings and fre-
quent maintenance and control of methane concentra-
tions can help to minimize these emissions. The results
presented in Figure 34 have a median of 1.65 % of the
utilized gas.
Further reduction can be achieved by means of post
combustion of the exhaust, but this is an expensive solu-
tion. There are no catalysts for methane emission reduc-
tion available at the market under lean operation condi-
tions. However, SCR catalysts are also discussed as an
option for optimising the emissions from CHP.
Frequent leakage control surveys: The biogas containing components should be fre-
quently monitored to identify leakages. This includes
surveys with leakage detection systems such as methane
cameras and handheld lasers. Such a survey should be
carried out dependent on the status (age and number of
leaks found) of the plant every 1 to 3 years. Monitoring
for elevated methane concentrations within the exhaust
streams from air inflated double membrane roofs should
be included in routine measures.
Gas management:Gas management should aim at avoidance of PRV
releases (and flaring events) in order to minimize emis-
sions and losses in general. This includes the automatic
operation of the flare linked to the filling level of the gas
storage. This requires a stationary flare, which is opera-
tional in parallel to the CHP and kicks in before the PRV
opens. The filling level of the gas storage should, during
normal operation, be well below 80 % (in order to com-
pensate weather and operation induced changes); a value
of around 50 % is recommended. The level indicators
need to be capable of delivering precise measurements in
any range of filling level. Connected membrane gas stor-
age systems need to be adjusted to each other in order to
allow controlled filling levels and pressure conditions in
all vessels under all process conditions. Accordingly, gas
transfer between several gas storage systems needs to be
controllable in order to avoid unbalanced filling levels as
well as pressure ratios, which might lead to PRV release
in one vessel although other vessels have spare capacity.
Adequate dimensions of pipes, blowers in the gas pipes
and controllable air pressure in the air inflated roofs are
measures to achieve well balanced filling levels.
The gas management system can also include the
adjustment of feeding during shutdown of the gas utilisa-
tion or periods of reduced load of the CHP. In case flare
operation does not avoid PRV release events under cer-
Methane emissions Greenhouse gas balance for assessment of significance of methane emissions
36
tain circumstances, a monitoring system for PRV in
order to get records for number and duration of release
events is recommended.
Avoidance of open handling and storage of digestate under anaerobic conditions:
As soon as the digestate leaves the process its emis-
sion potential needs to be minimized. In case the diges-
tate is used to condition substrate for better handling,
this should happen within encapsulated units and the
produced gas should be treated.
Any aerobic post-treatment should include a suffi-
cient oxygen supply in order to avoid methanogenic
activity. The measurement of oxygen supply (or metha-
nogenic activity) within the process is recommended.
Upgrading facilities:Depending on the applied upgrading technology
methane emissions via the off gas varies. An exhaust
treatment is recommended in case of significant emis-
sions. Frequent function control and monitoring of the
performance of such devices is necessary.
The aim of this chapter is to put the methane emis-
sions, measured or modelled in the previous chapters,
into context, in order to assess their significance. An
analysis of the main factors influencing the GHG bal-
ance will be performed and the most efficient approach-
es for the emission reduction will be identified and rec-
ommended. Besides the methane emissions, heat utiliza-
tion, parasitic electricity consumption and the substrate
used were varied in order to show their impact on the
GHG balance.
7.1 Principles and framework of GHG balanceThe overview should help to understand the impact
of methane emissions on the GHG balance and give
some guidance for the evaluation of plant concepts in
respect of impact on the environment. Based on the
results, the technical concepts and measures necessary to
reach certain reduction targets are identified. The meth-
odology recommended by the International Standardi-
sation Organisation for the assessment of the environ-
mental impacts of any product or service is Life Cycle
Assessment (LCA) (ISO 14040; 2006). LCA considers
the entire life cycle of a product, from raw material
extraction and acquisition, through energy and material
production and manufacturing, to use and end of life
treatment and final disposal. Through such a systematic
overview and perspective, the shifting of a potential
environmental burden between life cycle stages or envi-
ronmental areas of concern can be identified and possi-
bly avoided. In LCA, with the focus on environmental
impacts, economic and social aspects and impacts are,
typically, left outside the scope of the LCA.
When, in an LCA study, only the impacts on climate
change are analysed (in particular only GHG emissions)
the study is called a carbon footprint, and specific rec-
ommendations are available at international level (ISO
14067, 2013). The advantages of a carbon footprint,
instead of a full LCA (which would include all relevant
environmental impacts) are the simplification of the
data collection and analysis, however, as a drawback,
there are limitations in the conclusions that can be
7. Greenhouse gas balance for assessment of significance of methane emissions

Methane emissionsGreenhouse gas balance for assessment of significance of methane emissions
37
drawn, as possible trade-off among different environ-
mental impacts cannot be identified.
The 4 phases of an LCA study, which represent the sections of this chapter, are:1. Goal and scope definition: the goal is the intended
application and the reasons for carrying out the study.
2. Life Cycle Inventory: the phase of life cycle assessment
involving the compilation and quantification of
inputs and outputs for a product throughout its life
cycle.
3. Life Cycle Impact Assessment: the phase of life cycle
assessment aimed at understanding and evaluating
the magnitude and significance of the potential envi-
ronmental impacts for a product system throughout
the life cycle of the product.
4. Life cycle interpretation: the phase of life cycle assess-
ment in which the findings of either the inventory
analysis or the impact assessment, or both, are evalu-
ated in relation to the defined goal and scope in order
to reach conclusions and recommendations.
7.2 Goal and scope of the GHG balance The goal of this study is the assessment of the rele-
vance and significance of methane emission from biogas
plants. The systems analysed are biogas plants digesting
several feedstocks (and combinations of feedstocks) with
different technological implementations and operational
practices. The functions of the product systems analysed
is the production of electricity and heat. The functional
unit is 1 MJ of electricity. In case of multifunctionality
(co-production of heat and electricity), allocation will be
performed by exergy.
In the previous chapters the potential sources of
methane emissions from biogas plants were identified
and the corresponding methane losses were quantified.
In this chapter, the methane emissions are treated as the
variable sum of all emissions occurring, without compo-
nent specific considerations. Given the high variability of
the total methane emissions from biogas plants, in this
section the significance of these emissions is analysed by
putting them into their context within a GHG balance of
the whole plant.
One of the main drivers of producing biofuels and
bioenergy is the reduction of GHG emissions, to counter-
act climate change. It is therefore of paramount impor-
tance that the production of biofuels and bioenergy
contributes, significantly, to the reduction of GHG emis-
sions. In this context, the European Union has set ambi-
tious objectives in its policy for a sustainable energy sys-
tem, with the Renewable Energy Directive (RED 2009).
Together with the targets the EU has defined sustainabil-
ity criteria, which include the reduction of GHG emis-
sions in comparison to a fossil fuel comparator (FFC).
To prove that the biofuel produced complies with the
emission limit the European Commission has also
defined, with the Renewable Energy Directive (RED,
2009), a simplified methodology for GHG emission
accounting and a set of default values for the most com-
mon biofuels, including biogas and biomethane. In 2010
the EC has recommended to the member states to use the
same approach for the sustainability requirements for the
use of solid and gaseous biomass sources in electricity,
heating and cooling (COM 11, 2010). However, the leg-
islation went into force only for biofuels. The input val-
ues and the methodology for GHG accounting were fur-
ther updated in 2014 with the SWD 259 (2014). The
same approach is presented in the proposal for a recast of
the Renewable Energy Directive (RED) presented with
the ‘Winter Package’ in Nov. 2016 for the period 2021–
2030 (RED recast, 2016), where mandatory sustainability
criteria for solid and gaseous bioenergy are being consid-
ered.
The default values used in EU policies are supposed
to be representative of common biofuel and bioenergy
pathways and represent an average of the whole conti-
nent. Therefore the input values used in SWD 259 (2014)
and published in (Giuntoli et al. 2015,) are applied to put
the methane emissions from biogas plants into context
without using specific case studies, but the theoretical
and simplified pathways modelled by the Joint Research
Centre (JRC) of the European Commission for the
default values calculation. The three substrates used in
the in the JRC report Giuntoli et al. (2015,) are manure,
silage maize and biowaste.
The environmental impact assessment is limited to
the category of climate change. The selected methodolo-
gy for the impact assessment is IPCC AR4. The only
GHG included in the analysis are non biogenic CO2 and
methane emissions. N2O emissions are not included in
the analysis. As the goal of this study is limited to the
assessment of methane emissions from biogas plants, the
upstream emissions are taken as constant (emissions
occurring during the appropriation / cultivation of the
feedstock) and are those reported in SWD 259 (2014)
and Giuntoli et al. (2015).
System boundaries are depicted in Figure 35. It is
assumed that the alternative fate of manure would be

Methane emissions Greenhouse gas balance for assessment of significance of methane emissions
38
storage in open tanks, therefore, the comparison among
system is carried out allocating credits for avoided GHG
emissions to the manure based pathways. Plants con-
cepts are highly individualized and it is impossible to
really define “representative plant concepts”. However,
the objective of this study is to allow a general evaluation
of the biogas plants concepts modelled and give an idea
which concepts are able to fulfil certain emission reduc-
tion targets considered the methane emission described
in the previous chapters.
7.3 Inventory analysisAll the component and source specific CH4 emis-
sions from the plant are considered within the analysis as
a sum parameter. This sum of all methane emissions is
varied, in % of the total amount of methane provided to
the CHP, from 0 to 7, to facilitate the understanding of
the relevance of CH4 emissions from biogas plants. The
% of methane emitted to the atmosphere is to be consid-
ered comprehensive of all the
emissions: digestate storage, CHP
methane slip, pressure relief
valves, leakages and diffusion of
the membrane gas storage units,
leaky gas pipes etc. Distribution
of digestate on land is not includ-
ed in the analysis.
The main parameters defin-
ing the pathways to produce
biogas from the substrate ana-
lysed are reported in Table 12.
The common agricultural
practice for manure management
is storage in open tanks, where
anaerobic digestion naturally
occurs, and methane is emitted, together with other
gases and odours. Anaerobic digestion of manure in
biogas plants avoids such emissions. Therefore, credits
for avoided methane emissions are added to the GHG
accounting of manure biogas pathways. Credits for such
avoided emissions are equal to 17.5 % of the produced
methane (equivalent to 14.6 % of biomethane potential
of manure VS = 70kg/ton, Biomethane potential B0 = 0.24
m³CH4*kgVS-1; yield = 0.2 m³CH4*kgVS-1). Further
details are reported at pg. 59 in Giuntoli et al. (2017) and
Giuntoli et al (2015).
The credits are also applied to the fraction of manure
digested in co-digestion with maize according to SWD
259 (2014) and Giuntoli et al. (2015).
As N2O emissions from the plant (digestate, engine
etc.) are not included in the analysis, for reasons of con-
sistency, the N2O credits, which derive from the avoided
emissions from raw manure storage, have not been con-
sidered. According to IPCC, the N2O emissions from
Table 12: Parameter for GHG balances
Maize Manure Biowaste
Cultivation Yield = 40.76 t FM/ha Diesel = 104.32 l/ha Napplied = 63.24 kg/ha Moisture = 65% Kapplied =3 8.52 kg K2O/ha
n.a. moisture = 90% credits for avoided raw manure storage:17.5% of methane produced (if related to the methane potential of the used manure it equals 14.6 %)
n.a. moisture = 76.3%
Ensiling Losses = 10% DM Diesel = 0.56 l /t maize
n.a. n.a.
Transport 20 km 5 km 20 km
Digestion VS content = 33.6%VS reduction = 72%yield = 345 l CH4/kg VS
VS content =7% FMVS reduction = 43%Yield = 200 l CH4/kg VS
VS content 21.7%Yield = 438 l CH4/kg VS
Figure 35: System boundaries for the biogas plant concepts analysed
Source: Giuntoli et al. (2015)

Methane emissionsGreenhouse gas balance for assessment of significance of methane emissions
manure or digestate storage are about ¼ of the emissions
of methane, in terms of CO2eq.
The impact of parasitic electricity consumption by
varying it from 5 to 15 % of the electricity produced has
been analysed in order to assess the significance of
electrical efficiency on the GHG performances of biogas
plants. Another parameter analysed was the influence of
sensible heat export. To do so we have used the alloca-
tion approach recommended in EU policies COM 11
(2010).
The formula used is:
The methodology set in COM11 (2010) sets a lower
limit for the Carnot factor at 150°C. If the heat is export-
ed at temperatures lower than 150°C, the heat can use
the same Carnot factor as if it were at 150°C. For higher
temperatures, which is not common for biogas plants,
the Carnot factor is calculated as Ch = (Th – T0)/Th.
Where Th (°K) is the temperature of the exported heat and
T0 (°K) is the environment temperature, set at 273 °K.
As it is very common that biogas plants digest
manures with other substrates, with a higher content of
volatile solids, such as energy crops or other residues, to
improve the performances of the plants, we have mod-
elled the co digestion of manure and maize with differ-
ent percentages of mixture (20, 40 and 70 % maize
within substrate mixture, fresh matter (FM) mass based).
To understand the significance of the GHG emis-
sions resulting from the modelling exercise, the total
GHG emissions deriving from the supply chain emis-
sions and the biogas plant losses are presented together
with the Fossil Fuel Comparator (FFC) for electricity
used in EU policies.
The used FFC is taken from SWD 259 (2014) and it
is equal to 186 g CO2eq. per MJ of electricity (this equals
669.6 g CO2/kWh) and it is based on the following power
mix: 50 % natural gas fired CCGT plants (with gas
sourced from a mixture of sources, from short/long dis-
tance as well as LNG), 25 % coal fired IGCC plants, and
25 % conventional coal.
It should be noted that the FFC is not meant to actu-
ally represent what is replaced by producing electricity
with biogas, but rather as an arbitrary term of compari-
son to understand the significance of the GHG emis-
sions of a given system.
The same document recommends, for bioenergy
installations, a 70 % emission reduction target in com-
parison to the FFC. We therefore plot the results togeth-
er with 30 % of the FFC, which corresponds to 55.8 gCO2/
MJ (200.9 gCO2/kWh).
It should be mentioned that the average emissions
for electricity for specific countries can differ from this
value substantially. However, to ensure consistency and
comparability of greenhouse gas savings in different
Member States, the EU has considered it appropriate to
apply a fossil fuel comparator based on average Union
emissions (RED recast, 2016). Another point is the type
of utilization of biogas. If used in other sectors the FFC
for heat or natural gas are according to Giuntoli et al.
(2015):
FFC heat = 80 g CO2 eq. / MJheat
FFC natural gas = 72 g CO2 eq./ MJNG
(no gas utilization is considered here)
7.4 Results and interpretationThe following section compares the impact of sub-
strate used, parasitic energy use, heat utilization and
methane emissions on the GHG balance of biogas plants
concepts.
Substrates used are maize, manure and biowaste.
External heat utilization is varied at 0 – 20 – 40 % of the
overall energy content of the biogas utilized. Parasitic
electrical demand of 5 – 10 –15 % of the produced elec-
tricity has been analysed. To point out what is the meth-
ane emissions target for each system analysed which
allows GHG emissions lower than 30 % of the FFC,
methane emissions are assessed from 0 to 7 % of utilized
methane.
Not all combinations of the variables are shown for a
clearer arrangement; only those that were considered
relevant to show the general trends have been selected.
Figure 36 and Figure 37 show the results of the
emission calculations for maize and biowaste. The area
with the blue and white pattern in graphs a, c and e
represents the GHG emitted with the production of 1
MJ of electricity by anaerobically digesting maize, while
the area with the orange and white pattern in graphs b,
d and f represents the GHG emissions of biowaste. The
yellow area represents 30 % of the EU FFC.
39
ECel
E ( )el
C . el
C . el + Ch. el
=
Where:ECel = Emissions allocated to electricityE = total emissionsCel = Fraction of exergy in the electricity, or any other energy
carrier other than heat, set to 100 % (Cel = 1).Ch = Carnot efficiency of heat at 150 °C (423 Kelvin),
which is: 0.3546el = electrical efficiency, h = thermal efficiency

Methane emissions Greenhouse gas balance for assessment of significance of methane emissions
40
In Figure 36 the impact of different levels of internal
electricity consumptions is analysed, while in Figure 37,
the impact on emissions of different levels of export of
useful heat is analysed according to the rules set in SWD
259 (2014) and Giuntoli et al. (2015) for allocation.
The radii in the graph represent the different level of
methane losses expressed as a percentage of the total
biogas provided to the CHP. They vary from 0 to 7 %.
Three levels of internal electricity consumption are
considered for the calculation in Figure 36: 5, 10 and
15 % of the total electricity produced by the CHP. This
share of internal consumption is supposed to include all
the electric systems and devices used by the whole biogas
plant, and therefore includes: CHP internal consumption;
pumps, mixing and stirring devices; pre-treatments;
digestate handling; control units and so on. Compared
to the methane emissions the parasitic electricity
consumption has only minor impact on the overall
GHG balance.
The outcome to be seen in the graphs of Figure 36,
Figure 37 and Figure 38 is the fact that the variation of
methane emissions from the biogas plant in the chosen
order of magnitude is the main parameter influencing
the GHG emissions. In fact, in all the systems analysed,
the GHG emissions are lower than the 30 % of FFC when
the methane emissions are zero or close to 0, while with
increasing methane emissions from the plant most sys-
tems emit more GHG than the 30 % FFC limit, and
therefore have GHG savings lower than 70 % of the FFC.
The impact on maize based plants is most
pronounced, as it is the only substrate, which includes a
cultivation process, which generates upstream emissions.
The additional emissions deriving from the cultivation
process allow biogas from maize to have GHG emissions
lower than 30 % of the FFC only with methane losses
lower than 1 %. Consequently, the second main param-
eter influencing the GHG emissions is the substrate used.
As set in the EU directive (RED and RED2 proposal),
wastes and residues have 0 GHG emissions till the point
of collection, therefore biowaste, without emissions
from the biogas plant (when methane emissions are set
to 0), has only emissions from the transport process,
which are very close to 0. The percentage of methane
losses which causes GHG emissions higher than 30 % of
the FFC start at about 4 %, with 5 % internal electricity
consumption. This drops to about 3.5 % with 15 % of
internal electricity consumption (Figure 37: b, d and f).
Average parasitic electricity consumption of agricultural
biogas plants amounted in FNR (2010) to 7.9 %.
In Figure 37 the GHG emissions of biogas plants
with 10 % internal electrical consumption are reported
with different levels of heat export. The percentage of
useful heat exported are set to 20 and 40 % of the energy
content of the biogas produced, in terms of Lower Heat-
ing Value (LHV); they do not include the heat used
internally to warm the digesters.
In the case of maize, (Figure 37: a, c and e) the per-
centage of methane losses which cause GHG emissions
higher than 30 % of the FFC start from about 0.5 % with
no heat export, to about 1 % with 20 % heat export, up
to about 2 % when the amount of useful heat exported is
40 % of the total energy content of the biogas produced.
It can be concluded that a biogas plant, which does not
export the heat and uses solely maize cannot meet the
reduction target in case the technology adopted for elec-
tricity production in the CHP results in 1–2 % methane
emissions (not considering any other emissions).
For biowaste (Figure 37: b, d and f) the methane
losses resulting in GHG emissions higher than the 30 %
FFC start from about 3.5 % when there is no heat export,
to about 4.5 % with 20 % of the heat is exported, up to
about 5.5 % when 40 % of the energy content of the
biogas produced is exported.
These results show that methane emissions are still
the most relevant parameter in determining the GHG
emissions of biogas systems, however, the export of
useful heat significantly contributes to the reduction of
the GHG emissions per MJ of electricity produced by
allocating part of the emissions to the heat exported.
The anaerobic digestion of animal manures and slur-
ries is, correctly, seen as one of the most effective meth-
ods to reduce GHG emissions from manure handling
(Battini et al., 2014). In fact, anaerobic digestion in
biogas plants allows avoidance of the methane emissions
that would otherwise take place during the storage of the
raw slurries.
In Figure 38, some example of calculations, based on
Giuntoli et al. (2015) are reported with the same
approach of removing all the methane losses from the
plants and adding a variable loss of methane, from 0 to
7 %, to the JRC data. Figure 38 a clearly shows that the
methane emissions are negative, and, even if 7 % of the
methane produced is lost in fugitive emissions, the GHG
emissions are not higher than -150 g CO2 eq/MJ electric-
ity produced when 5 % of the electricity produced is
used for internal consumption. The results are obvious

Methane emissionsGreenhouse gas balance for assessment of significance of methane emissions
since the credit for digesting the manure represents
17.5 % of the produced methane.
By increasing the internal electrical consumption,
the emissions actually decrease (Figure 38c), down to
about -155 g CO2 eq/MJ with 7 % methane loss, as a
larger amount of manure is needed to produce 1 MJ
electricity, therefore there are higher credits. Surpris-
ingly, also if the efficiency of the plant is improved by
exporting part of the heat the emissions increase (Figure
38e). Although it may seem anti-intuitive, it is correct,
because part of the emissions are allocated to the heat, as
well as part of the negative emissions (due to the credits)
are allocated to the heat. Since the credit has a higher
impact on the result, the outcome is higher emission of
41
Figure 36: Impact of electricity consumption and substrate on GHG emissions; plants based on maize and biowaste
GHG emissions (g CO2eq MJel-1)5
% E
lect
rica
l Con
sum
ptio
n10
% E
lect
rica
l Con
sum
ptio
n15
% E
lect
rica
l Con
sum
ptio
n
Maize 30 % EU FFC
0% heat utilization 0% heat utilization
a)
c)
e)
b)
d)
f)
Biowaste 30 % EU FFC

Methane emissions Greenhouse gas balance for assessment of significance of methane emissions
42
GHG per MJ of electricity produced.
It must be said that although the emissions increase,
they go from about -155 to about - 130 g CO2 eq/MJ in
the worst case, with 7 % methane loss, it can be con-
cluded that in any case manure digestion is an effective
method to capture the methane emission that would
otherwise occur with the open storage of raw slurry and
valorise energetically the methane produced.
In Figure 38b,d and f, the GHG emissions of the co-
digestion of manure and maize with different percent-
ages of maize (20, 40 and 70 % in fresh matter mass) are
shown.
In Figure 38b it can be noted that the GHG emis-
sions per MJ of electricity go from negative values up to
Figure 37: Impact of heat utilization and substrate on GHG emissions; plants based on maize and biowaste
GHG emissions (g CO2eq MJel-1)
0%he
at e
xpor
t20
% H
eat e
xpor
t40
% h
eat e
xpor
t
Maize 30 % EU FFC
10 % electrical consumption 10 % electrical consumption
a)
c)
b)
d)
Biowaste 30 % EU FFC
f)e)

Methane emissionsGreenhouse gas balance for assessment of significance of methane emissions
the 30 % FFC, with 7 % methane losses, when manure is
co-digested with 20 % maize silage. With 40 % maize, at
5 % losses from the plant we have emissions higher than
the 30 % FFC limit (Figure 38d). In case the mixture is
made of 70 % maize, by fresh matter, (Figure 38f) the
methane emissions from the plant must be kept at values
lower than 2 % of the methane produced to have total
GHG emissions lower than 30 % of the FFC. The
manure credit has in such a configuration only minor
impact on the GHG balance of the plant.
Figure 38: Impact of manure on GHG emissions; plants based on co-digestion of manure with Maize 1 EL = Electrical internal consumption as a percentage of the total electrical production2 Maize FM= share of maize as fresh mass3 H-Share of heat utilization over the total energy content of the biogas reaching the CHP* The yellow area represents 30 % of the FFC
43
5% EL1, 0% H2, 0% Maize (FM)3 10 % EL, 0% H, 20% Maize (FM)
GHG emissions (g CO2eq MJel-1)
a)
c)
b)
d)
f)e)
10% EL, 0% H, 0% Maize (FM)
10 % EL, 20% H, 0% Maize (FM)
10% EL, 0% H, 40% Maize (FM)
10% EL, 0% H, 70% Maize (FM)
Greenhouse gas balance for assessment of significance of methane emissions
44
7.5 Limitations of the AnalysisFor a correct interpretation of the results of any LCA
assessment, the limitations of the approach used should
be identified and reported. The limitations of this study
were identified as:
• Single environmental impact category used: the lack of
information on other environmental impacts reduc-
es the significance and robustness of the results and
does not allow the identification of trade-offs among
environmental areas of concern.
• Attributional modelling approach: the results obtained,
relative to 1 MJ of electricity, do not provide infor-
mation on the impacts deriving from market medi-
ated effects (scale effects are neglected) therefore the
results should not be used to support policy aimed at
changing the installed capacities (e.g. Indirect Land
Use Change for maize).
• N2O emissions are not accounted for: as N2O is a pow-
erful GHG, the results lose robustness.
7.6 Conclusions from the GHG BalanceThe results of this modelling exercise confirm that
methane losses from the biogas plants are the most
significant parameter affecting the GHG emissions of
biogas plants running on energy crops or biowaste. In
fact, in all the pathways modelled, with the increase of
the methane losses, the GHG emissions go from lower to
higher than the 30 % FFC limit, therefore the pathways
would go from sustainable to unsustainable, according
to the EC methodology.
The on-site parasitic electrical demand has a very
low impact on the GHG performances of biogas plants
if compared to methane emissions from the plant. Ther-
mal efficiency has a limited impact on the GHG perfor-
mances of biogas pathways as well, however it may con-
tribute in increasing the maximum allowed methane
loss from the plant to more feasible amounts for energy
crops and biowaste.
In fact, if maize is digested alone, and 40 % of the
heat is exported the 30% FFC limit is reached with 2 %
methane emissions. It should be mentioned that some
plant systems come with emissions, which are difficult to
avoid. Any on site CHP unit for instance will result in
uncombusted methane emissions from the combined
heat and power unit in that order of magnitude (see
Figure 34). Even with all other sources reduced to negli-
gible levels, this inevitable emission will occur and need
to be considered.
On the other hand, manure digestion guarantees
negative emissions owing to the credits for avoided
methane emissions from the manure storage, even if 7 %
of the methane produced is lost (in case of 100 %
manure digestion). Furthermore, co-digestion of manure
and energy crops may create synergies thanks to the
combination of the positive aspects of both substrates,
the excellent environmental results of manure digestion
and the economic, logistic and technical performances
of maize, but only a limited share of maize can be
allowed as to be seen in Figure 33 and reported also in
Agostini et al. (2015).
It should be added that due to high water content
and low biogas yields manure based plants have much
higher volumes of substrate to be treated than energy
crop based plants. Open digestate storage may contribute
to significant methane emissions if retention times are
too short. Consequently, the gas tight storage of digestate
becomes a crucial factor for the economics and GHG
reduction. (Agostini et al. 2016) showed that there are
cases in which the costs of covering digestate are rapidly
paid back. The outcome of such analysis is highly
dependent on the tariffs for the electricity produced, the
necessary storage capacity, the gas potential of the
digestate etc. In particular the retrofit of existing
installations might be limited due to construction limits.
The addition of energy crops to manure might be
necessary to increase plant capacity to a scale which is
economically feasible. Particular attention must be paid
to plant configuration, retention time and digestate
storage with increasing portions of energy crops, to
ensure minimal methane release and to ensure emissions
less than 30 % of the FFC.
The biogas plants modeled in this assessment are to
be considered conceptual plants originally built to repre-
sent common technologies in Europe. Actual biogas
plants concepts are highly individualized and it is
impossible to really define “representative plant con-
cepts”. However the methane emission situation given
above should allow a general evaluation of the GHG
performances of the different concepts and give an idea
which concepts are able to fulfill certain emission reduc-
tion targets.
Methane emissions

Methane emissionsConclusion and outlook
Methane emission quantification within the biogas
sector is a new topic, which will be of significant interest
to the scientific and industry communities in assessing
sustainability of biogas systems. For example, according
to EU legislation, operators must prove that the biogas
system provides a certain reduction in GHG emissions
as compared to a potential fossil fuel displaced on a
whole life cycle analysis. The methodologies (including
the FFCs) and the interpretation and evaluation of the
results obtained, which are still under development,
must be standardized to allow the industry and policy to
proceed.
The methodology for methane emissions evaluation
from biogas plants has been developing over recent
years. Currently several methods are in use and a variety
of data sets have been provided from different interna-
tional teams. In the future the methods used and in
particular the documentation and reporting of the
results needs to be harmonized in order to obtain com-
parable and representative results. When comparing
results particular attention should be paid to the limita-
tions of the methods used, the duration of measurement
(in order to cover time variability of specific emission
sources), the completeness of plant components meas-
ured and potential sources included but not belonging
to the biogas facility (e.g. barns) and the operational
mode of the plant. For a representative emission factor
of the average emissions during operation, all aspects
need to be sufficiently considered for a sound result.
The parameters most affecting the quantity of meth-
ane emissions were identified as structural (the tech-
nologies deployed) and operational (e.g. gas manage-
ment). It was found that open storage of digestate, the
CHP engine, leaks and the PRV were the most important
sources. In some cases large quantities of methane emis-
sions have been reported caused by single large leaks or
long lasting pressure relief events.
The application of specific monitoring and/or tech-
nologies can reduce these emissions. A crucial part of
any operation should be a monitoring plan and in par-
ticular frequent monitoring of any potential emission
sources on site. Some of the potentially larger sources
(CHP, PRV and large leaks) are dependent on operation
and time variant and therefore need to be routinely
monitored. In case of increasing emissions they should
be substantially reduced by operational or technical
measures.
It is very difficult to give general, average numbers
for emissions from components or complete biogas
plants. Firstly, the results given in literature have large
differences due to the variations within the methodology
as mentioned above. For example CHP emissions show
a substantial variability, although the methods for
quantification are well defined and engine construction
and operation should lead to similar emissions. Secondly
the plants are highly individualized and any comparison
needs to be done in relation to the plant design and plant
operation in order to obtain a general emission factor.
Thirdly - methane emissions need to be seen in con-
text with other factors influencing the overall GHG bal-
ance. Looking at the methane emission alone will not
allow assessment of the full impact of the plant on GHG
emissions related to the energy provided or waste treat-
ed.
Assessing methane emissions in the context of a
GHG balance it becomes obvious that beside the meth-
ane emissions, other important factors (in decreasing
order) on the overall GHG balance are: the substrate
used; the heat utilization; and the parasitic energy
demand. In case of a clear reduction target the plant
design needs to be chosen carefully, since some compo-
nents (such as CHP unit, open digestate storage) cause
inevitable emissions once in operation.
Assuming a 30 % FFC limit as a target for the opera-
tion, it becomes apparent that energy crop based plants
will have difficulties to reach this reduction target with-
out specific measures (such as heat utilization, gas tight
digestate storage and exhaust treatment at the CHP)
since the energy crops come with a GHG burden associ-
ated with the production of the crops. On the other
hand, manure digestion reduces significantly emissions
from manure storage (in the absence of a biogas plant);
manure digestion significantly reduces GHG emissions
of co-dogestion systems.
45
8. Conclusion and outlook

Methane emissions Conclusion and outlook
46
The major task for the future is an improvement of
precision, reproducibility and representativeness of the
methods used for emission quantification. A method
harmonization or at least a defined protocol will be nec-
essary to compare results from different measurements.
An important aspect of the documentation is the defini-
tion of the status of the plant and how highly time vari-
ant emissions (such as PRV release events) are included
in a long-term reference time period. Only comparable
results in combination with a sufficient number of
plants analyzed will lead to a better understanding of the
emissions from the whole sector.
The results presented show a variety in the amount
of emissions from biogas plants. There are not sufficient
data for a general assessment of the sector, but trends
indicate which components should be monitored and
which measures are useful to minimize the amount of
released methane.
A general task for the future is to raise awareness
within the plant operators and plant manufactures on
this issue. Only if the industry is sensitive to the subject,
can emissions be further reduced.
Methane emissionsReferences
AGOSTINI A., BATTINI F., PADELLA M., GIUNTOLI J.,
BAXTER D., MARELLI L., AMADUCCI S., (2016) Eco-
nomics of GHG emissions mitigation via biogas produc-
tion from Sorghum, maize and dairy farm manure diges-
tion in the Po valley, In Biomass and Bioenergy, Volume 89,
2016, Pages 58–66, ISSN 0961-9534, (http://www.science-
direct.com/science/article/pii/S0961953416300435)
BATTINI F, AGOSTINI A, BOULAMANTI A, GIUNTOLI J,
AMADUCCI S (2014). Mitigating the environmental
impacts of milk production via anaerobic digestion of
manure: Case study of a dairy farm in the Po Valley. Sci-
ence of The Total Environment. 481. 196–208 10.1016/j.
scitotenv.2014.02.038.
AGOSTINI A., BATTINI F., GIUNTOLI J., TABAGLIO V.,
PADELLA M., BAXTER D., MARELLI L., AMADUCCI S.;
(2015) Environmentally sustainable biogas? The key role of
manure co-digestion with energy crops; Energies, 8 (2015),
pp. 5234–5265 http://www.mdpi.com/1996-1073/8/6/5234/
htm
ANONYMUS, (2009) A Biogas Road Map for Europe. Euro-
pean Biomass Association. Available at: http://www.seai.ie/
Renewables/AD_In_Ireland_22nd_October/A_Biogas_
Roadmap_for_Europe.pdf (last access 5th January 2017)
ASCHMANN, V. (2014), Einflussfaktoren auf die Kohlenwas-
serstoffkonzentration im Abgas biogasbetriebener Block-
heizkraftwerke (BHKW) (Influences on the concentration
of hydrocarbons in the exhaust gas of biogas-driven com-
bined heat and power units (CHPU)), in: VDI Berichte
2214 - Emiss. 2014 Stand - Konzepte - Fortschritte, VDI-
Verlag GmbH, Düsseldorf, pp. 193 – 201.
BAUER, F., HULTEBERG, C., PERSSON, T., TAMM, D. (2013)
Biogas upgrading – Review of commercial technologies.
SGC Rapport Vol. 270. Svenskt Gastekniskt Center AB.
Available at: https://lup.lub.lu.se/search/ws/
files/5465492/4580054.pdf (last access 16th February
2017).
BENSON, R., MADDING, R., LUCIER, R., LYONS, J., CZERE-
PUSZKO, P. (2006) Standoff passive optical leak detection
of volatile organic compounds using a cooled InSb based
infrared imager, in: Proceedings of the Air and Waste Man-
agement Association’s - 99th Annual Conference and Exhi-
bition 2006. [Air and Waste Management Association
(ed.)], New Orleans.
BOULAMANTI, A.K., DONIDA MAGLIO, S., GIUNTOLI, J.,
AGOSTINI, A. (2013) Influence of different practices on
biogas sustainability. Biomass Bioenergy, 20th European
Biomass Conference 53, pp. 149–161. doi:10.1016/j.biom-
bioe.2013.02.020
CLEMENS, J. (2014) Erfahrungen bei der Untersuchung von
Biogasanlagen auf Gasdichtheit -Diffuse emissions from
biogas plants – practical experience, Gwf GasErdgas. 3
(2014), pp. 128 – 130. Available at: http://www.bonalytic.
de/cps/bonalytic/ds_doc/GE_03_2014_Clemens.pdf (last
access 5th January 2017).
CLEMENS, J., KOHNE, S., NEITZEL, S., SCHREIER, W.
(2014) IR-Gasvisualisierung als Mittel zur Steigerung des
sicheren und umweltkonformen Betriebs von Biogasanla-
gen. Available at: http://www.syswe.de/fileadmin/user_
upload/10_Downloads/Downloads_Biogas/20140805_
QMaB_Gasvisualierung.pdf (last access 5th of January
2017).
COM 11 (2010): European Commission; Report from the
Commission to the Council and the European Parliament
on Sustainability Requirements for the Use of Solid and
Gaseous Biomass Sources in Electricity, Heating and Cool-
ing; European Commission, Brussels, Belgium (2010);
http://eur-lex.europa.eu/LexUriServ/LexUriServ.
do?uri=COM:2010:0011:FIN:EN:PDF
CRENNA, B.P., FLESCH, T.K., WILSON, J.D. (2008) Influence
of source–sensor geometry on multi-source emission rate
estimates. Atmos. Environ. 42 (32), pp. 7373–7383.
doi:10.1016/j.atmosenv.2008.06.019
DANIEL-GROMKE, J., LIEBETRAU, J., DENYSENKO, V.,
KREBS, C. (2015), Digestion of bio-waste - GHG emis-
sions and mitigation potential, Energy, Sustainability and
Society, Volume 5:3, doi: 10.1186/s13705-014-0032-6
DYAKOWSKA, E., FABRE,J., CALZADA, S., KASHAP,T.,
OCCHIO, L., (2014) Gas Emissions Measurments - GERG
Project N. 2.73707, Proceedings of International Gas
Union Research Conference (IGRC 2014); Gas Innovations
Inspiring Clean Energy; Copenhagen, Denmark; 17 – 19
September 2014; Volume 1 of 3, ISBN: 978-1-63439-408-6
DIN 53380-2:2006:11 (2006) Testing of plastics - Determina-
tion of gas transmission rate - Part 2: Manometric method
for testing of plastic films.
EN 15446:2008 „Fugitive and diffuse emissions of common
concern to industry sectors - Measurement of fugitive
emission of vapours generating from equipment and pip-
ing leaks”.
EN ISO 25139:2011-08 (2011) Stationary source emissions -
Manual method for the determination of the methane
concentration using gas chromatography (ISO 25139:2011).
FLESCH, T.K., WILSON, J.D., HARPER, L.A., CRENNA, B.P.,
SHARPE, R.R. (2004) Deducing Ground-to-Air Emissions
from Observed Trace Gas Concentrations: A Field Trial. J.
Appl. Meteorol. 43, pp. 487–502. doi:10.1175/1520-
0450(2004)043<0487:DGEFOT>2.0.CO;2
FLESCH, T.K., DESJARDINS, R.L., WORTH, D. (2011) Fugi-
tive methane emissions from an agricultural biodigester.
Biomass Bioenergy 35, 3927–3935. doi:16/j.biombi-
oe.2011.06.009
47
9. References

Methane emissions
References
48
FLESCH, T.K., VERGE, X.P.C., DESJARDINS, R.L., WORTH,
D. (2013) Methane emissions from a swine manure tank in
western Canada. Can. J. Anim. Sci. 93, 159–169. doi:10.4141/
cjas2012-072
FNR – FACHAGENTUR FÜR NACHWACHSENDE ROHST-
OFFE E.V. (2010). Biogas-Messprogramm II - 61 Biogasan-
lagen im Vergleich, 1st ed. Fachagentur Nachwachsende
Rohstoffe e.V., Gülzow. Available at: https://mediathek.fnr.
de/biogas-messprogramm-ii-61-biogasanlagen-im-ver-
gleich.html (last access: 5th January 2017).
FNR – FACHAGENTUR FÜR NACHWACHSENDE ROHST-
OFFE E.V. (2012) BIOMETHAN, BioenergieHerausgeber
Fachagentur Nachwachsende Rohstoffe e. V. (FNR), OT
Gülzow, Hofplatz 1, 18276 Gülzow-Prüzen, Bestell-Nr. 531,
https://mediathek.fnr.de/media/downloadable/files/
samples/f/n/fnr_biomethan_web.pdf
GAO, Z., DESJARDINS, R.L., FLESCH, T.K., 2010. Assessment
of the uncertainty of using an inverse-dispersion technique
to measure methane emissions from animals in a barn and
in a small pen. Atmos. Environ. 44 (26), 3128–3134.
doi:10.1016/j.atmosenv.2010.05.032
GIOELLI, F., DINUCCIO, E., BALSARI, P., 2011. Residual
biogas potential from the storage tanks of non-separated
digestate and digested liquid fraction. Bioresour. Technol.
102, 10248–10251. doi:10.1016/j.biortech.2011.08.076
GIUNTOLI J., AGOSTINI A., EDWARDS R., MARELLI L.;
Solid and Gaseous Bioenergy Pathways: Input Values and
GHG Emissions; version 1a; European Commission, Joint
Research Centre, Science and Policy Reports, Publications
Office of the European Union, Luxembourg (2015) EUR
27215EN https://ec.europa.eu/energy/sites/ener/files/doc-
uments/Solid%20and%20gaseous%20bioenergy%20path-
ways.pdf (accessed in February 2016)
GIUNTOLI J., AGOSTINI A., EDWARDS R., MARELLI L.;
Solid and Gaseous Bioenergy Pathways: Input Values and
GHG Emissions Calculated according to methodology set
in COM(2016) 767: Version 2; European Commission,
Joint Research Centre, Science and Policy Reports, Publica-
tions Office of the European Union, Luxembourg (2017)
EUR 27215EN https://ec.europa.eu/jrc/en/publication/
eur-scientific-and-technical-research-reports/solid-and-
gaseous-bioenergy-pathways-input-values-and-ghg-emis-
sions-calculated-according-0 (accessed in August 2017)
GROTH, A., MAURER, C., REISER, M., KRANERT, M. (2015)
Determination of methane emission rates on a biogas
plant using data from laser absorption spectrometry.
Bioresour. Technol. 178, pp. 359–361. doi: 10.1016/j.
biortech.2014.09.112
HAFNER, S.D., HOWARD, C., MUCK, R.E., FRANCO, R.B.,
MONTES, F., GREEN, P.G. ET AL. (2013) Emission of
volatile organic compounds from silage: Compounds,
sources, and implications, Atmos. Environ. 77, pp. 827 –
839. ISSN:1352–2310/$. doi:http://dx.doi.org/10.1016/j.
atmosenv.2013.04.076.
HARPER, L.A., FLESCH, T.K., WEAVER, K.H., WILSON, J.D.
(2010) The Effect of Biofuel Production on Swine Farm
Methane and Ammonia Emissions. J. Environ. Qual. 39
(6), pp. 1984–1992. doi:10.2134/jeq2010.0172
HOLMGREN, M.A., HANSEN, M.N., REINELT, T.,
WESTERKAMP, T., JØRGENSEN, L., SCHEUTZ, C.,
DELRE, A. (2015) Methane emission measurements from
biogas production – data collection and comparison of
measurement methods, final report (2015:158). Energiforsk
AB, Malmö. Available at: http://www.sgc.se/ckfinder/
userfiles/files/EF2015 -158+methane+emissions+measuri
ng.pdf (last accessed on 5th of January 2017).IPCC (2006)
IPCC (2006): Guidelines for National Greenhouse Gas
Inventories
HRAD, M., PIRINGER, M., HUBER-HUMER, M. (2015)
Determining methane emissions from biogas plants –
Operational and meteorological aspects. Bioresour. Tech-
nol. 191, pp. 234–243. doi:10.1016/j.biortech.2015.05.016
HUSTED, S., 1994. Seasonal Variation in Methane Emissions
from Stored Slurry and Solid Manures. J. Environ. Qual.
23, 585–592.
IPCC (2006) Guidelines for National Greenhouse Gas Invento-
ries; http://www.ipcc-ggip.iges.or.jp/public/2006gl/pdf/4_
Volume4/V4_10_Ch10_Livestock.pdf, download
17.10.2017
IPCC (2012) Renewable Energy Sources and Climate Change
Mitigation, Special Report of the Intergovernmental Panel
on Climate Change.
ISO 14040: 2006: Environmental Management-Life Cycle
Assessment-Principles and Framework. International
Organisation for Standardisation: Brussels, Belgium
ISO 14067:2013; Greenhouse gases -- Carbon footprint of
products -- Requirements and guidelines for quantifica-
tion and communication; International Organisation for
Standardisation: Brussels, Belgium
KRETSCHMANN, R., ROTHE, F., POPPITZ, W., MOC-
ZIGEMBA, T. (2012), Ermittlung der Standzeiten von
Abgasreinigungseinrichtungen an BHKW-Motoren hinsi-
chtlich der Minderung von Formaldehyd, Methan, Kohlen-
monoxid, Stickoxiden und Geruch - Determination of the
lifetime of exhaust gas treatment units at CHP engines
concerning the abatement of formaldehyde, methane,
nitrogen oxide and odor, Sächsisches Landesamt für
Umwelt, Landwirtschaft und Geologie (LfULG). ISSN
1867-2868, Dresden, http://www.umwelt.sachsen.de/
umwelt/luft/28554.htm (last access 4th November 2013).
LAUBACH, J., BAI, M., PINARES-PATINO, C.S., PHILLIPS,
F.A., NAYLOR, T.A., MOLANO, G., CÁRDENAS ROCHA,
E.A., GRIFFITH, D.W.T. (2013) Accuracy of micromete-
orological techniques for detecting a change in methane
emissions from a herd of cattle. Agric. For. Meteorol. 176,
50–63. doi:10.1016/j.agrformet.2013.03.006

Methane emissionsReferences
LIEBETRAU, J., REINELT, T., CLEMENS, J., HAFERMANN,
C., FRIEHE, J., WEILAND, P. (2013a) Analysis of green-
house gas emissions from 10 biogas plants within the
agricultural sector, Water Sci. Technol. 67, pp. 1370 – 1379.
doi:10.2166/wst.2013.005.
LIEBETRAU, J., KREBS, C., DANIEL-GROMKE, J., DENYSEN-
KO, V., STINNER, W., NEBEL, E., CUHLS, C., MÄHL, B.,
REINHOLD, J. (2013b) Analyse von Emissionen klimarel-
evanter Gase durch Biogasanlagen im Hinblick auf die
ökologische Bewertung der Biogasgewinnung aus Abfällen
– Analysis of greenhouse gas emissions from biogas plants
in view of the ecological assessment of biogas production
from waste. Final report No. 03KB027). Deutsche Bio-
masseforschungszentrum gemeinnützige GmbH, Leipzig.
Available at: https://www.energetische-biomassenutzung.
de/fileadmin/user_upload/Steckbriefe/dokumente/
03KB027_Endbericht.pdf (last access: 5th January 2017)
MASSÉ, D.I., TALBOT, G., GILBERT, Y. (2011) On farm biogas
production: A method to reduce GHG emissions and
develop more sustainable livestock operations. Spec. Issue
Greenh. Gases Anim. Agric. - Find. Balance Food Emiss.
166–167, pp. 436–445. doi:10.1016/j.anifeedsci.2011.04.075
MAUKY, E., WEINRICH, S., JACOBI, H.F., LIEBETRAU, J.,
NELLES, M.; 2017; Demand-Driven Biogas Production in
Full-Scale by Model Predictive Feed Control; Conference
paper; proceedings of 25th European Biomass Conference
and Exhibition; pp.1845 – 1851; DOI: 10.5071/25thEU-
BCE2017-5CO.4.1
MERRIL, R., MIKEL, D., COLBY, J., FOOTER, T., CRAW-
FORD, P., ALVAREZ-AVILES, L. (2011) EPA Handbook:
Optical Remote Sensing for Measurement and Monitoring
of Emissions Flux. Available at: https://www3.epa.gov/ttn/
emc/guidlnd/gd-052.pdf (last access 5th of January 2017)
MØNSTER, JG., SAMUELSSON, J., KJELDSEN, P., RELLA,
CW., SCHEUTZ, C. (2014) Quantifying methane emis-
sions from fugitive sources by combining tracer release and
downwind measurements – A sensitive analysis based on
multiple field surveys, Waste Management 24, pp. 1416-
1428, DOI: 10.1016/j.wasman.2014.03.025
MUHA, I., LINKE, B., WITTUM, G. (2015) A dynamic model
for calculating methane emissions from digestate based on
co-digestion of animal manure and biogas crops in full
scale German biogas plants. Bioresour. Technol. 178, pp.
350–358. doi:10.1016/j.biortech.2014.08.060
PARK, K.-H., WAGNER-RIDDLE, C., GORDON, R.J., 2010.
Comparing methane fluxes from stored liquid manure
using micrometeorological mass balance and floating
chamber methods. Agric. For. Meteorol. 150, 175–181.
doi:10.1016/j.agrformet.2009.09.013
PHONG, NGUYEN THANH (2012) Greenhouse Gas Emis-
sions from Composting and Anaerobic Digestion Plants.
Dissertation an der Hohen Landwirtschaftlichen Fakultät
der Rheinischen Friedrich-Wilhelms-Universität zu Bonn,
urn:nbn:de:hbz:5n-30027
RED 2009. Directive 2009/28/EC, On the promotion of the use
of energy from renewable sources and amending and sub-
sequently repealing Directives 2001/77/EC and 2003/30/
EC; OJEU, L, 140 (2009), pp. 16–62
RED recast 2016. COM(2016) 767 final; Proposal for a DIREC-
TIVE OF THE EUROPEAN PARLIAMENT AND OF THE
COUNCIL on the promotion of the use of energy from
renewable sources (recast); http://eur-lex.europa.eu/
resource.html?uri=cellar:151772eb-b7e9-11e6-9e3c-
01aa75ed71a1.0001.02/DOC_1&format=PDF
REINELT, T., LIEBETRAU, J., NELLES, M. (2016) Analysis of
operational methane emissions from pressure relief valves
from biogas storages of biogas plants. Bioresource Tech-
nology 217, pp. 257–264. doi:10.1016/j.biortech.2016.02.073
REINELT,T., DELRE, A., WESTERKAMP, T., HOLMGREN, M.
A., LIEBETRAU, J., SCHEUTZ, C. (2017) Comparative use
of different emission measurement approaches to deter-
mine methane emissions from a biogas plant. Waste Man-
agement (2017), http://dx.doi.org/10.1016/j.was-
man.2017.05.053
RO, K.S., JOHNSON, M.H., STONE, K.C., HUNT, P.G.,
FLESCH, T., TODD, R.W., 2013. Measuring gas emissions
from animal waste lagoons with an inverse-dispersion
technique. Atmos. Environ. 66, 101–106. doi:10.1016/j.
atmosenv.2012.02.059
SAX, M., SCHICK,M., BOLLI, S., SOLTERMANN-PASCA, A.,
VAN CAENEGEM, L. (2013) Methanverluste bei land-
wirtschaftlichen Biogasanlagen (Methane losses from agri-
cultural biogas plants), Bundesamt für Energie BFE, Bern.
Available at: http://www.bfe.admin.ch/dokumentation/
energieforschung/index.html?lang=de&publication=11145
(last access 1 April 2015).
SCHEFTELOWITZ, M., DANIEL-GROMKE, J., RENSBERG,
N., DENYSENKO, V., HILDEBRAND, K., NAUMANN, K.
ET AL. (2014), Stromerzeugung aus Biomasse (Vorhaben
IIa Biomasse), Deutsches Biomasseforschungszentrum,
Leipzig.
SCHREIER, W. (2011) Untersuchung von Gasleckagen bei
Biogasanlagen, Sächsisches Landesamt für Umwelt, Land-
wirtschaft und Geologie, Dresden, https://publikationen.
sachsen.de/bdb/artikel/15246 (last access: 25th April 2014).
STEENTJES, C. (2013) Biogasaufbereitung mit hochselektiver
Membran (Biogas upgrading with high selective mem-
brane. In: Tagungsband der 22. Jahrestagung und
Fachmesse des (Proceedings of the 22th annual conference
of) Fachverband Biogas e.V., Leipzig, 29th – 31th January
2013.
SVLFG, 2016. Technische Information 4 - Sicherheitsregeln für
Biogasanlagen (Technical information 4 – Security rules
for biogas plants). State March 2016. Available at: https://
www.svlfg.de/60-service/serv02_brosch/serv0201praev/
serv020103_tech_info/09_blbpdf12.pdf (last access: 5th
January 2017)
49

Methane emissions References
50
SWD259 (2014): European Commission Staff Working Docu-
ment SWD; State of Play on the Sustainability of Solid and
Gaseous Biomass Used for Electricity, Heating and Cooling
in the EU; European Commission, Brussels, Belgium
(2014), p. 259 2014; https://ec.europa.eu/energy/sites/ener/
files/2014_biomass_state_of_play_.pdf (accessed July
2015)
UNECE PROTOCOL (2009) KIEV PROTOCOL ON POL-
LUTANT RELEASE AND TRANSFER REGISTERS. Avail-
able at: http://www.unece.org/fileadmin/DAM/env/pp/
prtr/Protocol%20texts/PRTR_Protocol_e.pdf (last access:
5th January 2017)
VAN DIJK, G.H.J. (2012) Hydrocarbon emissions from gas
engine CHP-units 2011 measurement program, KEMA
Nederland B.V., Utrecht
VDI - VEREIN DEUTSCHER INGENIEURE (2005a). VDI
2469 Sheet 1 - Gaseous emission measurement - Meas-
urenment of nitrous oxide - Manual gas chromatographic
method.
VDI – VEREIN DEUTSCHER INGENIEURE (2005b) VDI
4285 Sheet 1 Determination of diffusive emissions by
measurement - Basic concepts.
VDI - VEREIN DEUTSCHER INGENIEURE (2010) VDI 3475
Sheet 4 - Emission control - Agricultural biogas facilities -
Digestion of energy crops and manure.
WELLINGER, A., MURPHY, J., BAXTER, D. (2013) The biogas
handbook: Science, production and applications. Wood-
head Publishing Limited, Cambrige, UK. ISBN (online)
978-0-85709-741-5.
WESTERKAMP, T., REINELT, T., OEHMICHEN, K., PONIT-
KA, J., NAUMANN, K. (2014a) KlimaCH4 - Klimaeffekte
von Biomethan (Climate effects of biomethane produc-
tion). DBFZ Rep. 20. Available at: https://www.dbfz.de/
fileadmin/user_upload/Referenzen/DBFZ_Reports/
DBFZ_Report_20.pdf (last access: 5th of January 2017)
WESTERKAMP, T., REINELT, T., LIEBETRAU, J. (2014b) Sci-
entific measurements of methane emissions with remote
and on-site methods in comparison. Presentation at the
2nd IBBA workshop in Kiel, Germany. Link: http://confer-
ence.sgc.se/ckfinder/userfiles/files/DBFZ.pdf (last access:
4th January 2016).
WOLF, D., SCHERELLO,A. (2013) Messung der Methanemis-
sion an der Biogasanlage Einbeck mittels CHARM®
(Methane Emission Measurement at Biogas Plant Einbeck
using CHARM®), in: Gwf GasErdgas, Deutscher Indus-
trieverlag GmbH, München, pp. 1 – 7.
YITBAREK, M.B., TAMIR, B. (2014) Silage Additives: Review,
Open J. Appl. Sci. 4, pp.258–274. doi:http://dx.doi.
org/10.4236/ojapps.2014.45026.

Methane emissions
wRitten by: Jan liebetrau
torsten Reinelt
Alessandro Agostini
bernd linke
edited by:Jerry d murphy
Published by ieA bioeneRgy, December 2017
imPRessum: Graphic Design by Susanne AUER/www.friedlundpartner.at
ISBN: 978-1-910154-36-6
http://www.iea-biogas.net
Task 37 - Energy from Biogas
IEA Bioenergy aims to accelerate the use of environmentally sustainable and cost competitive bioenergy that will contribute to future low-carbon energy demands. This report is the result of the work of IEA Bioenergy Task 37: Energy from Biogas.
the following countries are members of task 37, in the 2018 work Programme:
Australia Bernadette McCABEAustria Bernhard DROSG Günther BOCHMANNBrazil Paulo SCHMIDT Maecelo ALVES DE SOUSA Rodrigo REGIS DE ALMEIDA GALVãODenmark Teodorita AL SEADIFinland Saija RASI France Olivier THÉOBALD Guillaume BASTIDEGermany Jan LIEBETRAUNorway Tormod BRISEIDRepublic of Ireland (Task Leader) Jerry D MURPHY, [email protected] of Korea Ho KANGSweden Kerstin HOYERSwitzerland Urs BAIER The Netherlands Mathieu DUMONTUnited Kingdom Clare LUKEHURST Charles BANKS

Further Informationwww.ieabioenergy.com
Contact us: www.ieabioenergy.com/contact-us/


