25
Methane Emissions from the U.S. Natural Gas Industry and Leak Detection and Measurement Equipment March 29, 2012 Roger Fernandez U.S. EPA
| Date post: | 19-Jul-2018 |
| Category: |
Documents |
| Upload: | nguyenkhuong |
| View: | 217 times |
| Download: | 1 times |
Methane Emissions from the U.S. Natural Gas Industry and Leak
Detection and Measurement Equipment
March 29, 2012 Roger Fernandez U.S. EPA

Overview
• U.S. GHG Emissions by Gas
• Natural Gas STAR Overview
• Natural Gas in the GHG Inventory
• Updates to Natural Gas Estimates (1990-2009 Inventory)
• Leak Survey Methods
– Leak detection tools
– Leak measurement tools
• Contact and Further Information
1

Why Focus on Methane?
A potent greenhouse gas (GHG) with 100-year global warming potential of 25; atmospheric lifetime of ~12 years
The 2nd most important GHG accounting for ~18% of total climate forcing
A primary component of natural gas and a valuable, clean-burning energy source –Proven, viable technologies and practices exist to reduce methane
emissions cost-effectively Oil and natural gas operations are a significant source of total U.S.
(23%) and global (18%) human-made methane emissions.
Methane emissions in the oil and gas industry comprise over 70% of total U.S. Natural Gas industry GHG emissions on a 20 year global warming potential basis.

Natural Gas STAR Program
The Natural Gas STAR Program is a flexible, voluntary
partnership between EPA and the oil and natural gas
industry designed to cost-effectively reduce methane
emissions from natural gas operations.
• Over 120 partners and endorsers comprising over 50%
of U.S. oil and gas industry from well head to burner tip

Natural Gas STAR Key Components
• Guidance on new technologies and practices
– Technical documents on more than 80 cost-effective technologies and practices
– Free Technology Transfer workshops
– One-on-one technical assistance to identify and prioritize cost-effective methane emission reduction opportunities
• Annual record of partner voluntary actions and methane savings
Technical
Information
Annual Reports Project
Demonstrations
Workshops

What is Cost Effective?
87%
77%
47%
Percentage of over 80
Gas STAR
Recommended
Technologies and
practices at each
payback level
The simple payback is the number of years it takes to pay back
the capital cost of a project (based on $3/Mcf)
1%
Payback within 10 years
Payback within 3 years
Payback within 12 months
Immediate payback
Yet billions of dollars in losses through fugitive and vented emissions each year.
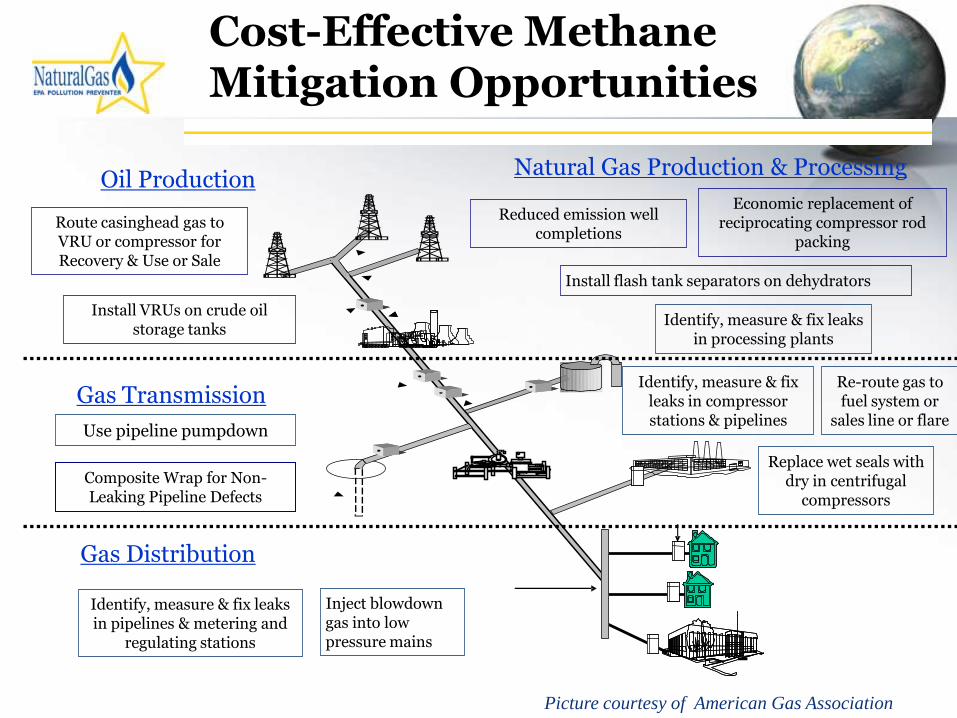
Cost-Effective Methane Mitigation Opportunities
Identify, measure & fix leaks in pipelines & metering and
regulating stations
Picture courtesy of American Gas Association
Route casinghead gas to VRU or compressor for Recovery & Use or Sale
Replace wet seals with dry in centrifugal
compressors
Oil Production
Install VRUs on crude oil storage tanks
Economic replacement of reciprocating compressor rod
packing
Install flash tank separators on dehydrators
Reduced emission well completions
Natural Gas Production & Processing
Use pipeline pumpdown
Identify, measure & fix leaks in compressor stations & pipelines
Gas Transmission
Gas Distribution
Inject blowdown gas into low pressure mains
Identify, measure & fix leaks in processing plants
Composite Wrap for Non-Leaking Pipeline Defects
Re-route gas to fuel system or
sales line or flare

U.S. GHG Emissions by Gas
Source: Draft Inventory of U.S. Greenhouse Gas Emissions and Sinks: 1990-2010 (Feb. 2012). epa.gov/climatechange/emissions/usinventoryreport.html.
In total, emissions increased by 11% from 1990 to 2010.
6,146 6,250 6,373 6,473 6,5616,769 6,816 6,858 6,923
7,118 7,003 7,044 7,078 7,189 7,238 7,171 7,2897,077
6,6436,866
0
1,000
2,000
3,000
4,000
5,000
6,000
7,000
8,000
1990
1991
1992
1993
1994
1995
1996
1997
1998
1999
2000
2001
2002
2003
2004
2005
2006
2007
2008
2009
2010
Tg
CO
2Eq
.
HFCs, PFCs, & Nitrous Oxide
Methane Carbon Dioxide
SF6SF6
6,187
7

Natural Gas in the GHG Inventory • EPA’s annual GHG inventory includes estimates for oil and gas
production, processing, transmission and storage, and distribution
• 30.9 MMTCO2e total CH4 emissions from petroleum systems
• 221.2 MMTCO2e total CH4 emissions from natural gas systems
– 130.3 field production (includes wells, gathering pipelines, and well-site gas treatment facilities such as dehydrators and separators)
– 17.5 processing (includes compressors and acid gas removal plants)
– 44.4 transmission and storage (includes compressor stations and storage tanks)
– 29.0 distribution (includes pipelines and gate stations)
• CH4 emissions from natural gas systems increased 31.4 MMTCO2e, or 17%, from 1990-2009
– Key driver of increase is increased production
• 32.2 MMTCO2 non-combustion CO2 estimates from natural gas systems
– 10.9 field production, 21.2 processing, 0.1 transmission and storage
• 0.5 MMTCO2 total CO2 emissions from petroleum systems 8
Source: Inventory of U.S. Greenhouse Gas Emissions and Sinks: 1990-2009 (Apr. 2011). epa.gov/climatechange/emissions/usgginv_archive.html.

Updates to Natural Gas Estimates (1990-2009 Inventory)
• EPA did not make changes to the 1990-2010 Inventory – Same methodologies, emission factors, sources of activity data as 1990-2009 – Ongoing review of information and data received
• Several changes made in 1990-2009 Inventory published last year – Increased calculated emissions to 120% of the previous Inventory – Main contributors to increase were improvements to estimates for gas well clean
ups, condensate storage tanks, and centrifugal compressor seals
• Included emissions from gas wells with hydraulic fracturing for the first time
– Used emission factor first published in the GHG Reporting Program, Subpart W TSD (April 2010)
– New factor based on four recent data sources containing over 1,000 data points • Includes direct industry estimates of emissions captured with reduced emission
completions. • Data is set representative, including b0th low (e.g., CBM) and higher pressure wells
– Previous inventories based on assumptions used in the EPA-GRI study (based on data from 1992) when hydraulically fractured gas wells were not as common
9

Leak Survey Methods
• Leak detection tools
– Infrared cameras
– Catalytic oxidation/thermal conductivity detector
• Leak measurement tools
– Acoustic leak detector and quantifier
– Hi Flow Sampler
– Calibrated vent bag
– Vane/hot wire anemometers
– Ultrasonic flow meter
– Turbine meter
10
The technologies mentioned in this presentation are those that Natural Gas STAR Partners have
reported using from own projects and experience. EPA is not endorsing a particular technology or
brand.
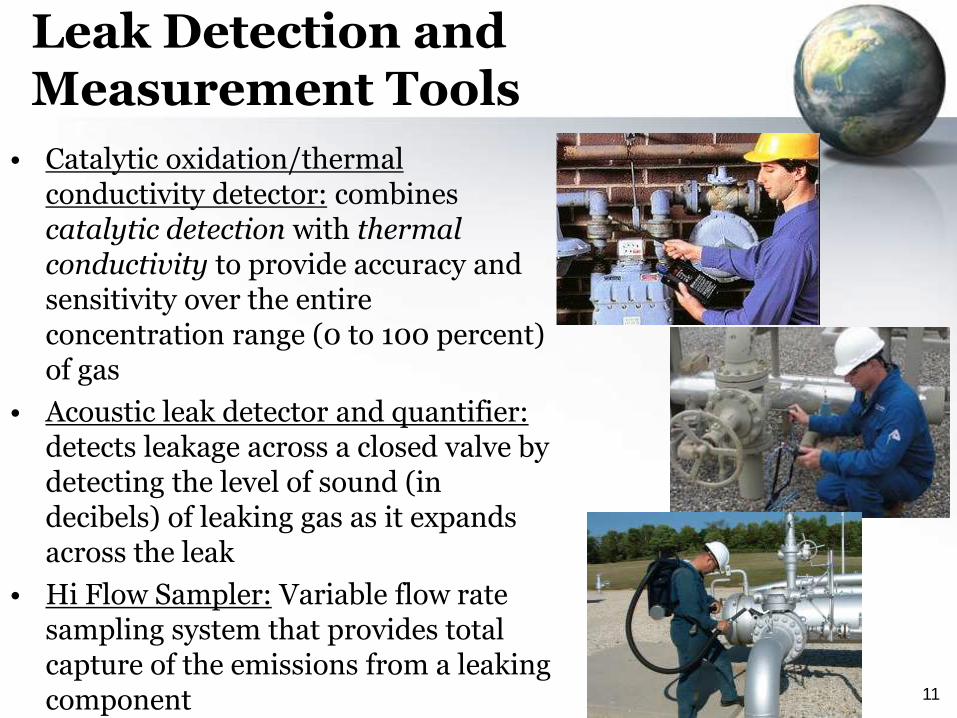
Leak Detection and Measurement Tools
• Catalytic oxidation/thermal conductivity detector: combines catalytic detection with thermal conductivity to provide accuracy and sensitivity over the entire concentration range (0 to 100 percent) of gas
• Acoustic leak detector and quantifier: detects leakage across a closed valve by detecting the level of sound (in decibels) of leaking gas as it expands across the leak
• Hi Flow Sampler: Variable flow rate sampling system that provides total capture of the emissions from a leaking component
11

Leak Measurement Tools
• Calibrated vent bag: bag of known volume (e.g., 3 ft3), made from antistatic plastic with a neck shaped for easy sealing around the vent
• Vane anemometer: channels emissions over a rotating vane that in turn rotates a fan to measure velocity of emissions
• Hot wire anemometer: measures emissions velocity by noting the heat conducted away by the emissions
12

Leak Measurement Tools
• Ultrasonic flow meter: consists of two transducers: both are ultrasonic signal generators and receivers
• Turbine meter: used on hydrocarbon emissions exceeding 10 standard ft3/minute
– Allows continuous and automated measurement with a recording device
13

Infrared Cameras
14
FLIR GF320
Opgal EYE-C-GAS

Infrared Cameras
• Can see methane leaks and volatile organic compounds
• Displays real-time visual image, allowing quicker identification and repair of leaks
• Allows for screening hundreds of components an hour
• Can screen inaccessible areas:
– Vent stacks
– Blowdown systems
• “Wish” – to have a camera that can measure emissions as well.
15
Compressor Station Blowdown
Storage Tank Emissions

Aerial Pipeline Leak Surveys
16
Reflected
Signal
Atmosphere Methane
Underground
Pipeline
Infrared
Laser Beam
Sniffer
Detection
or
• Over 10 times faster than ground surveys
• Full coverage of the right-of-way
• Easy access to rough terrain and non-disruptive to private land owners

ITT’s Airborne Natural Gas Emission Lidar (ANGEL) Service
17
• Airborne Differential Absorption Lidar (DIAL)
• Example emissions rate quantification:
– Consider a “fenceline” 100-ft high by 100-ft wide (10,000 ft2)
– At a wind speed of 2 mph = 10,560 ft/hour, 1.056 x 10⁸ standard ft3/hour (SCFH) of airflow across that fenceline under standard conditions
– If the air contains 1,000 ppm of methane on average (0.1%), then the methane flow is approximately 105,600 SCFH = 2,545 thousand standard ft3/day (MSCF/day)
Source: ANGEL, Aerial image
DIAL Sensor
Digital Video Camera
High Resolution Mapping Camera

Apogee Leak Detection System (LDS) and Chesapeake Energy
• Apogee LDS: an infrared-based method for detecting leaks from hydrocarbon liquids and gas pipelines, production and storage facilities, landfills, and coal-seam seeps
• Chesapeake’s Eastern Division has successfully used the Apogee LDS to survey gathering lines in several operating areas within the Appalachian Basin
• Sept. 2008 flight covered 616 miles
• To cover the same area with ground patrol:
– 4 men: 2 men on 2 crews, 2 vehicles, and fuel
– 6 hours/day; 6 miles/day
– Result: 100 days, 3,200 man hours, 5 months of detection
• Flight time was 65 hours
• Real savings in man hours, time, and vehicle fuel
18

Leak Surveys Inc. (LSI) and Enbridge
• After becoming a Natural Gas STAR Partner, Enbridge was interested in aerial infrared imaging to identify pipeline leaks
• Worked with LSI on a pilot project to survey 160 miles of pipeline, discovering 22 leaks that would have otherwise been undetected
• Immediately repaired all leaks, allowing Enbridge to reduce methane emissions by 1.38 million cubic feet (MMcf) per day
• Enbridge agreed the pilot project was a success and contracted LSI for three additional surveys—totaling more than 443 miles of pipeline surveyed
– Total of 30 leaks discovered and repaired through the three efforts
19

Inverse / Sensor Oriented Analysis
• Starting from measureable sensor data, what source(s) would reproduce observations?
– Sensor data contains information about upwind concentrations
• Similar approaches used on continental scale since <1980s
• We are considering two classes of methods:
– Statistical (trajectory based)
– Adjoint (gradient optimization based)
20
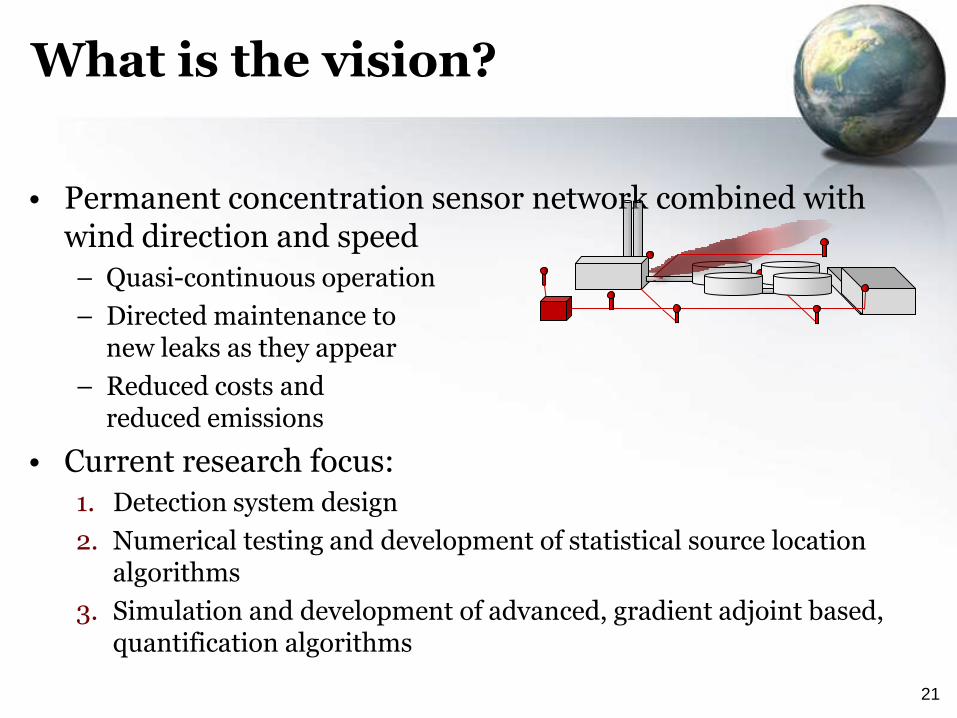
What is the vision?
• Permanent concentration sensor network combined with wind direction and speed
– Quasi-continuous operation
– Directed maintenance to new leaks as they appear
– Reduced costs and reduced emissions
• Current research focus:
1. Detection system design
2. Numerical testing and development of statistical source location algorithms
3. Simulation and development of advanced, gradient adjoint based, quantification algorithms
21

22
• Detailed proof of concept simulations show ability to locate synthetic emission sources, within in a complex geometry, under a range of conditions
– Adjoint approach shows potential to ultimately quantify sources, but still in very early phases of development
• Steady progress continues on developing field-ready sensors and strategies to efficiently implement source location algorithms
– Next steps would include controlled release experiments
Matthew Johnson, Canada Research Chair in Energy & Combustion Generated Pollutant Emissions, Associate Prof., Carleton University

Future Wish List
Remote sensing equipment that MEASURES emissions
Companies are working on this but equipment
completion date is unknown
23

Contact and Further Information
Roger Fernandez
Team Leader, U.S. EPA
Global Methane Initiative - Oil & Gas
Natural Gas STAR International
202-343-9386
Global Methane Initiative:
globalmethane.org
Natural Gas STAR:
epa.gov/gasstar 24


