38
1 Methanex Investor Presentation August 2014
| Date post: | 06-Mar-2018 |
| Category: |
Documents |
| Upload: | truonghanh |
| View: | 215 times |
| Download: | 2 times |
1
Methanex Investor Presentation August 2014
2 2
Forward-looking Statements & Non-GAAP Measures
Information contained in these materials or presented orally on the earnings conference call, either in prepared remarks or in response to questions, contains forward-looking statements. Actual results could differ materially from those contemplated by the forward-looking statements. For more information, we direct you to our 2013 MD&A and our second quarter 2014 MD&A, as well as the last slide of this presentation.
This presentation also contains certain non-GAAP financial measures that do not have any standardized meaning and therefore are unlikely to be comparable to similar measures presented by other companies. For more information regarding these non-GAAP measures, please see our 2013 MD&A and our second quarter 2014 MD&A.
3 3
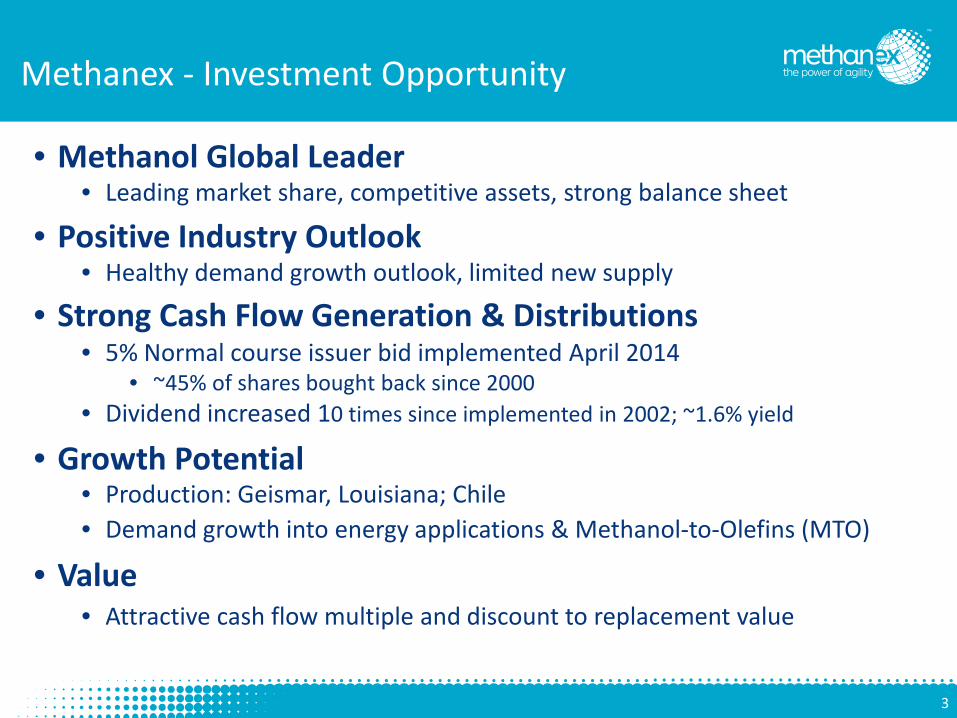
Methanex - Investment Opportunity
• Methanol Global Leader • Leading market share, competitive assets, strong balance sheet
• Positive Industry Outlook • Healthy demand growth outlook, limited new supply
• Strong Cash Flow Generation & Distributions • 5% Normal course issuer bid implemented April 2014
• ~45% of shares bought back since 2000 • Dividend increased 10 times since implemented in 2002; ~1.6% yield
• Growth Potential • Production: Geismar, Louisiana; Chile • Demand growth into energy applications & Methanol-to-Olefins (MTO)
• Value • Attractive cash flow multiple and discount to replacement value
4 4
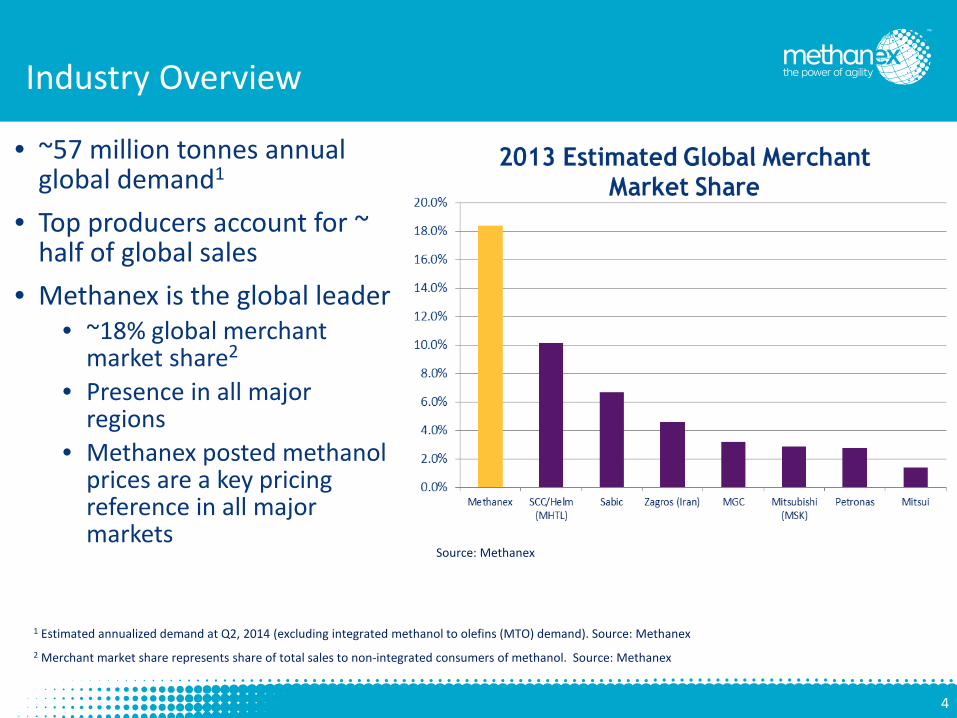
Industry Overview
• ~57 million tonnes annual global demand1
• Top producers account for ~ half of global sales
• Methanex is the global leader • ~18% global merchant
market share2
• Presence in all major regions
• Methanex posted methanol prices are a key pricing reference in all major markets
Source: Methanex
1 Estimated annualized demand at Q2, 2014 (excluding integrated methanol to olefins (MTO) demand). Source: Methanex 2 Merchant market share represents share of total sales to non-integrated consumers of methanol. Source: Methanex
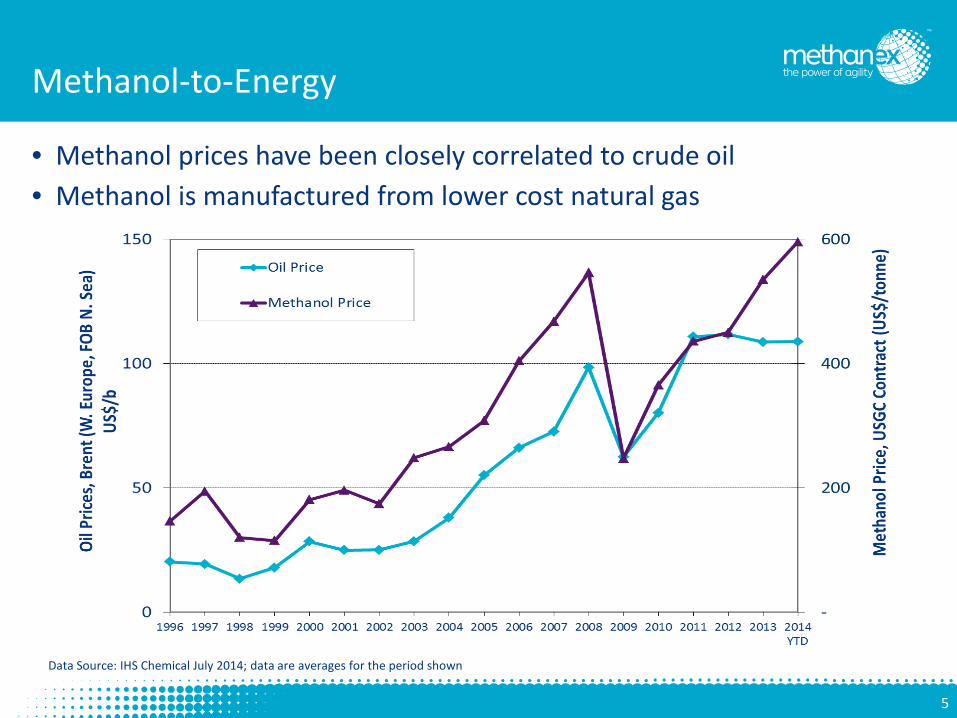
5 5
Methanol-to-Energy
• Methanol prices have been closely correlated to crude oil • Methanol is manufactured from lower cost natural gas
Data Source: IHS Chemical July 2014; data are averages for the period shown
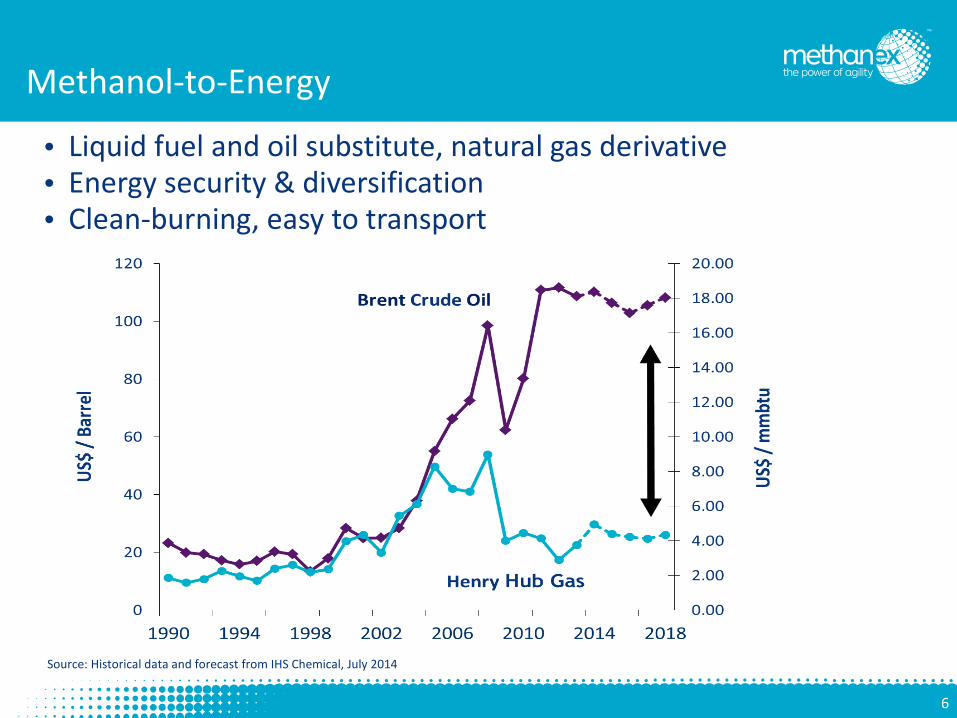
6 6
Methanol-to-Energy
Source: Historical data and forecast from IHS Chemical, July 2014
• Liquid fuel and oil substitute, natural gas derivative • Energy security & diversification • Clean-burning, easy to transport
7 7
Methanol..
• Is primarily produced from natural gas • Has diversified end uses
Formaldehyde Acetic Acid Wood Industry, Pharmaceuticals, Automotive Fleece, Adhesives, Paints
Methyl Methacrylate Methyl Chloride PMMA- LCD screens, automotive Silicones
Energy & MTO (40% of Demand; High Growth)
Traditional Uses (60% of Demand)
Fuel Blending
MTO Methanol-to-
Olefins
Marine Fuels
DME (di-methyl-ether)
MTBE
8 8
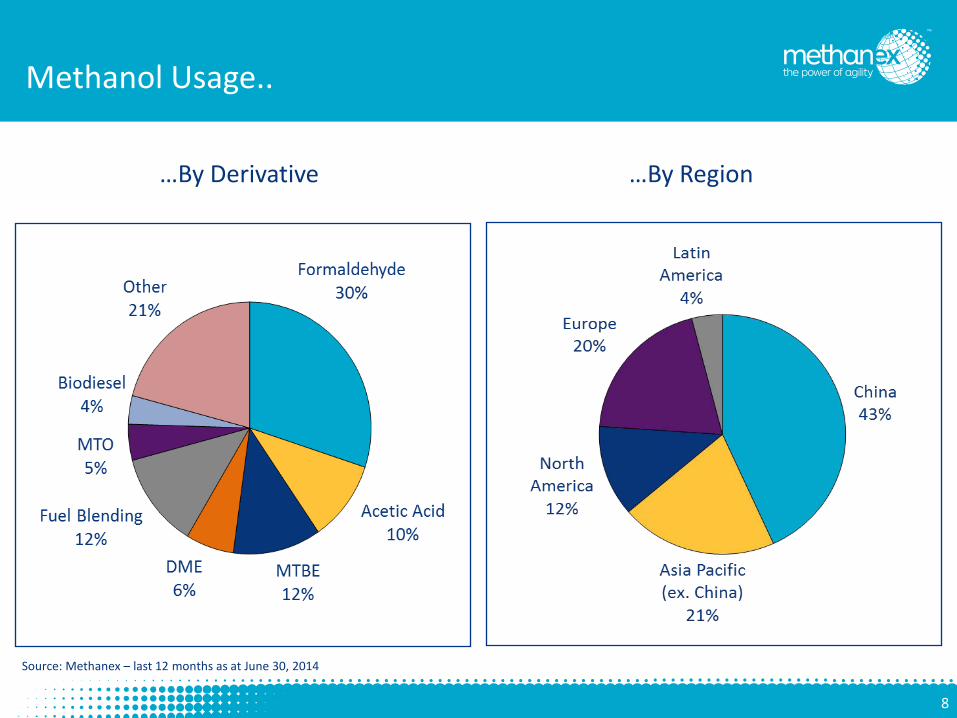
Methanol Usage..
…By Derivative …By Region
Source: Methanex – last 12 months as at June 30, 2014
9 9
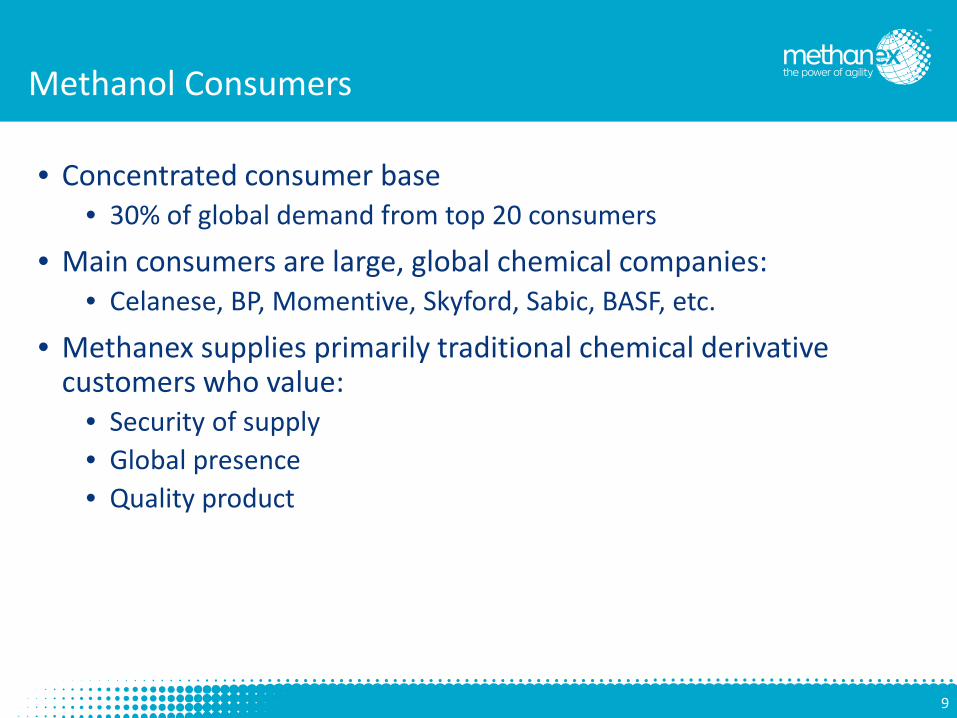
Methanol Consumers
• Concentrated consumer base • 30% of global demand from top 20 consumers
• Main consumers are large, global chemical companies: • Celanese, BP, Momentive, Skyford, Sabic, BASF, etc.
• Methanex supplies primarily traditional chemical derivative customers who value:
• Security of supply • Global presence • Quality product
10 10
0
10,000
20,000
30,000
40,000
50,000
60,000
70,000
80,000
2003 2004 2005 2006 2007 2008 2009 2010 2011 2012 2013E 2014E 2015E 2016E 2017E
Chemical MTBE/TAME Fuel DME MTO/MTP (Merchant)
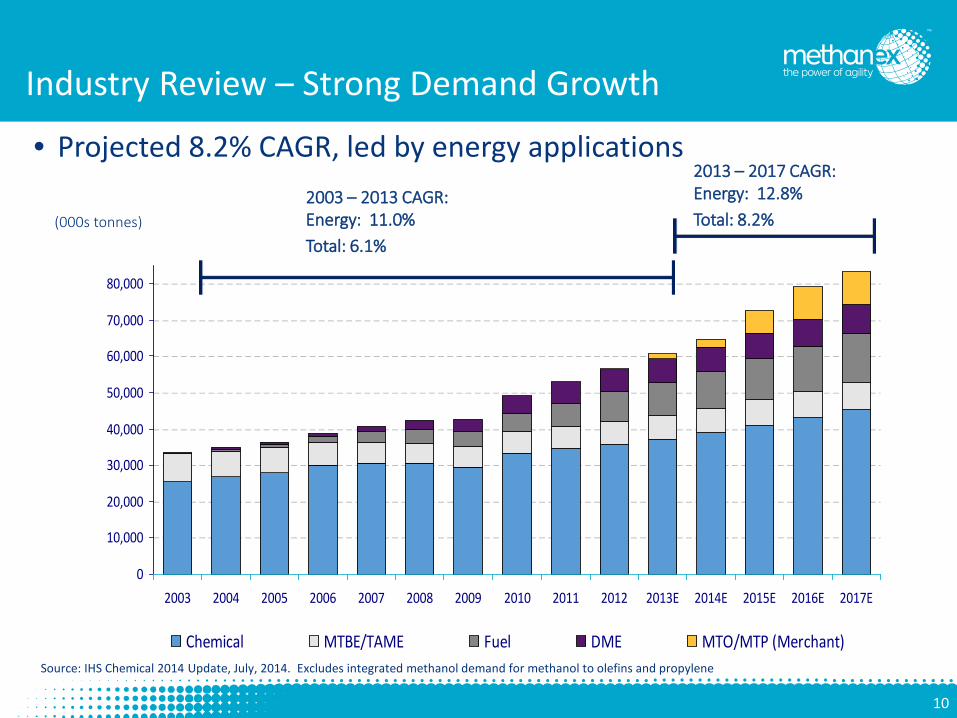
Industry Review – Strong Demand Growth
• Projected 8.2% CAGR, led by energy applications
(000s tonnes) 2003 – 2013 CAGR: Energy: 11.0% Total: 6.1%
2013 – 2017 CAGR: Energy: 12.8% Total: 8.2%
Source: IHS Chemical 2014 Update, July, 2014. Excludes integrated methanol demand for methanol to olefins and propylene
11 11
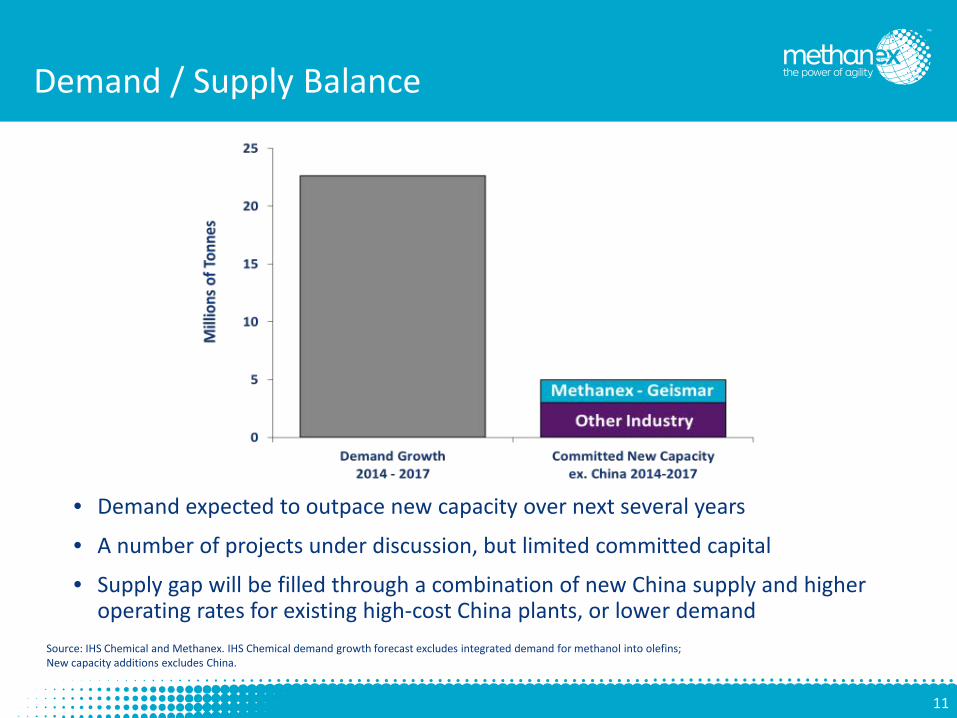
Demand / Supply Balance
• Demand expected to outpace new capacity over next several years
• A number of projects under discussion, but limited committed capital
• Supply gap will be filled through a combination of new China supply and higher operating rates for existing high-cost China plants, or lower demand
Source: IHS Chemical and Methanex. IHS Chemical demand growth forecast excludes integrated demand for methanol into olefins; New capacity additions excludes China.
12 12
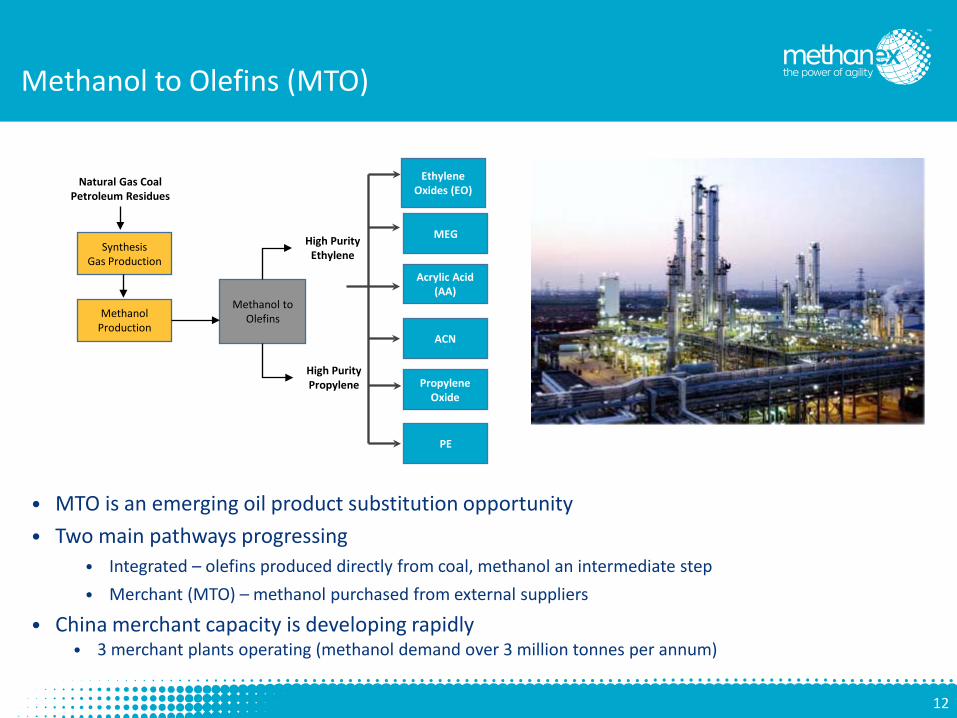
Methanol to Olefins (MTO)
• MTO is an emerging oil product substitution opportunity • Two main pathways progressing
• Integrated – olefins produced directly from coal, methanol an intermediate step • Merchant (MTO) – methanol purchased from external suppliers
• China merchant capacity is developing rapidly • 3 merchant plants operating (methanol demand over 3 million tonnes per annum)
Wison’s 0.8 MMT merchant methanol to 0.3 MMT olefins plant
Ethylene Oxides (EO)
MEG
Acrylic Acid (AA)
ACN
Propylene Oxide
PE
Synthesis Gas Production
Methanol Production
Methanol to Olefins
Natural Gas Coal Petroleum Residues
High Purity Ethylene
High Purity Propylene
13 13
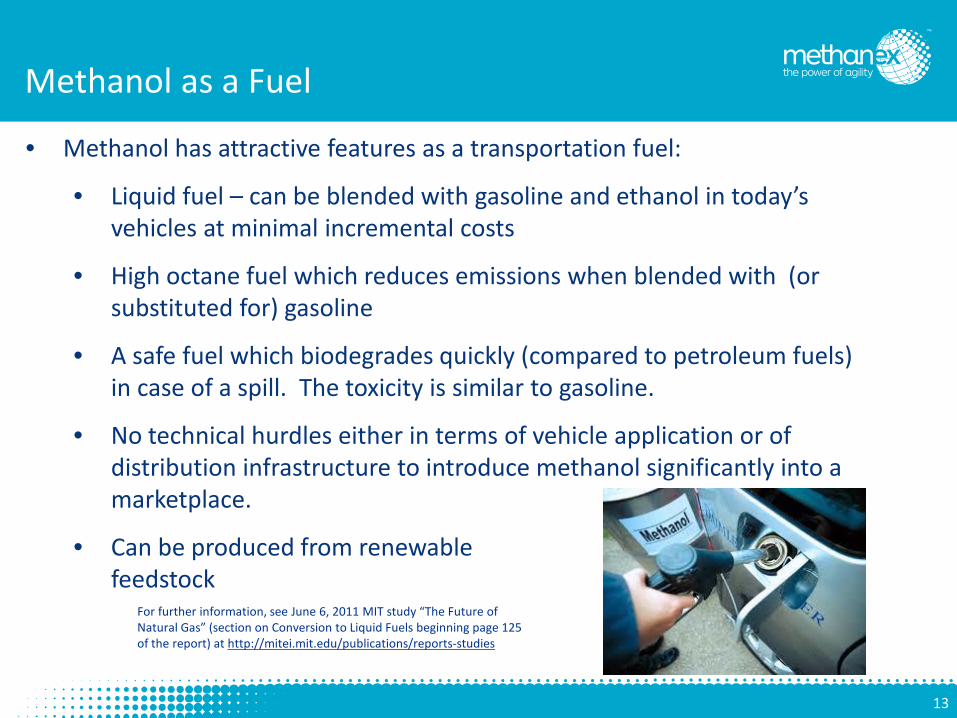
Methanol as a Fuel
• Methanol has attractive features as a transportation fuel:
• Liquid fuel – can be blended with gasoline and ethanol in today’s vehicles at minimal incremental costs
• High octane fuel which reduces emissions when blended with (or substituted for) gasoline
• A safe fuel which biodegrades quickly (compared to petroleum fuels) in case of a spill. The toxicity is similar to gasoline.
• No technical hurdles either in terms of vehicle application or of distribution infrastructure to introduce methanol significantly into a marketplace.
• Can be produced from renewable feedstock
For further information, see June 6, 2011 MIT study “The Future of Natural Gas” (section on Conversion to Liquid Fuels beginning page 125 of the report) at http://mitei.mit.edu/publications/reports-studies
14 14
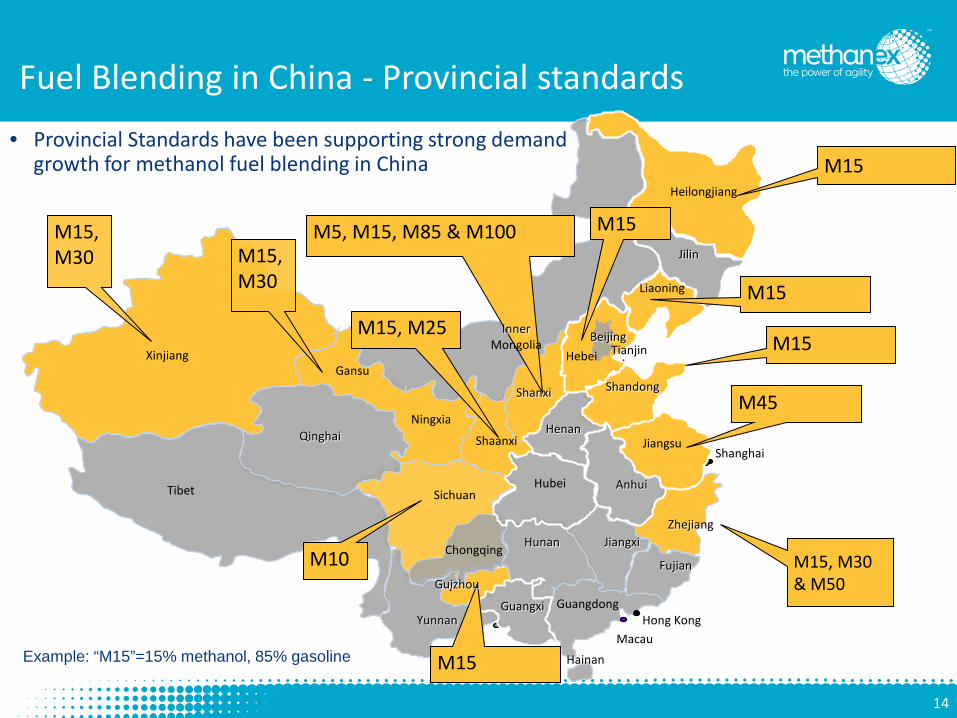
Fuel Blending in China - Provincial standards • Provincial Standards have been supporting strong demand
growth for methanol fuel blending in China
Xinjiang
Tibet
Gansu
Zhejiang Hunan Jiangxi
Guangdong Yunnan Hong Kong
Jiangsu
Sichuan
Fujian
Macau
Shanghai
Hainan
Ningxia
M15, M30 & M50
M15, M25
M45
M10 Chongqing
Shandong
Anhui
Jilin
Guangxi
Hubei
Heilongjiang
M5, M15, M85 & M100
Hebei Beijing Inner
Mongolia
Liaoning
M15
M15,M30
M15 M15,M30 M15
M15
Example: “M15”=15% methanol, 85% gasoline
M15
Qinghai Henan
Guizhou
Shaanxi
Shanxi
Tianjin
15 15
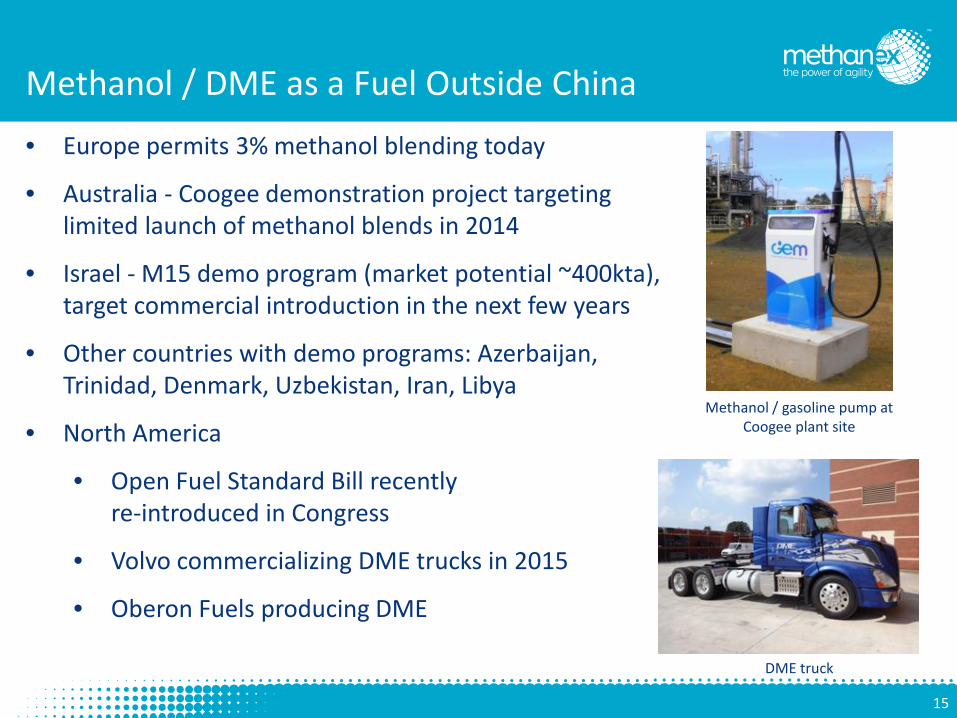
Methanol / DME as a Fuel Outside China
• Europe permits 3% methanol blending today
• Australia - Coogee demonstration project targeting limited launch of methanol blends in 2014
• Israel - M15 demo program (market potential ~400kta), target commercial introduction in the next few years
• Other countries with demo programs: Azerbaijan, Trinidad, Denmark, Uzbekistan, Iran, Libya
• North America
• Open Fuel Standard Bill recently re-introduced in Congress
• Volvo commercializing DME trucks in 2015
• Oberon Fuels producing DME
Methanol / gasoline pump at Coogee plant site
DME truck
16 16
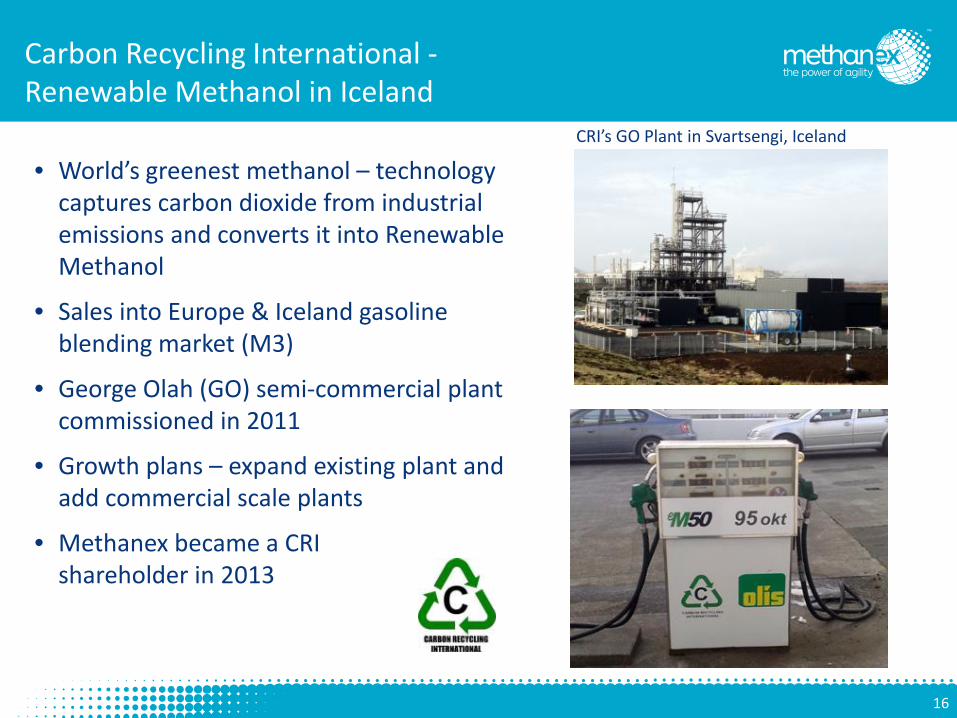
Carbon Recycling International - Renewable Methanol in Iceland
• World’s greenest methanol – technology captures carbon dioxide from industrial emissions and converts it into Renewable Methanol
• Sales into Europe & Iceland gasoline blending market (M3)
• George Olah (GO) semi-commercial plant commissioned in 2011
• Growth plans – expand existing plant and add commercial scale plants
• Methanex became a CRI shareholder in 2013
CRI’s GO Plant in Svartsengi, Iceland
17 17
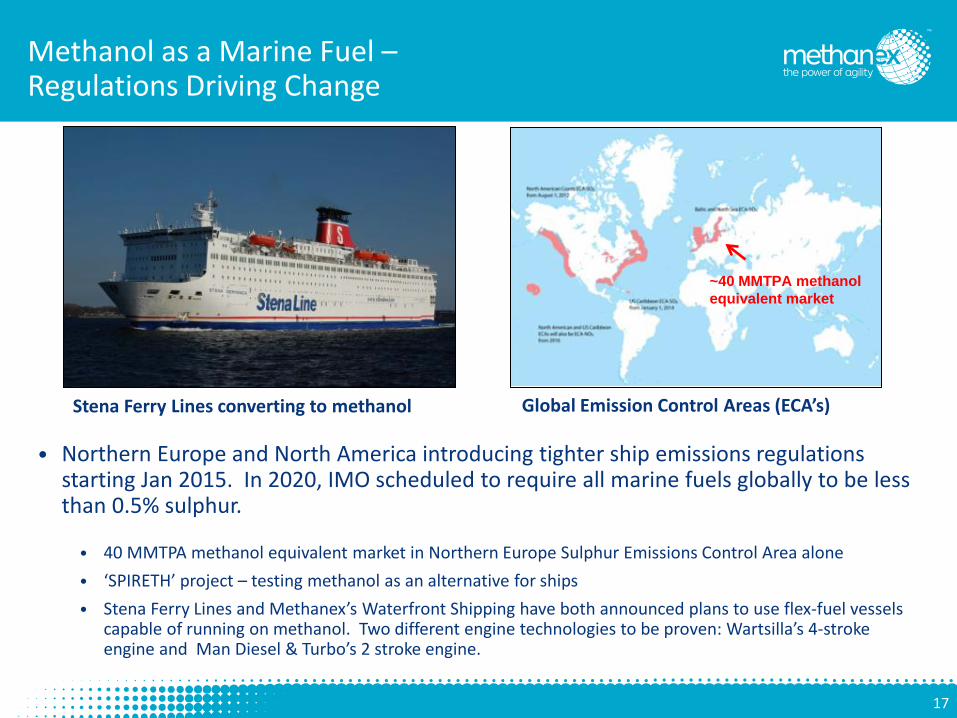
• Northern Europe and North America introducing tighter ship emissions regulations starting Jan 2015. In 2020, IMO scheduled to require all marine fuels globally to be less than 0.5% sulphur.
• 40 MMTPA methanol equivalent market in Northern Europe Sulphur Emissions Control Area alone • ‘SPIRETH’ project – testing methanol as an alternative for ships • Stena Ferry Lines and Methanex’s Waterfront Shipping have both announced plans to use flex-fuel vessels
capable of running on methanol. Two different engine technologies to be proven: Wartsilla’s 4-stroke engine and Man Diesel & Turbo’s 2 stroke engine.
Stena Ferry Lines converting to methanol
Methanol as a Marine Fuel – Regulations Driving Change
~40 MMTPA methanol equivalent market
Global Emission Control Areas (ECA’s)
18 18
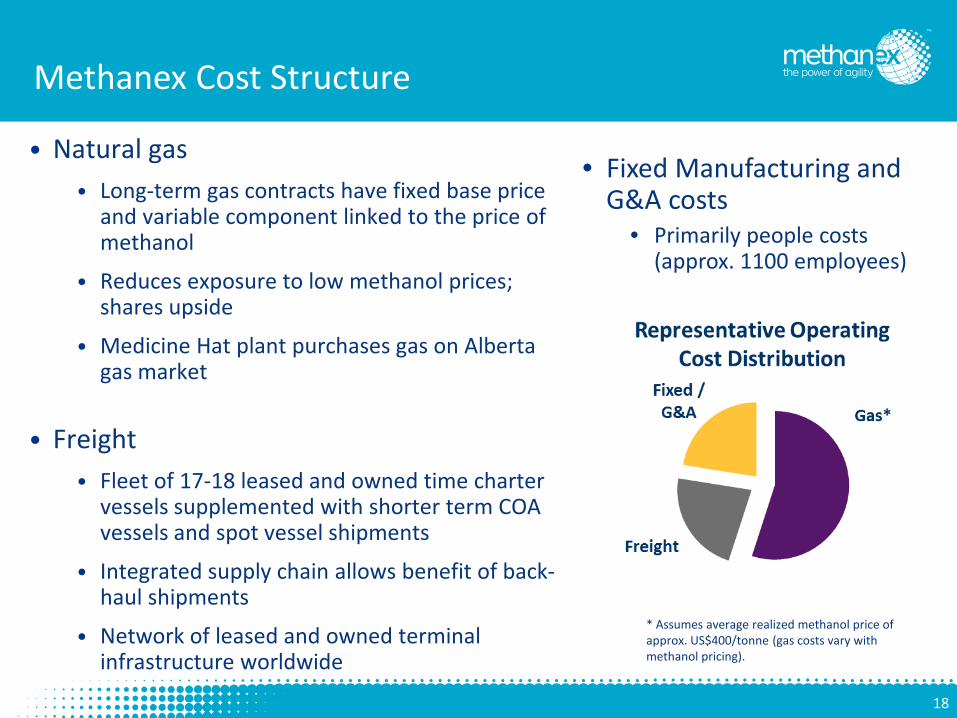
Methanex Cost Structure
• Fixed Manufacturing and G&A costs
• Primarily people costs (approx. 1100 employees)
* Assumes average realized methanol price of approx. US$400/tonne (gas costs vary with methanol pricing).
• Natural gas • Long-term gas contracts have fixed base price
and variable component linked to the price of methanol
• Reduces exposure to low methanol prices; shares upside
• Medicine Hat plant purchases gas on Alberta gas market
• Freight
• Fleet of 17-18 leased and owned time charter vessels supplemented with shorter term COA vessels and spot vessel shipments
• Integrated supply chain allows benefit of back-haul shipments
• Network of leased and owned terminal infrastructure worldwide
19 19
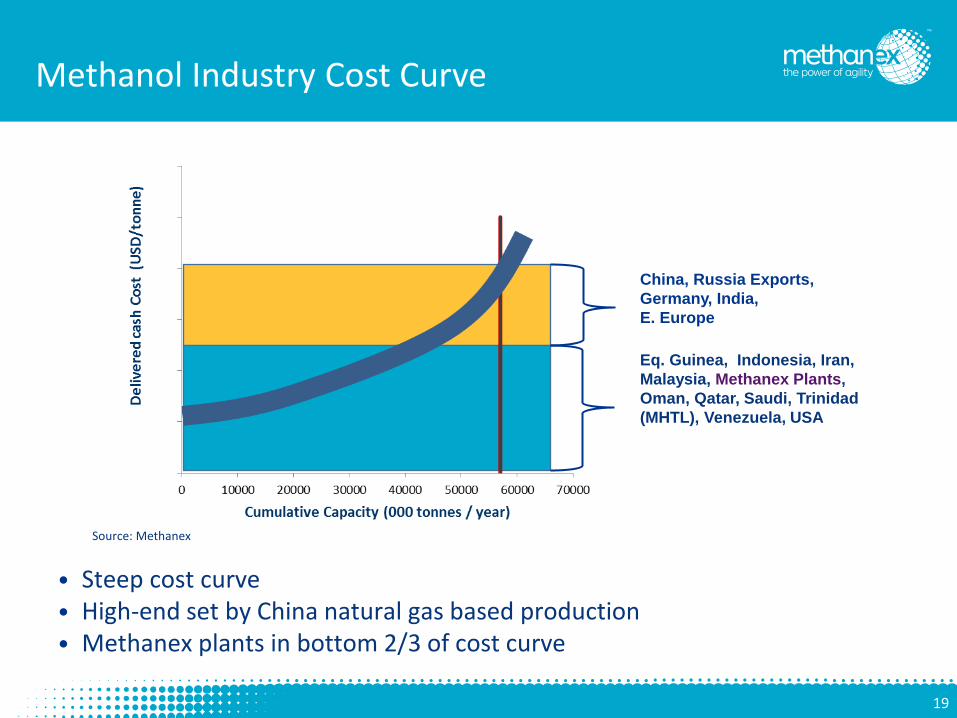
Methanol Industry Cost Curve
• Steep cost curve • High-end set by China natural gas based production • Methanex plants in bottom 2/3 of cost curve
China, Russia Exports, Germany, India, E. Europe
Eq. Guinea, Indonesia, Iran, Malaysia, Methanex Plants, Oman, Qatar, Saudi, Trinidad (MHTL), Venezuela, USA
Source: Methanex
20 20
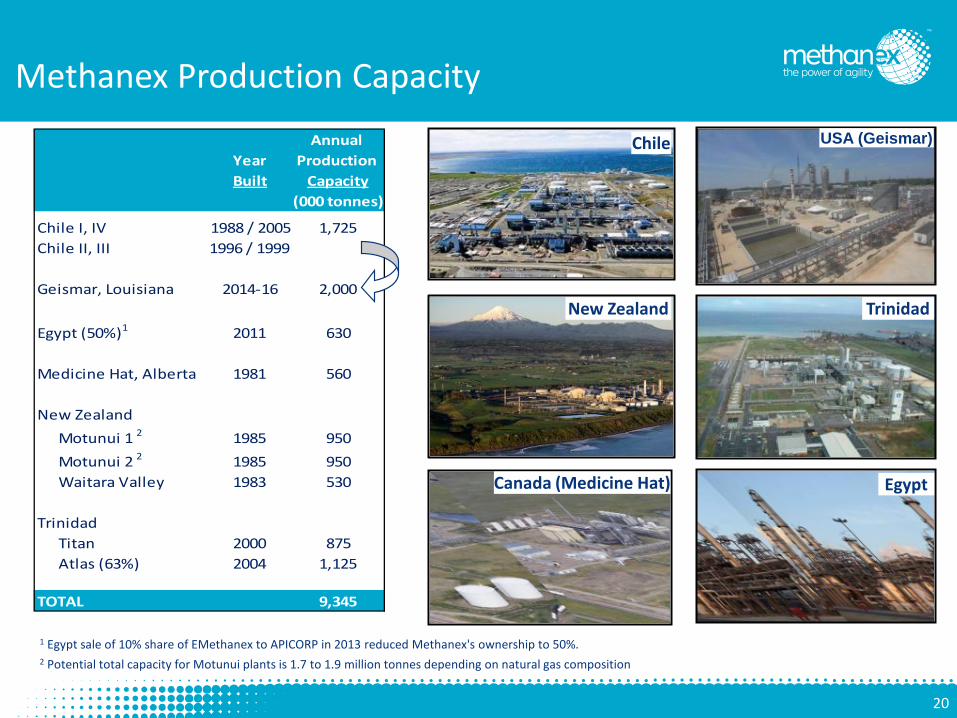
Methanex Production Capacity
Chile
Trinidad
USA (Geismar)
New Zealand
Canada (Medicine Hat) Egypt
1 Egypt sale of 10% share of EMethanex to APICORP in 2013 reduced Methanex's ownership to 50%. 2 Potential total capacity for Motunui plants is 1.7 to 1.9 million tonnes depending on natural gas composition
Annual Year Production Built Capacity
(000 tonnes)
Chile I, IV 1988 / 2005 1,725Chile II, III 1996 / 1999
Geismar, Louisiana 2014-16 2,000
Egypt (50%)1 2011 630
Medicine Hat, Alberta 1981 560
New ZealandMotunui 1 2 1985 950Motunui 2 2 1985 950Waitara Valley 1983 530
TrinidadTitan 2000 875Atlas (63%) 2004 1,125
TOTAL 9,345
21 21
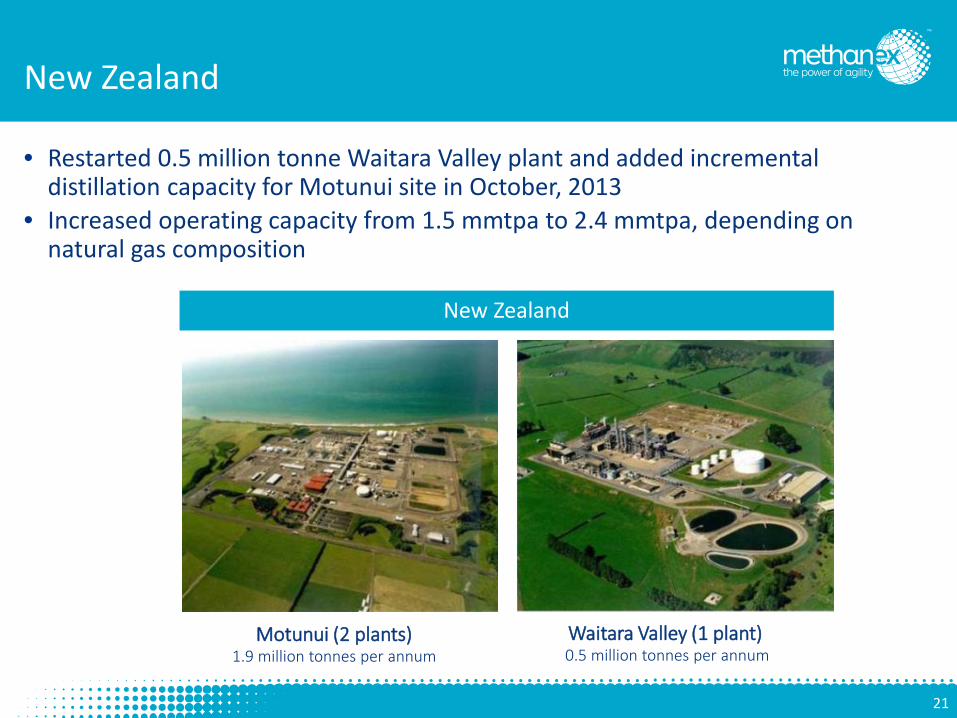
New Zealand
• Restarted 0.5 million tonne Waitara Valley plant and added incremental distillation capacity for Motunui site in October, 2013
• Increased operating capacity from 1.5 mmtpa to 2.4 mmtpa, depending on natural gas composition
Motunui (2 plants) 1.9 million tonnes per annum
Waitara Valley (1 plant) 0.5 million tonnes per annum
New Zealand
22 22
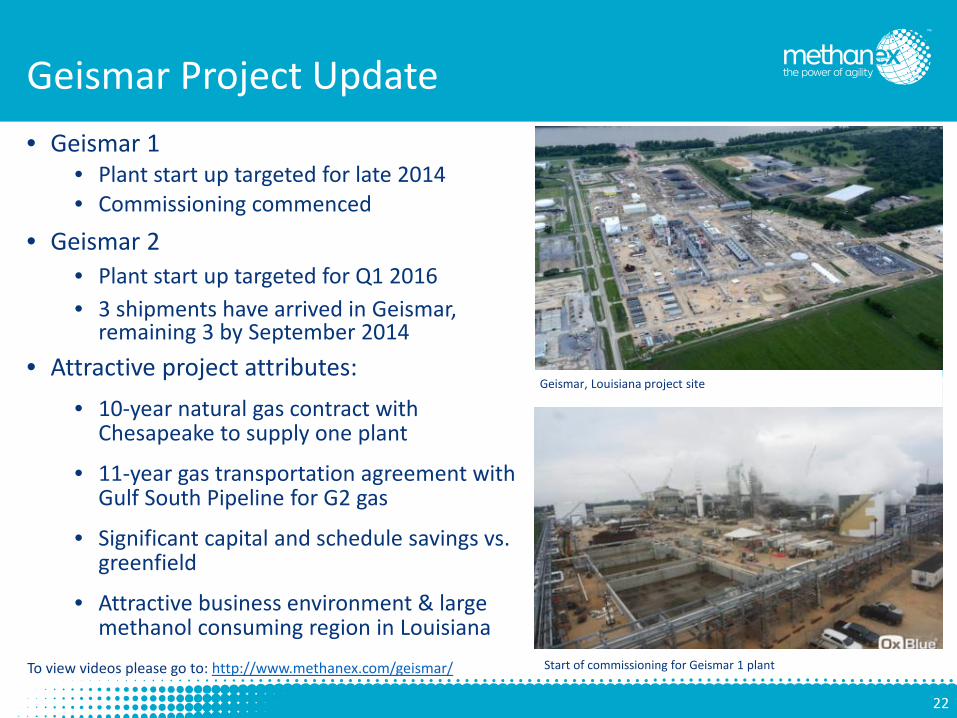
• Geismar 1 • Plant start up targeted for late 2014 • Commissioning commenced
• Geismar 2 • Plant start up targeted for Q1 2016 • 3 shipments have arrived in Geismar,
remaining 3 by September 2014 • Attractive project attributes:
• 10-year natural gas contract with Chesapeake to supply one plant
• 11-year gas transportation agreement with Gulf South Pipeline for G2 gas
• Significant capital and schedule savings vs. greenfield
• Attractive business environment & large methanol consuming region in Louisiana
To view videos please go to: http://www.methanex.com/geismar/
Geismar Project Update
Start of commissioning for Geismar 1 plant
Geismar, Louisiana project site
23 23
Chile – Potential Sources of Upside
• First prize: two-plant operation in Chile, supported by • Ongoing unconventional gas exploration and development in Chile • Argentina tolling arrangement • Argentina shale gas (EIA estimates over 500 tcf in the country)
• Chile IV relocation • Decision in the next 12 months • Issues to examine include Chile/Argentina gas prospects, capital costs increase
and securing pricing certainty for feedstock
• Settlement of legal disputes related to gas contracts • Reached settlement in May 2014 with Total Austral for $42 million to terminate
all remaining obligations under their gas supply agreement • Arbitration underway with one supplier of Argentinean non delivered gas
24 24
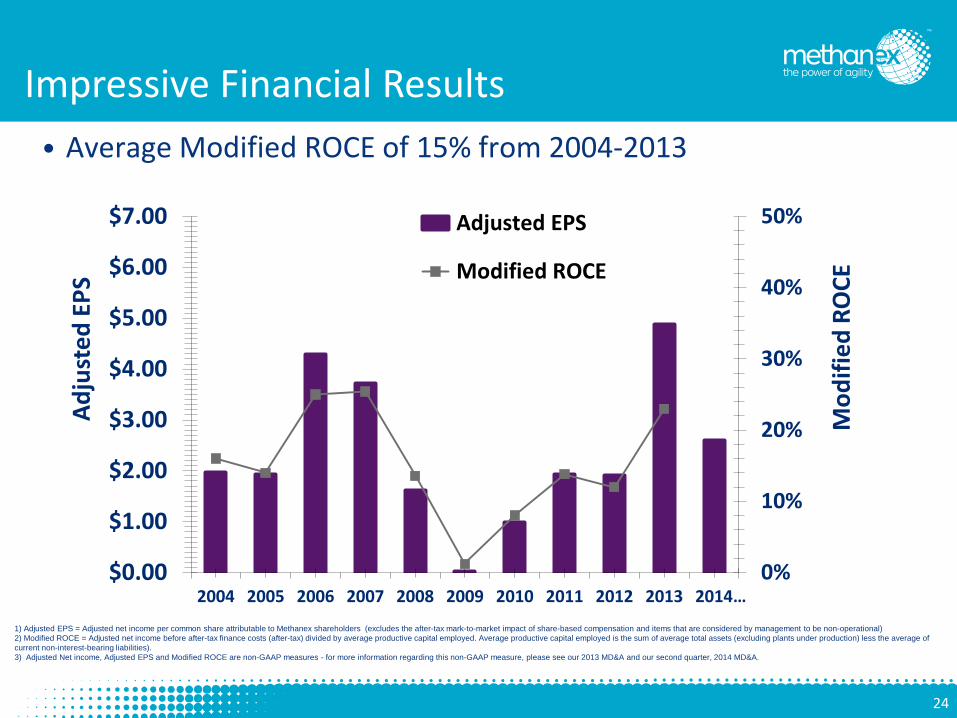
Impressive Financial Results
1) Adjusted EPS = Adjusted net income per common share attributable to Methanex shareholders (excludes the after-tax mark-to-market impact of share-based compensation and items that are considered by management to be non-operational) 2) Modified ROCE = Adjusted net income before after-tax finance costs (after-tax) divided by average productive capital employed. Average productive capital employed is the sum of average total assets (excluding plants under production) less the average of current non-interest-bearing liabilities). 3) Adjusted Net income, Adjusted EPS and Modified ROCE are non-GAAP measures - for more information regarding this non-GAAP measure, please see our 2013 MD&A and our second quarter, 2014 MD&A.
• Average Modified ROCE of 15% from 2004-2013
0%
10%
20%
30%
40%
50%
$0.00
$1.00
$2.00
$3.00
$4.00
$5.00
$6.00
$7.00
2004 2005 2006 2007 2008 2009 2010 2011 2012 2013 2014…
Mod
ified
RO
CE
Adju
sted
EPS
Adjusted EPS
Modified ROCE

25 25
Valuation Considerations
• Modest valuation relative to strong cash generation capability • Significant upside potential
(millions of tonnes) 1 With Growth FutureCurrent Initiatives Potential
Current Operating Capacity 6.0 6.0 6.0
Geismar 1 and 2 2.0 2.0
Chile Incremental Potential 1.3 Total 6.0 8.0 9.3
Approx. Annual EBITDA Capability (USD Billions)2
$350/tonne realized 0.6 0.9 1.1 Compared to $400/tonne realized 0.8 1.2 1.4 Current Enterprise$450/tonne realized 1.0 1.4 1.7 Value3 ~ $6.1 Billion
1 Methanex ownership interest2 EBITDA reflects Methanex's proportionate ownership interest and assumes plants operate at full production rates3 Based on US$60 share price and net debt adjusted for 50% interest in Egypt and 63.1% in Atlas
26 26
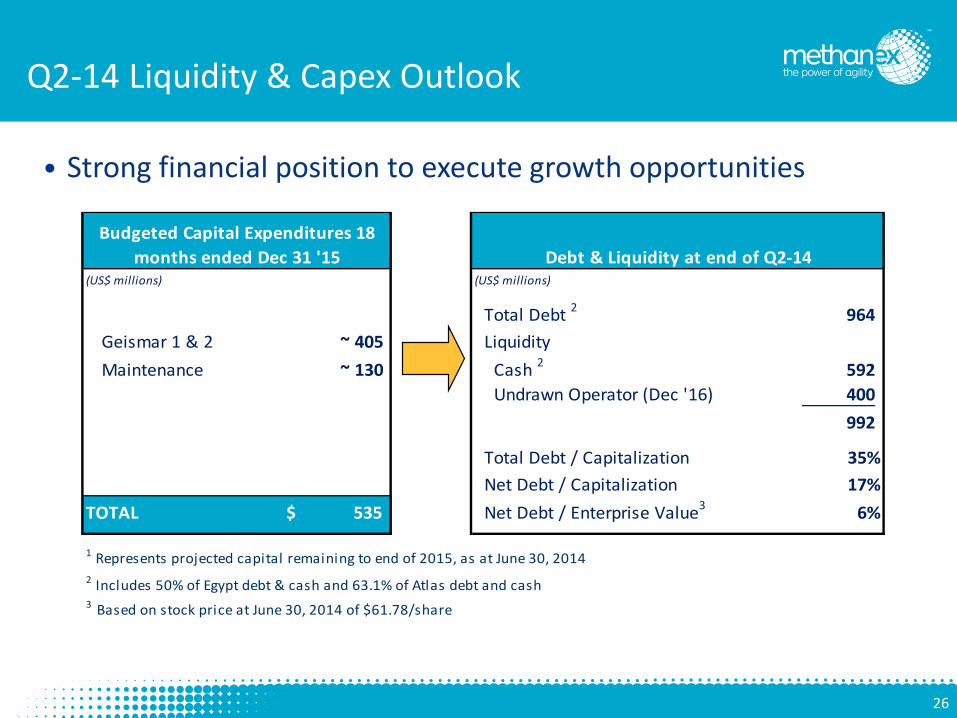
Q2-14 Liquidity & Capex Outlook
• Strong financial position to execute growth opportunities (US$ millions) (US$ millions)
Total Debt 2 964 Geismar 1 & 2 ~ 405 LiquidityMaintenance ~ 130 Cash 2 592
Undrawn Operator (Dec '16) 400 992
Total Debt / Capitalization 35% Net Debt / Capitalization 17%
TOTAL 535$ Net Debt / Enterprise Value3 6%
1 Represents projected capital remaining to end of 2015, as at June 30, 20142 Includes 50% of Egypt debt & cash and 63.1% of Atlas debt and cash3 Based on stock price at June 30, 2014 of $61.78/share
Budgeted Capital Expenditures 18 months ended Dec 31 '15 Debt & Liquidity at end of Q2-14
27 27
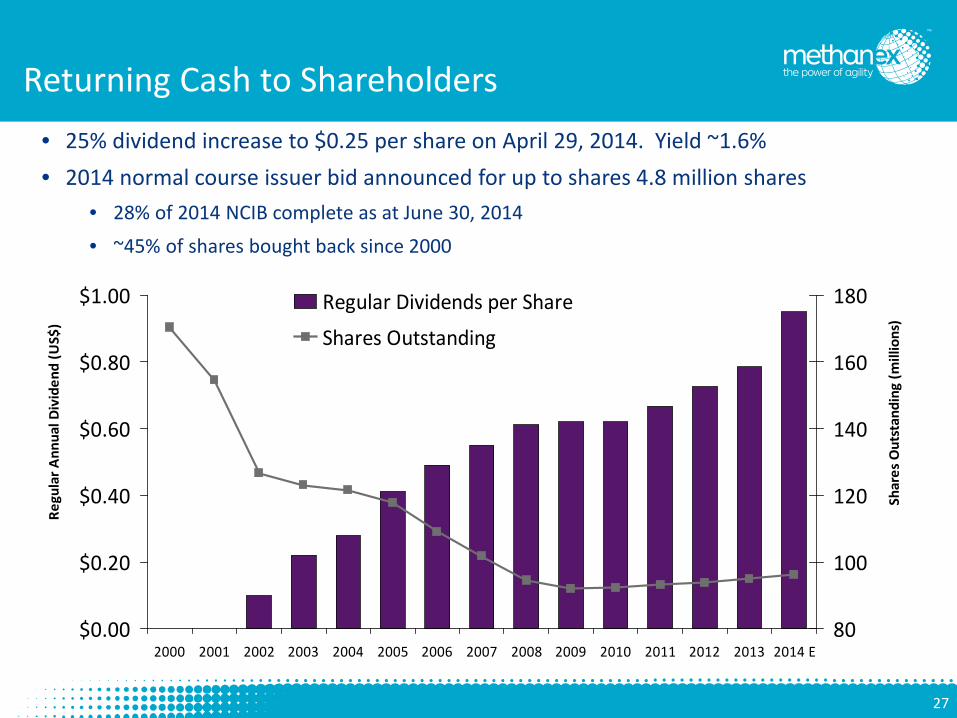
Returning Cash to Shareholders • 25% dividend increase to $0.25 per share on April 29, 2014. Yield ~1.6% • 2014 normal course issuer bid announced for up to shares 4.8 million shares
• 28% of 2014 NCIB complete as at June 30, 2014 • ~45% of shares bought back since 2000
$0.00
$0.20
$0.40
$0.60
$0.80
$1.00
2000 2001 2002 2003 2004 2005 2006 2007 2008 2009 2010 2011 2012 2013 2014 E
Regu
lar A
nnua
l Div
iden
d (U
S$)
80
100
120
140
160
180
Shar
es O
utst
andi
ng (m
illio
ns)
Regular Dividends per Share
Shares Outstanding
28 28
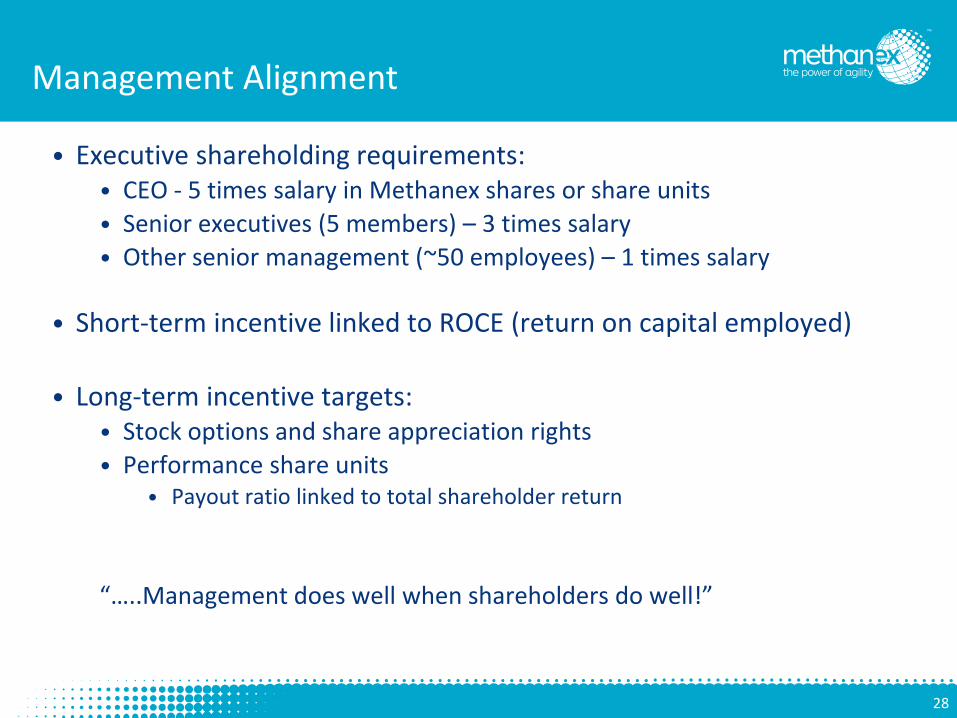
Management Alignment
• Executive shareholding requirements: • CEO - 5 times salary in Methanex shares or share units • Senior executives (5 members) – 3 times salary • Other senior management (~50 employees) – 1 times salary
• Short-term incentive linked to ROCE (return on capital employed)
• Long-term incentive targets:
• Stock options and share appreciation rights • Performance share units
• Payout ratio linked to total shareholder return
“…..Management does well when shareholders do well!”
29 29
Summary
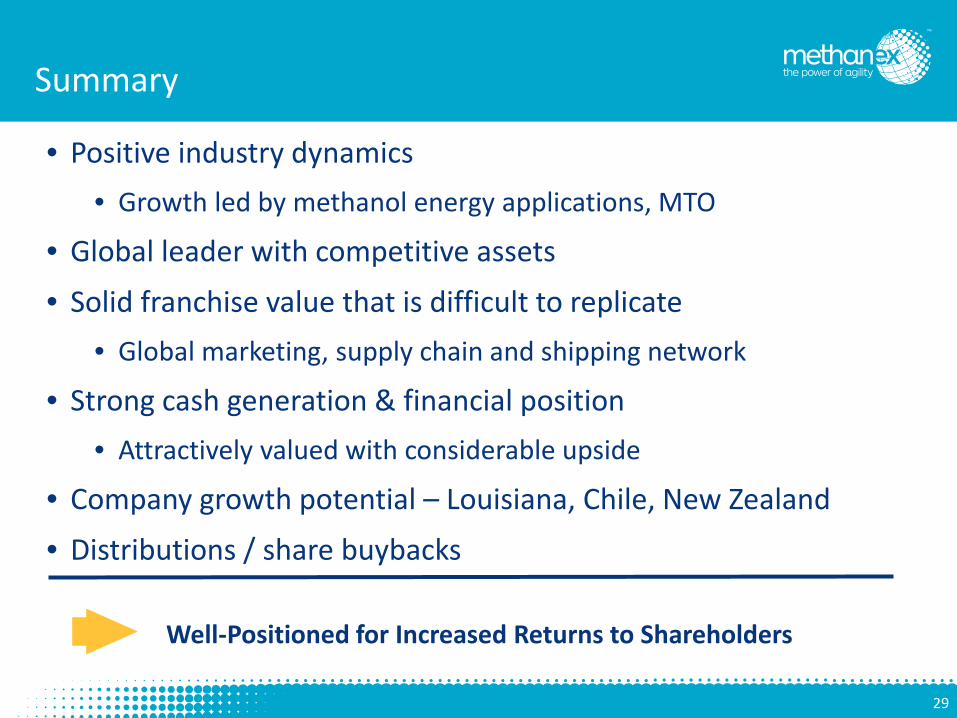
• Positive industry dynamics • Growth led by methanol energy applications, MTO
• Global leader with competitive assets
• Solid franchise value that is difficult to replicate • Global marketing, supply chain and shipping network
• Strong cash generation & financial position • Attractively valued with considerable upside
• Company growth potential – Louisiana, Chile, New Zealand
• Distributions / share buybacks Well-Positioned for Increased Returns to Shareholders

30 30
Q & A
31 31
Appendix
32 32
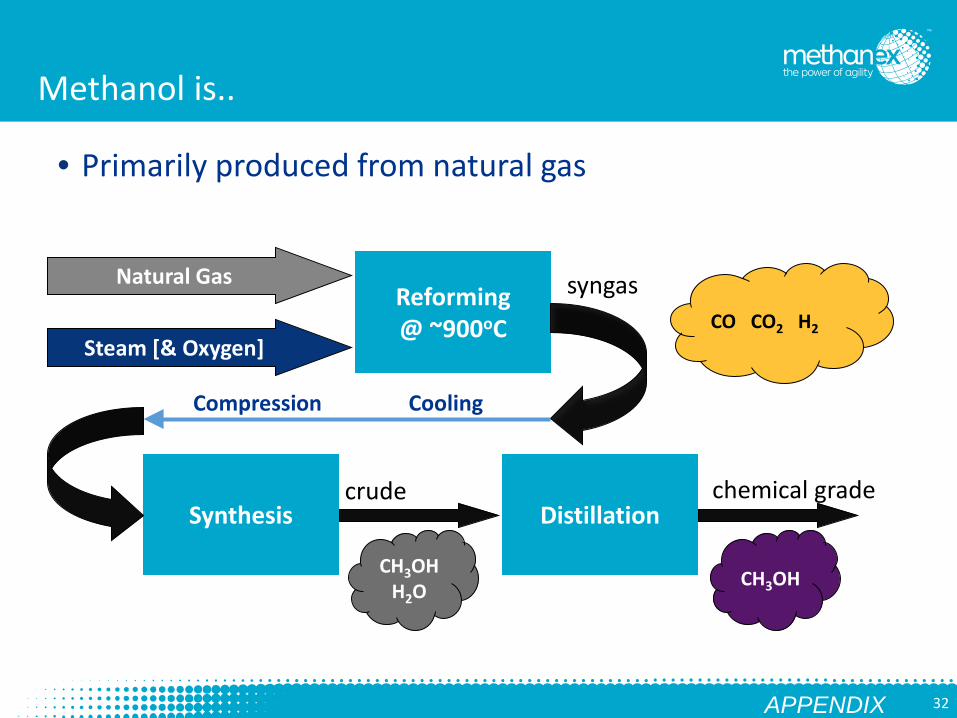
Methanol is..
• Primarily produced from natural gas
Reforming @ ~900oC
Distillation Synthesis
syngas
crude
CH3OH H2O
chemical grade
CH3OH
CO CO2 H2
Natural Gas
Steam [& Oxygen]
Cooling Compression
APPENDIX
33 33
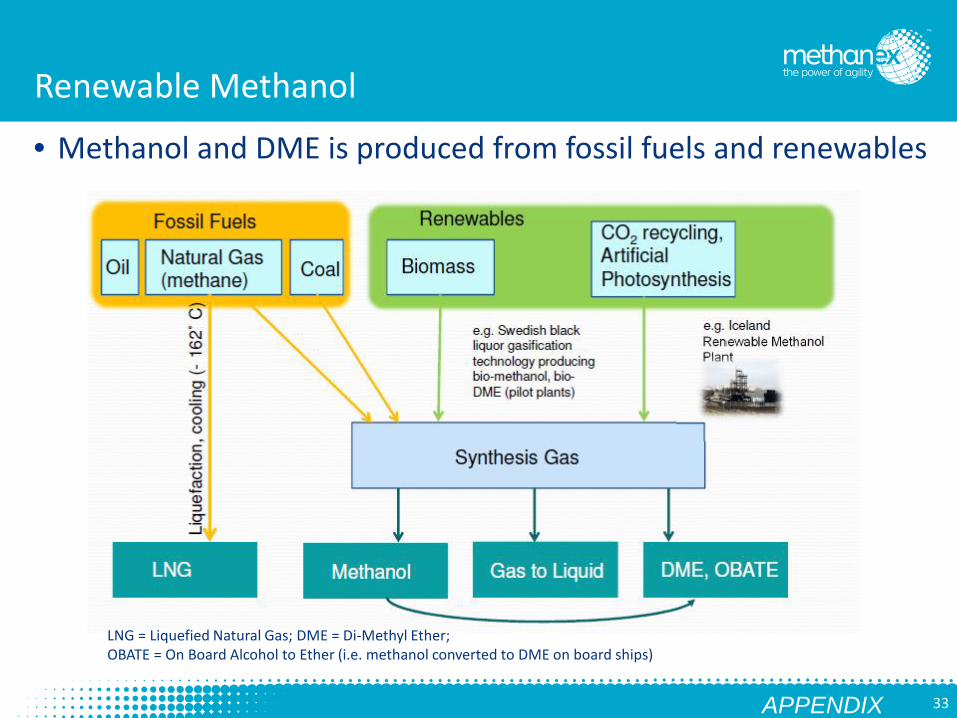
Renewable Methanol
• Methanol and DME is produced from fossil fuels and renewables
APPENDIX
LNG = Liquefied Natural Gas; DME = Di-Methyl Ether; OBATE = On Board Alcohol to Ether (i.e. methanol converted to DME on board ships)
34 34
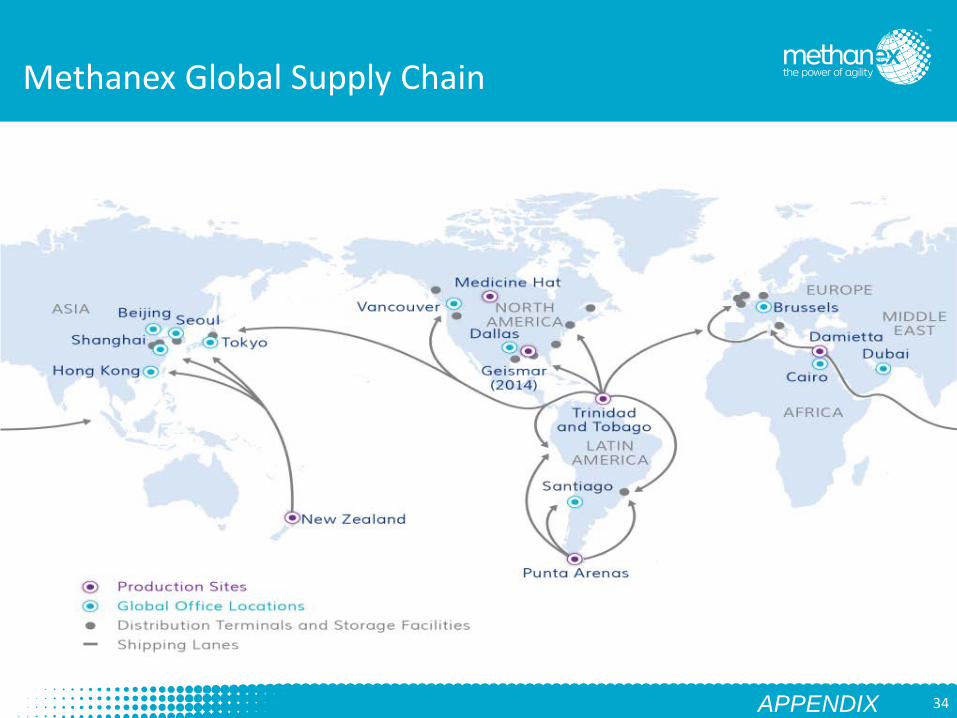
Methanex Global Supply Chain
APPENDIX
35 35
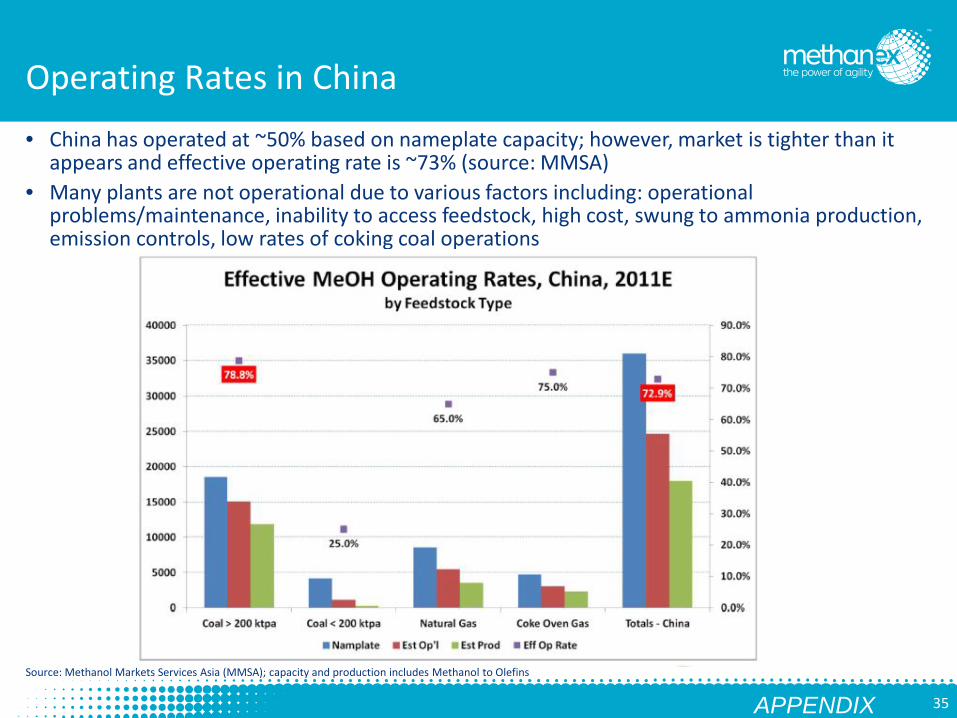
Operating Rates in China • China has operated at ~50% based on nameplate capacity; however, market is tighter than it
appears and effective operating rate is ~73% (source: MMSA) • Many plants are not operational due to various factors including: operational
problems/maintenance, inability to access feedstock, high cost, swung to ammonia production, emission controls, low rates of coking coal operations
Source: Methanol Markets Services Asia (MMSA); capacity and production includes Methanol to Olefins
APPENDIX
36 36
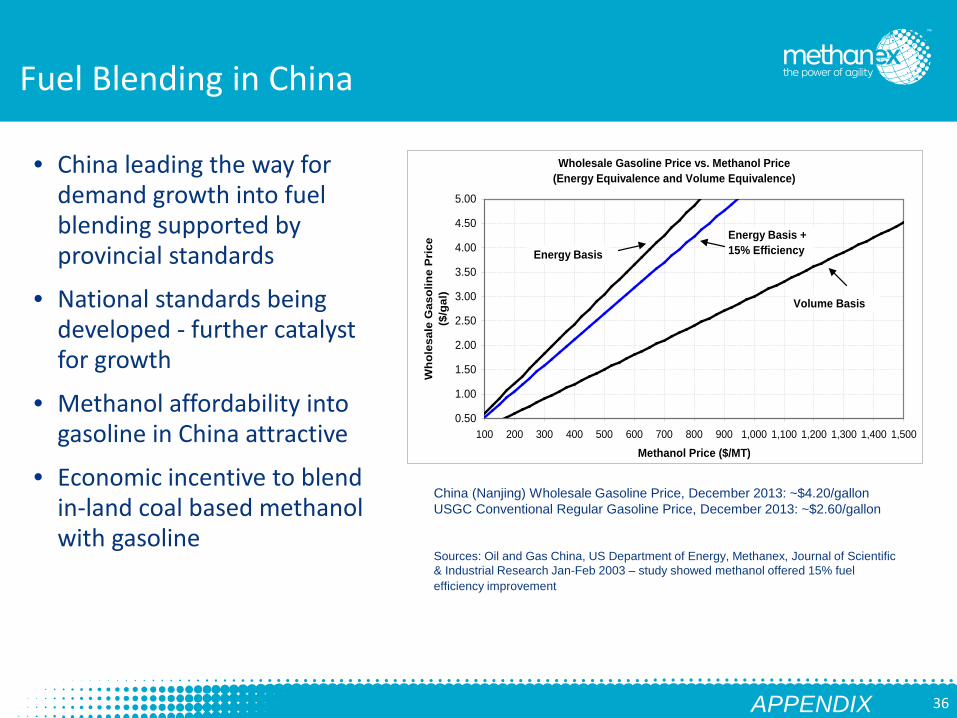
Fuel Blending in China
• China leading the way for demand growth into fuel blending supported by provincial standards
• National standards being developed - further catalyst for growth
• Methanol affordability into gasoline in China attractive
• Economic incentive to blend in-land coal based methanol with gasoline
China (Nanjing) Wholesale Gasoline Price, December 2013: ~$4.20/gallon USGC Conventional Regular Gasoline Price, December 2013: ~$2.60/gallon
Sources: Oil and Gas China, US Department of Energy, Methanex, Journal of Scientific & Industrial Research Jan-Feb 2003 – study showed methanol offered 15% fuel efficiency improvement
Wholesale Gasoline Price vs. Methanol Price(Energy Equivalence and Volume Equivalence)
0.50
1.00
1.50
2.00
2.50
3.00
3.50
4.00
4.50
5.00
100 200 300 400 500 600 700 800 900 1,000 1,100 1,200 1,300 1,400 1,500
Methanol Price ($/MT)
Who
lesa
le G
asol
ine
Pri
ce
($/g
al)
Energy Basis
Volume Basis
Energy Basis + 15% Efficiency
APPENDIX
37 37
FORWARD-LOOKING INFORMATION WARNING
This Presentation, the Second Quarter 2014 Management’s Discussion and Analysis (“MD&A”) and comments made during the Second Quarter 2014 investor conference call contain forward-looking statements with respect to us and our industry. These statements relate to future events or our future performance. All statements other than statements of historical fact are forward-looking statements. Statements that include the words “believes,” “expects,” “may,” “will,” “should,” “potential,” “estimates,” “anticipates,” “aim,” “goal” or other comparable terminology and similar statements of a future or forward-looking nature identify forward-looking statements.
More particularly and without limitation, any statements regarding the following are forward-looking statements: expected demand for methanol and its derivatives, expected new methanol supply or restart of idled capacity and timing for start-up of the same, expected shutdowns (either temporary or permanent) or restarts of existing methanol supply (including our own facilities), including, without limitation, the timing and length of planned maintenance outages, expected methanol and energy prices, expected levels of methanol purchases from traders or other third parties, expected levels, timing and availability of economically priced natural gas supply to each of our plants, capital committed by third parties towards future natural gas exploration and development in the vicinity of our plants, our expected capital expenditures, anticipated operating rates of our plants, expected operating costs, including natural gas feedstock costs and logistics costs, expected tax rates or resolutions to tax disputes, expected cash flows, earnings capability and share price, availability of committed credit facilities and other financing, ability to meet covenants or obtain or continue to obtain waivers associated with our long-term debt obligations, including, without limitation, the Egypt limited recourse debt facilities that have conditions associated with the payment of cash or other distributions and the finalization of certain land title registration and related mortgages that require action by Egyptian governmental entities, our shareholder distribution strategy and anticipated distributions to shareholders, commercial viability and timing of, or our ability to execute, future projects, plant restarts, capacity expansions, plant relocations, or other business initiatives or opportunities, including the planned relocation of idle Chile methanol plants to Geismar, Louisiana (“Geismar”), our financial strength and ability to meet future financial commitments, expected global or regional economic activity (including industrial production levels), expected outcomes of litigation or other disputes, claims and assessments, expected actions of governments, government agencies, gas suppliers, courts, tribunals or other third parties, and expected impact on our operations in Egypt or our financial condition as a consequence of civil unrest or actions taken or inaction by the Government of Egypt and its agencies.
We believe that we have a reasonable basis for making such forward-looking statements. The forward-looking statements in this document are based on our experience, our perception of trends, current conditions and expected future developments as well as other factors. Certain material factors or assumptions were applied in drawing the conclusions or making the forecasts or projections that are included in these forward-looking statements, including, without limitation, future expectations and assumptions concerning the following: the supply of, demand for and price of methanol, methanol derivatives, natural gas, coal, oil and oil derivatives, our ability to procure natural gas feedstock on commercially acceptable terms, operating rates of our facilities, receipt or issuance of third-party consents or approvals, including, without limitation, governmental registrations of land title and related mortgages in Egypt, governmental approvals related to rights to purchase natural gas, the establishment of new fuel standards, operating costs including natural gas feedstock and logistics costs, capital costs, tax rates, cash flows, foreign exchange rates and interest rates, the availability of committed credit facilities and other financing, timing of completion and cost of our Geismar project, global and regional economic activity (including industrial production levels), absence of a material negative impact from major natural disasters, absence of a material negative impact from changes in laws or regulations, absence of a material negative impact from political instability in the countries in which we operate, and enforcement of contractual arrangements and ability to perform contractual obligations by customers, natural gas and other suppliers and other third parties.
However, forward-looking statements, by their nature, involve risks and uncertainties that could cause actual results to differ materially from those contemplated by the forward-looking statements. The risks and uncertainties primarily include those attendant with producing and marketing methanol and successfully carrying out major capital expenditure projects in various jurisdictions, including, without limitation: conditions in the methanol and other industries including fluctuations in the supply, demand for and price of methanol and its derivatives, including demand for methanol for energy uses, the price of natural gas, coal, oil and oil derivatives, the success of natural gas exploration and development activities in southern Chile, our ability to obtain natural gas feedstock on commercially acceptable terms to underpin current operations and future production growth opportunities, the ability to successfully carry out corporate initiatives and strategies, actions of competitors, suppliers and financial institutions, conditions within the natural gas delivery systems that may prevent delivery of our natural gas supply requirements, our ability to meet timeline and budget targets for our Geismar project, including cost pressures arising from labour costs, competing demand for natural gas, especially with respect to domestic needs for gas and electricity in Chile and Egypt, actions of governments and governmental authorities, including, without limitation, the implementation of policies or other measures that could impact the supply of or demand for methanol or its derivatives, changes in laws or regulations, import or export restrictions, anti-dumping measures, increases in duties, taxes and government royalties, and other actions by governments that may adversely affect our operations or existing contractual arrangements, world-wide economic conditions, satisfaction of conditions precedent contained in the Geismar 1 natural gas supply agreement, and other risks described in our 2013 Management’s Discussion and Analysis and this Second Quarter 2014 Management’s Discussion and Analysis.
Having in mind these and other factors, investors and other readers are cautioned not to place undue reliance on forward-looking statements. They are not a substitute for the exercise of one’s own due diligence and judgment. The outcomes anticipated in forward-looking statements may not occur and we do not undertake to update forward-looking statements except as required by applicable securities laws.
Forward-looking Statements
Thank You


