Chemical Enginewring Science. Vol. 42. No. 8. pp. 1887-1898, 1987. 000%X09/87 $3.00 f0.00 Printed in Great Britain. 0 1987 Pergamon Journals Ltd. METHANOL SYNTHESIS IN A COUNTERCURRENT GAS-SOLID-SOLID TRICKLE FLOW REACTOR. AN EXPERIMENTAL STUDY M. KUCZYNSKI, M. H. OYEVAAR, R. T. PIETERS and K. R. WESTERTERPT Chemical Reaction Engineering Laboratories, Department of Chemical Engineering, Twente University of Technology, P.O. Box 217, 7500 AE Enschede, The Netherlands (Received 25 April 1986; accepted for publication 22 October 1986) Abstract-The synthesis of methanol from CO and H, was executed in a gas-solid-solid trickle Row reactor. The reactor consisted of three tubular reactor sections with cooling sections in between. The catalyst was Cu on alumina, the adsorbent was a silica-alumina powder and the experimental range 49&523 K, 5.%4.3 MPa and 0.2-0.33 molar fraction of CO. Complete conversion in one pass was achieved for stoichiometric feed rates, so that the gas outlet could be closed. The experimental results are compared with the model presented in the previous paper [Westerterp, K. R. and Kuczynski, M. (1987) Chem. Enyng Sci. 42,]; agreement is close over the entire conversion range from 15 “/, to 100 “4. 1. lNTRODUCTlON The methanol synthesis from carbon monoxide and hydrogen according to the following reaction: CO + 2H2 = CH,OH, -AH(298K) = 91 kJmol_’ (1) is one of the most important processes in the chemical industry. It also represents a widecategory of processes based on heterogeneously catalysed equilibrium gas reactions. In such processes, owing to thermodynamic limitations, only certain per-pass reactant conversions can be attained in the reactor units. To obtain a reasonable degree of reactant utilization in such a reactor unit it is common practice to introduce product separators and reactant recycle loops. This is a cumber- some and expensive technique (Westerterp and Kuczynski, 1986). In our laboratories a research pro- gramme has been started dealing with new processes based on gaseous equilibrium reactions in which high reactant conversions can be attained, so that the expensive reactant recycling can be reduced or even suppressed. The economical significance of such a process improvement is discussed elsewhere (Westerterp and Kuczynski, 1986). In this paper we report on our experimental study of the methanol synthesis in a countercurrent gas-solid-solid trickle Row reactor (GSSTFR). The principle of the GSSTFR is described in Westerterp and Kuczynski (1987). In fact, it is an extension of the gas-solid trickle flow (GSTF) principle, which has been investigated systematically by van Swaaij and co- workers (Roes, 1978; Roes and van Swaaij, 1979a-c; Verver, 1984; Noordergraaf et al., 198Oa-c). The most important aim of our study is to evaluate the technical feasibility of the GSSTFR for low-pressure methanol *Author to whom correspondence should be addressed. synthesis and to draw more general conclusions con- cerning its applicability to other equilibrium processes. The following aspects are of particular interest: (a) to examine whether complete conversion of the reactants can be achieved in a single-pass operation; (b) to study the influence of various process par- ameters on the behaviour of the reactor; and (c) to compare the experimental results obtained with the predictions of the mathematical reactor model presented in Westerterp and Kuczynski (1987). 2. EQUIPMENT AND CHEMICAL SYSTEM 2.1. The experimental system A small-scale reactor system was constructed for experimental purposes. It consisted of three tubular packed-bed reactor sections in series and with inter- mediate cooling, a continuously operable gas feed system, a semicontinuously operable solids feed system and an on-line gas chromatographic analytical system. The process flow scheme is given in Fig. 1. All parts were made of 325M stainless steel. 2.2. The reactor The reactor consisted of three vertical sections in series, 0.6, 0.6 and 0.55 m long (the upper being the shortest), having an inner diameter of 25 x lop3 m and an outer diameter of 60 x lo-’ m. To facilitate re- moval of a possible excess of heat, cooling sections as shown in Fig. 2 were installed between the reactor sections. Water or air could be used as the cooling medium in these cooling sections. The synthesis gas was fed into the lower end of the lower reactor section and the product gas was removed at the top of the upper section. Support grids to support the catalyst packing in the reactor tubes were installed at the top of the cooling sections, as can be seen in Fig. 2. For the lower reactor section, the support grid was placed at 1887 CES ‘12:8-B
Transcript
Chemical Enginewring Science. Vol. 42. No. 8. pp. 1887-1898, 1987. 000%X09/87 $3.00 f0.00 Printed in Great Britain. 0 1987 Pergamon Journals Ltd.
METHANOL SYNTHESIS IN A COUNTERCURRENT GAS-SOLID-SOLID TRICKLE FLOW REACTOR. AN
EXPERIMENTAL STUDY
M. KUCZYNSKI, M. H. OYEVAAR, R. T. PIETERS and K. R. WESTERTERPT Chemical Reaction Engineering Laboratories, Department of Chemical Engineering, Twente University of
Technology, P.O. Box 217, 7500 AE Enschede, The Netherlands
(Received 25 April 1986; accepted for publication 22 October 1986)
Abstract-The synthesis of methanol from CO and H, was executed in a gas-solid-solid trickle Row reactor. The reactor consisted of three tubular reactor sections with cooling sections in between. The catalyst was Cu on alumina, the adsorbent was a silica-alumina powder and the experimental range 49&523 K, 5.%4.3 MPa and 0.2-0.33 molar fraction of CO. Complete conversion in one pass was achieved for stoichiometric feed rates, so that the gas outlet could be closed. The experimental results are compared with the model presented in the previous paper [Westerterp, K. R. and Kuczynski, M. (1987) Chem. Enyng Sci. 42,]; agreement is close over the entire conversion range from 15 “/, to 100 “4.
1. lNTRODUCTlON
The methanol synthesis from carbon monoxide and hydrogen according to the following reaction:
CO + 2H2 = CH,OH, -AH(298K) = 91 kJmol_’ (1)
is one of the most important processes in the chemical industry. It also represents a widecategory of processes based on heterogeneously catalysed equilibrium gas reactions. In such processes, owing to thermodynamic limitations, only certain per-pass reactant conversions can be attained in the reactor units. To obtain a reasonable degree of reactant utilization in such a reactor unit it is common practice to introduce product separators and reactant recycle loops. This is a cumber- some and expensive technique (Westerterp and Kuczynski, 1986). In our laboratories a research pro- gramme has been started dealing with new processes based on gaseous equilibrium reactions in which high reactant conversions can be attained, so that the expensive reactant recycling can be reduced or even suppressed. The economical significance of such a process improvement is discussed elsewhere (Westerterp and Kuczynski, 1986).
In this paper we report on our experimental study of the methanol synthesis in a countercurrent gas-solid-solid trickle Row reactor (GSSTFR). The principle of the GSSTFR is described in Westerterp and Kuczynski (1987). In fact, it is an extension of the gas-solid trickle flow (GSTF) principle, which has been investigated systematically by van Swaaij and co- workers (Roes, 1978; Roes and van Swaaij, 1979a-c; Verver, 1984; Noordergraaf et al., 198Oa-c). The most important aim of our study is to evaluate the technical feasibility of the GSSTFR for low-pressure methanol
*Author to whom correspondence should be addressed.
synthesis and to draw more general conclusions con- cerning its applicability to other equilibrium processes. The following aspects are of particular interest:
(a) to examine whether complete conversion of the reactants can be achieved in a single-pass operation;
(b) to study the influence of various process par- ameters on the behaviour of the reactor; and
(c) to compare the experimental results obtained with the predictions of the mathematical reactor model presented in Westerterp and Kuczynski (1987).
2. EQUIPMENT AND CHEMICAL SYSTEM
2.1. The experimental system
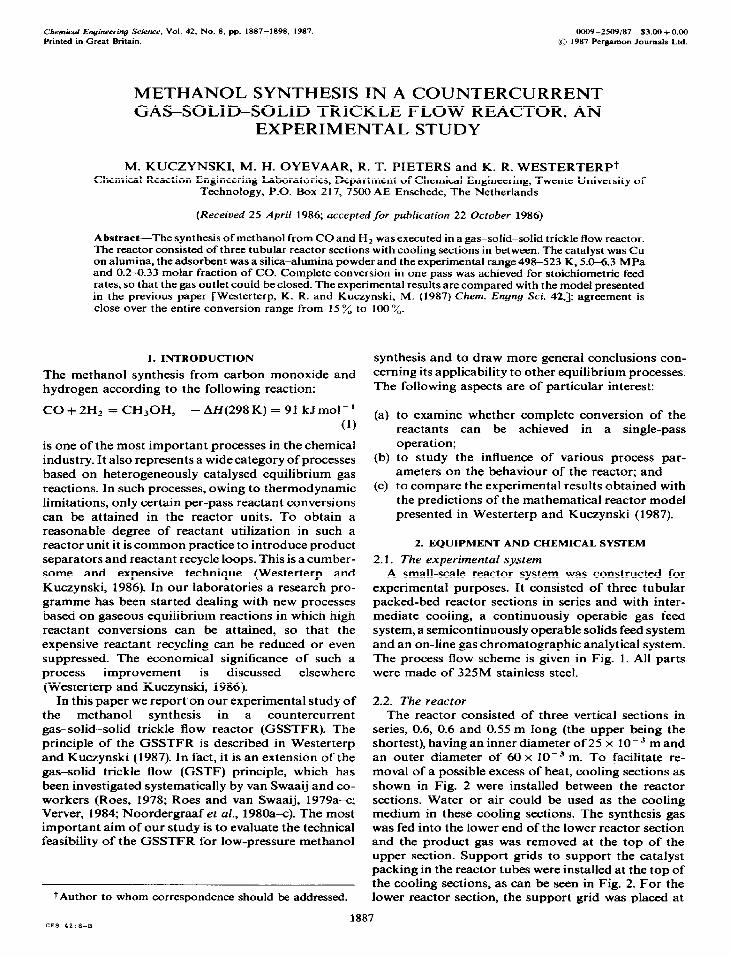
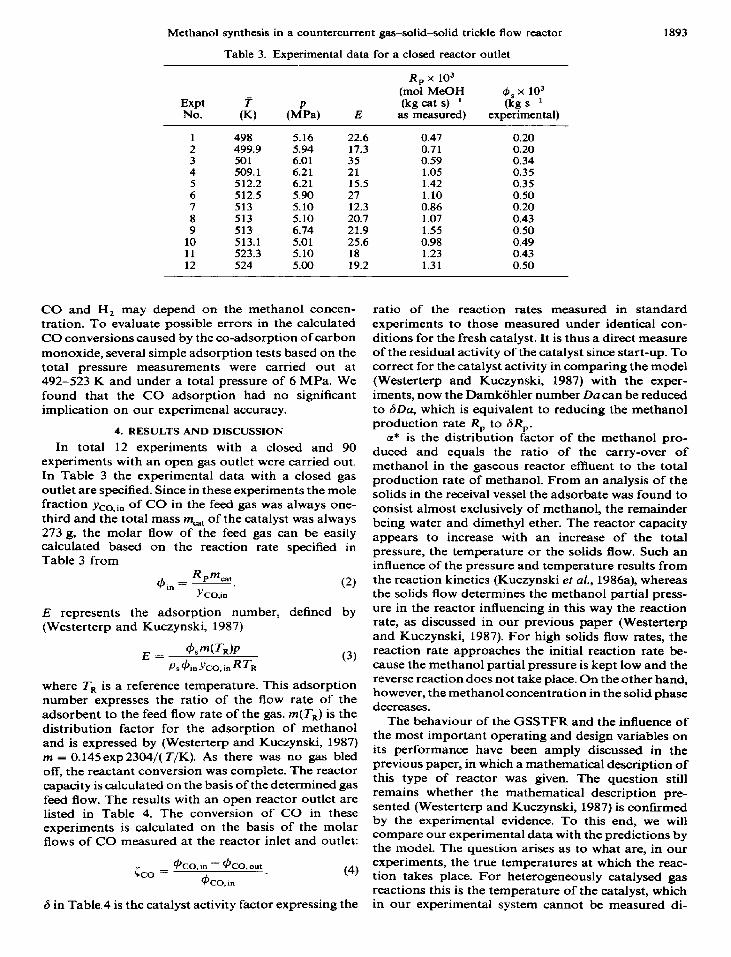
A small-scale reactor system was constructed for experimental purposes. It consisted of three tubular packed-bed reactor sections in series and with inter- mediate cooling, a continuously operable gas feed system, a semicontinuously operable solids feed system and an on-line gas chromatographic analytical system. The process flow scheme is given in Fig. 1. All parts were made of 325M stainless steel.
2.2. The reactor The reactor consisted of three vertical sections in
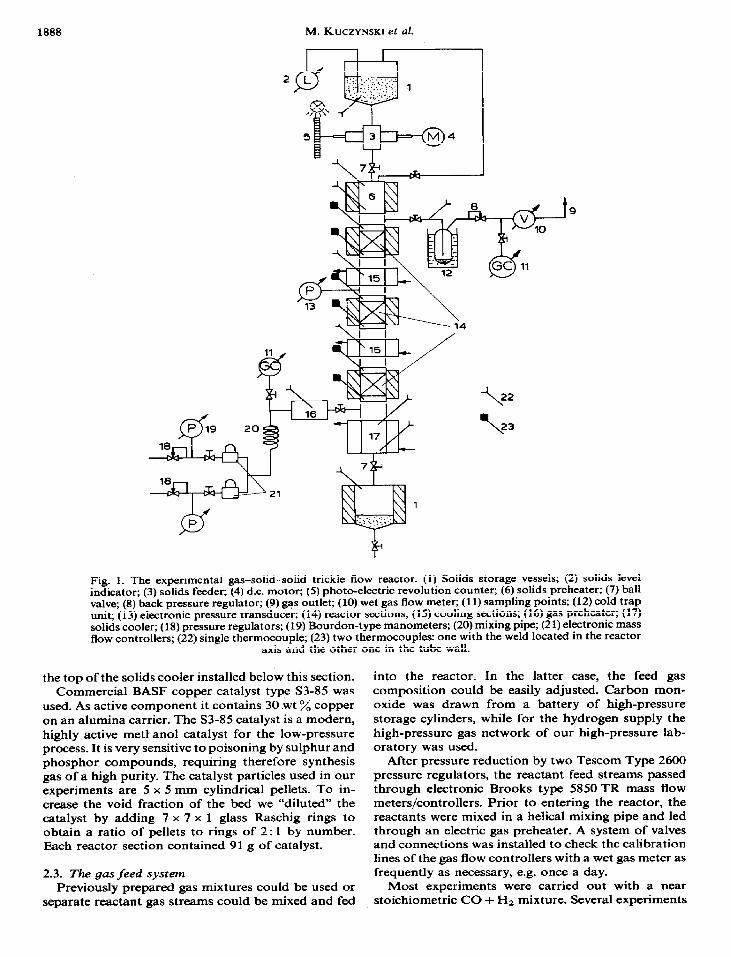
series, 0.6, 0.6 and 0.55 m long (the upper being the shortest), having an inner diameter of 25 x lop3 m and an outer diameter of 60 x lo-’ m. To facilitate re- moval of a possible excess of heat, cooling sections as shown in Fig. 2 were installed between the reactor sections. Water or air could be used as the cooling medium in these cooling sections. The synthesis gas was fed into the lower end of the lower reactor section and the product gas was removed at the top of the upper section. Support grids to support the catalyst packing in the reactor tubes were installed at the top of the cooling sections, as can be seen in Fig. 2. For the lower reactor section, the support grid was placed at
1887 CES ‘12:8-B
1888 M. KUCZYNSKI et al.
Fig. 1. The experimental gas-solid-solid trickle flow reactor. (1) Solids storage vessels; (2) solids level indicator; (3) solids feeder; (4) d.c. motor; (5) photo-electric revolution counter; (6) solids preheater: (7) ball valve; (8) back pressure regulator; (9) gas outlet; (10) wet gas flow meter; (11) sampling points; (12) cold trap unit; (13) electronic pressure transducer; (14) reactor sections; (15) cooling sections; (16) gas preheater; (17) solids cooler; (18) pressure regulators; (19) Bourdon-type manometers; (20) mixing pipe; (21) electronic mass flow controllers; (22) single thermocouple; (23) two thermocouples: one with the weld located in the reactor
axis and the other one in the tube wall.
the top of the solids cooler installed below this section. Commercial BASF copper catalyst type S3-85 was
used. As active component it contains 30 wt o/0 copper on an alumina carrier. The S3-85 catalyst is a modern, highly active medanol catalyst for the low-pressure process. It is very sensitive to poisoning by sulphur and phosphor compounds, requiring therefore synthesis gas of a high purity. The catalyst particles used in our experiments are 5 x 5 mm cylindrical pellets. To in- crease the void fraction of the bed we “diluted” the catalyst by adding 7 x 7 x 1 glass Raschig rings to obtain a ratio of pellets to rings of 2: 1 by number. Each reactor section contained 91 g of catalyst.
2.3. The gas feed system
Previously prepared gas mixtures could be used or separate reactant gas streams could be mixed and fed
into the reactor. In the latter case, the feed gas composition could be easily adjusted. Carbon mon- oxide was drawn from a battery of high-pressure storage cylinders, while for the hydrogen supply the high-pressure gas network of our high-pressure lab- oratory was used.
After pressure reduction by two Tescom Type 2600 pressure regulators, the reactant feed streams passed through electronic Brooks type 5850TR mass flow meters/controllers. Prior to entering the reactor, the reactants were mixed in a helical mixing pipe and led through an electric gas preheater. A system of valves and connections was installed to check the calibration lines of the gas flow controllers with a wet gas meter as frequently as necessary, e.g. once a day.
Most experiments were carried out with a near stoichiometric CO + Hz mixture. Several experiments
Methanol synthesis in a countercurrent gas-solid-solid trickle flow reactor 1889
Fig. 2. Construction details of the cooling section line. The connections and flanges to the reactor sections are also shown. (1) Cooling medium ports; (2) reactor tubes; (3) thermocouples; (4) catalyst support grid.
were also done with an excess of hydrogen. The feed gas was free of carbon dioxide. The manufacturer’s specifications (Hoek Loos) of the reactant gases are given in TabIe 1.
2.4. The gas outlet The product gas left the reactor at the top of the
upper reactor section. A Tescom model 1700 back pressure controller was installed at the gas outlet to control the total pressure in the reactor. A cold-trap vessel with a volume of 150 x lo- 6 m3 was installed just before the pressure controller to remove con- densable components from the gaseous reactor ef-
fluent to prevent their condensing in the piping downstream. The rate of condensation could be de- termined by weighing the condensate accumulated during a known period of time. The dry eEluent gas flow was measured by means of a wet-gas meter. Speoial care was taken to prevent condensation of methanol in the reactor in cold spots by installing additional electric heaters.
2.5. The solids feed system The reactor was equipped with two storage vessels
for the adsorbent supply and receival, respectively; the large capacity of these vessels enabled us to execute
Table 1. Volumetric composition of the feed gases. Manufacturer’s specifications
Component Hydro- gas co HZ 02 N2 co2 Ar carbons J320
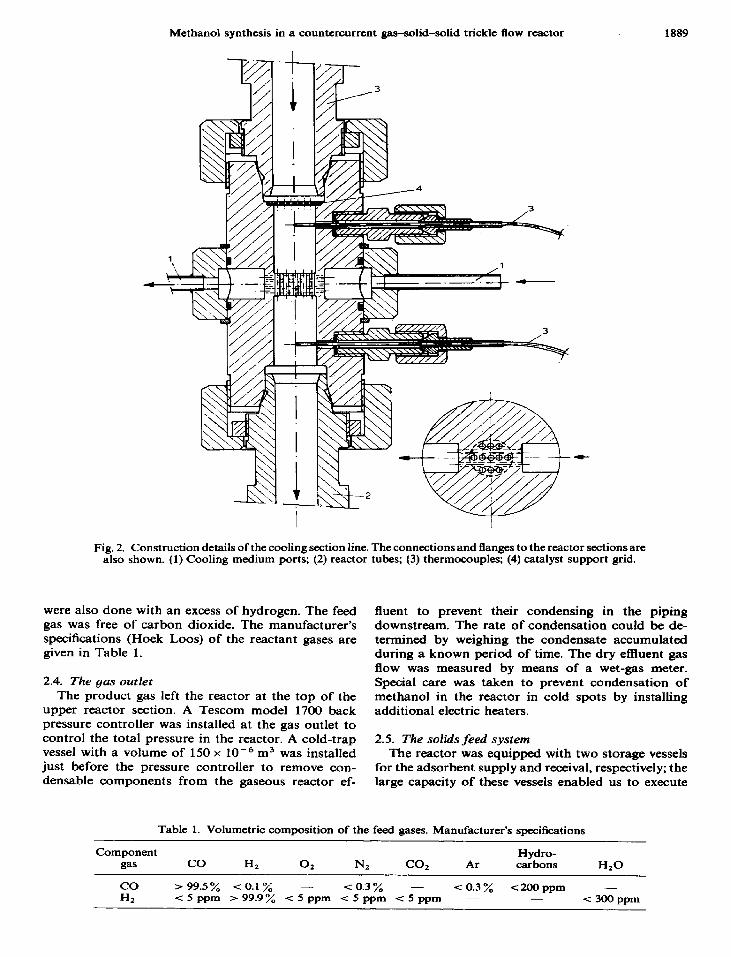
experiments of a long duration without operating a cumbersome high-pressure solids recycling system. The storage vessels could contain 10 kg of the solid and enabled us to maintain a constant flow of solids for 420 h, depending on the operating conditions chosen. The upper vessel was equipped with an Endress & Hauser electronic level meter. The powder was con- tinuously fed into the reactor by a special solids feeder (Fig. 3). The solids feeder was calibrated prior to the experiments.
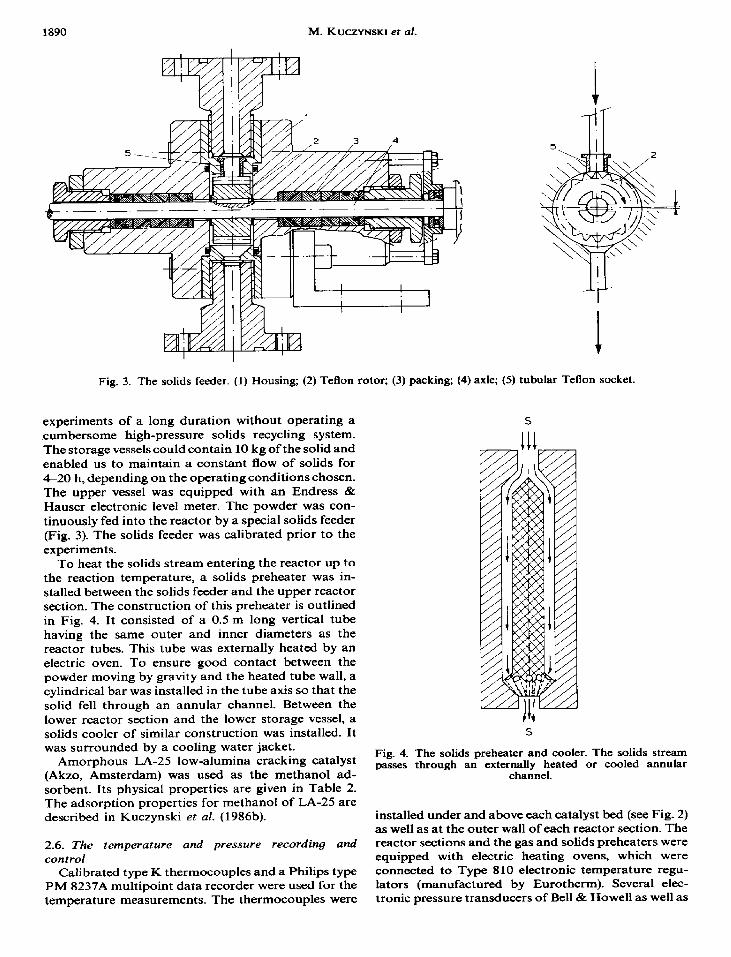
To heat the solids stream entering the reactor up to the reaction temperature, a solids preheater was in- stalled between the solids feeder and the upper reactor section. The construction of this preheater is outlined in Fig. 4. It consisted of a 0.5 m long vertical tube having the same outer and inner diameters as the reactor tubes. This tube was externally heated by an electric oven. To ensure good contact between the powder moving by gravity and the heated tube wall, a cylindrical bar was installed in the tube axis so that the solid fell through an annular channel. Between the lower reactor section and the lower storage vessel, a solids cooler of similar construction was installed. It was surrounded by a cooling water jacket.
Amorphous LA-25 low-alumina cracking catalyst (Akzo, Amsterdam) was used as the methanol ad- sorbent. Its physical properties are given in Table 2. The adsorption properties for methanol of LA-25 are described in Kuczynski et al. (1986b).
2.6. The temperature and pressure recording and
control Calibrated type K thermocouples and a Philips type
PM 8237A multipoint data recorder were used for the temperature measurements. The thermocouples were
Fig. 4. The solids preheater and cooler. The solids stream passes through an externally heated or cooled annular
channel.
installed under and above each catalyst bed (see Fig. 2) as well as at the outer wall of each reactor section. The reactor sections and the gas and solids preheaters were equipped with electric heating ovens, which were connected to Type 810 electronic temperature regu- lators (manufactured by Eurotherm). Several elec- tronic pressure transducers of Bell & Howell as well as
Methanol synthesis in a countercurrent gas-solid-solid trickle flow reactor 1891
Table 2. Properties of the methanol adsorbent
Composition: 87 wt % SiO,, 13 wt “/d AIZO. Mean particle diameter: ca. 90x lOwe m Skeletal density: 2200 kgm-” Particle density: 813 kgm-’
Particle diameter distribution Diameter Gm) wt% Cum. wt%
Bourdon type gauges of Econosto were installed for pressure measurements, as shown in Fig. 1.
2.7. Gas analysis A Varian series 3770 gas chromatograph with a
thermal conductivity detector and an automatic sam- pling valve were used for the analysis of the feed and product gases. The sampling valve was coupled to a Hewlett-Packard 3390A integrator and a Hewlett-Packard 19400A sample/event unit, so that on-line operation was possible. Hydrogen was used as carrier gas. The gas streams could be sampled continu- ously by means of an automatically controlled Watson-Marlow peristaltic pump, either at the bottom or at the top of the reactor. A l/S” diameter and 1.5 m long Porapak-Q column was used for the analysis. The detector was found to be linear for carbon monoxide, methanol, water and dimethyl ether in the concentration ranges of interest. The calibration lines were checked prior to each experimental run, using calibrated gas mixtures.
The chemicals used for the calibration of the GC were of the following qualities: CO and Hz as speci- fied in Table 1, methanol >99.95 “/, (from Merck), dimethyl ether z=- 99 vol.% (from Hoek Loos).
2.8. Initial testing, calibration and start-up The individual pieces of equipment were tested for
leaks using hydrogen at a pressure of 12 MPa. The solids feeder, the solids level meter and the pressure gauges were then tested and calibrated.
2.9. Catalyst activation The catalyst was reduced according to the
manufacturer’s instructions. The reactor was filled with catalyst and then first rinsed with nitrogen containing 2 vol. o/0 hydrogen and heated slowly up to 453 K in a period of 3 h. Subsequently the heating up was con- tinuedatarateof5Kh-‘,upto513K_Atthesame time, the H, content in the feed gas was gradually increased up to 20 vol.% at 513 K. The rinsing was then continued unti1 water was no longer detected in the reactor effluent. After the catalyst reduction the feed was switched to a synthesis gas containing 20
vol. 0/0 CO and 80 vol. o/0 H,; with this feed, the reactor was kept at 513 K and 6 MPa for 72 h to enable the catalyst to attain a stable activity level. This was followed by frequent analysis of the reaction product. The catalyst was considered to be stable if under stable operating conditions in a period of 24 h the conversion did not change.
2.10. Experimental dificulties during start-up The majority of the mechanical problems en-
countered related to the solids feeder, in particular clogging with powder and damage to the rotor. After numerous changes, the final solution was obtained with a rotor made of Teflon installed eccentrically in a cylindrical chamber, as shown in Fig. 3.Also the shape of the inlet channel to the rotor was found to be very important.
3. EXPERIMENTAL
3.1. Typical experiments Two slightly different experimental procedures were
followed depending on whether or not complete reactant conversion was desired. The preparation, the start-up procedure and the method of analysis of the solids were the same in both cases.
Prior to the filling of the upper storage tank with adsorbent, the installation was depressurized under rinsing with hydrogen. The powder was previously dried by keeping it for 48 h under vacuum at 553 K. After that the entire installation and specially the storage vessel was rinsed radically by pressurizing it with hydrogen up to a pressure of 1 MPa and then expanding it to atmospheric pressure again, repeating this procedure five times.
During the solids regeneration, care was taken to conduct the desorption procedure always under the same conditions (48 h at 553 K) and to minimize the time of exposure of the dried powder to the atmos- phere during the filling. The same powder charge was used in all the experiments during a period of 12 months.
For quantitative evaluation of a possible catalyst degradation, CO conversion experiments were frequently carried out with the solids feed system
turned off. In this way, data were also gathered allowing a direct evaluation of the influence of the solids stream on the reactor performance.
3.2. Experiments with an open gas outlet To start an experiment, the required flows and
composition of the feed gas were adjusted with the gas
flow controllers, wheras the total pressure was set using
the back pressure controller at the reactor outlet. After
the gas flow and the gas composition at the reactor
outlet became steady (14 h depending on the feed flow
and the reactor temperature), the methanol production
rate was determined. Then the adsorbent supply was started at the required flow. After a steady state was reached, the flow and composition of the product gas, as well as the methanol condensation rate in the cold- trap unit, were measured again. After the experiment, a
1892 M. KUCZYNSKI et al.
solids sample could be taken from the lower storage tank and analysed. During the experiments, both the lower and upper solids storage tanks were maintained at room temperature.
3.3. Experiments with a closed gas outlet Before the experiment, the entire apparatus was first
rinsed with hydrogen and then pressurized with a stoichiometric CO/H, mixture. After the solids feed was turned on, the pressure in the reactor started to decrease due to the methanol adsorption. Then the pressure was kept constant by feeding synthesis gas and the gas flow necessary to maintain the pressure was determined. Again the solids could be sampled from the lower storage tank.
3.4. Checking the material balance by analysis of the solids
To check the overall material balance, an analysis of the solids had to be made. To this end, a simple glass apparatus as shown in Fig. 5 was used. After a run with the GSSTFR, a solids sample was taken from the lower storage tank and introduced into a glass flask. During this sample taking, a small, unavoidable loss of CH,OH occurred. About 100 g of this solid was heated slowly up to 540 K and simultaneously the gas above the solid was evacuated and passed through a cold trap, which was placed in a liquid nitrogen bath. Afterwards the condensate was weighed and analysed. The solids analysis was not performed after each experimental run because each time the reactor was opened a cumber- some and costly rinsing and leak test procedure had to be followed. Therefore, the solids analysis was done only once after every eight experiments in order to check the overall mass balance and to examine the composition of the adsorbate.
3.5. Corrections to the temperature readouts As shown in Fig. 2, the thermocouples were installed
perpendicular to the reactor wall in such a way that their welds were located exactly in the reactor axis. The temperature readings are distorted by the heat conductance of the thermocouple tube, so that the reading will be in between the wall temprature and the real gas temperature. The wall temperature will be uniform in the axial direction due to the large wall thickness. Assuming that the temperature and the linear velocity of the gas are uniform over the whole reactor cross-section, the true gas temperature can be
Fig. 5. Apparatus for the analysis of the solids. (1) Heating oven; (2) solids sample; (3) thermocouple; (4) cold trap; (5)
vacuum pump.
calculated based on the experimental data (see the Appendix).
3.6. The catalyst activity The decrease of the catalyst activity was linear with
time: 6 months after start-up the catalyst activity was 30 “/, lower than its initial activity. We ascribe this effect possibly to the absence of carbon dioxide in the gas phase (Kuczynski et al., 1986a) and for sure to rough handling of the catalyst: our reactor was started up and shut down three times a week on the average. An effect of the adsorbent stream on the catalyst performance cannot be excluded either: small particles of crushed adsorbent may, for example, block the macropores of the catalyst, leading to a decrease of its active surface area.
In the course of the initial and start-up experiments, we observed that a total loss of catalyst activity occurred very quickly, e.g. within 48 h, in cases where the reactor had not been rinsed with hydrogen or an inert gas in between the experimental runs. This deactivation was irreversible. Possibly a consecutive product from a slow decomposition of methanol has a destructive influence on the catalyst. To avoid this effect, we thereafterkept the catalyst beds always in a hydrogen atmosphere in the periods between experiments.
3.7. Accuracy of the experiments The estimated accuracy of the calibrated thermo-
couples used was about 0.25 K and the error in the pressure measurements was less than 0.025 MPa. The accuracy of the calibration line of the solids feeder lay within 4% of the value measured, whereas that of the wet-gas meters was better than 0.5%. The estimated maximum error of the GC analysis amounted to 0.3 vol. y0 for each component. There were several additional sources of scatter in the experimental data. We believe the catalyst promotion by side products to be the most important one.
3.8. Injiuence of oxygen and water on the catalyst As has already been mentioned, during the filling of
the upper solids storage tank, the adsorbent was exposed for a short time to the open air, so that adsorption of oxygen and water could not be avoided. According to recent research on the kinetics of meth- anol synthesis (see, for example, Herman et al., 1979), even small amounts of water and oxygen can influence the methanol formation rate strongly. Therefore the system was radically rinsed with hydrogen after filling the solids storage vessel and prior to the experiments. Nevertheless, remaining traces of 0, or H,O may have promoted the catalyst activity.
3.9. CO and H, co-adsorption The powder contained in the upper storage tank is
free from methanol whereas the adsorbent collected in the lower vessel contains methanol. Although the temperatures of both tanks were maintained at the same level, the adsorption properties of the powder for
Methanol synthesis in a countercurrent gas-solid-solid trickle flow reactor 1893
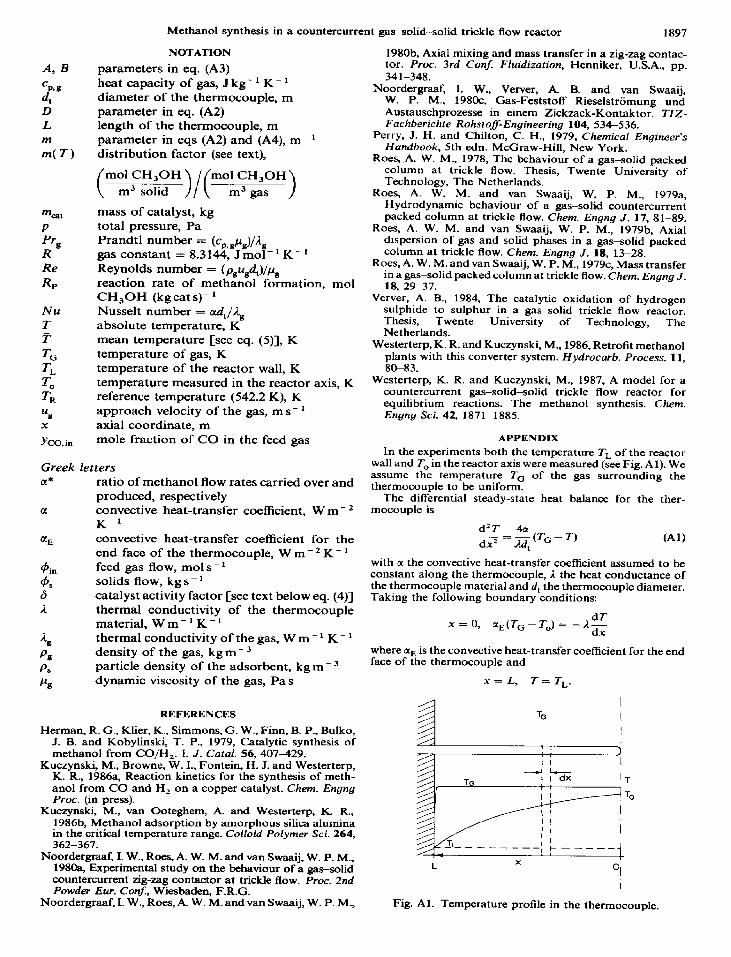
Table 3. Experimental data for a closed reactor outlet
CO and H, may depend on the methanol concen- tration. To evaluate possible errors in the calculated CO conversions caused by the co-adsorption of carbon monoxide, several simple adsorption tests based on the total pressure measurements were carried out at 492-523 K and under a total pressure of 6 MPa. We found that the CO adsorption had no significant implication on our experimenal accuracy.
4. RESULTS AND DISCUSSION
In total 12 experiments with a closed and 90 experiments with an open gas outlet were carried out. In Table 3 the experimental data with a closed gas outlet are specified. Since in these experiments the mole fraction yco, in of CO in the feed gas was always one- third and the total mass m,,, of the catalyst was always 273 g, the molar flow of the feed gas can be easily calculated based on the reaction rate specified in Table 3 from
+i, = -. YCO,in
E represents the adsorption number, defined by (Westerterp and Kuczynski, 1987)
E= &mVdp
PsbinYco,inRTR where TR is a reference temperature. This adsorption number expresses the ratio of the flow rate of the adsorbent to the feed flow rate of the gas. m(T,) is the distribution factor for the adsorption of methanol and is expressed by (Westerterp and Kuczynski, 1987) m = 0.145exp 2304/( T/K). As there was no gas bled off, the reactant conversion was complete. The reactor capacity is calculated on the basis of the determined gas feed flow. The results with an open reactor outlet are listed in Table 4. The conversion of CO in these experiments is calculated on the basis of the molar flows of CO measured at the reactor inlet and outlet:
I G 4co =
co, In - 9c0, out I vc0.m
6 in Table. 4 is the catalyst activity factor expressing the
ratio of the reaction rates measured in standard experiments to those measured under identical con- ditions for the fresh catalyst. It is thus a direct measure of the residual activity of the catalyst since start-up. To correct for the catalyst activity in comparing the model (Westerterp and Kuczynski, 1987) with the exper- iments, now the Damkohler number Da can be reduced to 6Da, which is equivalent to reducing the methanol production rate Rr to SR,,.
u* is the distribution factor of the methanol pro- duced and equals the ratio of the carry-over of methanol in the gaseous reactor effluent to the total production rate of methanol. From an analysis of the solids in the receival vessel the adsorbate was found to consist almost exclusively of methanol, the remainder being water and dimethyl ether. The reactor capacity appears to increase with an increase of the total pressure, the temperature or the solids flow. Such an influence of the pressure and temperature results from the reaction kinetics (Kuczynski et al., 1986a), whereas the solids flow determines the methanol partial press- ure in the reactor influencing in this way the reaction rate, as discussed in our previous paper (Westerterp and Kuczynski, 1987). For high solids flow rates, the reaction rate approaches the initial reaction rate be- cause the methanol partial pressure is kept low and the reverse reaction does not take place. On the other hand, however, the methanol concentration in the solid phase decreases.
The behaviour of the GSSTFR and the influence of the most important operating and design variables on its performance have been amply discussed in the previous paper, in which a mathematical description of this type of reactor was given. The question still remains whether the mathematical description pre- sented (Westerterp and Kuczynski, 1987) is confirmed by the experimental evidence. To this end, we will compare our experimental data with the predictions by the model. The question arises as to what are, in our experiments, the true temperatures at which the reac- tion takes place. For heterogeneously catalysed gas reactions this is the temperature of the catalyst, which in our experimental system cannot be measured di-
1894 M. KUCZYNSKI er al.
Table 4. Experimental data for an open reactor outlet
rectly. The thermocouples are located below and above each catalyst bed and at the wall of each reactor section. In Table 5 typical results of the temperature measure- ments are given for the GSSTFR. In each reactor section the temperature of the gas appears to decrease slightly in the upward direction. In the case of no solids flow, the reverse effect-a slight increase in the temperature-was observed. The difference in the temperatures measured below and above each catalyst bed was never higher than 4 K. Furthermore, the difference between the mean temperatures of the three reactor sections did not exceed 4 K. We therefore decided to consider our reactor in the model calcu- lations as an isothermal GSSTFR. The mean tempera- ture T is calculated according to
where Tuppcr, i and Lver.i are the true values of the temperatures of the gas at the upper and lower reactor ends, respectively, of reactor section i. We neglected possible radial temperature gradients in the catalyst bed and took T to be the temperature for the calcu- lation of the predicted conversion in a isothermal GSSTFR. The error introduced due to this approach is small in comparison to that caused by taking the average reactor temperature in the three reactor sections.
Table 5. Typical temperature readouts. Experiment No. 34
Location of the thermocouple (see Fig. 1)
Temperature measured (K)
Upper storage tank Solids preheater
Topt Bottom
Gas outlet+ First reactor section: Top inside?
Wall Bottom inside
Wall First cooler, outside? Second reactor section: Top inside7
Wall Bottom inside
Wall Second cooler, outside? Third reactor section: Top inside+
Wall Bottom, inside
Wall Gas preheater+
Solids cooler Lower storage tank
293.0
509.0 510.0 473.0
508.6 508.3 509.4 509.0 509.0
511.0 5 10.6 511.8 511.3 507.0
504.6 504.0 508.0 506.9 510.0
373.0 293.0
tContro1 temperatures. These temperatures are used to adjust the rate of heat supply in the heating elements.
1896 M. KUCZYNSKI et al.
As our entire installation was built for operation at much higher pressures and temperatures-in our case for NH, synthesis-the wall thicknesses, etc. are relatively great. The heat capacity of the installation in comparison to the heat produced by the reaction is very large, so it can be expected that our reactor sections operate under near isothermal conditions. A large- scale industrial GSSTFR, of course, would operate adiabatically, as has been argued in our previous paper (Westerterp and Kuczynski, 1987).
In Fig. 6 the conversions of CO as determined for experiments without solids flow are compared with those calculated for an isothermal PFR and for the kinetics given in the paper by Kuczynski et al. (1986a). The agreement is reasonable.
The comparison of the experimental CO conver- sions for the experiments with flow of solids and the values predicted by our theoretical model of the GSSTF reactor (Westerterp and Kuczynski, 1987) is illustrated by Fig. 7. Despite a rather large spread in the data points, no systematic deviations can be observed. Further, we see that conversions higher than the thermodynamic equilibrium conversion in a sohds- stream-free system are obtained in the GSSTFR.
Figure 8 shows a comparison between the exper- imental and the theoretically predicted reactor ca- pacities in the case of complete conversion of the reactants. Reasonable agreement can be observed; the deviations can, among other things, be ascribed to inaccuracies in the kinetic correlation used in the model computations.
5. CONCLUSIONS
We can conclude from our experimental results that complete conversion is attainable in single-pass oper- ation of a countercurrent GSSTFR fed with an ad- sorbent which selectively adsorbs only the product. An increase in the Row of the solids results in a decrease of the partial pressure of the product in the gas phase, so that conversion rates approaching the initial reaction rate can be maintained over the whole reactor length.
0.5
Experimental ((co)
Fig. 7. Comparison of the experimentalty determined con- versions and those predicted by our model (Westerterp and
Kuczynski, 1987) in the case of an open reactor outlet.
5-
V I I1 ,,,I I I I
0.1 0.5 I ExperImental
Fig. 8. Comparison of the measured reactor capacities and those predicted by our model (Westerterp and Kuczynski
1987) in the case of a closed reactor outlet.
0:
g
z a
01
Experimental
Fig. 6. Comparison of the CO conversions in the GSSTFR solids flow with those the
model.
Also operation at incomplete conversion is possible, in which the non-converted reactants together with non- adsorbed product leave the reactor at the top. The granulated silica-alumina cracking catalyst is selective for the adsorption of methanol.
The experimental results agree well with the predic- tions obtained with the theoretical model presented previously. The spread in the data points is, in addition to experimental errors, ascribed to unpredictable ef- fects such as the influence of various undesired gas components on the properties and activity of the catalyst.
AcknowledgementsWe are grateful to the Twente University of Technoloay and the Royal Dutch Shell Grout for their financial support. We also wish to thank Dr. Ing. !%ehmidt of BASF for providing the catalyst, Dr. Ir. K. J. Ptasinski of the Twente Universityfor his participation in the reactor design and Mr. A. H. Pleiter and Mr. H. Vunderink of the Twente University for technical assistance during the experiments.
Methanol synthesis in a countercurrent gas-solid-solid trickle flow reactor 1897
A, B parameters in eq. (A3)
%.g heat capacity of gas, J kg- ’ K- ’
4 diameter of the thermocouple, m D parameter in eq. (A2) L length of the thermocouple, m m parameter in eqs (A2) and (A4), m- I m(T) distribution factor (see text),
mol CH30H mol CH,OH
m3 solid m3 gas >
m,,
P
prg R
Re
R,
mass of catalyst, kg total pressure, Pa
NU
T
T
TG
TL
T,
TR ?A
8 x
YCO, in
Prandtl number = (c~,+~)/A, gas constant = 8.3144, Jmol-’ K-* Reynolds number = (pgugd,)/pg
reaction rate of methanol formation, mol CH,OH (kg cat s)- ’ Nusselt number = ad,/Ag
absolute temperature, K mean temperature [see eq. (5)], K temperature of gas, K temperature of the reactor wall, K temperature measured in the reactor axis, K reference temperature (542.2 K), K approach velocity of the gas, ms- ’ axial coordinate, m mole fraction of CO in the feed gas
NOTATION
Greek letters
ci* ratio of methanol flow rates carried over and produced, respectively
ci convective heat-transfer coefficient, W m- 2 K-’
aE convective heat-transfer coefficient for the end face of the thermocouple, W m - 2 K - 1
6” feed gas flow, mol s - 1
6 solids flow, kg s- ’ 6 catalyst activity factor [see text below eq. (4)] I thermal conductivity of the thermocouple
material, W m - ’ K - 1
%X thermal conductivity of the gas, W m- ’ K- ’
pi3 density of the gas, kg m - 3
Ps particle density of the adsorbent, kg m - 3
cl, dynamic viscosity of the gas, Pas
REFERENCES
Herman, R. G., Klier, K., Simmons, G. W., Finn, B. P., Bulko, J. B. and Kobylinski, T. P., 1979, Catalytic synthesis of methanol from CO/H,. I. J. Catal. 56, 407429.
Kuczynski, M., Browne, W. I., Fontein, H. J. and Westerterp, K. R., 1986a, Reaction kinetics for the synthesis of meth- anol from CO and H, on a copper catalyst. Chem. Engng Proc. (in press).
Kuczynski, M., van Ooteghem, A. and Westerterp, K. R., 1986b, Methanol adsorption by amorphous silica alumina in the critical temperature range. Colloid Polymer Sci. 264, 362-367.
Noordergraaf, I. W., Roes, A. W. M. and van Swaaij, W. P. M., 198Oa, Experimental study on the behaviour of a gas-solid countercurrent zig-zag contactor at trickle flow. Proc. 2nd Powder Eur. Co& Wiesbaden, F.R.G.
Noordergraaf, I. W., Roes, A. W. M. and van Swaaij, W. P. M.,
1980b, Axial mixing and mass transfer in a zig-zag contac- tor. Proc. 3rd Conf Fluidization, Henniker, U.S.A., pp. 341-348.
Noordergraaf, 1. W., Verver, A. B. and van Swaaij, W. P. M., 198Oc, Gas-Feststoff Rieselstrijmung und Austauschprozesse in einem Zickzack-Kontaktor. TIZ- Fachberichte Rohstofl-Engineering 104, 534-536.
Perry, J. H. and Chilton, C. H., 1979, Chemical Engineer’s Handbook, 5th edn. McGraw-Hill, New York.
Roes, A. W. M., 1978, The bchaviour of a gas-solid packed column at trickle flow. Thesis, Twente University of Technology, The Netherlands.
Roes, A. W. M. and van Swaaij, W. P. M., 1979a, Hydrodynamic behaviour of a gas-solid countercurrent packed column at trickle flow. Chem. Engng J. 17, 81-89.
Roes, A. W. M. and van Swaaij, W. P. M., 1979b, Axial dispersion of gas and solid phases in a gas-solid packed column at trickle flow. Chem. Engng J. 18, 1>28.
Roes, A. W. M. and van Swaaij, W. P. M., 1979c, Mass transfer in a gas-solid packed column at trickle flow. Chem. Engng J. 18,29%37.
Verver, A. B., 1984, The catalytic oxidation of hydrogen sulphide to sulphur in a gas-solid trickle flow reactor. Thesis, Twente University of Technology, The Netherlands.
Westerterp, K. R. and Kuczynski, M., 1986, Retrofit methanol plants with this converter system. Hydrocarb. Process. 11, 80-83.
Westerterp, K. R. and Kuczynski, M., 1987, A model for a countercurrent gas-solid-solid trickle flow reactor for equilibrium reactions. The methanol synthesis. Chem. Engng Sci. 42, 1871-1885.
APPENDIX
In the experiments both the temperature TL of the reactor wall and T,, in the reactor axis were measured (see Fig. Al). We assume the temperature TG of the gas surrounding the thermocouple to be uniform.
The differential steady-state heat balance for the ther- mocouple is
d2T 4a _= -(TG-T) dx2 Ad,
(AlI
with a the convective heat-transfer coefficient assumed to be constant along the thermocouple, 1 the heat conductance of the thermocouple material and d, the thermocouple diameter. Taking the following boundary conditions:
x = 0, +(TG-To) = -1:
where aE is the convective heat-transfer coefficient for the end face of the thermocouple and
x = L, T= TL.
I
TG I
I
Fig. Al. Temperature profile in the thermocouple.
1898 M. KIJ~ZYN~KI et al.
For these boundary conditions the differential equation can be easily solved. The temperature To of the tip of the thermocouple is thus found to be given by
- -
TG-TL ~ = cash (mL). Tc-TL
(A4)
For the calculation of a we use the correlation (Perry and Chilton, 1979)
lG-lL ~ = cash (mL) + D sinh (mL) To--TL
(4 Nu = 0.989 Re’ I3 Pro.”
where -
with rn = 4a -
becomes Ad,
and D = %. Assuming aa JJn
x OL, the solution Nu=$, us d* P,
Re = - %gh3
Y and Prg = ~
8 %t in which c&s represents the heat capacity and As the thermal
TG-TL - -= To-T, 1 (2B+A)&a:2B-A)&“a 1
-1 conductivrty of the gas.
(A3) Under the conditions of our experiments (A = 22.5 Wm-’ K-’ d, = I.6 x lo-’ m, L = 12.5 x 10m3m and Pr x 0.7). the heat transfer through the end face of the
J
at.!,
J
z thermocouple cannot be neglected. The tip area is 3% of the
with A = 11 and B = &’
total external area of the thermocouple, so we prefer the use of eq. (A3).
If the heat transfer through the end face of the ther- The ratio (TG - T,)/(T, - T,j lies between 1.6 and 3.5, or mocouple can be neglected, then for x = 0 dT/dx = 0 holds TG - To is 0.62.5 times the measured temperature difference and the solution is To--TL.