Biogeosciences Discussions is the access reviewed discussion forum of Biogeosciences
Methanotrophy potential versus methanesupply by pore water diffusion inpeatlandsE. R. C. Hornibrook, H. L. Bowes, A. Culbert, and A. V. Gallego-Sala
Bristol Biogeochemistry Research Centre, Department of Earth Sciences, University ofBristol, Wills Memorial Building, Queens Road, Bristol, BS8 1RJ, UK
Received: 4 March 2008 – Accepted: 29 March 2008 – Published: 18 June 2008
Low affinity methanotrophic bacteria consume a significant quantity of methane in wet-land soils in the vicinity of plant roots and at the oxic-anoxic interface. Estimates ofthe efficiency of methanotrophy in peat soils vary widely in part because of differencesin approaches employed to quantify methane cycling. High resolution profiles of dis-5
solved methane abundance measured during the summer of 2003 were used to quan-tify rates of upward methane flux in four peatlands situated in Wales, UK. Aerobicincubations of peat from a minerotrophic and an ombrogenous mire were used to de-termine depth distributions of kinetic parameters associated with methane oxidation.The capacity for methanotrophy in a 3 cm thick zone immediately beneath the depth of10
nil methane abundance in pore water was significantly greater than the rate of upwarddiffusion of methane in all four peatlands. Rates of methane diffusion in pore water atthe minerotrophic peatlands were small (<10%) compared to surface emissions dur-ing June to August. The proportions were notably greater in the ombrogenous bogsbecause of their typically low methane emission rates. Methanotrophy appears to con-15
sume entirely methane transported by pore water diffusion in the four peatlands withthe exception of 4 of the 33 gas profiles sampled. Flux rates to the atmosphere re-gardless are high because of gas transport through vascular flora, in particular, at theminerotrophic sites. Cumulative rainfall amount 3-days prior to sampling correlated wellwith the distance between the water table level and the depth of 0µmol l−1 methane,20
indicating that precipitation events can impact methane distributions in pore water. Fur-ther work is needed to characterise the kinetics of methane oxidation spatially andtemporally in different wetland types in order to determine generalized relationships formethanotrophy in peatlands that can be incorporated into process-based models ofmethane cycling in peat soils.25
Alpha and gamma Proteobacteria belonging, respectively, to the Methylocystaceae andMethylococcaceae families are ubiquitous at oxic-anoxic interfaces in the Earth systemwhere oxygen (O2) is present and methane (CH4) is transported in large quantitiesunder the influence of concentration gradients or ebullition. These microorganisms,5
also known as Type I (gamma) and Type II (alpha) methanotrophs, serve as an effi-cient filter, removing CH4 that otherwise would enter the troposphere. Collectively lowaffinity methanotrophs in such environments annually consume a quantity of CH4 wellin excess of the ∼600 Tg that does enter the Earth’s atmosphere from biological andgeological sources (Mikaloff Fletcher et al., 2004).10
The anoxic soils of natural wetlands are one of the main perennial sources of CH4flux that help to maintain a low but significant quantity of this chemically and radia-tively active organic gas in the Earth’s highly oxidizing atmosphere. More than threedecades of study of methanotrophs in wetlands and peatlands have yielded significantinsights into their phylogeny, distribution, kinetics, and preferred growth conditions (e.g.,15
Segers, 1998; Gutknecht, 2006; Chen et al., 2008). Methanotroph populations in therhizosphere and with depth in peat soils have been mapped using molecular biologytechniques, including PCR amplification of DNA extracts and hybridisation with specificphylogenetic 16S rRNA and functional gene primers (e.g., Krumholz et al., 1995; Mc-Donald et al., 1996, 1999; Ritchie et al., 1997; Calhoun and King, 1998; Edwards et al.,20
1998; Dedysh, 2002; Dedysh et al., 2001, 2003; Wartiainen et al., 2003; Miller et al.,2004), quantification of membrane phospholipid fatty acids (PLFAs) (Krumholz et al.,1995; Sundh et al., 1995, 1997), and more recently stable isotope probing techniquesinvolving 13C-labelling of PLFAs and nucleic acids (Morris et al., 2002; McDonald etal., 2005; Kreuzer-Martin, 2007; Chen et al., 2008). Both Type I and II methanotrophs25
occur in wetland soils, occupying oxic zones immediately adjacent to plant roots (King,1994, 1996; Schipper and Reddy, 1996; Calhoun and King, 1998; van der Nat andMiddelburg, 1998; Popp et al., 2000) and shallow zones within peat soils to which at-
mospheric O2 is able to diffuse under edaphic conditions and vegetation groundcoverspecific to particular types of wetlands (Krumholz et al., 1995; McDonald et al., 1996;Watson et al., 1997; Edwards et al., 1998; Beckman and Lloyd, 2001; Megonigal andSchlesinger, 2002).
The tolerance of methanotrophs to anoxia appears to vary (Roslev and King, 1996).5
Greatly diminished levels of methanotrophic activity have been reported in post-anoxiaincubations of rhizome material (King, 1994) while sediment and peat from other wet-lands upon return to O2-rich conditions have shown CH4 oxidation capacities rang-ing from moderately attenuated (e.g., King, 1990) to rapid and vigorous (Whalenand Reeburgh, 2000). Methane supply is most commonly cited as the factor limiting10
methanotrophy in peat soils (Boon and Lee, 1997; Megonigal and Schlesinger, 2002;Berestovskaya et al., 2005; Basiliko et al., 2007 ) although O2 availability also mayrestrict rates of CH4 uptake (King, 1990, 1994, 1996; Mikkela et al., 1995; Beckmanand Lloyd, 2001). Differences in the limiting factors between peatlands likely resultsfrom a combination of soil properties affecting gas exchange and heat transfer, the15
abundance and types of flora present, and water table depth, all of which impact thepotential for CH4 oxidation and production (Kettunen et al., 1996; Kettunen, 2003).Water table level is a particularly critical parameter because it controls the thicknessof the unsaturated zone, which enhances the capacity for methanotrophy, but also caneliminate a key zone for CH4 production at shallow depths in the vicinity of the rhizo-20
sphere where methanogens benefit from higher temperatures and an abundant supplyof labile substrates from root exudation (Roulet et al., 1993; Sundh et al., 1994; Ket-tunen et al., 1999; Strom et al., 2005). Despite the presence of methanotrophy in thiszone, CH4 flux from wetlands is significantly enhanced by gas exchange with the at-mosphere through the aerenchyma of vascular flora (Shannon et al., 1996; Joabsson25
et al., 1999; Joabsson and Christensen, 2001; Oquist and Svensson, 2002; Strom andChristensen, 2007). In the absence of high temporal resolution measurements of CH4flux capable of detecting sporadic ebullition events (Baird et al., 2004; Tokida et al.,2007a, b), estimates of CH4 emission from wetlands will be dominated by passive or
active transport of CH4 through vascular aquatic plants when suitable flora are present.Attempts to quantify the efficiency of methanotrophy in peat soils have yielded a wide
range of estimates of CH4 consumption, in part, because of different methods em-ployed and the limitations associated with specific approaches as discussed by Pearceand Clymo (2001). Le Mer and Roger (2001) concluded from a survey of literature5
that ∼60 to 90% of CH4 produced in wetland soils is oxidized by methanotrophs in therhizosphere or shallow subsurface horizons; however, other estimates suggest a rangeof proportions, including 20–40% in general for natural wetlands (Whalen, 2005), 15 to76% of potential diffusive CH4 flux seasonally and ∼43% annually of CH4 entering theoxic zone of a freshwater marsh (Roslev and King, 1996), ∼22% for conversion of CH410
to CO2 during transport through 10 cm of acrotelm Sphagnum-rich peat (Pearce andClymo, 2001), complete consumption within 20 cm of the water table in an undrainedpeatland (Roulet et al., 1993), 65±24% of CH4 entering the rhizosphere of Sagittarialancifolia estimated by CH3F inhibition and 79±20% by mass balance (Schipper andReddy, 1996), 34.7±20.3% and 16.1±7.9% in the rhizosphere, respectively, of bulrush15
and reed wetlands (van der Nat and Middelburg, 1998), 55% of upward diffusing CH4in an Alaskan boreal peatland (Whalen and Reeburgh, 2000), 52±10% and 81±9% intwo tidal freshwater wetland forests (Megonigal and Schlesinger, 2002), 0 to 34% rhi-zosphere oxidation of CH4 in a Carex fen determined using 13C mass balance (Popp etal., 1999), and 58 to 92% or <20% in the same peatland depending upon whether CH420
consumption was quantified by subtracting in situ methane emission rates from CH4production rates measured in the laboratory or in situ use of the CH3F inhibitor tech-nique (Popp et al., 2000). Much of the variability in estimates of CH4 oxidation efficiencyappears to stem from differences in methodology. As noted by Popp et al. (2000), CH4production rates determined in vitro likely lead to an overestimation of CH4 supply in25
peat soils, contributing to the calculation of anomalously high proportions of CH4 re-moval by methanotroph activity.
We measured detailed (cm scale resolution) in situ profiles of dissolved CH4 concen-tration at four different peatlands situated in Wales, UK during the summer of 2003 to
calculate the supply of CH4 into the methanotrophic zone at the sites. The gas concen-tration profiles enabled determination of complete attenuation of CH4 flux by pore waterdiffusion when the abundance of dissolved CH4 was ∼0µmol l−1 (i.e., below detectionlimits) within the saturated zone. We compared estimated rates of CH4 transport bypore water diffusion to total quantites of CH4 emitted to the atmosphere. We also used5
aerobic incubations of peat amended with CH4 to assess differences in CH4 uptakekinetics with depth and between two of the peatlands (a raised bog and an interme-diate fen). In situ CH4 concentration data and the determined µm (maximum rates ofCH4 oxidation) and Ks (half saturation concentrations) values were then employed toestimate the capacity for CH4 consumption in relation to the supply of CH4 by pore10
water diffusion. Finally, we also investigated relationships between cumulative rainfallin the period preceding pore water sampling and the distribution of CH4 with depth inthe peatland soils to determine whether the timing of sampling impacted our results.
2 Site characterisation
2.1 Peatland descriptions15
The locations of the four peatlands investigated in Wales, UK are shown in Fig. 1 andfurther details for the sites are provided in Table 1. Crymlyn Bog and Gors Lywd bothreceive water input from surrounding uplands via overland and subsurface flow andthus have slightly more alkaline pore water than Blaen Fign and Cors Caron, which areombrogeneous bogs. Sphagnum spp. were common at all sites; however, predictably20
the abundance and diversity of vascular flora were highest at the minerotrophic peat-lands Crymlyn Bog and Gors Lywd. At each peatland, two adjacent stations (∼1 mapart) were chosen for installation of pore water equilibrators and ground collars tosupport flux chambers. At Crymlyn Bog and Blaen Fign the ground collars enclosedsignificantly different proportions of bryophytes and vascular flora with Sphagnum moss25
dominating at station 1 and sedge species at station 2.
Daily precipitation data for the period January to December 2003 collected at UK Me-teorological Office Stations at Swyddffynnon, Cwmystwyth, Llangurig and SwanseaVictoria Park (Fig. 1) were obtained from the British Atmospheric Data Centre (BADC)archive.5
3 Analytical methods
3.1 Sample collection
Pore water equilibrators and ground collars for flux chambers were installed at thesites several months prior to the onset of sampling which began in the spring of 2003.Measurements of in situ concentrations of pore water CH4 and rates of CH4 flux to the10
atmosphere were performed between April and September 2003 at the four peatlands.One peatland was sampled each week yielding on average one monthly data set foreach site during the growing season. Peat cores were collected in September 2005for follow-up experiments investigating differences in methane oxidation kinetics withdepth at Cors Caron and Crymlyn Bog.15
3.2 Methane flux
Collection methods and CH4 flux data for all sites were reported previously in Bowesand Hornibrook (2006) and Hornibrook and Bowes (2007). Briefly, flux chambers andground collars were constructed of polyvinyl chloride (PVC) and had a combined vol-ume of either 11 or 15 litres. The chambers were sealed onto the collars using large20
neoprene rubber o-rings coated with silicon grease and then covered with opaque lidsalso fitted with greased o-rings. Air samples were collected via a 4-m length of 3-mm
OD Tygon® tube installed in the lid of each chamber. A second identical tube fitted in
the lid was kept open during sampling to prevent subambient pressures from formingwhile air samples were collected. Each chamber contained a small battery operatedfan to mix the headspace. Air samples for CH4 flux measurements were collected at 0(chamber open), 5, 15 and 30 min in 60 ml polypropylene syringes fitted with gas-tightvalves. Independent flux determinations were conducted in triplicate for each station5
during each sampling trip.
3.3 Pore water methane
Collection methods and pore water CH4 data for Blaen Fign were reported previouslyin Bowes and Hornibrook (2006). The dissolved CH4 abundances for Crymlyn Bog,Gors Lywd and Cors Caron are reported here for the first time. Briefly, the collection10
technique employed membrane-exchange equilibrators constructed of PVC that wereinstalled ∼15 cm from each ground collar. The equilibrators enabled sampling of porewater gases at closely spaced depth intervals (2 cm resolution) for measurement ofdissolved CH4 abundance. The design of Hesslein (1976) was modified to permit inputand removal of de-ionised, de-gassed water after ground installation through 3-mm OD15
Tygon® tubes connected to 1×25×0.5 cm (H×W×D) troughs that were sealed with agas and ion permeable membrane filter (0.2µm pore size; HT-200, Pall Life Sciences).
3.4 Peat cores
Peat samples for porosity measurements and CH4 oxidation kinetic experiments wereobtained from monoliths (100 cm2 cross-sectional area × 120 cm length) collected us-20
ing a Wardenaar® peat corer (Eijelkamp, Netherlands). The peat was sectioned in thefield into 1 dm3 blocks, sealed in gas tight bags and then packed in ice for transport tothe laboratory.
Soil temperature was measured using an Omega Model HH-41 handheld thermistorthermometer and a thermistor probe. The latter consisted of a nylon-coated type-K thermocouple encased within a 5-cm long brass tube that had a wall thickness of0.15 mm. The lead wire of the thermocouple was passed through a 2-m long stainless5
steel tube enabling the protected thermocouple tip to be inserted to specific depths inthe peat soil. A nylon plug was used to isolate thermally the thermocouple tip from thestainless steel tube.
The ambient water-table level at each peatland was measured relative to the groundsurface in a 10×10 cm hole that had been cut during a previous visit using the10
Wardenaar® corer.
3.6 Methane concentration analysis
Methane concentrations in air samples collected for determining flux rates were an-alyzed using a Carlo Erba HRGC5300 gas chromatograph (GC) equipped with gas-
flame ionization detector (FID). The carrier gas was helium at 35 ml min−1, and FIDsupport gases were hydrogen at 30 ml min−1 and zero air at 400 ml min−1. Sampleswere injected through 1 cm3 cartridges packed with magnesium perchlorate to removeH2O. The relative precision of CH4 analysis in air samples typically was better than±2% based on replicate injections of BOC Specialty Gases alpha-gravimetric stan-20
dards and actual samples. Flux rates were determined from the slope of linear regres-sion equations fitted to the change in chamber CH4 concentration versus time. Rateswere corrected for the areal coverage and volume of the chambers, and are expressedin units of mg m−2 d−1.
Methane was stripped from pore water into a headspace of helium using the method25
of McAullife (1971). The resulting gas samples were analyzed on the Carlo Erba
HRGC5300 gas chromatograph (GC) under the same conditions used for analysis ofCH4 in flux samples. Pore water concentrations of CH4 were corrected for differencesin peat porosity and are expressed in units of µmol CH4 l−1.
3.7 Methane oxidation kinetics
Peat monoliths obtained from Cors Caron and Crymlyn Bog were subsampled in 5 cm5
slices (∼0.5 dm3) centred on five depths (5, 12.5, 20, 27.5 and 35 cm). The materialwas slurried in a 1:1 ratio with autoclaved de-ionised water. Slurry from each depth was
incubated in triplicate at 15◦C in crimp-top 35 ml Wheaton® serum vials containing aheadspace of CH4 in zero air corresponding to initial dissolved CH4 concentrations(S0) of ∼10, 25, 50, 100, 250 and 500µM. An additional slurry sample for each depth10
was incubated in singular as a blank containing a headspace of air only to confirm theabsence of CH4 production. Within two hours of loading the vial headspace, the actualvalue of S0 in each vial was determined by GC-FID analysis of CH4 in the headspaceand Henry’s Law. The rate of CH4 oxidation was determined subsequently from thedecrease in headspace concentration of CH4 from time 0 (initial) to 24, 48 and 72 h.15
Gas samples were extracted using a 50µl Hamilton® glass syringe fitted with a side-hole needle and gas-tight valve. Methane abundance was analyzed in triplicate using a
Perkin Elmer® Clarus 500 gas chromatograph fitted with an Elite® PLOT Q mega-borecolumn (30 m×0.53 mm diameter) and FID. The carrier gas was helium at 45 ml min−1
and FID support gases were hydrogen at 35 ml min−1 and zero air at 450 ml min−1. The20
CH4 oxidation rates determined independently in triplicate for each of the six S0 values(i.e., 18 rate measurements per depth) were used to determine the maximum specificrate of CH4 uptake (µm) and half saturation concentrations (Ks) for each depth intervalin the two peatlands. Oxygen presumably was not a limiting factor in our experimentsgiven that the incubations were conducted in zero air and hence the single Monod25
expression was used to describe methanotroph consumption of CH4 in the vials:
µ=µm [CH4]
Ks + [CH4](1)
where µ is the rate of methanotrophy (µmol l−1 h−1), µm is the maximum specific rate ofCH4 uptake (µmol l−1 h−1), [CH4] is the concentration of CH4 (µmol l−1) (i.e., S0 values)and Ks is the concentration of CH4 (µmol l−1) required to attain half the maximum rate5
of CH4 uptake. Equation (1) was fitted to the CH4 oxidation rate and S0 data using non-linear regression software (Prism v4.0, GraphPad Software, San Diego, CA, USA).
3.8 Diffusion rates for CH4 in pore water
The rate of upward CH4 diffusion in pore water at each peatland was determined usingFick’s 1st Law:10
J = DS
(d [CH4]
dz
)(2)
where J is the flux rate (µmol cm2 s−1), Ds is the temperature and porosity correcteddiffusion coefficient for CH4 in water (cm2 s−1) and d [CH4]/dz is the CH4 concentrationgradient (µmol cm−3 cm−1) with depth (cm) in peat soils. Fick’s 1st law was used be-cause the amount of time required to sample an equilibrator profile (∼1 h) is small and15
hence the measured gradients can be treated as being effectively steady state. Finalvalues of J are expressed in mg CH4 m−2 d−1 to facilitate comparison with CH4 fluxesto the atmosphere measured using static chambers. The temperature dependency ofDS was based upon polynomial regression of diffusion coefficients for CH4 in water inrange 0 to 35◦C (83rd Edition of the Handbook of Physics and Chemistry) which yielded20
A value of D was calculated for each CH4 profile based upon the mean soil temperaturemeasured in situ across the depth interval for which pore water CH4 concentration datawere linearly regressed to determine d [CH4]/dz. Values of D were porosity correctedusing Eq. (4) from Lerman (1979):
DS = Dφ2 (4)5
where φ is porosity (unitless). For each pore water data set, an average value ofφ was calculated from in situ porosity measurements collected across the d [CH4]/dzdepth interval.
4 Results
4.1 Daily precipitation and timing of sampling10
The timing of sample collection at Crymlyn Bog, Cors Caron, Blaen Fign and Gors Lywdis shown in Fig. 2 in relation to total daily precipitation measured at UK MeteorologicalOffice Stations (MOSs) situated near the peatlands. Swansea Victoria Park (Fig. 2a)and Swyddffynnon (Fig. 2b) MOSs are located immediately adjacent to Crymlyn Bogand Cors Caron, respectively, providing accurate daily precipitation records for each15
site. There are no active MOSs in close proximity to either Blaen Fign or Gors Lywdbecause of their remote locations in the Elan Valley. Consequently daily precipitationrecords from the Cwmystwyth and Llangurig MOSs, which geographically bracket thepeatland sites, have been used (Fig. 2c and d)
4.2 Pore water CH420
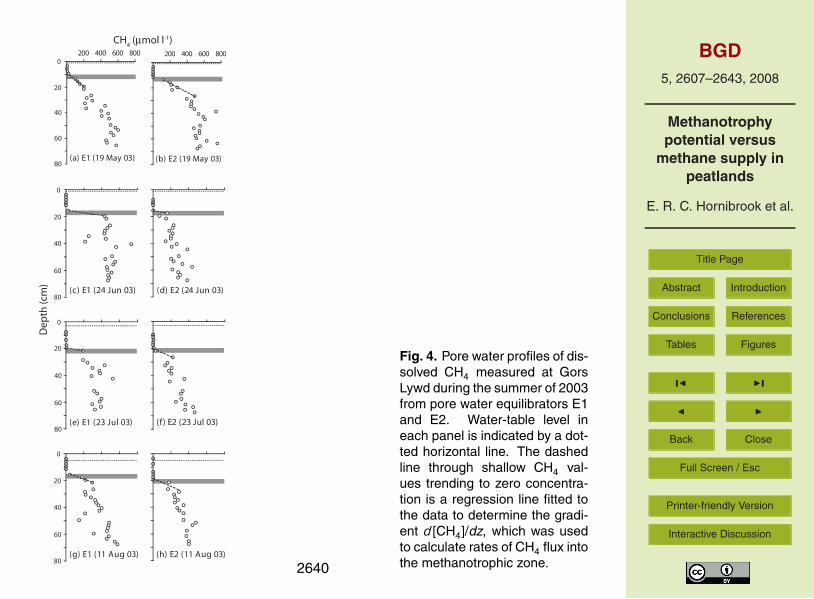
Pore water profiles of dissolved CH4 measured in soils at the four peatlands duringthe summer of 2003 are shown in Figs. 3 to 6. Also shown in each figure panel is theambient water table level at the time of sampling of the membrane equilibrators. Thedashed line through the dissolved CH4 data is a linear regression curve from which
d [CH4]/dz was obtained to calculate rates of upward CH4 diffusion and the depth atwhich [CH4]=0µmol l−1 (i.e., the y-intercept denoted as [CH4]0). The gray horizontalbar delineates a 3 cm thick zone immediately beneath depth [CH4]0 in which potentialrates of CH4 oxidation were calculated based upon experimentally determined kineticparameters (see Sect. 4.3) and in situ dissolved CH4 concentrations. Where gaps5
existed in pore water [CH4] data, missing values were interpolated between adjacentCH4 concentrations, including when necessary the point [CH4]0=0µmol l−1.
Pore water CH4 concentration profiles at all sites exhibited a similar shape althoughthe size of the zone beneath the water table in which dissolved CH4 abundance wasbelow the detection limit of our analysis method varied widely between peatlands and10
sampling months at individual sites. The potential impact of the magnitude and timingof rainfall events on the size of the zone where [CH4]<0µmol l−1 will be explored furtherin Sect. 5.1.
4.3 CH4 oxidation kinetics
Maximum potential rates of CH4 oxidation (µm) and half saturation concentrations (Ks)15
determined from incubations of slurried peat are presented in Table 2. The methan-otrophy rate and S0 data were fitted twice with Eq. (1): once using all data (S0=10to 500µmol l−1) and a second time excluding the S0=250 and 500µmol l−1 measure-ments (i.e., S0=10 to 100µmol l−1). The µm and Ks values determined using all dataare anomalous, in particular, the Ks values which exceed all half saturation constants20
reported to date for low affinity methanotropy by 1 to 2 orders of magnitude. The µmvalues are similarly high with values from the two samples in the depth interval 10 to22.5 cm at Cors Caron being ∼10 times greater than any maximum potential rates forCH4 oxidation in freshwater environments reported to date. These anomalous valuesappear to result from the disproportionate effects of high CH4 oxidation rates deter-25
mined from the small number of incubations having S0 values >100µmol l−1. Suchconcentrations of CH4 are very rare in situ at the oxic-anoxic interface in peatlands
and consequently, Eq. (1) was fitted to the data a second time excluding CH4 oxida-tion rates from the two highest values of S0 (250 and 500µmol l−1). The resulting µmand Ks values are consistent with kinetic parameters typically associated for low affin-ity methanotrophy in aerobic environments. The half saturation concentrations are stillamongst the highest reported to date; however, they are similar to published values of5
Ks for peat soils, which tend to be large relative to other methanotrophic environments(Segers, 1998).
Notably the S0=10 to 100µmol l−1 set of depth profiles of µm and Ks values donot show maxima at depths near the lower limit of water table fluctuations (which arepresent in the µm and Ks values from analysis of the complete data set). Instead µm10
values decrease steadily with increasing depth. The large standard errors associatedwith the Ks parameter preclude any broad generalisation about trends with depth of thehalf saturation constant in soils at either site.
4.4 Rates of CH4 flux and consumption
A summary of rates of internal and external CH4 fluxes (all sites) and subsurface15
methanotrophy potentials (Crymlyn Bog and Cors Caron only) are presented in Table 3.Rates of upward CH4 flux into the methanotrophic zone were determined according tothe method described in Sect. 3.8 and then scaled to a cross-sectional area of 1 m2.The majority of CH4 fluxes by pore water diffusion had a magnitude <10 mg m−2 d−1.The concentration of dissolved CH4 at the water table surface was >0µmol l−1 in only20
5 of the 33 pore water CH4 profiles (Figs. 3c, e, g, 6c and f), suggesting that diffusionof CH4 across the air-water interface contributes little to atmospheric emissions of CH4at these sites. Methane escaping from the water surface within the peat profile muststill transit pore spaces and methanotroph populations in the unsaturated zone beforereaching the atmosphere.25
In all cases the rate of upward CH4 flux was less than the capacity for CH4 oxidationdetermined in a 3 cm thick zone immediately below the depth at which [CH4]=0µmol l−1
(Table 3). The potential for methanotrophy in the 3 cm thick zone was estimated by in-tegrating rates of CH4 oxidation calculated by substituting values of µm and Ks, and insitu dissolved CH4 concentrations into Eq. (1). A peat interval of 3 cm downward fromthe point [CH4]0 was chosen because (i) depths above the point [CH4]0 yield methan-otrophy rates (µ) equal to zero using Eq. (1), (ii) 3 cm was the minimum depth reported5
by Beckmann and Lloyd (2001) for penetration of O2 by diffusion into a Scottish peatsoil, and (iii) our aim was to provide a conservative estimate of CH4 oxidation potentialsbased upon the kinetic parameters determined in laboratory incubations. For example,the values of potential capacity for CH4 uptake noted in Table 3 (mg CH4 m−2 d−1) are∼3 orders of magnitude smaller than integrated oxidation rates reported by Sundh et10
al. (1994) for boreal peatlands in Sweden that were based upon a 0 to 60 cm depthinterval (3.0 to 22.1 g CH4 m−2 d−1). Integration over large depth intervals is accuratewhen a double Monod expression incorporating availability of O2 can be employed;however, we did not measure either in situ concentrations of pore water O2 or kineticparameters associated with O2 consumption, hence we opted for the conservative ap-15
proach of applying the determined µm and Ks values to a small depth interval in whichO2 was likely to be available.
The integrated methanotrophy potential rates were scaled to an area of 1 m2 to fa-cilitate comparison with pore water CH4 diffusive fluxes and directly measured ratesof CH4 emission to the atmosphere. The latter also are shown in Table 3 and have20
been reported previously in Bowes and Hornibrook (2006) and Hornibrook and Bowes(2007). The CH4 fluxes to the atmosphere are due only to steady-state diffusion pro-cesses (i.e., pore water or plant-mediated transport). Chamber measurements thatexhibited erratic pulses (i.e., ebullition) were excluded from the flux analysis becauseit could not be determined conclusively whether the events were natural or induced25
during sample collection.In the minerotrophic peatlands (Crymlyn Bog and Gors Lywd), CH4 emission rates
to the atmosphere typically exceeded maximum rates of CH4 transport by pore waterdiffusion by one to two orders of magnitude, in particular, during summer months (Ta-
ble 3). Fluxes of CH4 to the atmosphere were much smaller from the ombrogenouspeatlands (Blaen Fign and Cors Caron) with the exception of the sedge-rich plot (sta-tion 2) at Blaen Fign, consistent with the well known ability of many aquatic vascularflora to mediated gas transport via aerenchymatous tissue.
5 Discussion5
5.1 The influence of precipitation events on pore water CH4 profiles
Rates of both aerobic and anaerobic microbial processes in peat soils can be impactedby rainfall events through the introduction of electron acceptors such as O2, SO2−
4 andNO−
3 (Dise and Verry, 2001; Gauci et al., 2002, 2004). Concentrations of microbial sub-strates in shallow peat layers, including dissolved gases (e.g., CH4), also may be influ-10
enced through dilution which may affect rates of processes such as methanogenesisand methanotrophy (Kettunen et al., 1996). Thus the timing of CH4 flux measurementsor sampling of pore water CH4 concentrations should be considered when possible inrelation to short-term precipitation records.
The distance between the water table level and depth where [CH4]=0µmol l−1 (i.e.,15
[CH4]0) differed greatly between the four peatland sites and sampling periods at indi-vidual sites (Figs. 3 to 6). The potential influence of precipation input on this parame-ter was explored by comparing the depth to [CH4]0 in the saturated zone with rainfallamounts on (i) the day of sampling, and (ii) the periods 1, 3, 5 and 7 days before sam-pling of pore water. Significant correlations existed with cumulative rainfall during the20
period 3 days prior to pore water sampling (Fig. 7 and Table 4) but not the amountof rainfall over shorter or longer periods before sample collection (data not shown; r2
values typically <0.40). A few of the weaker correlations in Fig. 7 (e.g., Cors Caron,stations 1 and 2) result from single data points heavily skewing the linear regressionanalysis because of the small size of the data sets (i.e., typically n=4). Regression lines25
have a negative slope only for Crymlyn Bog, the most minerotrophic of the peatlands
which receives significant moisture input from groundwater as well as precipitation.For the other three peatlands, including Gors Lywd which is positioned at the head ofa small catchment, the slopes of the regression equations are positive. The analysis inTable 4 and Fig. 7 suggests that in the absence of significant rainfall events, the depthof [CH4]0 is not as variable as implied in Figs. 3 to 6. The large range of values for this5
parameter likely reflect differences in recent input of precipitation rather than microbio-logical driven changes in methane production and consumption. The “normal” depth of[CH4]0 appears to vary between individual peatlands as indicated by differences in they-intercepts of the regression equations in Table 4 (e.g., ∼10 cm for Gors Lywd versus∼5 cm for Blaen Fign).10
Noteworthy in Fig. 7 are the infilled data points for Cors Caron and Crymlyn Bogthat lie largely at x-values of ∼0 mm (i.e., when little or no rainfall occurred prior to thesampling period). The infilled points (5 in total) represent times when the concentrationof dissolved CH4 at the water table level exceeded 0µmol l−1 and CH4 transport wasoccurring across the subsurface air-water interface. The correlations in Table 4 will be15
unimportant during periods of low rainfall and at those times CH4 most likely is able todiffuse across the water table surface because heterotrophic activity in the unsaturatedzone has depleting O2 from pore spaces.
5.2 CH4 oxidation kinetics
The µm values determined for different depth intervals at Crymlyn Bog and Cors Caron20
(Table 3; S0=10 to 100µmol l−1 values) lie within the range of potential methane oxida-tion rates (0.1 to 100µmol m−3 s−1) compiled by Segers (1998) for different types of en-vironments that host low affinity methanotrophic activity. Conversion of units in Table 3for comparison yield µ values of 0.5 to 1.1 and 2.9 to 5.9µmol m−3 s−1, respectively,for Crymlyn Bog and Cors Caron. Half saturation constants for Cors Caron also are25
higher than values for Crymlyn Bog. It is unclear why methanotrophs in the raised bogenvironment should have a lower affinity for substrate (i.e., higher Ks) and molecular bi-
ology data are unavailable to determine whether differences existed in methanotrophiccommunities at the two peatlands. Although the two peatlands differ in the compositionand pH of their soil solution, we cannot speculate about potential relationships betweenthe parameters µm and Ks, and factors such as pH because slurries were diluted 1:1with deionized water. The buffering capacity of peat from the two sites would have5
differed considerably (i.e., rainfed versus groundwater influenced). However, Ks valuescited by Segers (1997) for peat soil ranged from 1 to 45µmol l−1, encompassing thevalues determined for Crymlyn Bog. Watson et al. (1997) reported a Ks of 57.9µmol l−1
for CH4 oxidation in acidic peat from Ellergower Moss, comparable to the range of halfsaturation constants determined with depth for Cors Caron, which also is a raised bog10
(i.e., 42.6 to 68.1µmol l−1; Table 3).The ranges of µm and Ks values in Table 3 are noteworthy also because of the dif-
ficulties such variability presents in efforts to model CH4 dynamics in peatland soils.For example, one of the more rigorous process-based models for estimating CH4 fluxfrom peatlands (Walter and Heimann, 2000) employs the assumption that the param-15
eters µm and Ks for methanotrophy are constant with depth and in different types ofwetlands, assigning values of 20µmol l−1 h−1 and 5µmol l−1, respectively. The meanµm values for Crymlyn Bog and Cor Caron suggest that maximum rates of CH4 oxi-dation may differ between minerotrophic and ombrogenous mires and in both casesappear to decrease gradually with depth. As noted previously, half saturation concen-20
trations also may be higher in acidic rainfed peatlands (e.g., Table 3 and Watson et al.,1997). Availability of kinetic parameters describing CH4 oxidation in peatlands is toolimited at present to attempt to develop generalised relationships describing µm and Ksin different types of peatlands and spatially and temporally within individual sites.
5.3 Methane supply, demand and net flux25
The amount of upward CH4 transport in all four peatlands via pore water diffusion typi-cally was <10 mg m−2 d−1 and exceeded this value in only 4 of the 33 pore water CH4
profiles collected during the summer of 2003. Rates of CH4 emission to the atmo-sphere from Blaen Fign and Cors Caron were the same order of magnitude as porewater CH4 diffusion rates; however, it is unlikely that CH4 transport by this mode con-tributed to atmospheric flux. The stable carbon isotope compositions (δ13C values)of CH4 in pore water and surface flux have been used previously to demonstrate that5
emission of CH4 to the atmosphere at all four peatlands occurs predominately via plant-mediated transport (Bowes and Hornibrook, 2006; Hornibrook and Bowes, 2007). Forexample, CH4 emitted at a higher rate from sedge-rich station 2 at Blaen Fign has δ13Cvalues that are statistically indistinguishable from CH4 emissions from Sphagnum-richstation 1 (Bowes and Hornibrook, 2006). The δ13C composition of CH4 emissions from10
both plots are 13C-depleted by ∼15 to 20‰ relative to pore water CH4, which eliminatesthe possibility that the small quantities of CH4 emitted from station 1 is residual CH4that has survived transit across the unsaturated zone (Happell et al., 1994; Popp et al.,1999). Similarly, CH4 emissions from Cors Caron, Crymlyn Bog and Gors Lywd alsoare 13C-depleted relative to the pore water CH4 pool (Hornibrook and Bowes, 2007).15
These conclusions about transport processes based upon stable isotope data are con-sistent with the observation reported here that low affinity methanotrophs in the 3 cmthick zone where CH4 first appears in the pore water pool (i.e., immediately below thedepth [CH4]0) have a capacity for CH4 consumption that significantly exceeds the up-ward CH4 supply via pore water diffusion (Table 3). While low affinity methanotrophs20
appear to consume the bulk of CH4 transported along concentration gradients in porewater, they do not provide a robust barrier to CH4 flux from peatlands because ofthe prevalence of CH4 movement through vascular flora which bypasses the methan-otrophy filter. During June to August, microbial CH4 oxidation rates ranged from 0.8to 40.7% of total CH4 flux to the atmosphere in Crymlyn Bog and Gors Lywd; how-25
ever, the majority of values were <10%. In the same months, the percentages werehigher at sedge-poor plots at the ombrogeneous mires (Blaen Fign, ∼9.3 to 53.4%;Cors Caron, 11.0 to 21.1%), but the difference in proportions is unimportant becauseas indicated by δ13C data little or none of the diffusion transported CH4 contributed to
surficial emissions (Hornibrook and Bowes, 2007). Consequently, in the absence ofbacterial CH4 oxidation the CH4 flux rate from minerotrophic peatlands would not besignificantly greater in absolute terms but the increase would be proportionally muchlarger in ombrogenous bogs. The steady state flux rates of >100 mg CH4 m−2 d−1 com-monly observed from wetland soils (e.g., Whalen, 2005) would be difficult to achieve if5
pore water diffusion alone was the dominant transport mechanism of CH4. The bulk ofCH4 emitted from peatlands typically occurs via vascular flora and possibly ebullition,although data for the latter transport process remain sparse (Baird et al., 2004).
6 Conclusions
The depth below ambient water table levels at which dissolved methane is depleted10
to a concentration of ∼0µmol l−1 by methanotrophic activity varied widely betweenpeatlands and temporally within individual peatlands. Short-term precipitation eventsappeared to increase the depth to [CH4]0 without necessarily disturbing dissolved CH4profiles. In the absence of recent rainfall input, the depth of [CH4]0 below the water ta-ble level ranged from ∼5 to 10 cm, although the size of the interval diminished to 0 (i.e.,15
CH4 present at the water table surface) during prolonged periods without precipitationinput.
The capacity for methanotrophy in peatland soils from both minerotrophic and om-brogenous peatlands typically was greater than the available supply of upward diffusingCH4. Kinetic parameters (µm and Ks) describing the response of methanotroph popu-20
lations to substrate (i.e., CH4) concentrations are not constant with depth as assumedin some process models and both parameters were larger in the ombrogenous versusminerotrophic peatlands. Low affinity methanotrophic activity effectively consumes themajority of upward diffusing CH4 in peatland soil (in most cases 100%); however, in theabsence of bacterial CH4 oxidation the flux rate from minerotrophic peatlands would25
not be significantly greater. Maximum rates of CH4 flux by pore water diffusion were atmost 10 to 20 mg m−2 d−1, which in minerotrophic mires represents typically <10% of
actual emissions. The generally lower CH4 emission rates from ombrogeneous mireswould be impacted more by cessation or attentuation of methanotrophy activity but CH4
flux rates would still amount to only a few 10 s of mg m−2 d−1.
Acknowledgements. We thank Mike Dury for manufacturing flux chambers and pore waterequilibrators. HLB was supported by an NERC postgraduate scholarship and AVGS by a5
NERC Industrial CASE scholarship. This study was funded by NERC (NER/B/S/2000/00076)and Royal Society (574006.G503/21832/SM) grants to ERCH. The UK Joint Higher EducationFunding Council for England and Office of Science and Technology Science Research Invest-ment Fund (SRIF), and the University of Bristol are thanked for infrastructure funding. We thankthe British Atmospheric Data Centre (BADC) for technical advice and permission to use daily10
precipitation data from Met Office weather stations in Wales.
References
Baird, A. J., Beckwith, C. W., Waldron, S., and Waddington, J. M.: Ebullition of methane-containing gas bubbles from near-surface sphagnum peat, Geophys. Res. Lett., 31, L21505,doi:10.1029/2004GL021157, 2004.15
Basiliko, N., Blodau, C., Roehm, C., Bengtson, P., and Moore, T. R.: Regulation of decom-position and methane dynamics across natural, commercially mined, and restored northernpeatlands, Ecosystems, 10, 1148–1165, 2007.
Beckmann, M. and Lloyd, D.: Mass spectrometric monitoring of gases (CO2, CH4, O2) ina mesotrophic peat core from Kopparas Mire, Sweden, Global Change Biol., 7, 171–180,20
2001.Berestovskaya, Y. Y., Rusanov, I. I., Vasil’eva, L. V., and Pimenov, N. V.: The processes of
methane production and oxidation in the soils of the Russian arctic tundra, Microbiology, 74,221–229, 2005.
Boon, P. I. and Lee, K.: Methane oxidation in sediments of a floodplain wetland in south-eastern25
australia, Lett. Appl. Microbiol., 25, 138–142, 1997.Bowes, H. L. and Hornibrook, E. R. C.: Emision of highly 13C-depleted methane from an upland
blanket mire, Geophys. Res. Lett., 33, L04401, doi:10.1029/2005GL025209, 2006.Calhoun, A. and King, G. M.: Characterization of root-associated methanotrophs from three
Chen, Y., Dumont, M. G., McNamara, N. P., Chamberlain, P. M., Bodrossy, L., Stralis-Pavese,N., and Murrell, J. C.: Diversity of the active methanotrophic community in acidic peatlandsas assessed by mRNA and SIP-PLFA analyses, Environ. Microbiol., 10, 446–459, 2008.5
Dedysh, S. N.: Methanotrophic bacteria of acidic sphagnum peat bogs, Microbiology, 71, 638–650, 2002.
Dedysh, S. N., Derakshani, M., and Liesack, W.: Detection and enumeration of methanotrophsin acidic sphagnum peat by 16s rRNA fluorescence in situ hybridization, including the useof newly developed oligonucleotide probes for Methylocella palustris, Appl. Environ. Microb.,10
67, 4850–4857, 2001.Dedysh, S. N., Dunfield, P. F., Derakshani, M., Stubner, S., Heyer, J., and Liesack, W.: Differ-
ential detection of type II methanotrophic bacteria in acidic peatlands using newly developed16s rRNA-targeted fluorescent oligonucleotide probes, FEMS Microbiol. Ecol., 43, 299–308,2003.15
Dise, N. B. and Verry, E. S.: Suppression of peatland methane emission by cumulative sulfatedeposition in simulated acid rain, Biogeochemistry, 53, 143–160, 2001.
Edwards, C., Hales, B. A., Hall, G. H., McDonald, I. R., Murrell, J. C., Pickup, R., Ritchie, D.A., Saunders, J. R., Simon, B. M., and Upton, M.: Microbiological processes in the terrestrialcarbon cycle: Methane cycling in peat, Atmos. Environ., 32, 3247–3255, 1998.20
Gauci, V., Dise, N., and Fowler, D.: Controls on suppression of methane flux from a peatbog subjected to simulated acid rain sulfate deposition, Global Biogeochem. Cy., 16, 1004,doi:10.1029/2000GB001370, 2002.
Gauci, V., Matthews, E., Dise, N., Walter, B., Koch, D., Granberg, G., and Vile, M.: Sulfurpollution suppression of the wetland methane source in the 20th and 21st centuries, P. Natl.25
Acad. Sci. USA, 101, 12 583–12 587, 2004.Gutknecht, J. L. M.: Linking soil process and microbial ecology in freshwater wetland ecosys-
tems, Plant Soil, 289, 17–34, 2006.Happell, J. D., Chanton, J. P., and Showers, W. S.: The influence of methane oxidation on
the stable isotopic composition of methane emitted from florida swamp forests, Geochim.30
Cosmochim. Ac., 58, 4377–4388, 1994.Hesslein, R. H.: An in situ sampler for close interval pore water studies, Limnol. Oceanogr.,
Hornibrook, E. R. C. and Bowes, H. L.: Trophic status impacts both the magnitude and sta-ble carbon isotope composition of methane flux from peatlands, Geophys. Res. Lett., 34,L21401, doi:10.1029/2007GL031231, 2007.
Joabsson, A. and Christensen, T. R.: Methane emissions from wetlands and their relationshipwith vascular plants: An arctic example, Global Change Biol., 7, 919–932, 2001.5
Joabsson, A., Christensen, T. R., and Wallen, B.: Vascular plant controls on methane emissionsfrom northern peatforming wetlands, Trends Ecol. Evol., 14, 385–388, 1999.
Kettunen, A.: Connecting methane fluxes to vegetation cover and water table fluc-tuations at microsite level: A modeling study, Global Biogeochem. Cy., 17, 1051,doi:10.1029/2002GB001958, 2003.10
Kettunen, A., Kaitala, V., Alm, J., Silvola, J., Nykanen, H., and Martikainen, P. J.: Cross-correlation analysis of the dynamics of methane emissions from a boreal peatland, GlobalBiogeochem. Cy., 10, 457–471, 1996.
Kettunen, A., Kaitala, V., Lehtinen, A., Lohila, A., Alm, J., Silvola, J., and Martikainen, P. J.:Methane production and oxidation potentials in relation to water table fluctuations in two15
boreal mires, Soil Biol. Biochem., 31, 1741–1749, 1999.King, G. M.: Dynamics and controls of methane oxidation in a danish wetland sediment, FEMS
Microbiol. Ecol., 74, 309–323, 1990.King, G. M.: Associations of methanotrophs with the roots and rhizomes of aquatic vegetation,
Appl. Environ. Microb., 60, 3220–3227, 1994.20
King, G. M.: In situ analyses of methane oxidation associated with the roots and rhizomes ofa bur reed, sparganium eurycarpum, in a maine wetland, Appl. Environ. Microb., 62, 4548–4555, 1996.
Kreuzer-Martin, H. W.: Stable isotope probing: Linking functional activity to specific membersof microbial communities, Soil Sci. Soc. Am. J., 71, 611–619, 2007.25
Krumholz, L. R., Hollenback, J. L., Roskes, S. J., and Ringelberg, D. B.: Methanogenesis andmethanotrophy within a sphagnum peatland, FEMS Microbiol. Ecol., 18, 215–224, 1995.
Le Mer, J. and Roger, P.: Production, oxidation, emission and consumption of methane by soils:A review, Eur. J. Soil Biol., 37, 25–50, 2001.
Lerman, A.: Geochemical processes: Water and sediment environments, John Wiley & Sons,30
New York, 481 pp., 1979.McAullife, C.: GC determination of solutes by multiple phase equilibration, Chem. Technol., 1,
McDonald, I. R., Hall, G. H., Pickup, R. W., and Murrell, J. C.: Methane oxidation potential andpreliminary analysis of methanotrophs in blanket bog peat using molecular ecology tech-niques, FEMS Microbiol. Ecol., 21, 197–211, 1996.
McDonald, I. R., Upton, M., Hall, G., Pickup, R. W., Edwards, C., Saunders, J. R., Ritchie, D.A., and Murrell, J. C.: Molecular ecological analysis of methanogens and methanotrophs in5
blanket bog peat, Microb. Ecol., 38, 225–233, 1999.McDonald, I. R., Radajewski, S., and Murrell, J. C.: Stable isotope probing of nucleic acids in
methanotrophs and methylotrophs: A review, Org. Geochem., 36, 779–787, 2005.Megonigal, J. P. and Schlesinger, W. H.: Methane-limited methanotrophy in tidal freshwater
swamps, Global Biogeochem. Cy., 16, 1088, doi:10.1029/2001GB001594, 2002.10
Mikaloff Fletcher, S. E., Tans, P. P., Bruhwiler, L. M., Miller, J. B., and Heimann, M.: CH4 sourcesestimated from atmospheric observations of CH4 and its 13C/12C isotopic ratios: 2. Inversemodeling of CH4 fluxes from geographical regions, Global Biogeochem. Cy., 18, GB4005,doi:10.1029/2004GB002224, 2004.
Mikkela, C., Sundh, I., Svensson, B. H., and Nilsson, M.: Diurnal variation in methane emission15
in relation to the water-table, soil temperature, climate and vegetation cover in a swedishacid mire, Biogeochemistry, 28, 93–114, 1995.
Miller, D. N., Yavitt, J. B., Madsen, E. L., and Ghiorse, W. C.: Methanotrophic activity, abun-dance, and diversity in forested swamp pools: Spatiotemporal dynamics and influences onmethane fluxes, Geomicrobiol. J., 21, 257–271, 2004.20
Morris, S. A., Radajewski, S., Willison, T. W., and Murrell, J. C.: Identification of the functionallyactive methanotroph population in a peat soil microcosm by stable-isotope probing, Appl.Environ. Microb., 68, 1446–1453, 2002.
Oquist, M. G. and Svensson, B. H.: Vascular plants as regulators of methane emissions from asubarctic mire ecosystem, J. Geophys. Res., 107, 4580, doi:10.1029/2001JD001030, 2002.25
Pearce, D. M. E., and Clymo, R. S.: Methane oxidation in a peatland core, Global Biogeochem.Cy., 15, 709-720, 2001.
Popp, T. J., Chanton, J. P., Whiting, G. J., and Grant, N.: Methane stable isotope distributionat a carex dominated fen in north central alberta, Global Biogeochem. Cy., 13, 1063–1077,1999.30
Popp, T. J., Chanton, J. P., Whiting, G. J., and Grant, N.: Evaluation of methane oxidation in therhizosphere of a carex dominated fen in north central alberta, canada, Biogeochemistry, 51,259–281, 2000.
Ritchie, D. A., Edwards, C., McDonald, I. R., and Murrell, J. C.: Detection of methanogens andmethanotrophs in natural environments, Global Change Biol., 3, 339–350, 1997.
Roslev, P. and King, G. M.: Regulation of methane oxidation in a freshwater wetland by watertable changes and anoxia, FEMS Microbiol. Ecol., 19, 105–115, 1996.
Roulet, N. T., Ash, R., Quinton, W., and Moore, T.: Methane flux from drained northern peat-5
lands: Effect of a persistent water table lowering on flux, Global Biogeochem. Cy., 7, 749–769, 1993.
Schipper, L. A. and Reddy, K. R.: Determination of methane oxidation in the rhizosphere ofSagittaria lancifolia using methyl fluoride, Soil Sci. Soc. Am. J., 60, 611–616, 1996.
Segers, R.: Methane production and methane consumption: A review of processes underlying10
wetland methane fluxes, Biogeochemistry, 41, 23–51, 1998.Shannon, R. D., White, J. R., Lawson, J. E., and Gilmour, B. S.: Methane efflux from emergent
vegetation in peatlands, J. Ecol., 84, 239–246, 1996.Strom, L. and Christensen, T. R.: Below ground carbon turnover and greenhouse gas ex-
changes in a sub-arctic wetland, Soil Biol. Biochem., 39, 1689–1698, 2007.15
Strom, L., Mastepanov, M., and Christensen, T. R.: Species-specific effects of vascular plantson carbon turnover and methane emissions from wetlands, Biogeochemistry, 75, 65–82,2005.
Sundh, I., Nilsson, M., Granberg, G., and Svensson, B. H.: Depth distribution of microbialproduction and oxidation of methane in northern boreal peatlands, Microb. Ecol., 27, 253–20
265, 1994.Sundh, I., Borga, P., Nilsson, M., and Svensson, B. H.: Estimation of cell numbers of methan-
otrophic bacteria in boreal peatlands based on analysis of specific phospholipid fatty acids,FEMS Microbiol. Ecol., 18, 103–112, 1995.
Sundh, I., Nilsson, M., and Borga, P.: Variation in microbial community structure in two bo-25
real peatlands as determined by analysis of phospholipid fatty acid profiles, Appl. Environ.Microb., 63, 1476–1482, 1997.
Tokida, T., Miyazaki, T., Mizoguchi, M., Nagata, O., Takakai, F., Kagemoto, A., and Hatano,R.: Falling atmospheric pressure as a trigger for methane ebullition from peatland, GlobalBiogeochem. Cy., 21, GB2003, doi:10.1029/2006GB002790, 2007a.30
Tokida, T., Mizoguchi, M., Miyazaki, T., Kagemoto, A., Nagata, O., and Hatano, R.: Episodicrelease of methane bubbles from peatland during spring thaw, Chemosphere, 70, 165–171,2007b.
van der Nat, F. J. W. A. and Middelburg, J. J.: Seasonal variation in methane oxidation by therhizosphere of phragmites australis and scirpus lacustris, Aquat. Bot., 61, 95–110, 1998.
Walter, B. P., Heimann, M., and Matthews, E.: Modeling modern methane emissions fromnatural wetlands 1. Model description and results, J. Geophys. Res., 106, 34 189–34 206,2001.5
Wartiainen, I., Hestnes, A. G., and Svenning, M. M.: Methanotrophic diversity in high arctic wet-lands on the islands of Svalbard (Norway) – denaturing gradient gel electrophoresis analysisof soil DNA and enrichment cultures, Can. J. Microbiol., 49, 602–612, 2003.
Watson, A., Stephen, K. D., Nedwell, D. B., and Arah, J. R. M.: Oxidation of methane in peat:Kinetics of CH4 and O2 removal and the role of plant roots, Soil Biol. Biochem., 29, 1257–10
1267, 1997.Whalen, S. C.: Biogeochemistry of methane exchange between natural wetlands and the at-
mosphere, Environ. Eng. Sci., 22, 73–94, 2005.Whalen, S. C. and Reeburgh, W. S.: Methane oxidation, production, and emission at contrasting
sites in a boreal bog, Geomicrobiol. J., 17, 237–251, 2000.15
Table 1. Sites, wetland types, locations and pore water pH (Hornibrook and Bowes, 2007).
Site Wetland Type Latitude Longitude Altitude pHb
(m a.s.l.)a
Crymlyn Bog intermediate fen 51◦38′11′′ N 03◦53′18′′ W 9 5.5±0.5 (n=20)Gors Lywd upland valley mire 52◦15′44′′ N 03◦34′44′′ W 385 4.9±0.6 (n=20)Blaen Fign blanket bog 52◦15′44′′ N 03◦34′44′′ W 504 4.2±0.3 (n=20)Cors Caron raised bog 52◦15′24′′ N 03◦55′00′′ W 160 4.2±0.1 (n=20)
a m a.s.l. = meters above sea levelb Mean pore water pH ± standard deviation (1σ; n=# of measurements) from 5 to 45 cm depthfor May to August 2003.
Cors Caron7 May 2003 5.3±1.3 59.3 4.8±2.4 8.1±0.8 63.4 0.3±0.117 Jun 2003 1.5±0.1e 35.6 8.8±3.2 1.4±0.0 34.5 12.2±2.414 Jul 2003 2.3±0.6 15.1 11.8±4.2 1.3±0.4e 5.3 10.1±3.625 Aug 2003 2.0±0.2 34.9 18.2±7.7 2.7±0.5 32.3 12.8±4.3
a The ground surface at station 1 contained a greater abundance of Sphagnum and fewer vascular species than station2 at Crymlyn Bog and Blaen Fign.b Rates of internal CH4 flux into the zone of methanotrophy based upon Fick’s 1st law (Eq. 2) and linear regressionanalysis of pore water CH4 data shown in Figs. 2 to 5.c Potential rate of CH4 oxidation in a 3 cm thick zone below the depth at which [CH4]=0µmol l−1 defined by the y-intercept of linear regression analysis of pore water CH4 concentration data in Figs. 2 to 5. The total potential rate ofCH4 oxidation in the 3 cm thick zone is based upon actual CH4 concentrations measured in peat soils and the depthdistribution of µm and Ks parameters determined experimentally for Crymlyn Bog and Cors Caron (Table 2).d Total diffusive CH4 flux to the atmosphere measured using closed dynamic chambers and reported previously inBowes and Hornibrook (2006) and Hornibrook and Bowes (2007).e The concentration of dissolved CH4 in pore water at the subsurface air-water interface was >0µmol l−1 on thesedays.
Table 4. Equations for linear regression curves in Fig. 7.
Site Station 1 Station 2
Crymlyn Bog y = −0.41 x + 5.13 (r2=0.98) y = −0.22 x − 2.95 (r2=0.29)Gors Lywd y = 0.86 x + 9.17 (r2=0.94) y = 0.68 x + 11.05 (r2=0.81)Blaen Fign y = 0.74 x + 5.45 (r2=0.91) y = 0.62 x + 4.77 (r2=0.40)Cors Caron y = 2.03 x − 0.29 (r2=0.61)a y = 0.71 x + 5.06 (r2=0.07)b
a Exclusion of 17 June 2003 data point yields y=1.61+3.01 (r2=0.84).b Exclusion of the 25 August 2003 data point yields y=1.61−1.29 (r2=0.99).
Fig. 1. Locations of peatland study sites and Met Office MIDAS Land Surface ObservationStations (MOS = Met Office Station) in Wales, UK. Details of the four peatlands are providedin Table 1, including map coordinates.
Fig. 2. Sample collection dates at Crymlyn Bog (CB1 27.5.03; CB2 2.7.03; CB3 28.7.03; CB419.8.03), Cors Caron (CC1 7.5.03; CC2 17.6.03; CC3 14.7.03; CC4 25.8.03), Blaen Fign (BF130.4.03; BF2 4.6.03; BF3 8.7.03; BF4 5.8.03; BF5 2.9.03), and Gors Lywd (GL1 19.5.03; GL224.6.03; GL3 23.7.03; GL4 11.8.03) and daily precipitation amounts for 2003 from Met OfficeMIDAS Land Surface Observation Stations at Swansea Victoria Park (src id 1257; 51◦36′43′′ N,03◦57′43′′ W; 8 m a.s.l.), Swyddffynnon (src id 1204; 52◦16′19′′ N, 03◦54′54′′ W; 168 m a.s.l.),Cwmystwyth (src id 1211; 52◦21′29′′ N, 03◦48′07′′ W; 301 m a.s.l.), and Llangurig (src id 10432;52◦24′14′′ N, 03◦36′22′′ W; 273 m a.s.l.).
Fig. 3. Pore water profilesof dissolved CH4 measured atCrymlyn Bog during the sum-mer of 2003 from pore waterequilibrators E1 and E2. Water-table level in each panel is indi-cated by a dotted horizontal line.The dashed line through shallowCH4 values trending to zero con-centration is a regression linefitted to the data to determinethe gradient d [CH4]/dz, whichwas used to calculate rates ofCH4 flux into the methanotrophiczone.
Fig. 4. Pore water profiles of dis-solved CH4 measured at GorsLywd during the summer of 2003from pore water equilibrators E1and E2. Water-table level ineach panel is indicated by a dot-ted horizontal line. The dashedline through shallow CH4 val-ues trending to zero concentra-tion is a regression line fitted tothe data to determine the gradi-ent d [CH4]/dz, which was usedto calculate rates of CH4 flux intothe methanotrophic zone.2640
Fig. 5. Pore water profiles of dis-solved CH4 measured at BlaenFign during the summer of 2003from pore water equilibrators E1and E2. Water-table level ineach panel is indicated by a dot-ted horizontal line. The dashedline through shallow CH4 val-ues trending to zero concentra-tion is a regression line fitted tothe data to determine the gradi-ent d [CH4]/dz, which was usedto calculate rates of CH4 flux intothe methanotrophic zone.2641
Fig. 6. Pore water profilesof dissolved CH4 measured atCors Caron during the summerof 2003 from pore water equi-librators E1 and E2. Water-table level in each panel is indi-cated by a dotted horizontal line.The dashed line through shallowCH4 values trending to zero con-centration is a regression linefitted to the data to determinethe gradient d [CH4]/dz, whichwas used to calculate rates ofCH4 flux into the methanotrophiczone.
0 10 20 30 0 10 20 30Cumulative precipitation 3 days prior to sampling (mm)
Dis
tan
ce fr
om
WT
leve
l to
dep
th o
f 0 μ
mo
l l-1
CH
4 (c
m)
y
dep
th
[CH4]
WT
(a) station 1 (b) station 2
Fig. 7. Distance from water table surface to depth of nil CH4 concentration plotted against thecumulative amount of precipitation from the 3-day period prior to collection of the pore waterCH4 samples. The y-axis parameter is explained graphically in the inset to panel (a). Y-axisdata in panels (a) and (b) are from stations 1 and 2, respectively, at each peatland. The symbolscorrespond to Crymlyn Bog (squares), Cors Caron (triangles), Blaen Fign (circles), and GorsLywd (diamonds). Filled symbols represent times when [CH4] was >0µmol l−1 at the air-waterinterface. Precipitation data (shown in Fig. 2) were taken from Swansea Victoria Park (src id1257) for Crymlyn Bog, Swyddffynnon (src id 1204) for Cors Caron, and Cwmystwyth (src id1211) for Blaen Fign and Gors Lywd. The dashed lines are linear regression analysis curvesfitted to the data for each peatland. The equations for the eight regression lines are listed inTable 4.