Method 542: Determination of Pharmaceuticals and Personal Care Products in Drinking Water by Solid Phase Extraction and Liquid Chromatography Electrospray Ionization Tandem Mass Spectrometry (LC/ESI-MS/MS)
Transcript
Method 542: Determination of Pharmaceuticals and Personal Care Products in Drinking Water by Solid Phase Extraction and Liquid Chromatography Electrospray Ionization Tandem Mass Spectrometry (LC/ESI-MS/MS)
542-i
Questions concerning this document should be addressed to: Steven C. Wendelken, Ph.D. U.S. EPA, OGWDW/SRMD/TSC, 26 W. Martin Luther King Dr. Cincinnati, OH 45268 Phone: (513) 569-7491 [email protected]
Office of Water (MS-140) EPA 815-R-15-012 September 2016
542-ii
Acknowledgements The following people are acknowledged for their support in development of the method: Ali Haghani, Eurofins Eaton Analytical Andrew Eaton, Ph.D., Eurofins Eaton Analytical Brett Vanderford, Southern Nevada Water Authority Joe Weitzel, Agilent Joshua Whitaker, Eurofins Eaton Analytical (UL) Matthew Noesthden, Vogon Laboratory Services Michael Thurman, University of Colorado Ralph Hindle, Vogon Laboratory Services Yongtao (Bruce) Li, Ph.D., Eurofins Eaton Analytical (UL)
542-iii
Table of Contents Acknowledgements ................................................................................................................................................... ii 1 Scope and Application .......................................................................................................................................1
2 Summary of Method ..........................................................................................................................................2
6 Equipment and Supplies ....................................................................................................................................5
7 Reagents and Standards .....................................................................................................................................6
8 Sample Collection, Preservation, and Storage ................................................................................................. 10
9 Quality Control ................................................................................................................................................ 10
10 Calibration and Standardization ....................................................................................................................... 16
12 Data Analysis and Calculations ....................................................................................................................... 20
17 Tables, Diagrams, Flowcharts, and Validation Data ....................................................................................... 23
542-1
1 Scope and Application
1.1 Method Method 542 is a liquid chromatography, electrospray ionization, tandem mass spectrometry (LC/ESI-MS/MS) method for the determination of pharmaceuticals and personal care products (PPCP) in finished drinking water. Method 542 requires the use of MS/MS in Multiple Reaction Monitoring (MRM) mode to enhance selectivity. This method is intended for use by analysts skilled in the performance of solid phase extractions (SPE), the operation of LC/ESI-MS/MS instrumentation, and the interpretation of the associated data.
1.2 Analyte List Method 542 is applicable for the measurement of the following analytes:
Analyte Chemical Abstracts Services Registry Number (CASRN)
1.2.1.1 Enalapril Enalapril exists in solution as a mixture of cis and trans conformers around an amide bond; conformational transition between the two conformers is slow. For this reason, enalapril exhibits broad, non-Gaussian chromatographic peak shape1 as seen in Figure 1. The analytical conditions employed to collect the method performance data in our laboratory (Sect. 17) produce an enalapril signal that is reproducible and quantifiable. Alternate conditions, which optimized enalapril chromatography, negatively affected the chromatography of the other analytes.
1.2.1.2 Erythromycin–H2O Erythromycin can exist in environmental samples as the dehydrated spiro ketal species erythromycin–H2O.2 Also, due to the acidic preservation techniques used in this method, any unreacted erythromycin present in samples will subsequently be transformed into the dehydrated species. For the purposes of this method, erythromycin is measured as erythromycin–H2O and the MRM transition is optimized for erythromycin–H2O. Users of the method must prepare erythromycin–H2O from erythromycin following the procedure in Section 7.2.3.1.
1.3 Supporting Data
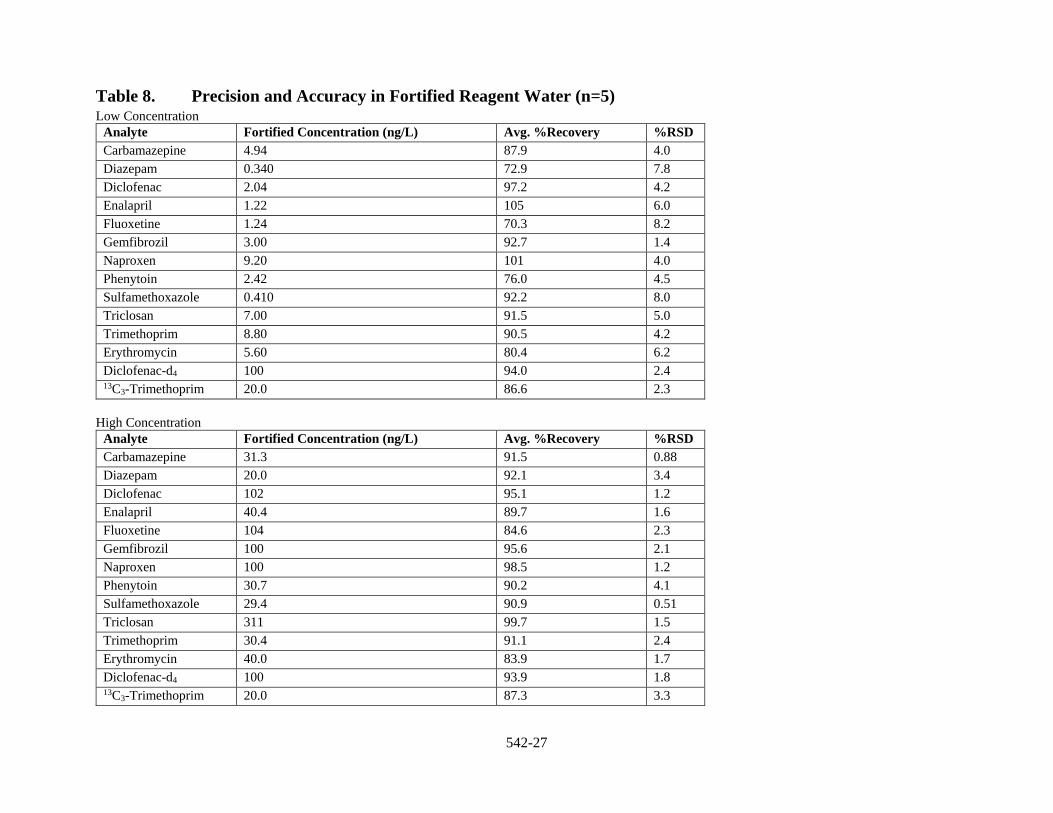
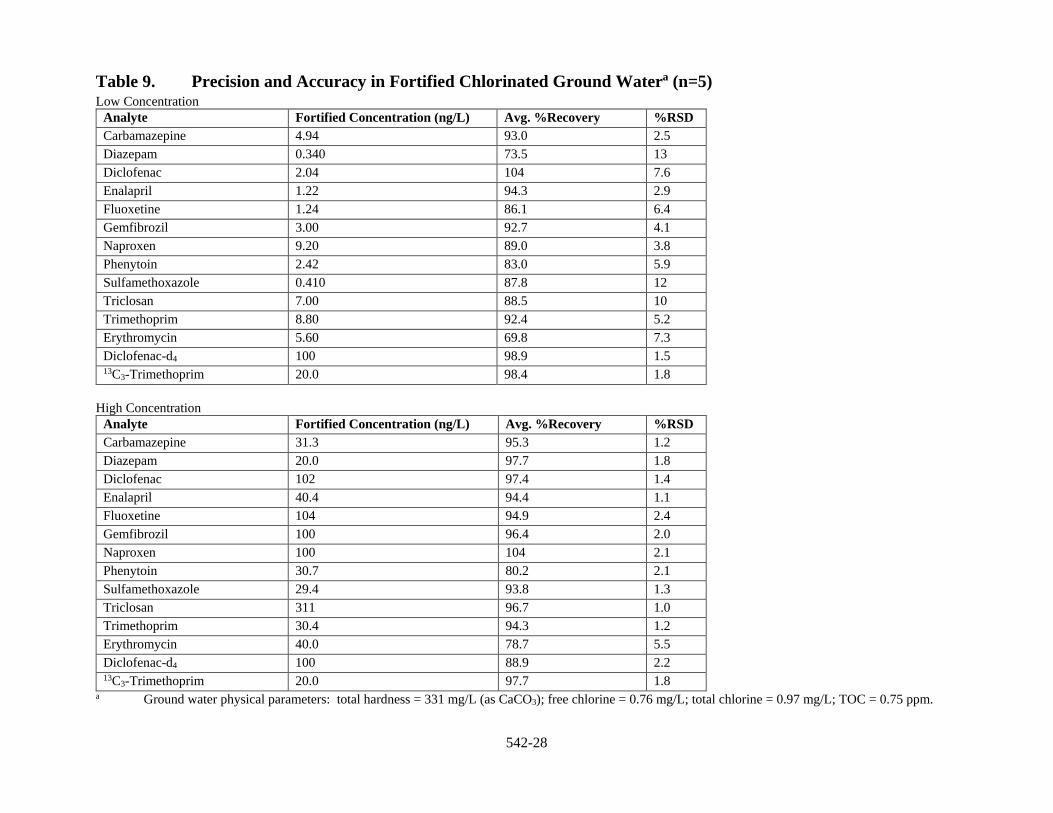
1.3.1 Precision and Accuracy Precision and accuracy data have been generated for the method analytes in reagent water and finished drinking water from both ground water and surface water sources (Sect. 17, Tables 8 to 10).
542-2
1.3.2 Single Laboratory Lowest Concentration Minimum Reporting Levels Single laboratory lowest concentration minimum reporting levels (LCMRLs) for the analytes in this method ranged from 0.27 to 5.0 nanograms per liter (ng/L) (Sect. 17, Table 7). The LCMRL is the lowest spiking concentration such that the probability of spike recovery in the 50% to 150% range is at least 99%. The procedure used to determine the LCMRL is described elsewhere.3 Laboratories using this method are not required to determine LCMRLs, but they must demonstrate that the Minimum Reporting Level (MRL) for each analyte meets the requirements described in Section 9.1.4.
1.4 Method Flexibility The laboratory is permitted to select LC columns, LC conditions, and MS conditions different from those used to develop the method. The internal and surrogate standards prescribed in this method must be used; however, the user may add additional internal or surrogate standards. Changes may not be made to sample collection and preservation (Sect. 8), the quality control (QC) requirements (Sect. 9), or the extraction and elution steps (Sect. 11). Automated SPE may be used, but the sorbent type and mass outlined in the method must be used; and cartridge washing, conditioning, extraction and elution total volumes cannot be changed. Single quadrupole instruments are not permitted. Method modifications should be considered only to improve method performance. Modifications that are considered in the interest of reducing cost or sample processing time, but result in poorer method performance, may not be used. Analytes should have sufficient chromatographic resolution to allow the mass spectrometer to acquire a minimum of 10 scans across a chromatographic peak. When method modifications are made, the analyst must perform the procedures outlined in the Initial Demonstration of Capability (IDC, Sect. 9.1) and verify that all QC acceptance criteria in the method (Sect. 17, Tables 13 and 14) are met. Additionally, the analyst must verify method performance in a representative sample matrix (Sect. 9.3.2).
2 Summary of Method One liter drinking water samples are added to bottles containing ascorbic acid (dechlorinating agent), ethylenediaminetetraacetic acid trisodium salt (metal-hydrolysis inhibitor), and potassium citrate monobasic (microbial inhibitor). Samples are fortified with surrogates and passed through SPE cartridges containing hydrophilic–lipophilic balanced (HLB) copolymer sorbent in order to extract method analytes and surrogates. The compounds are eluted from the solid phase with 5 mL of methanol/acetone (1:1). Internal standards are added, and the extracted sample is brought to 10 mL with reagent water. An aliquot of the sample is injected into an LC equipped with a C18 analytical column that is interfaced to an MS/MS. The analytes are separated and identified by comparing retention times and signals produced by unique mass transitions to retention times and reference signals for matrix-matched calibration standards acquired under identical LC-MS/MS conditions. The concentration of each analyte is determined using the integrated peak area and internal standard technique.
3 Definitions Analysis Batch – A set of samples that is analyzed on the same instrument during a 24-hour period that begins and ends with the analysis of the appropriate Continuing Calibration Check (CCC) standards. Additional CCCs may be required depending on the length of the analysis batch and the number of field samples.
Calibration Standard – A solution of the method analytes, surrogate analytes, and internal standards that is prepared from the Primary Dilution Standards. The calibration standards are used to calibrate the instrument response with respect to analyte concentration.
Continuing Calibration Check (CCC) – A calibration standard that is analyzed periodically to verify the accuracy of the existing calibration.
Extraction Batch – A set of up to 20 field samples (not including QC samples) that is extracted by the same person(s) during a work day using the same lot of solid phase extraction devices, solvents, surrogate solution, and fortifying solutions. Required QC samples include a Laboratory Reagent Blank, a Laboratory Fortified Blank, a
542-3
Laboratory Fortified Sample Matrix, and either a Field Duplicate or a Laboratory Fortified Sample Matrix Duplicate.
Field Duplicates (FD) – Separate samples that are collected at the same time, shipped, and stored under identical conditions. Method precision, including the contribution from sample collection procedures, is estimated from the analysis of FDs. For the purposes of this method, Field Duplicates are necessary to conduct repeat analyses if the original field sample is lost, or to conduct repeat analyses in the case of QC failures associated with the analysis of the original field sample. Field Duplicates are used to prepare Laboratory Fortified Sample Matrix and Laboratory Fortified Sample Matrix Duplicate QC samples.
Internal Standard (IS) – A pure compound that is added to all standard solutions and sample extracts in a known amount and used to measure the relative response of other method analytes that are components of the same solution. The internal standard must respond similarly to the method analytes, have no potential to be present in water samples, and not be a method analyte.
Ion Suppression/Enhancement – An observable decrease or increase in analyte response in complex (field) samples as compared to the response obtained in standard solutions.
Laboratory Fortified Blank (LFB) – A volume of reagent water, containing method preservatives, to which known quantities of the method analytes are added. The LFB is used during the IDC (Sect. 9.1) to verify method performance for precision and accuracy. The LFB is also a required QC element with each extraction batch. The results of the extracted LFB verify method performance in the absence of sample matrix.
Laboratory Fortified Sample Matrix (LFSM) – A field sample containing preservatives to which known quantities of the method analytes are added in the laboratory. The LFSM is processed and analyzed as a sample, and its purpose is to determine whether the sample matrix contributes bias to the analytical results.
Laboratory Fortified Sample Matrix Duplicate (LFSMD) – A Field Duplicate of the sample used to prepare the LFSM which is fortified and analyzed identically to the LFSM. The LFSMD is used instead of the Field Duplicate to assess method precision when the method analytes are rarely found at concentrations greater than the MRL.
Laboratory Reagent Blank (LRB) – A volume of reagent water that is processed exactly as a sample including exposure to all glassware, equipment, solvents and reagents, sample preservatives, surrogate standards, and internal standards that are used in the extraction and analysis batches. The LRB is used to determine if the method analytes or other interferences are present in the laboratory environment, the reagents, or the apparatus.
Lowest Concentration Minimum Reporting Level (LCMRL) – The lowest true concentration for which the future recovery is predicted to fall between 50% to 150% with 99% confidence.3
Material Safety Data Sheets (MSDS) – Written information provided by vendors concerning a chemical’s toxicity, health hazards, physical properties, fire and reactivity data, storage instructions, spill response procedures, and handling precautions.
Matrix-Matched Calibration Standard – A calibration standard that is prepared by adding method analytes to a concentrated extract of a matrix (reagent water is used for this method) that has been prepared following all the extraction and sample preparation steps of the analytical method. The material extracted from the matrix reduces matrix-induced response effects and improves the quantitative accuracy of the sample results.
Minimum Reporting Level (MRL) – The minimum concentration that can be reported by a laboratory. This concentration must meet the criteria defined in Section 9.1.4 and must be no lower than the concentration of the lowest calibration standard for each method analyte.
542-4
Multiple Reaction Monitoring (MRM) – A mass spectrometric technique in which a precursor ion is first isolated, then subsequently fragmented into a product ion(s). Quantitation is accomplished by monitoring a specific product ion. As described in Section 10.1.2, MS parameters must be optimized for each precursor ion and product ion.
Precursor Ion – The gas-phase species corresponding to the method analyte produced in the ESI interface. In MS/MS, the precursor ion is mass selected and fragmented by collision-activated dissociation to produce distinctive product ions of smaller mass/charge (m/z) ratio.
Primary Dilution Standard (PDS) – A solution that contains the method analytes, internal standards, or surrogate analytes and is prepared from Stock Standard Solutions. A PDS solution is diluted to prepare calibration standards and sample fortification solutions.
Product Ion – One of the fragment ions that is produced in MS/MS by collision-activated dissociation of the precursor ion.
Quality Control Sample (QCS) – A solution containing the method analytes at a known concentration that is obtained from a source external to the laboratory and different from the source of calibration standards. The purpose of the QCS is to verify the accuracy of the primary calibration standards.
Reagent Water – Purified water that does not contain any measurable quantity of the method analytes or interfering compounds at or above 1/3 the MRL.
Stock Standard Solution – A concentrated standard solution that is prepared in the laboratory using assayed reference materials or that is purchased from a commercial source with a certificate of analysis.
Surrogate Analyte (SUR) – A pure chemical which is unlikely to be found in any sample and which is added to a sample aliquot in a known amount before extraction. Surrogates are measured using the same procedures as other sample components. Because surrogates are present in every sample, they provide a means of assessing method performance for each sample extraction.
4 Interferences
4.1 Clean Glassware All glassware must be meticulously cleaned. Wash glassware with detergent and tap water, rinse with tap water, followed by reagent water. Non-volumetric glassware can be heated in a muffle furnace at 400 oC for two hours or solvent rinsed. Volumetric glassware should be solvent rinsed and allowed to air dry.
4.2 Reagent and Equipment Interferences Method interferences may be caused by contaminants in solvents, reagents (including reagent water), sample bottles and caps, and other sample processing hardware. These interferences may lead to discrete artifacts or elevated baselines in the chromatograms. All laboratory reagents and equipment must be routinely demonstrated to be free from interferences (less than 1/3 the MRL for the target analytes) under the conditions of the analysis. This may be accomplished by analyzing LRBs as described in Section 9.2.1.
4.3 Matrix Interferences Matrix interferences may be caused by contaminants that are co-extracted from the sample. The extent of matrix interferences will vary considerably from source to source depending upon the nature of the water. Matrix components may directly interfere by producing a signal at or near the retention time of an analyte peak. Humic material from environmental samples can be co-extracted during SPE and can cause enhancement or suppression
542-5
in the electrospray ionization source. Total organic carbon (TOC) is an indicator of the humic content of a sample. Analysis of LFSMs (Sect. 9.2.6) provides evidence for the presence (or absence) of matrix effects.
4.4 Solid Phase Extraction Media Interferences Solid phase extraction media may be a source of interferences. The analysis of LRBs can provide important information regarding the presence or absence of such interferences. Each brand and lot of SPE devices should be tested to ensure that contamination does not preclude analyte identification and quantitation.
4.5 IS Purity Depending on the source and purity, labeled analogs used as internal and surrogate standards may contain a small percentage of the corresponding native analyte. Such a contribution may be significant when attempting to determine LCMRLs. The labeled internal and surrogate standards must meet the purity requirements stated in the IDC (Sect. 9.1).
5 Safety The toxicity or carcinogenicity of each reagent used in this method has not been precisely defined. Each chemical should be treated as a potential health hazard and exposure to these chemicals should be minimized. Each laboratory is responsible for maintaining an awareness of OSHA regulations regarding safe handling of chemicals used in this method. A reference file of MSDSs should be made available to all personnel involved in the analysis.
6 Equipment and Supplies References to specific brands or catalog numbers are included as examples only and do not imply endorsement of the product. Such reference does not preclude the use of other vendors or suppliers.
6.2 Autosampler Vials Amber glass vials with PTFE/silicone septa.
6.3 Micro Syringes Suggested sizes include 5, 10, 25, 50, 100, 250, 500, and 1000 microliters (µL).
6.4 Analytical Balance Capable of weighing to the nearest 0.0001 gram (g).
6.5 Disposable Pasteur Pipettes 5 ¾-inch or 9-inch borosilicate glass, used to transfer samples to autosampler vials and for sample preparation (Fisher Cat. No. 13-678-20B, 13-678-20C, or equivalent).
6.6 Solid Phase Extraction Apparatus for using SPE Cartridges
6.6.2 Vacuum SPE Manifold Designed to accommodate solid-phase extraction glassware and cartridges (Supelco Cat. No. 57030-U, or equivalent).
542-6
6.6.3 Sample Delivery System Delivery tube system (Supelco Visiprep Large Volume Sampler Cat No. 57275 or equivalent) to transfer sample directly from the sample container to the SPE cartridge. Sample reservoirs that attach to the cartridge may be used, although they hold only a limited volume of sample.
6.6.4 Graduated Collection Tubes 15-mL conical glass tubes with beaded rim (Pyrex No. 8080-15) suitable for collection of eluent from the solid phase cartridges.
6.7 Laboratory or Aspirator Vacuum System Sufficient capacity to maintain a vacuum of approximately 15 to 25 inches of mercury.
6.8 Liquid Chromatography Electrospray Ionization Tandem Mass Spectrometry System (LC/ESI-MS/MS)
6.8.1 LC System The LC system must provide consistent sample injection volumes and be capable of performing binary linear gradients at a constant flow rate.
6.8.2 Analytical Column The method was developed using a Waters Xterra MS C18 2.1 x 150 mm, 3.5 µm column (Waters Part No. 186000408). Any column that provides adequate resolution, peak shape, capacity, accuracy and precision (Sect. 9), and does not result in suppression or enhancement of analyte responses may be used.
6.8.3 Electrospray Ionization-Tandem Mass Spectrometer (ESI-MS/MS) The mass spectrometer must be capable of switching between negative ion and positive ion electrospray ionization modes. The system must be capable of performing MS/MS to produce unique product ions for the method analytes within specified retention time segments. A minimum of 10 scans across the chromatographic peak is needed to ensure adequate precision.
6.8.4 MS/MS Data System An interfaced data system is required to acquire, store and output MS data. The computer software must have the capability of processing stored data by recognizing a chromatographic peak within a given retention time window. The software must allow integration of the abundance of any specific ion between specified times or scan number limits. The software must be able to construct a linear regression or quadratic regression calibration curve and calculate analyte concentrations using the internal standard technique.
7 Reagents and Standards
7.1 Gases, Reagents and Solvents Reagent grade or better chemicals must be used. Unless otherwise indicated, all reagents will conform to the specifications of the Committee on Analytical Reagents of the American Chemical Society (ACS), where such specifications are available. Other grades may be used if the reagent is demonstrated to be free of analytes and interferences and all requirements of the IDC (Sect. 9.1) are met when using these reagents.
7.1.2 Ammonium Acetate, (CH3CO2NH4, CASRN 631-61-8) ≥99% for mass spectrometry (Sigma-Aldrich Cat. No. 73594, or equivalent). Added to eluent as a mobile phase modifier.
7.1.3 Collision Gas High purity compressed gas (e.g., nitrogen or argon) used in the collision cell of the mass spectrometer. The specific type of gas, purity, and pressure requirements will depend on the instrument manufacturer’s specifications.
7.1.4 Desolvation Gas High purity compressed gas (e.g., nitrogen or zero-air) used for desolvation in the mass spectrometer. The specific type of gas, purity, and pressure requirements will depend on the instrument manufacturer’s specifications.
7.1.6 Reagent Water Purified water that does not contain measurable quantities of any method analytes or interfering compounds greater than 1/3 the MRL for each method analyte of interest.
7.1.7 Potassium Citrate Monobasic, (KH2C6H5O7, CASRN 866-83-1) ≥98% (Fluka Cat. No. 60215, or equivalent). Used to inhibit microbial growth in dechlorinated water samples.
7.1.8 Ethylenediaminetetraacetic Acid Trisodium Salt, (C10H13N2Na3O8, CASRN 10378-22-0) ≥95% (Sigma Cat. No. ED3SS, or equivalent). Added to chelate metals in chlorinated finished waters.
7.1.9 L-ascorbic Acid, (C6H8O6, CASRN 50-81-7) ≥98% (Sigma-Aldrich Cat. No. 255564, or equivalent). Added to reduce residual chlorine in finished waters.
7.2 Standard Solutions When a compound’s purity is assayed to be 96 percent or greater, the weight can be used without correction to calculate the concentration of the stock standard. The solution concentrations listed in this section were used to develop this method and are included only as examples. The concentrations chosen for standards are at the discretion of the analyst as long as the IDC and ongoing QC requirements are met. Guidance on the storage stability of PDS and calibration standards is provided in the applicable sections below. Although estimated stability times for standard solutions are given, laboratories should use standard QC practices to determine when standards need to be replaced.
7.2.1 Internal Standards Three isotopically labeled internal standards must be used in the method. The following table lists the required internal standards and current sources. If additional internal standards are used, the analyst must ensure that these meet the QC requirements defined in Section 9.2.4.
Internal Standard CASRNa Catalog No. 13C-Naproxen-d3, 100 µg/mL in acetonitrile NA Cambridge Isotopes Labs CDLM-7665-S Triclosan-d3, neat material 1020719-98-5
C/D/N Isotopes D-6983
Carbamazepine-d10, neat material 132183-78-9
C/D/N Isotopes D-3542
a CASRN = Chemical Abstract Registry Number.
542-8
7.2.1.1 Internal Standard Stock Standards (1000 µg/mL, except as noted) Prepare triclosan-d3 and carbamazepine-d10 stock standard solutions by weighing 10 mg of the solid material into a tared 10-mL volumetric flask and diluting to volume with methanol. 13C-Naproxen-d3 can be purchased as a 100 µg/mL solution.
7.2.1.2 Internal Standard Primary Dilution Standard (IS PDS) (0.500–2.00 µg/mL) The table below can be used as a guide for preparing the IS PDS. The IS PDS is prepared in 50% methanol/50% reagent water and is stored at a temperature <6 oC. Use 100 µL of the 0.500–2.00 µg/mL IS PDS to fortify the final 10-mL extracts. This will yield a final concentration of 5.00–20.0 ng/mL of each IS in the extracts. Analysts are permitted to use other IS PDS concentrations and volumes provided all extracts and calibration standards contain the same final concentration of the internal standards and adequate signal is obtained to maintain precision.
7.2.2 Surrogate Analytes Two isotopically labeled surrogates were evaluated during method development; they are listed in the following table. Additional surrogate standards may be used provided these meet the QC requirements described in Section 9.2.5.
NOTE: Due to the presence of two chlorine atoms in diclofenac, there is the potential for interference when analyzing the labeled surrogate. The analyst should ensure there is little or no interference. If interference occurs, a different MRM transition for the surrogate may be used.
Surrogate Analyte CASRNa Catalog No. Diclofenac-d4, neat material 153466-65-0 C/D/N Isotopes D-6183 13C3-Trimethoprim, 50 µg/mL in methanol
N/A Cambridge Isotopes Labs CLM-7988-A-S
a CASRN = Chemical Abstract Registry Number.
7.2.2.1 Surrogate Stock Standards (1000 µg/mL) Prepare the diclofenac-d4 surrogate standard by weighing 10 mg of the solid material into a tared 10-mL volumetric flask and dilute to volume with methanol. 13C3-trimethoprim is available as a 50 µg/mL standard.
7.2.2.2 Surrogate Analyte Primary Dilution Standard (SUR PDS) (0.200–1.00 µg/mL) Using the table below as a guide for preparing the SUR PDS. Prepare the SUR PDS in 50% methanol/50% reagent water and store at a temperature <6 oC. During method development, the addition of 100 µL of SUR PDS to each 1-L sample yielded an expected final concentration of 10 ng/mL diclofenac-d4 and 2 ng/mL 13C3-trimethoprim in the final extracts.
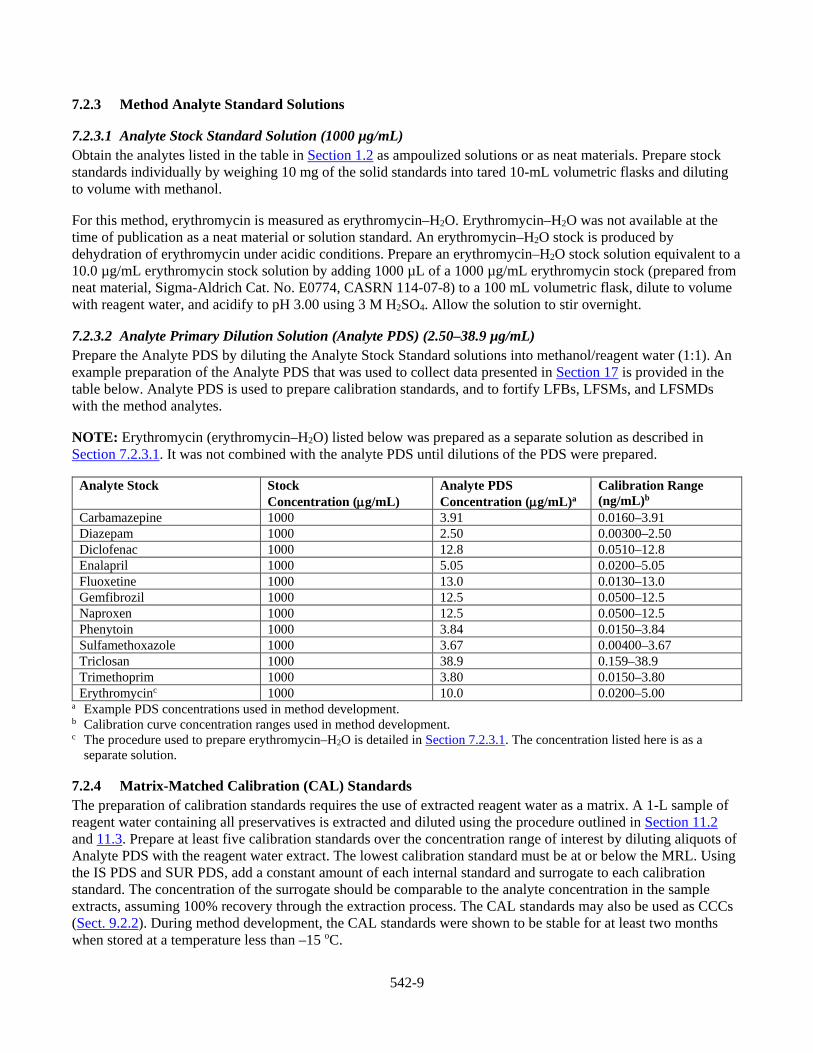
7.2.3.1 Analyte Stock Standard Solution (1000 µg/mL) Obtain the analytes listed in the table in Section 1.2 as ampoulized solutions or as neat materials. Prepare stock standards individually by weighing 10 mg of the solid standards into tared 10-mL volumetric flasks and diluting to volume with methanol.
For this method, erythromycin is measured as erythromycin–H2O. Erythromycin–H2O was not available at the time of publication as a neat material or solution standard. An erythromycin–H2O stock is produced by dehydration of erythromycin under acidic conditions. Prepare an erythromycin–H2O stock solution equivalent to a 10.0 µg/mL erythromycin stock solution by adding 1000 µL of a 1000 µg/mL erythromycin stock (prepared from neat material, Sigma-Aldrich Cat. No. E0774, CASRN 114-07-8) to a 100 mL volumetric flask, dilute to volume with reagent water, and acidify to pH 3.00 using 3 M H2SO4. Allow the solution to stir overnight.
7.2.3.2 Analyte Primary Dilution Solution (Analyte PDS) (2.50–38.9 µg/mL) Prepare the Analyte PDS by diluting the Analyte Stock Standard solutions into methanol/reagent water (1:1). An example preparation of the Analyte PDS that was used to collect data presented in Section 17 is provided in the table below. Analyte PDS is used to prepare calibration standards, and to fortify LFBs, LFSMs, and LFSMDs with the method analytes.
NOTE: Erythromycin (erythromycin–H2O) listed below was prepared as a separate solution as described in Section 7.2.3.1. It was not combined with the analyte PDS until dilutions of the PDS were prepared.
a Example PDS concentrations used in method development. b Calibration curve concentration ranges used in method development. c The procedure used to prepare erythromycin–H2O is detailed in Section 7.2.3.1. The concentration listed here is as a
separate solution.
7.2.4 Matrix-Matched Calibration (CAL) Standards The preparation of calibration standards requires the use of extracted reagent water as a matrix. A 1-L sample of reagent water containing all preservatives is extracted and diluted using the procedure outlined in Section 11.2 and 11.3. Prepare at least five calibration standards over the concentration range of interest by diluting aliquots of Analyte PDS with the reagent water extract. The lowest calibration standard must be at or below the MRL. Using the IS PDS and SUR PDS, add a constant amount of each internal standard and surrogate to each calibration standard. The concentration of the surrogate should be comparable to the analyte concentration in the sample extracts, assuming 100% recovery through the extraction process. The CAL standards may also be used as CCCs (Sect. 9.2.2). During method development, the CAL standards were shown to be stable for at least two months when stored at a temperature less than –15 oC.
542-10
8 Sample Collection, Preservation, and Storage
8.1 Sample Bottle Preparation
8.1.1 Sample Containers One-liter amber glass bottles with PTFE-lined screw caps. Collect additional 1-L samples to fulfill the QC requirements for the frequency of FDs, LFSM, and LFSMD QC samples (Sect. 9.2.6 and 9.2.7).
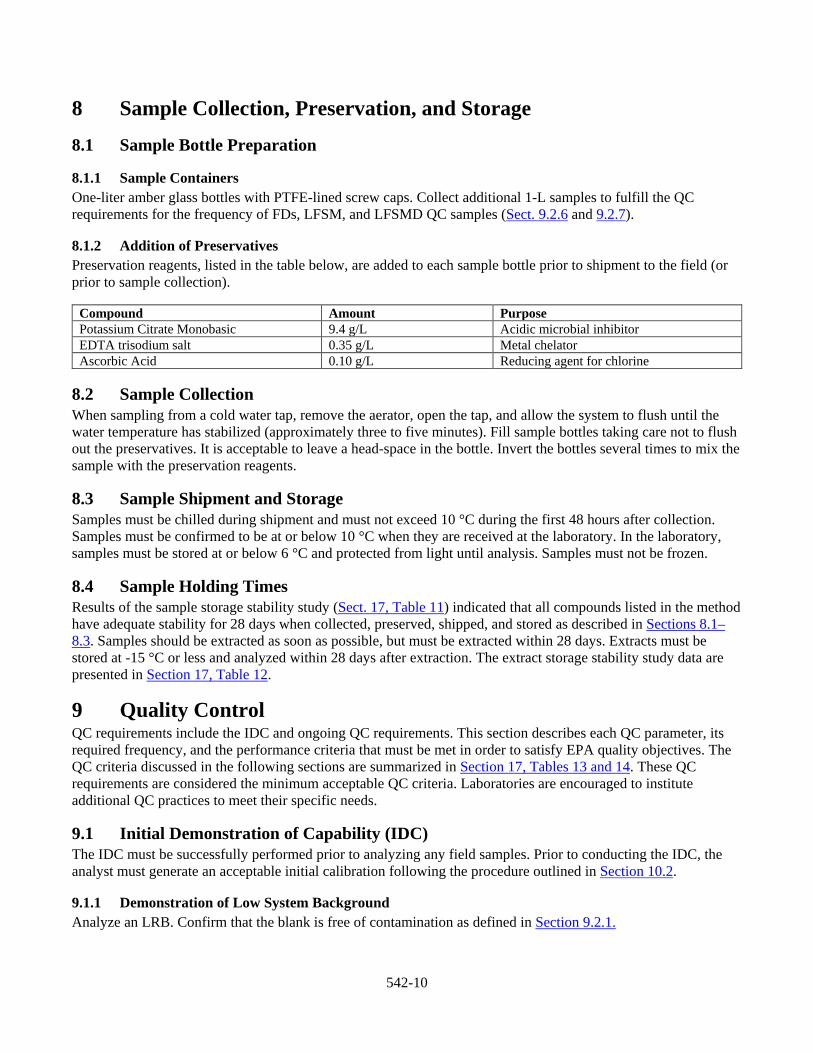
8.1.2 Addition of Preservatives Preservation reagents, listed in the table below, are added to each sample bottle prior to shipment to the field (or prior to sample collection).
Compound Amount Purpose Potassium Citrate Monobasic 9.4 g/L Acidic microbial inhibitor EDTA trisodium salt 0.35 g/L Metal chelator Ascorbic Acid 0.10 g/L Reducing agent for chlorine
8.2 Sample Collection When sampling from a cold water tap, remove the aerator, open the tap, and allow the system to flush until the water temperature has stabilized (approximately three to five minutes). Fill sample bottles taking care not to flush out the preservatives. It is acceptable to leave a head-space in the bottle. Invert the bottles several times to mix the sample with the preservation reagents.
8.3 Sample Shipment and Storage Samples must be chilled during shipment and must not exceed 10 °C during the first 48 hours after collection. Samples must be confirmed to be at or below 10 °C when they are received at the laboratory. In the laboratory, samples must be stored at or below 6 °C and protected from light until analysis. Samples must not be frozen.
8.4 Sample Holding Times Results of the sample storage stability study (Sect. 17, Table 11) indicated that all compounds listed in the method have adequate stability for 28 days when collected, preserved, shipped, and stored as described in Sections 8.1–8.3. Samples should be extracted as soon as possible, but must be extracted within 28 days. Extracts must be stored at -15 °C or less and analyzed within 28 days after extraction. The extract storage stability study data are presented in Section 17, Table 12.
9 Quality Control QC requirements include the IDC and ongoing QC requirements. This section describes each QC parameter, its required frequency, and the performance criteria that must be met in order to satisfy EPA quality objectives. The QC criteria discussed in the following sections are summarized in Section 17, Tables 13 and 14. These QC requirements are considered the minimum acceptable QC criteria. Laboratories are encouraged to institute additional QC practices to meet their specific needs.
9.1 Initial Demonstration of Capability (IDC) The IDC must be successfully performed prior to analyzing any field samples. Prior to conducting the IDC, the analyst must generate an acceptable initial calibration following the procedure outlined in Section 10.2.
9.1.1 Demonstration of Low System Background Analyze an LRB. Confirm that the blank is free of contamination as defined in Section 9.2.1.
542-11
9.1.1.1 IS Purity Depending on the source and purity, labeled internal standards may contain a small percentage of the corresponding native analyte. Therefore, the analyst must demonstrate that the internal standards do not contain the unlabeled analytes at a concentration ≥1/3 of the MRL when added at the selected concentration to samples.
9.1.1.2 Carry-over The system should also be checked for carry-over by analyzing a LRB immediately following the highest CAL standard. If this sample does not meet the criteria outlined in Section 9.2.1, then carry-over is present, which should be identified and eliminated.
9.1.2 Demonstration of Precision Prepare, extract and analyze four to seven replicate LFBs. Fortify these samples near the midrange of the initial calibration curve. The method preservatives must be added to the LFBs as described in Section 8.1.2. The percent relative standard deviation (%RSD) of the results of the replicate analyses must be ≤20%.
100ionConcentrat Average
ionsConcentrat Measured ofDeviation Standard RSD % ×=
9.1.3 Demonstration of Accuracy Using the same set of replicate data generated for Section 9.1.2, calculate the average percent recovery (%R). The average percent recovery for each analyte must be within +30% of the true value.
100ionConcentrat Fortified
ionConcentrat Measured Average%R ×=
9.1.4 Minimum Reporting Level (MRL) Confirmation Establish a target concentration for the MRL based on the intended use of the method. Analyze an initial calibration following the procedures in Section 10. The lowest calibration standard used to establish the initial calibration (as well as the low-level CCC) must be at or below the concentration of the MRL. Establishing the MRL concentration too low may cause repeated failure of ongoing QC requirements. Confirm the MRL following the procedure outlined below.
9.1.4.1 Fortify, Extract and Analyze Seven Replicate LFBs At or Below the Proposed MRL Concentration The LFBs must contain the method preservatives as specified in Section 8.1.2. Calculate the mean (Mean) and standard deviation for these replicates. Determine the Half Range for the Prediction Interval of Results (HRPIR) using the equation
HRPIR = 3.963s
where s is the standard deviation and 3.963 is a constant value for seven replicates.3
9.1.4.2 Confirm the Upper and Lower Limits for the PIR Confirm that the Upper and Lower limits for the Prediction Interval of Results (PIR = Mean +HRPIR) meet the upper and lower recovery limits as shown below.
542-12
The Upper PIR Limit must be ≤150 percent recovery.
Mean HRFortifiedConcentration
PIR+× ≤100 150%
The Lower PIR Limit must be ≥50 percent recovery.
Mean HRFortifiedConcentration
PIR−× ≥100 50%
9.1.4.3 MRL Validation The MRL is validated if both the Upper and Lower PIR Limits meet the criteria described above. If these criteria are not met, the MRL has been set too low and must be confirmed again at a higher concentration.
NOTE: These equations are only valid for seven replicate samples.
9.1.5 Quality Control Sample (QCS) Analyze a mid-level Quality Control Sample (Sect. 9.2.8) to confirm the accuracy of the primary calibration standards.
9.2 Ongoing QC Requirements This section describes the ongoing QC elements that must be included when processing and analyzing field samples.
9.2.1 Laboratory Reagent Blank (LRB) Include an LRB with each extraction batch. The LRB must contain the method preservatives and the surrogate analytes at the same concentration used to fortify field samples. Background from method analytes or contaminants that interfere with the measurement of method analytes must be ≤1/3 of the MRL. If method ana-lytes are detected in the LRB at concentrations greater than this level, then all data for the problem analyte(s) must be considered invalid for all samples in the extraction batch. Subtracting blank values from sample results is not permitted.
NOTE: Although quantitative data below the MRL may not be accurate enough for data reporting, such data are useful in determining the magnitude of background interference. Therefore, blank contamination levels may be estimated by extrapolation when the concentration is below the MRL.
9.2.2 Continuing Calibration Check (CCC) Analyze CCC standards at the beginning of each analysis batch, after every ten field samples, and at the end of the analysis batch. See Section 10.3 for concentration requirements and acceptance criteria for CCCs.
9.2.3 Laboratory Fortified Blank (LFB) An LFB is required with each extraction batch. The concentration of the LFB must be rotated between low, medium, and high concentrations from batch to batch. The low concentration LFB must be near the MRL concentration; however, the concentration chosen must be no more than two times the MRL. Similarly, the high concentration LFB should be near the high end of the calibration range established during the initial calibration. Results of the low-level LFB analyses must be within +50% of the true value for each analyte. Results of the medium and high-level LFB analyses must be within +30% of the true value for each analyte. If the LFB results do not meet these criteria, then all data for the problem analyte(s) must be considered invalid for all samples in the extraction batch.
542-13
9.2.4 Internal Standards (IS) The analyst must monitor the peak areas of the internal standards in all injections of the analysis batch. The internal standard responses (as indicated by peak areas) for any chromatographic run must not deviate by more than ±50% from the average areas measured during the initial calibration for the internal standards. If the IS areas in a chromatographic run do not meet these criteria, check the IS of the most recent CCC and proceed as follows:
9.2.4.1 IS Failure in Sample but not CCC If the IS criterion is met in the CCC but not in the sample, reanalyze the sample in the same or subsequent Analysis Batch. If the reanalyzed sample produces an acceptable IS response, report results for that injection. If the IS area count fails to meet the acceptance criterion in the repeated analysis but still passes the most recent CCC, report the sample results as “suspect/matrix.” Alternatively, analyze a FD or collect a new sample and reanalyze.
9.2.4.2 IS Failure in Sample and CCC If both the original sample and the CCC fail the IS criteria, take corrective action (e.g., Sect. 10.4). It might be helpful to check the integrity of the IS solution and the fortification technique before reanalyzing the sample in a subsequent Analysis Batch. After corrective action, re-inject the sample in a subsequent Analysis Batch. If the IS area fails to meet the acceptance criterion in the repeat analysis, but passes in the most recent CCC, report the sample results as “suspect/matrix.”
9.2.5 Surrogate Recovery The surrogate standard is fortified into all field samples, LRB, LFB, LFSMs, LFSMDs, and FDs prior to extraction. It is also added to the CAL standards. Calculate the percent recovery (%R) for each surrogate using the following equation:
100BA%R ×
=
where
A = calculated surrogate concentration for the QC or field sample, and B = fortified concentration of the surrogate.
9.2.5.1 Surrogate Recovery Criterion Surrogate recovery must be in the range of 70 to 130%. When a surrogate fails to meet this criterion, evaluate the recovery of the surrogates in the CCCs, evaluate the integrity of the CAL solutions, and take corrective action such as recalibration and servicing the LC-MS/MS system. Reanalyze the extract in a subsequent Analysis Batch.
9.2.5.2 Surrogate Recovery Reanalysis If the repeat analysis meets the surrogate recovery criterion, report only data for the reanalyzed extract.
9.2.5.3 Surrogate Recovery Failure If the extract reanalysis fails the 70 to 130% recovery range criterion after corrective action, extraction of the samples must be repeated provided a sample is available and still within the holding time. If the re-extracted sample also fails the recovery criterion, report all data for that sample as “suspect/surrogate recovery”.
9.2.6 Laboratory Fortified Sample Matrix (LFSM) Within each extraction batch, analyze a minimum of one LFSM for every 20 samples. The background concentrations of the analytes in the sample matrix must be determined in a separate aliquot and subtracted from
542-14
the measured values in the LFSM. If various sample matrixes are analyzed regularly, for example, drinking water processed from ground water and surface water sources, performance data should be collected for each source.
9.2.6.1 Prepare LFSM Prepare the LFSM by fortifying a FD with an appropriate amount of the Analyte PDS. Generally, select a spiking concentration that is greater than or equal to the native concentration for most analytes. Selecting a duplicate aliquot of a sample that has already been analyzed aids in the selection of an appropriate spiking level. If this is not possible, use historical data when selecting a fortifying concentration.
9.2.6.2 Calculate the %R Calculate the percent recovery (%R) using the equation:
( ) 100C
B-A%R ×=
where A = measured concentration in the fortified sample, B = measured concentration in the unfortified sample, and C = fortification concentration.
9.2.6.3 Recoveries Recoveries for samples fortified at concentrations near or at the MRL (within a factor of two times the MRL concentration) must be within +50% of the true value. Recoveries for samples fortified at all other concentrations must be within +30% of the true value. If the accuracy for any analyte falls outside the designated range, and the laboratory performance for that analyte is shown to be in control in the CCCs and in the LFB, the recovery is judged matrix biased. Report the result for the corresponding analyte in the unfortified sample as “suspect/matrix.”
NOTE: In order to obtain meaningful percent recovery results, correct the measured values in the LFSM and LFSMD for the native levels in the unfortified samples, even if the native values are less than the MRL. This situation and the LRB are the only permitted uses of analyte results below the MRL.
9.2.7 Field Duplicate or Laboratory Fortified Sample Matrix Duplicate (FD or LFSMD) Within each extraction batch, analyze a minimum of one Field Duplicate or one Laboratory Fortified Sample Matrix Duplicate. If the method analytes are not routinely observed in field samples, analyze an LFSMD rather than an FD.
9.2.7.1 Calculate the RPD for FD Calculate the relative percent difference (RPD) for duplicate measurements (FD1 and FD2) using the equation:
( ) 1002/FDFD
FDFDRPD
21
21 ×+
−=
9.2.7.2 RPDs for Field Duplicates RPDs for FDs should be ≤30% for each analyte. Greater variability may be observed when FDs have analyte concentrations that are near or at the MRL (within a factor of two times the MRL concentration). At these concentrations, FDs must have RPDs that are ≤50%. If the RPD of an analyte falls outside the designated range, and the laboratory performance for the analyte is shown to be in control in the CCC and in the LFB, the precision is judged matrix influenced. Report the result for the corresponding analyte in the unfortified sample as “suspect/matrix.”
542-15
9.2.7.3 Calculate the RPD for LFSM and LFSMD If an LFSMD is analyzed instead of a FD, calculate the RPD for the LFSM and LFSMD using the equation:
( ) 100/2LFSMDLFSM
LFSMDLFSMRPD ×
+−
=
9.2.7.4 RPDs for LFSM RPDs for duplicate LFSMs should be ≤30% for each analyte. Greater variability may be observed when the matrix is fortified at analyte concentrations near or at the MRL (within a factor of two times the MRL concentration). LFSMs at these concentrations must have RPDs that are ≤50%. If the RPD of an analyte falls outside the designated range, and the laboratory performance for the analyte is shown to be in control in the CCC and in the LFB, the precision is judged matrix influenced. Report the result for the corresponding analyte in the unfortified sample as “suspect/matrix.”
9.2.8 Quality Control Sample (QCS) As part of the IDC (Sect. 9.1), each time a new Analyte PDS (Sect. 7.2.3.2) is prepared, and at least quarterly, analyze a QCS sample from a source different from the source of the CAL standards. If a second vendor is not available, then a different lot of the standard should be used. Fortify the QCS near the midpoint of the calibration range. The acceptance criteria for the QCS are the same as the mid- and high-level CCCs (Sect. 10.3). If the accuracy for any analyte fails the recovery criterion, prepare fresh standard dilutions and repeat the QCS evaluation.
9.3 Method Modification QC Requirements The analyst is permitted to modify the LC column, mobile phase composition, LC conditions, and MS/MS conditions.
9.3.1 Repeat IDC and Ongoing QC Each time method modifications are made, the analyst must repeat the procedures of the IDC (Sect. 9.1) and verify that all QC criteria can be met in ongoing QC samples (Sect. 9.2).
9.3.2 Evaluate Method Performance The analyst is also required to evaluate and document method performance for the proposed modifications in real matrixes that span the range of waters that the laboratory analyzes. This additional step is required because modifications that perform acceptably in the IDC, which is conducted in reagent water, could fail ongoing method QC requirements in real matrixes. This is particularly important for methods subject to matrix effects, such as LC/MS-based methods. For example, a laboratory may routinely analyze drinking water from municipal treatment plants that process ground water, surface water, or a blend of surface and ground water. In this case, the method modification requirement could be accomplished by assessing precision and accuracy (Sects. 9.1.2 and 9.1.3) in a surface water with moderate to high total organic carbon (e.g., 2 mg/L or greater) and a hard ground water (e.g., 250 mg/L as calcium carbonate (CaCO3) equivalent, or greater).
9.3.3 Document and Assess before Analyzing Field Samples The results of Sections 9.3.1 and 9.3.2 must be appropriately documented by the analyst and independently assessed by the laboratory’s QA officer prior to analyzing field samples. When implementing method modifications, it is the responsibility of the laboratory to closely review the results of ongoing QC, and in particular, the results associated with the LFSM (Sect. 9.2.6), FD (Sect. 9.2.7), CCCs (Sect. 10.3), and the internal standard area counts (Sect. 9.2.4). If repeated failures are noted, the modification must be abandoned.
542-16
10 Calibration and Standardization Demonstration and documentation of acceptable MS calibration and initial analyte calibration are required before performing the IDC (Sect. 9.1) and prior to analyzing field samples. The initial calibration should be repeated each time a major instrument modification or maintenance is performed.
10.1 LC/ESI-MS/MS Calibration and Optimization
10.1.1 Mass Calibration Calibrate the mass spectrometer with the calibration compounds and procedures specified by the manufacturer.
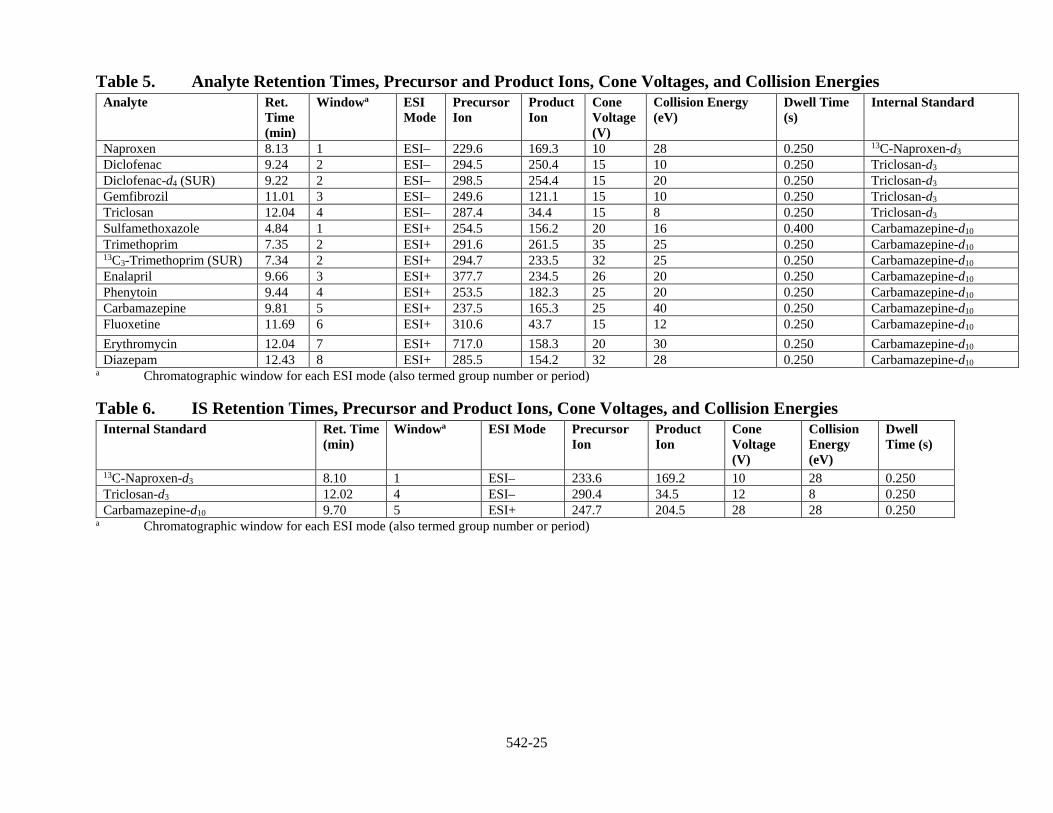
10.1.2 Optimizing MS Parameters Each LC/ESI-MS/MS system will have different optimal conditions, which are influenced by the source geometry and system design. Due to the differences in design, follow the recommendations of the instrument manufacturer when tuning the instrument. During the development of this method, instrumental parameters were optimized for the precursor and product ions listed in Section 17, Table 5. Product ions other than those listed may be selected; however, the analyst is cautioned to avoid using ions with lower mass or common ions that may not provide sufficient discrimination between the analytes of interest and co-eluting interferences.
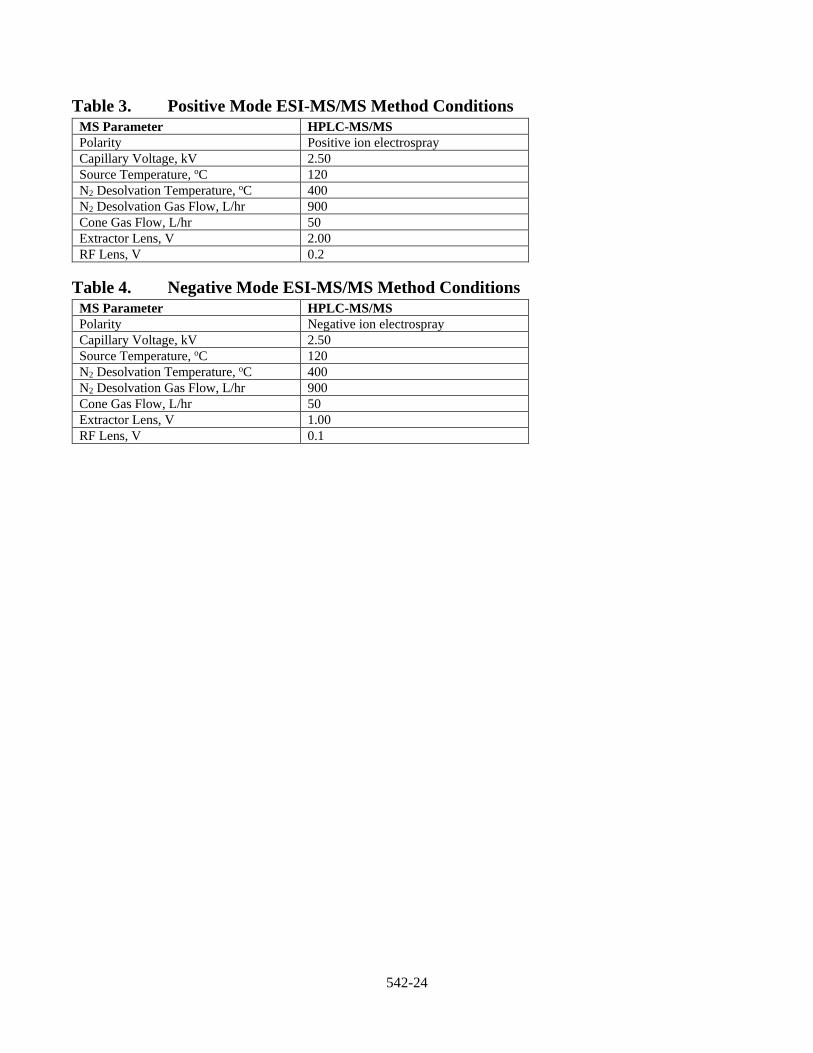
10.1.2.1 Optimize the Response of the Precursor Ion Optimize the response of the precursor ion for each analyte by split infusion at the analytical flow rate using approximately 0.500–1.00 µg/mL of each analyte. Vary the MS parameters (source voltages, source and desolvation temperatures, gas flows, etc.) until optimal analyte responses are obtained. The target analytes may have different optimal instrument parameters, thus requiring some compromise on the final operating conditions. See Section 17, Tables 3 and 4 for the ESI-MS/MS conditions used in method development.
10.1.2.2 Optimize the Response of the Product Ion Optimize the response of the product ion for each analyte by split infusion at the analytical flow rate using approximately 0.500–1.00 µg/mL of each analyte. Vary the MS/MS parameters (collision gas pressure, collision energy, etc.) until optimal product ion responses are determined.
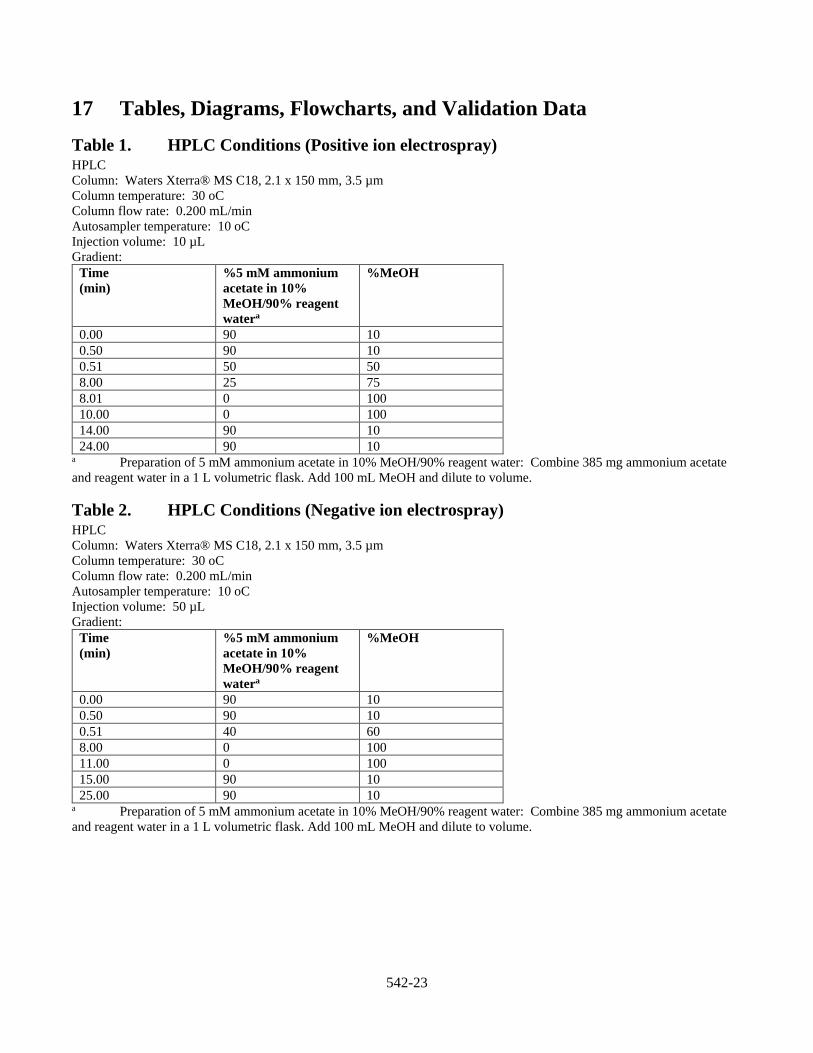
10.1.3 Liquid Chromatography Instrument Conditions Establish LC operating parameters that optimize resolution. Suggested LC operating conditions are described in Section 17, Tables 1 and 2. Conditions different from those listed (e.g., LC columns and mobile phase compositions) may be used if the QC criteria in Sections 9.1, 9.2, and 9.3 are met and chromatographic separation of the method analytes is achieved.
NOTE: Chromatographic separation as defined does not include the isotopically enriched internal standards and surrogates, which are mass separated. Co-elution of the internal standards with their analogous method analytes helps mitigate matrix suppression or enhancement effects.
10.1.4 Establish LC/ESI-MS/MS Retention Times and MRM Segments Inject a mid- to high-level calibration standard under optimized LC/ESI-MS/MS conditions to obtain the retention times of each method analyte. Divide the chromatogram into segments that contain one or more chromatographic peaks. For maximum sensitivity in subsequent MS/MS analyses, minimize the number of MRM transitions that are simultaneously monitored within each segment.
10.2 Initial Calibration During method development, daily calibrations were performed; however, it is permissible to verify the calibration with daily CCCs. Calibration must be performed using peak areas and the internal standard technique. Calibration using peak heights or external standard calibration is not permitted.
542-17
10.2.1 Calibration Standards Prepare a set of at least five calibration standards as described in Section 7.2.4. The analyte concentrations in the lowest calibration standard must be at or below the MRL. Field samples must be quantified using a calibration curve that spans the same concentration range used to collect the IDC data (Sect. 9.1), i.e., analysts are not permitted to use a restricted calibration range to meet the IDC criteria and then use a larger dynamic range during analysis of field samples.
10.2.2 Calibration Calibrate the LC/ESI-MS/MS and fit the calibration points with either a linear regression or quadratic regression (response vs. concentration). Weighting may be used. Forcing the calibration curve through the origin is not recommended. The MS/MS instruments used during method development were calibrated using weighted (1/x) quadratic curves. Internal standard assignments appropriate for each method analyte and surrogate analyte are presented in Section 17, Table 5. The MRM transitions for the internal standards are provided in Section 17, Table 6.
10.2.3 Calibration Acceptance Criteria Validate the initial calibration by calculating the concentration of each analyte as an unknown using its regression equation. For calibration levels that are ≤MRL, the result for each analyte should be within +50% of the true value. All other calibration points should calculate to be within +30% of their true value. If these criteria cannot be met, the analyst will have difficulty meeting ongoing QC criteria. In this case, reanalyze the calibration standards or restrict the range of calibration. If the cause for failure to meet the criteria is due to contamination or standard degradation, prepare fresh CAL standards and repeat the initial calibration.
10.3 Continuing Calibration Checks (CCCs) Analyze a CCC to verify the initial calibration at the beginning of each analysis batch, after every tenth field sample, and at the end of each analysis batch. The beginning CCC for each analysis batch must be at or below the MRL. This CCC verifies instrument sensitivity prior to the analysis of samples. Subsequent CCCs should alternate between a medium and high concentration CAL standard.
10.3.1 Aliquot Injection and Analysis Inject an aliquot of the appropriate concentration CAL standard and analyze with the same conditions used during the initial calibration.
10.3.2 Verify Quantitation Ions Verify that the absolute areas of the quantitation ions of each of the internal standards have not changed by more than ±50% from the average areas measured during the initial calibration. If this limit is exceeded, corrective action is necessary (Sect. 10.4).
10.3.3 Surrogate Recovery The calculated concentration of the surrogate analytes must be within +30% of the true value. If the surrogate analytes fail this criterion, corrective action is necessary (Sect. 10.4).
10.3.4 Calculate Concentration Calculate the concentration of each method analyte in the CCC. Each analyte fortified at a level ≤MRL must calculate to be within +50% of the true value. The calculated concentration of the method analytes in CCCs fortified at all other levels must be within +30%. If these limits are exceeded, then all data for the failed analytes must be considered invalid. Any field samples analyzed since the last acceptable CCC that are still within holding time must be reanalyzed after an acceptable calibration has been restored.
542-18
10.4 Corrective Action Failure to meet the CCC QC performance criteria requires corrective action. Acceptable method performance may be restored simply by flushing the column at the highest eluent concentration in the gradient. Following this and other minor remedial action, check the calibration with a mid-level CCC and a CCC at the MRL, or recalibrate according to Section 10.2. If internal standard and calibration failures persist, maintenance may be required, such as servicing the ESI-MS/MS system or replacing the LC column. These latter measures constitute major maintenance, and the analyst must return to the initial calibration step (Sect. 10.2).
11 Procedure This section describes the procedures for sample preparation and analysis. Important aspects of this analytical procedure include proper sample collection and storage (Sect. 8), ensuring that the instrument is properly calibrated (Sect. 10), and that all required QC elements are included (Sect. 9).
11.1 Sample Preparation
11.1.1 Dechlorination and Preservation Samples are dechlorinated, preserved, collected, and stored as described in Section 8. All field and QC samples must contain the dechlorinating and preservation agents listed in Section 8.1.2, including the LRB. Before extraction, mark the level of the sample on the outside of the sample bottle for later sample volume determination (Sect. 11.4). If using weight to determine volume, weigh the full sample bottle before extraction.
11.1.2 Addition of SUR Add an aliquot of the SUR PDS (Sect. 7.2.2.2) to each sample, cap the sample, and invert to mix. During method development, a 100-µL aliquot of SUR PDS was added to 1-L samples for final concentrations of 20 ng/L 13C3-trimethoprim and 100 ng/L diclofenac-d4.
11.1.3 Fortification with PDS Fortify LFBs, LFSMs, or LFSMDs with an appropriate volume of Analyte PDS (Sect. 7.2.3.2). Cap and invert each sample several times to mix.
11.2 Cartridge SPE Procedure NOTE: The following steps are intended for manual SPE. Automated SPE may be used. However, the sorbent type and mass described in the method must be used; and the total volumes of cartridge washing, conditioning, extraction, and elution cannot be changed. These steps should be performed slowly to allow for adequate saturation of the sorbent.
11.2.1 Extraction Cartridge Assembly Assemble the extraction cartridges onto the vacuum manifold.
11.2.2 Cartridge Cleaning Add a 5-mL aliquot of methanol/acetone (1:1) and draw through the cartridge until dry. Add another 5-mL aliquot of methanol/acetone (1:1) and draw through the cartridge until dry.
11.2.3 Cartridge Conditioning The conditioning step is critical for recovery of analytes and can have a marked effect on method precision and accuracy. Once conditioning has begun, do not allow the sorbent to dry.
542-19
11.2.3.1 Conditioning with Methanol/Acetone (1:1) Add 2.5 mL of methanol/acetone (1:1) to each cartridge. Pull 1–2 mL of solvent through the cartridge. Turn off the vacuum temporarily, and allow the sorbent to soak for about one minute. Add another 2.5 mL of methanol/acetone (1:1) and draw the solvent through the cartridge, but leave a thin layer of solvent on the surface of the sorbent. The cartridge must not be allowed to go dry from this point until the end of the sample extraction.
11.2.3.2 Conditioning with Water Add 2.5 mL of reagent water to each cartridge and draw through, leaving a thin layer of liquid on the surface of the sorbent. Follow this with another 2.5-mL aliquot of reagent water. Draw the water through each cartridge, again being careful to keep the water level above the sorbent surface. Turn off the vacuum.
11.2.4 Sample Extraction Fill the cartridges with reagent water and attach the sample transfer lines. This additional volume prevents the SPE sorbent from drying while the dead volume in the transfer lines is being filled. After connection, open the manifold valves and turn on the vacuum (approximately 10 to 15 in. Hg). Extract samples at a flow rate of ~10 mL/min. Do not let the cartridge go dry before the entire sample volume is extracted. When the sample has been drawn through the cartridge, add a 10-mL aliquot of reagent water to the sample container and pull the rinsate from the container through the cartridge using vacuum. Pull air through the cartridge by maintaining full vacuum until no liquid appears to pass through the cartridge. Complete drying of the cartridge is not necessary for this method.
11.2.5 Cartridge Elution Release the vacuum from the extraction manifold so the top can be removed. Insert collection tubes into the manifold to catch the extracts as they are eluted from the cartridge. The collection tube must extend above the drip tip beneath the cartridges to ensure collection of all the eluate. Replace the top to the manifold, and resume vacuum. Add 2.5 mL of methanol/acetone (1:1) to the cartridge and, with vacuum, pull enough methanol/acetone into the cartridge to soak the sorbent leaving a small amount of methanol/acetone above the surface. Allow the sorbent to soak for about one minute. Add another 2.5 mL methanol/acetone (1:1) to the cartridge and, using vacuum, pull the remaining solvent through the cartridge until dry. Vent the vacuum manifold, remove the top, and then remove collection tubes.
11.3 Extract Dilution Add IS PDS solution, and adjust to the 10-mL volume with reagent water. During method development, a 100-µL aliquot of the IS PDS (Sect. 7.2.1.2) was added to each extract.
11.4 Sample Volume or Weight Determination Use a graduated cylinder to measure the volume of water required to fill the original sample bottle to the mark made prior to extraction. Determine the volume of each sample to the nearest 10 mL for use in the final calculations of analyte concentration. If using weight to determine volume, reweigh the empty sample bottle to the nearest 10 g. From the weight of the original sample bottle measured in Section 11.1.1, subtract the empty bottle weight. Assume a sample density of 1.0 g/mL
11.5 Sample Analysis
11.5.1 Establish LC/ESI-MS/MS Operating Conditions Establish LC/ESI-MS/MS operating conditions equivalent to those summarized in Tables 1–6 of Section 17 as per the guidance in Section 10.1. Column choice and instrument parameters should be optimized prior to initiation of the IDC (Sect. 9.1).
542-20
11.5.2 Establish a Valid Initial Calibration Establish a valid initial calibration following the procedures in Section 10.2 or confirm that the calibration is still valid by analyzing a CCC (Sect. 10.3). If establishing an initial calibration for the first time, complete the IDC as described in Section 9.1 prior to analyzing field samples.
11.5.3 Analyze Field and QC Samples Analyze field and QC samples at appropriate frequencies in a properly sequenced analysis batch as described in Section 11.6.
11.6 The Analysis Batch An analysis batch is a sequence of samples, analyzed within a 24-hour period, of no more than 20 field samples and includes all required QC samples (LRB, CCCs, the LFSM and LFSMD (or FD)). The required QC samples are not included in counting the maximum field sample total of 20. LC-MS/MS conditions for the analysis batch must be the same as those used during calibration.
11.6.1 Initial CCC and QC Samples After a valid calibration is established, begin every analysis batch by analyzing an initial low-level CCC at or below the MRL. This initial CCC must be within ±50% of the true value for each method analyte and the surrogate and internal standards must pass their acceptance criteria. The initial CCC confirms that the calibration is still valid. Failure to meet the QC criteria may indicate that recalibration is required prior to analyzing samples. After the initial CCC, continue the analysis batch by analyzing an LRB, followed by field and QC samples at appropriate frequencies (Sect. 9.2). Analyze a mid- or high-level CCC after every ten field samples and at the end each analysis batch. Do not count QC samples (LRBs, FDs, LFSMs, LFSMDs) when calculating the required frequency of CCCs.
11.6.2 Final CCC A final CCC completes the analysis batch. The acquisition start time of the final CCC must be within 24 hours of the acquisition start time of the initial low-level CCC at the beginning of the analysis batch. More than one analysis batch within a 24-hour period is permitted.
12 Data Analysis and Calculations
12.1 Establish Retention Time Window for Target Analytes Establish an appropriate retention time window for each analyte to identify them in QC and field sample chromatograms. Base this assignment on measurements of actual retention time variation for each compound in standard solutions over the course of time. The suggested variation is plus or minus three times the standard deviation of the retention time for each compound for a series of injections. The injections from the initial calibration and from the IDC (Sect. 9.1) may be used to calculate the retention time window. However, the experience of the analyst should weigh heavily on the determination of an appropriate range.
12.2 Identify Peaks of Interest At the conclusion of data acquisition, use the same software settings established during the calibration procedure to identify peaks of interest in the predetermined retention time windows. Confirm the identity of each analyte by comparison of its retention time with that of the corresponding analyte peak in an initial calibration standard or CCC.
12.3 Calculate Analyte Concentrations Calculate analyte concentrations using the multipoint calibration established in Section 10.2. Report only those values that fall between the MRL and the highest calibration standard.
542-21
12.4 Rounding Final Concentrations Calculations must use all available digits of precision, but final reported concentrations should be rounded to an appropriate number of significant figures (one digit of uncertainty), typically two, and not more than three significant figures.
12.5 Review Chromatograms Prior to reporting the data, the chromatograms must be reviewed for any incorrect peak identifications or improper integration. The laboratory is responsible for ensuring that QC requirements have been met and that any appropriate qualifier is assigned.
12.6 Exceeding the Calibration Range The analyst must not extrapolate beyond the established calibration range. If an analyte result exceeds the range of the initial calibration curve, the extract may be diluted using 25% methanol/25% acetone/50% reagent water containing the appropriate amount of internal standard added to match the original level. Re-inject the diluted sample. Incorporate the dilution factor into final concentration calculations. The resulting data must be annotated as a dilution, and the reported MRLs must reflect the dilution factor. Acceptable surrogate performance must be determined from the undiluted sample extract.
13 Method Performance
13.1 Precision, Accuracy, and LCMRL Tables for these data are presented in Section 17. LCMRLs for each method analyte are presented in Section 17, Table 7. Precision and accuracy are presented for four water matrixes: reagent water (Sect. 17, Table 8); chlorinated (finished) groundwater (Sect. 17, Table 9); moderate TOC chlorinated surface water (Sect. 17, Table 10); and the aqueous holding time study in chlorinated surface water (Sect. 17, Table 11).
13.2 Multi Laboratory Validation The performance of this method was demonstrated in multi-laboratory studies using triple quadrupole, ion trap, and “hybrid” triple quadrupole/ion trap mass spectrometers.
13.3 Analyte Stability Study Chlorinated surface water samples, fortified with method analytes at 5.00–77.8 ng/L, were preserved as required in Section 8 and stored over a 28-day period. The accuracy and precision of three replicate analyses, conducted on days 0, 7, 14, 21 and 28, are presented in Section 17, Table 11.
13.4 Extract Storage Stability Extract storage stability studies were conducted on extracts obtained from a chlorinated surface water fortified with the method analytes. The precision and accuracy of three replicates conducted on days 0, 7, 14, 21, and 28, are presented in Section 17, Table 12.
14 Pollution Prevention For information about pollution prevention applicable to laboratory operations described in this method, consult: Less is Better, Guide to Minimizing Waste in Laboratories, a web-based resource available from the American Chemical Society website.
15 Waste Management The analytical procedures described in this method generate relatively small amounts of waste since only small amounts of reagents and solvents are used. The matrix of concern is finished drinking water. However, the
542-22
Agency requires that laboratory waste management practices be conducted consistent with all applicable rules and regulations, and that laboratories protect the air, water, and land by minimizing and controlling all releases from fume hoods and bench operations. In addition, compliance is required with any sewage discharge permits and regulations, particularly the hazardous waste identification rules and land disposal restrictions.
16 References (1) Vanderford, B. J.; Snyder, S. A. Environmental Science & Technology 2006, 40, 7312.
(2) Hirsch, R.; Ternes, T.; Haberer, K.; Kratz, K.-L. Science of The Total Environment 1999, 225, 109.
(3) Winslow, S. D.; Pepich, B. V.; Martin, J. J.; Hallberg, G. R.; Munch, D. J.; Frebis, C. P.; Hedrick, E. J.; Krop, R. A. Environmental Science & Technology 2006, 40, 281.
542-23
17 Tables, Diagrams, Flowcharts, and Validation Data
Table 1. HPLC Conditions (Positive ion electrospray) HPLC Column: Waters Xterra® MS C18, 2.1 x 150 mm, 3.5 µm Column temperature: 30 oC Column flow rate: 0.200 mL/min Autosampler temperature: 10 oC Injection volume: 10 µL Gradient:
Time (min)
%5 mM ammonium acetate in 10% MeOH/90% reagent watera
a Preparation of 5 mM ammonium acetate in 10% MeOH/90% reagent water: Combine 385 mg ammonium acetate and reagent water in a 1 L volumetric flask. Add 100 mL MeOH and dilute to volume.
Table 2. HPLC Conditions (Negative ion electrospray) HPLC Column: Waters Xterra® MS C18, 2.1 x 150 mm, 3.5 µm Column temperature: 30 oC Column flow rate: 0.200 mL/min Autosampler temperature: 10 oC Injection volume: 50 µL Gradient:
Time (min)
%5 mM ammonium acetate in 10% MeOH/90% reagent watera
a Preparation of 5 mM ammonium acetate in 10% MeOH/90% reagent water: Combine 385 mg ammonium acetate and reagent water in a 1 L volumetric flask. Add 100 mL MeOH and dilute to volume.
a LCMRLs were calculated according to the procedure in reference 3 with the following modification: Instead of evaluating seven replicates at four concentration levels, LCMRLs are now obtained by analyzing four replicates at seven concentration levels.
542-27
Table 8. Precision and Accuracy in Fortified Reagent Water (n=5) Low Concentration
a Surface water physical parameters: total hardness = 124 mg/L (as CaCO3); free chlorine = 1.16 mg/L; total chlorine = 1.65 mg/L; TOC = 4.23 ppm.
542-30
Table 11. Aqueous Sample Holding Time Data For Samples from Chlorinated Surface Watera, Fortified with Method Analytes and Preserved and Stored According to Method Section 8 (n = 3)
a Surface water physical parameters: total hardness = 127 mg/L (as CaCO3); free chlorine = 1.05 mg/L; total chlorine = 1.45 mg/L. b % Change from Day 0 calculation: (Day x mean concentration – Day 0 mean concentration) / Day 0 mean concentration * 100%, where x is the
extraction day. c Rejection for assignable cause: Possible contamination during extraction.
542-31
Table 12. Extract Holding Time Data For Samples from Chlorinated Surface Watera Fortified with Method Analytes and Preserved and Stored According to Method Section 8 (n = 3)
a % Change from Day 0 calculation: (Day x mean concentration – Day 0 mean concentration) / Day 0 mean concentration * 100%, where x is the extraction day.
542-32
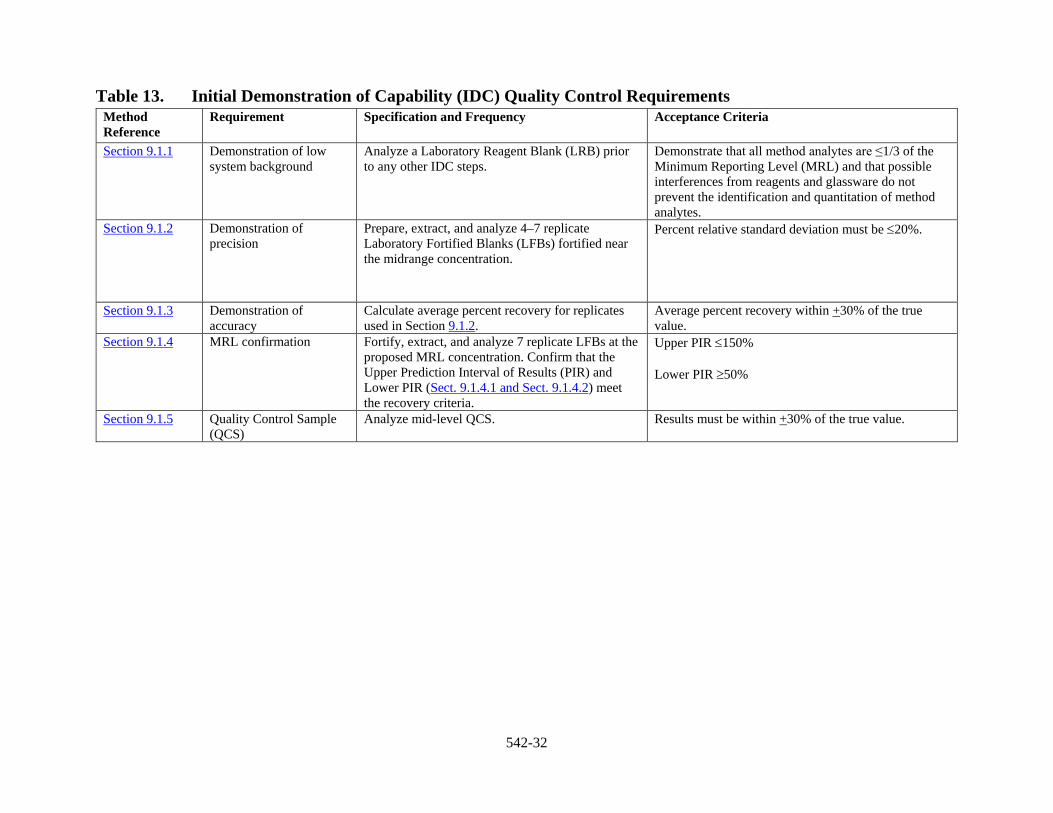
Table 13. Initial Demonstration of Capability (IDC) Quality Control Requirements Method Reference
Requirement Specification and Frequency Acceptance Criteria
Section 9.1.1 Demonstration of low system background
Analyze a Laboratory Reagent Blank (LRB) prior to any other IDC steps.
Demonstrate that all method analytes are ≤1/3 of the Minimum Reporting Level (MRL) and that possible interferences from reagents and glassware do not prevent the identification and quantitation of method analytes.
Section 9.1.2 Demonstration of precision
Prepare, extract, and analyze 4–7 replicate Laboratory Fortified Blanks (LFBs) fortified near the midrange concentration.
Percent relative standard deviation must be ≤20%.
Section 9.1.3 Demonstration of accuracy
Calculate average percent recovery for replicates used in Section 9.1.2.
Average percent recovery within +30% of the true value.
Section 9.1.4 MRL confirmation Fortify, extract, and analyze 7 replicate LFBs at the proposed MRL concentration. Confirm that the Upper Prediction Interval of Results (PIR) and Lower PIR (Sect. 9.1.4.1 and Sect. 9.1.4.2) meet the recovery criteria.
Upper PIR ≤150% Lower PIR ≥50%
Section 9.1.5 Quality Control Sample (QCS)
Analyze mid-level QCS. Results must be within +30% of the true value.
542-33
Table 14. Ongoing Quality Control Requirements Method Reference
Requirement Specification and Frequency Acceptance Criteria
Section 10.2 Initial calibration Use the internal standard calibration technique to generate a linear or quadratic calibration curve. Use at least five calibration concentrations. Validate the calibration curve as described in Section 10.2.3.
When each calibration standard is calculated as an unknown using the regression equation, the lowest level standard must be within +50% of the true value. All other points must be within +30% of the true value.
Section 9.2.1
Laboratory Reagent Blank (LRB)
Analyze one LRB with each extraction batch. Demonstrate that all method analytes are ≤1/3 the Minimum Reporting Level (MRL), and that possible interferences from reagents and glassware do not prevent identification and quantitation of method analytes.
Section 9.2.2 and 10.3
Continuing Calibration Check (CCC)
Verify initial calibration by analyzing a low-level CCC at the beginning of each analysis batch. Subsequent CCCs are required after every 10 field samples, and at the end of the analysis batch.
The lowest level CCC must be within +50% of the true value. All other points must be within +30% of the true value. Surrogate analytes must be +30% of the true value. Internal standards must be +50% of the average peak areas in the initial calibration. Results for field samples that are not bracketed by acceptable CCCs are invalid.
Section 9.2.3
Laboratory Fortified Blank (LFB)
Extract and analyze one LFB with each extraction batch.
For LFBs fortified at concentrations <2 x MRL, the result must be within +50% of the true value. At concentrations >2 x MRL, the result must be +30% of the true value.
Section 9.2.4
Internal standard (IS) Isotopically labeled internal standards are added to all standards and samples.
Peak area counts for each IS must be within ±50% of the average peak areas in the initial calibration.
Section 9.2.5
Surrogate analyte Fortify the surrogate analytes into all samples prior to extraction.
Surrogate recovery must be in the range of 70 to 130%.
Section 9.2.6
Laboratory Fortified Sample Matrix (LFSM)
Analyze one LFSM per extraction batch. Fortify the LFSM with method analytes at a concentration greater than the native concentrations.
For LFSMs fortified at concentrations ≤2 x MRL, the calculated recovery must be within +50% of the true value. At concentrations >2 x MRL, the recovery must be +30% of the true value.
Section 9.2.7
Laboratory Fortified Sample Matrix Duplicate (LFSMD) or Field Duplicate (FD)
Analyze at least one LFSMD or FD with each extraction batch.
For LFSMDs or FDs, the calculated relative percent difference must be ≤30%. (≤50% if concentration <2 x MRL.)
Section 9.2.8
Quality Control Sample (QCS)
Analyze mid-level QCS at least quarterly. Results must be +30% of the true value.
542-34
Figure 1. Example Chromatogram of ESI (+) Transitions for Method 542 Analytes
542-35
Figure 2. Example Chromatogram of ESI (-) Transitions for Method 542 Analytes