Method for Analyte Identification Using Isotachophoresis and a Fluorescent Carrier Ampholyte Assay M. Bercovici, † G. V. Kaigala, ‡ and J. G. Santiago* ,‡ Departments of Aeronautics and Astronautics and Mechanical Engineering, Stanford University, Stanford California 94305 We present a novel method for identification of unlabeled analytes using fluorescent carrier ampholytes and isota- chophoresis (ITP). The method is based on previous work where we showed that the ITP displacement of carrier ampholytes can be used for detection of unlabeled (non- fluorescent) analytes. We here propose a signal analysis method based on integration of the associated fluorescent signal. We define a normalized signal integral which is equivalent to an accurate measure of the amount of carrier ampholytes which are focused between the leading elec- trolyte and the analyte. We show that this parameter can be related directly to analyte effective mobility. Using several well characterized analytes, we construct calibra- tion curves relating effective mobility and carrier am- pholyte displacement at two different leading electrolyte (LE) buffers. On the basis of these calibration curves, we demonstrate the extraction of fully ionized mobility and dissociation constant of 2-nitrophenol and 2,4,6-trichlo- rophenol from ITP experiments with fluorescent carrier ampholytes. This extraction is based on no a priori assumptions or knowledge of these two toxic chemicals. This technique allows simultaneous identification of mul- tiple analytes by their physiochemical properties in a few minutes and with no sample preparation. Isotachophoresis (ITP) is used frequently in separation and detection of analytes in a wide range of applications from pharmacology and genetics to toxin detection and food analysis. 1,2 ITP detection can be accomplished by measuring changes in conductivity, in UV absorbance, or in fluorescence intensity. Identification is typically the process of determining the identity of one or more analytes which caused an observed change in signal. This process can be difficult when there are multiple analytes of interest whose properties are not known a priori. For such applications, identification must rely on a more general approach of characterizing physiochemical properties such as mass, charge, dissociation constant, or electrophoretic mobility. Hirokawa and Kiso 3 and later Jokl et al. 4 and Pospichal et al. 5 used multiple ITP experiments to characterize the fully ionized mobilities and dissociation constants of a large number of ionic species. They measured the conductivity of a zone at several pH values and used a computer simulation to determine the mobility and pK a values which best fit the data. Recently, Chambers and Santiago 6 suggested that a similar approach can be employed for the identification of analytes from indirect fluorescence- based detection. In this work, we demonstrate how a fluores- cent carrier ampholytes assay we recently developed 7 can be used to both identify and quantitate analyte ions with little or no a priori information regarding their mobility or their acid or base dissociation constants. We previously presented 8 a new method for indirect detection of analytes based on ITP and fluorescent carrier ampholytes (FCA). The method requires very little or no sample preparation steps. For the FCA assay, we prepare a mixture of fluorescently tagged carrier ampholytes in a trailing electrolyte 7 (TE) for ITP. In the absence of analytes, the tagged CAs focus at the interface between the leading electrolyte (LE) and TE and create a contiguous, baseline fluorescent zone. When analytes are present and also focus at the interface, they displace groups of CAs and create gaps in the signal. Figure 1 schematically depicts this process. In analysis of the signal, each gap in the signal denotes the existence of an analyte and the width of the gap is directly proportional to the initial concentration of the analyte. 9 In application of this technique, one would first study the ampholyte signals in the presence of a control matrix (e.g., tap water) to establish a baseline signature associated with its ionic content. Once a baseline is established, the detection of unknown analytes would be achieved by registering their modulation with this baseline fluorescence signal. We further discuss related details of this indirect detection assay elsewhere. 7 We here demonstrate how signals from this FCA assay can be analyzed to achieve quantitative identification of analyte ions given little or no a priori knowledge regarding their physicochem- * To whom correspondence should be addressed. 440 Escondido Mall, Bldg. 530, Room 225, Stanford, California 94305. E-mail: [email protected]. Fax: (650) 723-7657. † Department of Aeronautics and Astronautics. ‡ Department of Mechanical Engineering. (1) Auroux, P.; Iossifidis, D.; Reyes, D. R.; Manz, A. Anal. Chem. 2002, 74, 2637–2652. (2) Dittrich, P. S.; Tachikawa, K.; Manz, A. Anal. Chem. 2006, 78, 3887–3908. (3) Hirokawa, T.; Kiso, Y. J. Chromatogr., A 1982, 252, 33–48. (4) Jokl, V.; Pola ´sek, M.; Pospıchalova ´, J. J. Chromatogr., A 1987, 391, 427– 432. (5) Pospichal, J.; Gebauer, P.; Bocek, P. Chem. Rev. 1989, 89, 419–430. (6) Chambers, R. D.; Santiago, J. G. Anal. Chem. 2009, 81, 3022–3028. (7) Bercovici, M.; Kaigala, G. V.; Backhouse, C. J.; Santiago, J. G. Anal. Chem. 2009, DOI: 10.1021/ac902526g. (8) Kaigala, G. V.; Bercovici, M.; Behnam, M.; Elliott, D. G.; Santiago, J. G.; Backhouse, C. J. Manuscript in preparation. (9) Khurana, T. K.; Santiago, J. G. Anal. Chem. 2008, 80, 279–286. Anal. Chem. XXXX, xxx, 000–000 10.1021/ac9025658 XXXX American Chemical Society A Analytical Chemistry, Vol. xxx, No. xx, Month XX, XXXX
Transcript
Method for Analyte Identification UsingIsotachophoresis and a Fluorescent CarrierAmpholyte Assay
M. Bercovici,† G. V. Kaigala,‡ and J. G. Santiago*,‡
Departments of Aeronautics and Astronautics and Mechanical Engineering, Stanford University,Stanford California 94305
We present a novel method for identification of unlabeledanalytes using fluorescent carrier ampholytes and isota-chophoresis (ITP). The method is based on previous workwhere we showed that the ITP displacement of carrierampholytes can be used for detection of unlabeled (non-fluorescent) analytes. We here propose a signal analysismethod based on integration of the associated fluorescentsignal. We define a normalized signal integral which isequivalent to an accurate measure of the amount of carrierampholytes which are focused between the leading elec-trolyte and the analyte. We show that this parameter canbe related directly to analyte effective mobility. Usingseveral well characterized analytes, we construct calibra-tion curves relating effective mobility and carrier am-pholyte displacement at two different leading electrolyte(LE) buffers. On the basis of these calibration curves, wedemonstrate the extraction of fully ionized mobility anddissociation constant of 2-nitrophenol and 2,4,6-trichlo-rophenol from ITP experiments with fluorescent carrierampholytes. This extraction is based on no a prioriassumptions or knowledge of these two toxic chemicals.This technique allows simultaneous identification of mul-tiple analytes by their physiochemical properties in a fewminutes and with no sample preparation.
Isotachophoresis (ITP) is used frequently in separation anddetection of analytes in a wide range of applications frompharmacology and genetics to toxin detection and food analysis.1,2
ITP detection can be accomplished by measuring changes inconductivity, in UV absorbance, or in fluorescence intensity.Identification is typically the process of determining the identityof one or more analytes which caused an observed change insignal. This process can be difficult when there are multipleanalytes of interest whose properties are not known a priori. Forsuch applications, identification must rely on a more generalapproach of characterizing physiochemical properties such asmass, charge, dissociation constant, or electrophoretic mobility.
Hirokawa and Kiso3 and later Jokl et al.4 and Pospichal et al.5
used multiple ITP experiments to characterize the fully ionizedmobilities and dissociation constants of a large number of ionicspecies. They measured the conductivity of a zone at several pHvalues and used a computer simulation to determine the mobilityand pKa values which best fit the data. Recently, Chambers andSantiago6 suggested that a similar approach can be employedfor the identification of analytes from indirect fluorescence-based detection. In this work, we demonstrate how a fluores-cent carrier ampholytes assay we recently developed7 can beused to both identify and quantitate analyte ions with little orno a priori information regarding their mobility or their acidor base dissociation constants.
We previously presented8 a new method for indirect detectionof analytes based on ITP and fluorescent carrier ampholytes(FCA). The method requires very little or no sample preparationsteps. For the FCA assay, we prepare a mixture of fluorescentlytagged carrier ampholytes in a trailing electrolyte7 (TE) for ITP.In the absence of analytes, the tagged CAs focus at the interfacebetween the leading electrolyte (LE) and TE and create acontiguous, baseline fluorescent zone. When analytes are presentand also focus at the interface, they displace groups of CAs andcreate gaps in the signal. Figure 1 schematically depicts thisprocess. In analysis of the signal, each gap in the signal denotesthe existence of an analyte and the width of the gap is directlyproportional to the initial concentration of the analyte.9 Inapplication of this technique, one would first study the ampholytesignals in the presence of a control matrix (e.g., tap water) toestablish a baseline signature associated with its ionic content.Once a baseline is established, the detection of unknown analyteswould be achieved by registering their modulation with thisbaseline fluorescence signal. We further discuss related detailsof this indirect detection assay elsewhere.7
We here demonstrate how signals from this FCA assay canbe analyzed to achieve quantitative identification of analyte ionsgiven little or no a priori knowledge regarding their physicochem-
* To whom correspondence should be addressed. 440 Escondido Mall, Bldg.530, Room 225, Stanford, California 94305. E-mail: [email protected]: (650) 723-7657.
† Department of Aeronautics and Astronautics.‡ Department of Mechanical Engineering.
(1) Auroux, P.; Iossifidis, D.; Reyes, D. R.; Manz, A. Anal. Chem. 2002, 74,2637–2652.
(2) Dittrich, P. S.; Tachikawa, K.; Manz, A. Anal. Chem. 2006, 78, 3887–3908.
(3) Hirokawa, T.; Kiso, Y. J. Chromatogr., A 1982, 252, 33–48.(4) Jokl, V.; Polasek, M.; Pospıchalova, J. J. Chromatogr., A 1987, 391, 427–
432.(5) Pospichal, J.; Gebauer, P.; Bocek, P. Chem. Rev. 1989, 89, 419–430.(6) Chambers, R. D.; Santiago, J. G. Anal. Chem. 2009, 81, 3022–3028.(7) Bercovici, M.; Kaigala, G. V.; Backhouse, C. J.; Santiago, J. G. Anal. Chem.
2009, DOI: 10.1021/ac902526g.(8) Kaigala, G. V.; Bercovici, M.; Behnam, M.; Elliott, D. G.; Santiago, J. G.;
Backhouse, C. J. Manuscript in preparation.(9) Khurana, T. K.; Santiago, J. G. Anal. Chem. 2008, 80, 279–286.
Anal. Chem. XXXX, xxx, 000–000
10.1021/ac9025658 XXXX American Chemical Society AAnalytical Chemistry, Vol. xxx, No. xx, Month XX, XXXX
ical properties. We found that the amount of displaced fluorescentCAs can be directly related to the effective mobility of theunlabeled (nonfluorescent) analyte that displace them. By con-structing a calibration curve for this property, we are able to obtainquantitative measurements of the effective mobilities of analytes.Using approaches similar to that used by Hirokawa and Kiso3 andthat proposed by Chambers and Santiago,6 we obtain an estimateof the effective mobility of analytes using two LE buffers. We thencombine these measurements with ITP theory to computeestimates of the dissociation constant and fully ionized mobilityof analytes. This analysis method is tailored for the FCA assayand enables rapid (∼3 min) identification of unlabeled analytes.
We here illustrate the identification technique by applying itto two chemical pollutants: 2-nitrophenol (2NP) and 2,4,6-trichlo-rophenol (TCP), with no sample preparation steps. We begin bydescribing several principles and definitions and then show howto construct the calibration curves. We then use these curves toextract effective mobilities of detected species. Lastly, we describehow to obtain acid dissociation constants (pKa) and fully ionizedmobility values from those effective mobilities.
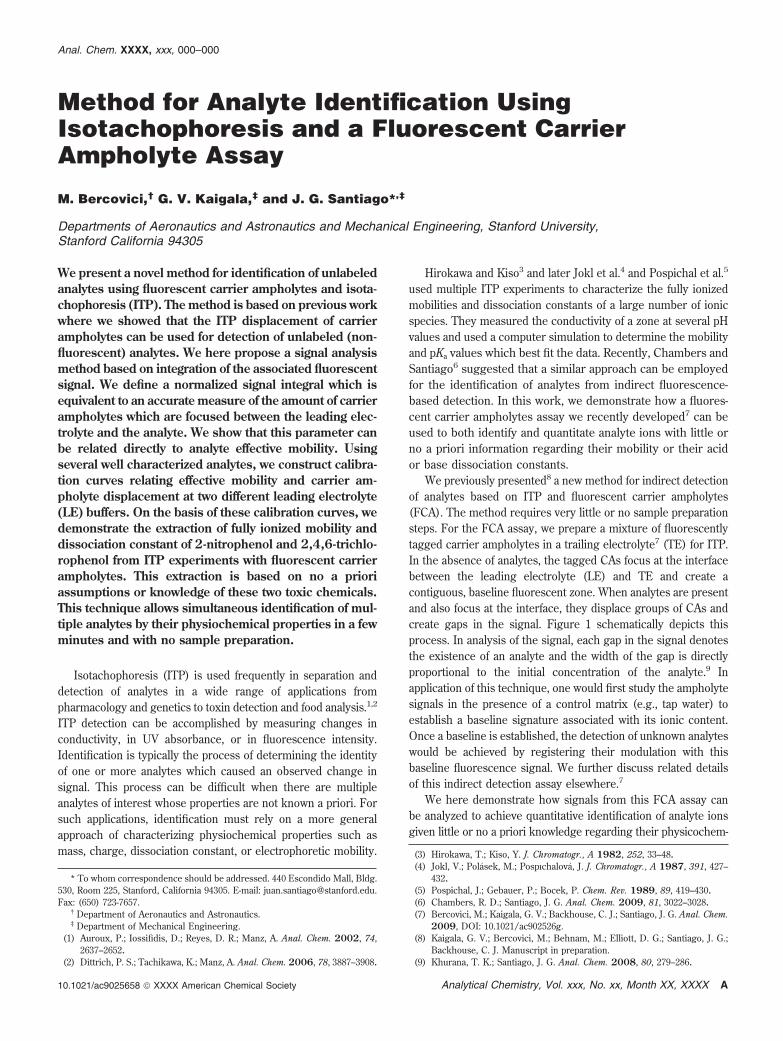
PRINCIPLE AND DEFINITIONSFigure 1 presents a schematic of the FCA assay. We define
an axial coordinate, x, pointing from LE to TE. In the control ITPrun, labeled carrier ampholytes are focused between the LE andTE creating a continuous (albeit nonuniform) fluorescence signal.The dashed line in Figure 1a shows the cumulative integral ofthe fluorescent signal along x. The initial value of the integral isset to zero in the LE region where no labeled CAs are present.The integral increases monotonically until reaching a constant atthe TE (where again no labeled CAs are present). For a givenCA mixture and LE and TE buffer combination, this total signalintegral is fixed and represents the cumulative intensity of alllabeled CAs which focus at these conditions. We then define the
quantity NSI (for “normalized signal integral”) as the local integralvalue divided by the total integral,
NSI(x) ) ∫xLE
x[I(x) - I(xLE)] dx/[∫xLE
xTE [I(x) - I(xLE)] dx]where I is the fluorescence signal (averaged across the channelwidth) and xLE and xTE are axial coordinates in the LE and TEzones, respectively. When I is obtained using a point detector,the coordinate x should be replaced with the time coordinatet. In the latter case, the definition of NSI makes it independentof the intensity of illumination, exposure time, or backgroundsignal. However, data obtained from 2D images (as in thiswork) has to be first corrected for nonuniform illumination andbackground. We describe the latter process in the SupportingInformation.
As shown in Figure 1b, analyte ions which focus between theLE and TE displace subsets of CAs and thus create gaps in thefluorescence signal. While the total signal integral remainsunchanged (fixed total amount of CAs), the shape of the NSIfunction changes and now includes a new region of locally nearlyconstant value of NSI. This plateau corresponds to an analyte zone(where few CAs are present). The location of this analyte-specificplateau in the NSI signal is determined by the analyte’s effectivemobility (see Everaerts for a description of effective versus fullyionized mobility). A species with a higher effective mobility resultsin a larger fraction of CAs being displaced and an associated lowerNSI value for its plateau. If the exact content of the CA mixturewere known (mobility and pKa values of all species), one wouldbe able to derive an analytical relation between the effectivemobility of an analyte and its corresponding NSI. However,since the exact content of CA mixtures is unknown (typicallyproprietary information for the CA supplier), we constructempirical calibration curves as described in the followingsections.
EXPERIMENTAL SECTIONCarrier Ampholytes Tagging. We used ZOOM 9-11 carrier
ampholyte obtained from Invitrogen (Carlsbad, CA) and labeledthem with Alexa Fluor 647, also from Invitrogen. The labelingprotocol is similar to the one suggested by Invitrogen for labelingof proteins,11 and details are provided in Bercovici et al.8
Materials and Instrumentation. We used two LE buffers inthe experiments. LE1 was composed of 10 mM lactic acid and20 mM bistris (pH 6.4) in deionized water (UltraPure DNase/RNase free distilled water, GIBCO Invitrogen, Carlsbad, CA).LE2 was identical to LE1, with the addition of 4 mM sodiumhydroxide (pH 6.8). The TE was composed of 10 mM tricineand 20 mM bistris in all experiments, but the concentration ofanalytes and labeled CAs (which were mixed with the TEbuffer) varied between experiments and are provided in thefigure captions. To both the LE and TE we added 1% ∼1 MDapoly(vinylpyrrolidone) (PVP) for suppression of electroosmoticflow (EOF).
(10) Everaerts, F. M.; Beckers, J. L.; Verheggen, T. P. Isotachophoresis: Theory,Instrumentation, and Applications; Elsevier Science & Technology: Am-sterdam, The Netherlands, 1976.
Figure 1. Schematic of isotachophoretic separation and indirectdetection using the FCA assay: (a) in the absence of analytes, labeledCAs focus at the LE-TE interface creating a continuous fluorescencesignal and (b) analytes focused under isotachophoresis displacesubsets of the labeled CAs creating gaps in the signal. The NSI(dashed curves) is a cumulative integral of the fluorescence signalfrom LE to TE. Plateau regions in the NSI (marked by an ×) areassociated with gaps in the fluorescent signal and the presence ofspecific focused analytes. The NSI value for each analyte is ameasure of the fraction of CA between the analyte and the LE. Thelatter fraction can be related to the effective analyte mobility.
B Analytical Chemistry, Vol. xxx, No. xx, Month XX, XXXX
We construct calibration curves (Figure 3) using knownconcentrations of very well characterized weak electrolytes. Forthis purpose, we used 20 µM 2-(N-morpholino)ethanesulfonic acid(MES), 30 µM N-(2-acetamido)-2-aminoethanesulfonic acid (ACES),40 µM 3-(N-morpholino)propanesulfonic acid (MOPS), and 50 µM4-(2-hydroxyethyl)-1-piperazineethanesulfonic acid (HEPES) andmixed these in the TE together with 1 µM of labeled CAs (weperformed limited additional experiments where we includedindividual additions of these to verify their identities). We dilutedthese ideal analytes to their final concentration from 1 M stocksolutions. For the experiments demonstrating the identificationof phenols, we prepared stock solutions of 1 mM 2,4,6-trichlo-rophenol and 10 mM 2-nitrophenol. All buffers and analytes wereobtained from Sigma Aldrich (St. Louis, MO).
We performed the experiments using an inverted epifluores-cent microscope (IX70, Olympus, Hauppauge, NY) equipped witha 100 W mercury bulb (Ushio Inc., Tokyo, Japan), XF100-2 filter-cube from Omega Optical (Brattleboro, VT), a 10× (NA ) 0.3)UPlanFl objective and a 0.63× nonparfocalizing adapter. Imageswere captured using a 12 bit, 1300 × 1030 pixel array CCD camera(Micromax1300, Princeton Instruments, Trenton NJ). We con-trolled the camera using Winview32 (Princeton Instruments,Trenton NJ) and processed the images with MATLAB (R2007b,Mathworks, Natick, MA). We applied voltage using a high-voltagesourcemeter (model 2410, Keithley Instruments, Cleveland, OH).We used off-the-shelf microfluidic borosilicate chips (model NS-95) from Caliper Life Sciences (Mountain View, CA). The channelis isotropically etched with a depth of 12 µm and consists of a 54µm wide section which constricts into a 34 µm wide section. Thetotal length of the channel is 34.6 mm, with the initial (wide)section 11.5 mm in length. All images shown here were capturedin the narrow region of the channel at a distance of 18.5 mm fromthe TE reservoir, 7 mm from the constriction.
RESULTS AND DISCUSSIONConstruction of a Calibration Curve. We first present the
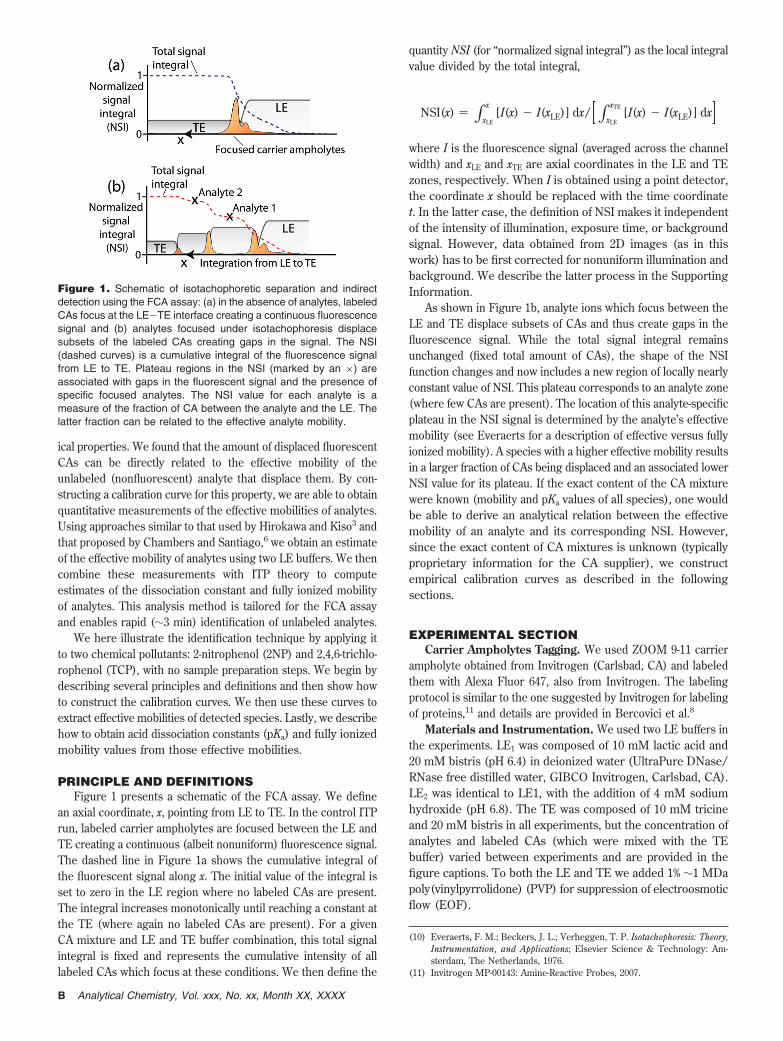
technique for construction of calibration curves. These curvesrelate NSI values to effective mobility. In this example we useLE2 and perform an FCA experiment to detect simultaneouslythe well characterized analytes listed earlier. A list of theanalytes, their dissociation constants, and fully ionized mobili-ties are provided in Table 1. Parts a and b of Figure 2,respectively, present the control signal (in the absence of analytes)and the detection signal, showing four new gaps in the signal,corresponding to the focused analytes. Despite their relatively high
concentrations, the MOPS and HEPES zones are significantlyshorter than the MES and ACES zones. This is expected sincethe focusing rate of each analyte is proportional to the ratio of itseffective mobility to the effective mobility of the TE.12 For a givenpH, weak acids with higher pKa values have lower effectivemobilities, accumulate at a lower rate, and result in shorterITP zones.
We determine the value of the NSI for each analyte at thecenter of its respective plateau. The NSI can be interpreted asthe area under the signal curve from the LE to the analyte. Thisis illustrated using the measured data (not schematics) in Figure2c, where the NSI value corresponds to the blue region underthe curve. For this calibration case of known LE and knownidealized analytes, we can analytically compute the effectivemobilities of each of these analytes.10 With this information, weconstruct Figure 2c, which shows the monotonic curve relatinganalyte NSI value with its (here) known effective mobility.
With the use of this curve (and/or fits to this curve), NSImeasurements of unknown analytes can be related to effectivemobility values. The accuracy clearly depends on the resolutionof the calibration curve. Lastly, we repeat this process andconstruct a second calibration curve for the same CAs and ideallyanalyze but now using LE1.
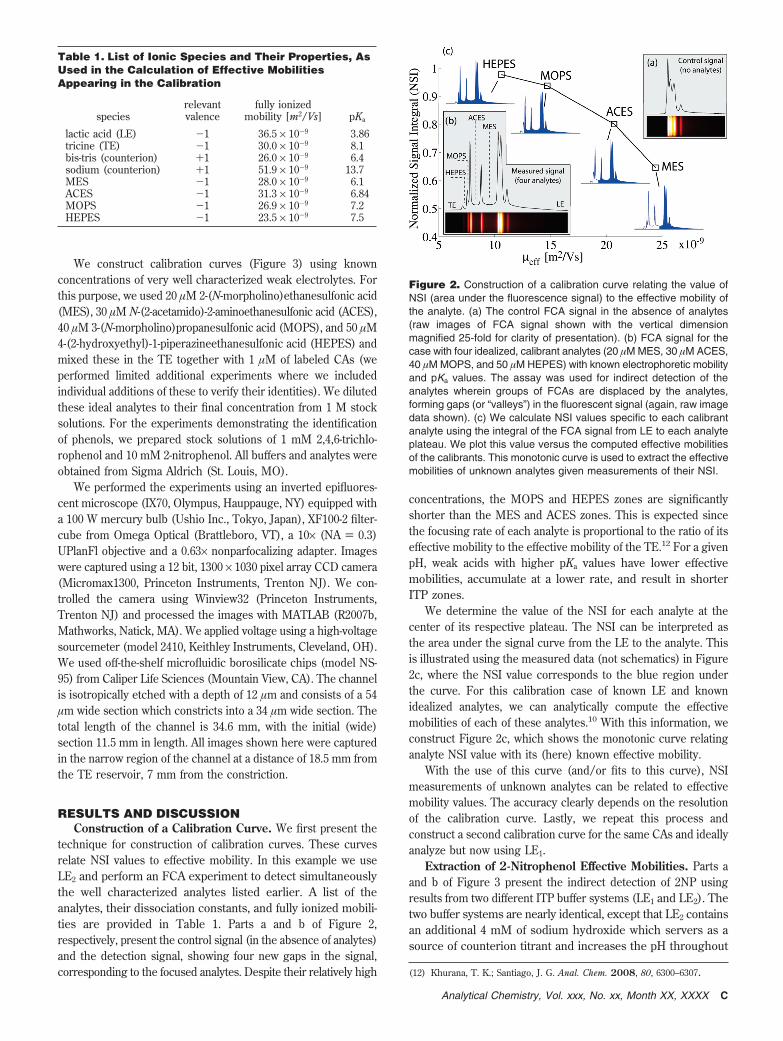
Extraction of 2-Nitrophenol Effective Mobilities. Parts aand b of Figure 3 present the indirect detection of 2NP usingresults from two different ITP buffer systems (LE1 and LE2). Thetwo buffer systems are nearly identical, except that LE2 containsan additional 4 mM of sodium hydroxide which servers as asource of counterion titrant and increases the pH throughout
(12) Khurana, T. K.; Santiago, J. G. Anal. Chem. 2008, 80, 6300–6307.
Table 1. List of Ionic Species and Their Properties, AsUsed in the Calculation of Effective MobilitiesAppearing in the Calibration
Figure 2. Construction of a calibration curve relating the value ofNSI (area under the fluorescence signal) to the effective mobility ofthe analyte. (a) The control FCA signal in the absence of analytes(raw images of FCA signal shown with the vertical dimensionmagnified 25-fold for clarity of presentation). (b) FCA signal for thecase with four idealized, calibrant analytes (20 µM MES, 30 µM ACES,40 µM MOPS, and 50 µM HEPES) with known electrophoretic mobilityand pKa values. The assay was used for indirect detection of theanalytes wherein groups of FCAs are displaced by the analytes,forming gaps (or “valleys”) in the fluorescent signal (again, raw imagedata shown). (c) We calculate NSI values specific to each calibrantanalyte using the integral of the FCA signal from LE to each analyteplateau. We plot this value versus the computed effective mobilitiesof the calibrants. This monotonic curve is used to extract the effectivemobilities of unknown analytes given measurements of their NSI.
the ITP system. We used these experiments to compute NSIvalues of 2NP for the two buffers and obtained values of 0.94and 0.91, respectively. Figure 3c presents the calibration curvesfor both buffer systems (the curve for LE2 is identical to the onepresented in Figure 2). We fit the data points in the calibrationcurves using two approximations: a linear interpolation (solid lines)and a quadratic best fit (dashed curves). In the subsequentanalysis steps, we use both fitting approaches and compare theirresults.
We found the intersect of each NSI value with the respectivecurve (one intersect for each LE as shown by the horizontaldashed lines) and extract the corresponding effective mobilityestimates (vertical dashed lines). Using the linear interpolationapproximation, we obtain for 2NP effective mobilities of 12.2(±0.3)× 10-9 and 15.8(±0.2) × 10-9 m2/V s for LE1 and LE2,respectively. The uncertainty bars indicate 95% confidence onthe mean given three repetitions. Using the quadratic best-fit,we obtain respective mobilities of 13.4(±0.3) × 10-9 and16.3(±0.2) × 10-9 m2/V s.
Calculation of pKa and Fully Ionized Mobility fromEffective Mobilities. Given an LE buffer composition, theproperties (e.g., concentration, effective mobility, conductivity) ofany ITP plateau zone can be semianalytically computed based onits fully ionized mobility and dissociation constants.10 Hirokawaand Kiso3 and later Jokl et al.4 and Pospichal et al.5 developed aniterative inverse-problem algorithm which, given a set of effectivemobility measurements, computes the fully ionized mobilities anddissociation constants of the analyte. We here use the sameapproach but provide a graphical representation of this inverseproblem, as suggested by Chambers and Santiago.6
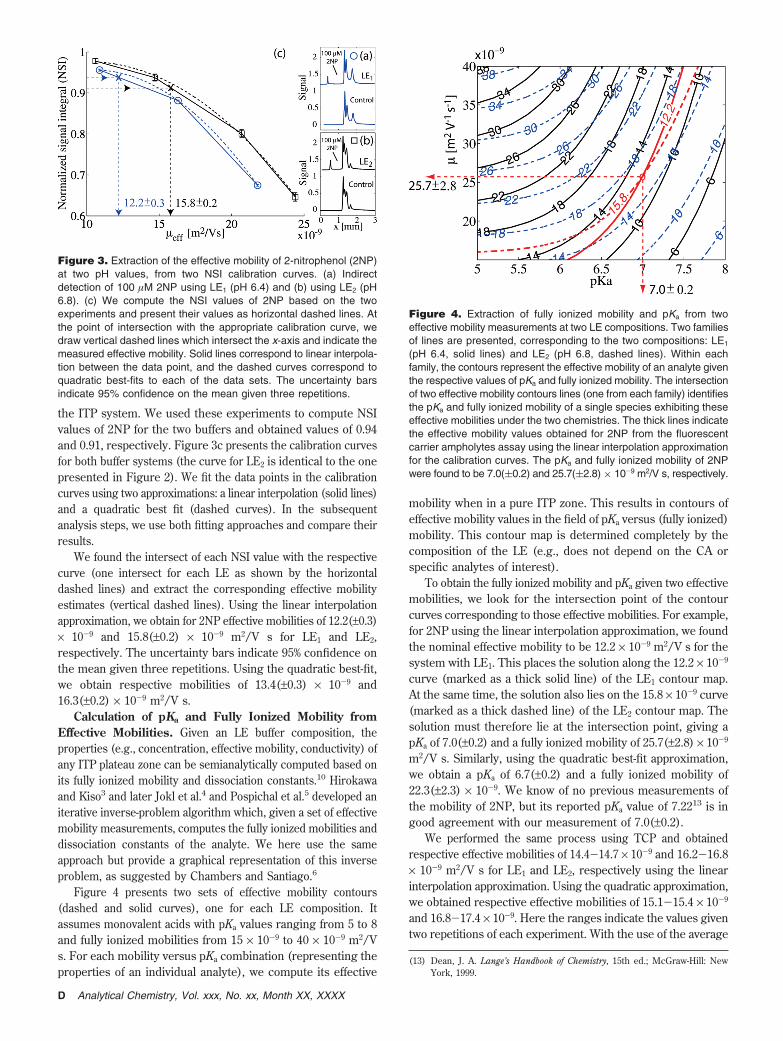
Figure 4 presents two sets of effective mobility contours(dashed and solid curves), one for each LE composition. Itassumes monovalent acids with pKa values ranging from 5 to 8and fully ionized mobilities from 15 × 10-9 to 40 × 10-9 m2/Vs. For each mobility versus pKa combination (representing theproperties of an individual analyte), we compute its effective
mobility when in a pure ITP zone. This results in contours ofeffective mobility values in the field of pKa versus (fully ionized)mobility. This contour map is determined completely by thecomposition of the LE (e.g., does not depend on the CA orspecific analytes of interest).
To obtain the fully ionized mobility and pKa given two effectivemobilities, we look for the intersection point of the contourcurves corresponding to those effective mobilities. For example,for 2NP using the linear interpolation approximation, we foundthe nominal effective mobility to be 12.2 × 10⁻⁹ m2/V s for thesystem with LE1. This places the solution along the 12.2 × 10⁻⁹
curve (marked as a thick solid line) of the LE1 contour map.At the same time, the solution also lies on the 15.8 × 10⁻⁹ curve(marked as a thick dashed line) of the LE2 contour map. Thesolution must therefore lie at the intersection point, giving apKa of 7.0(±0.2) and a fully ionized mobility of 25.7(±2.8) × 10-9
m2/V s. Similarly, using the quadratic best-fit approximation,we obtain a pKa of 6.7(±0.2) and a fully ionized mobility of22.3(±2.3) × 10-9. We know of no previous measurements ofthe mobility of 2NP, but its reported pKa value of 7.2213 is ingood agreement with our measurement of 7.0(±0.2).
We performed the same process using TCP and obtainedrespective effective mobilities of 14.4-14.7 × 10⁻⁹ and 16.2-16.8× 10⁻⁹ m2/V s for LE1 and LE2, respectively using the linearinterpolation approximation. Using the quadratic approximation,we obtained respective effective mobilities of 15.1-15.4 × 10⁻⁹
and 16.8-17.4 × 10⁻⁹. Here the ranges indicate the values giventwo repetitions of each experiment. With the use of the average
(13) Dean, J. A. Lange’s Handbook of Chemistry, 15th ed.; McGraw-Hill: NewYork, 1999.
Figure 3. Extraction of the effective mobility of 2-nitrophenol (2NP)at two pH values, from two NSI calibration curves. (a) Indirectdetection of 100 µM 2NP using LE1 (pH 6.4) and (b) using LE2 (pH6.8). (c) We compute the NSI values of 2NP based on the twoexperiments and present their values as horizontal dashed lines. Atthe point of intersection with the appropriate calibration curve, wedraw vertical dashed lines which intersect the x-axis and indicate themeasured effective mobility. Solid lines correspond to linear interpola-tion between the data point, and the dashed curves correspond toquadratic best-fits to each of the data sets. The uncertainty barsindicate 95% confidence on the mean given three repetitions.
Figure 4. Extraction of fully ionized mobility and pKa from twoeffective mobility measurements at two LE compositions. Two familiesof lines are presented, corresponding to the two compositions: LE1
(pH 6.4, solid lines) and LE2 (pH 6.8, dashed lines). Within eachfamily, the contours represent the effective mobility of an analyte giventhe respective values of pKa and fully ionized mobility. The intersectionof two effective mobility contours lines (one from each family) identifiesthe pKa and fully ionized mobility of a single species exhibiting theseeffective mobilities under the two chemistries. The thick lines indicatethe effective mobility values obtained for 2NP from the fluorescentcarrier ampholytes assay using the linear interpolation approximationfor the calibration curves. The pKa and fully ionized mobility of 2NPwere found to be 7.0((0.2) and 25.7((2.8) × 10-9 m2/V s, respectively.
D Analytical Chemistry, Vol. xxx, No. xx, Month XX, XXXX
of these values, Figure 4 yields a pKa of 6.26 and a fully ionizedmobility of 19.4 × 10⁻⁹ m2/V s (not shown in the figure) usingthe linear interpolation approximation, and a pKa of 6.1 andfully ionized mobility of 19.5 × 10⁻⁹ using the quadraticapproximation. Reported values for the pKa of TCP range from6.014 to 6.23,15 again in fairly good agreement with ourmeasurement. We note that as demonstrated by the calibrationcurves, multiplexed detection and identification of analytes isalso possible. In the Supporting Information we present anexample experiment where we detect 2NP and TCP simulta-neously in the same ITP separation.
CONCLUSIONS AND RECOMMENDATIONSWe demonstrated that our fluorescent carrier ampholyte
technique can be used to estimate the fully ionized mobility anddissociation constant of detected analyte ions. These physico-chemical properties can be used to identify analytes with little orno a priori knowledge, short analysis time, and no samplepreparation.
We have shown that the fraction of fluorescent carrier am-pholytes displaced by ITP focused analytes can be quantified byintegration and appropriate normalization of the fluorescencesignal. To this end, we defined and presented a method forcalculating a normalized value, NSI, defined as the signal integralfrom LE to analyte normalized by the total signal integral (fromLE to TE). NSI is proportional to the amount of CA focusedbetween the LE and analyte. We showed that the NSI of an ionicanalyte is monotonic with the effective mobility it acquires in itsrespective ITP zone. We used this property to construct twocalibration curves, based on two different LE buffers, which canbe used to convert experimentally measured NSI values toeffective mobility values. Once effective mobilities are obtained,we use an ITP theory (and associated effective mobility contoursversus fully ionized mobility and pKa) to retrieve the analyte ion’sfully ionized mobility and pKa. We demonstrated this processfor the detection and identification of 2-nitrophenol and 2,4,6-
trichlorophenol and obtained respective dissociation constantsin good agreement with published values.
In future work we will seek to improve the accuracy, resolution,and multiplexing capability of the technique. We here offer severalideas and suggestions along this line. First, additional calibrantanalytes should be used to improve the accuracy of interpolation(e.g., as in Figure 3). As shown here, different approximations ofthe calibration curves (i.e., linear interpolation vs quadratic fit)can result in differences in extracted pKa values of approximately5% (e.g., pKa 7 with linear interpolation vs pKa 6.7 with quadraticbest-fit). The results clearly depend on the resolution of thecalibration curve, and we expect that additional calibrationpoints (i.e., performing the assay on additional species whosemobility and pKa are known) should improve the accuracy.Second, LE buffers should be selected to optimize the shapeof the mobility contour map (as in Figure 4). For example, assuggested by Chambers and Santiago,6 LE combinations shouldbe chosen to increase the angles between intersecting contourlines, thus minimizing the error associated with the estimates ofpKa and fully ionized mobility given inaccuracies in effectivemobility measurement. Lastly, we hope to explore the practiceof adding calibrant analytes to actual samples as an internalstandard and simultaneous calibration in a single experiment.Further, we hope to explore the use of two simultaneous ITPruns in the same chip using a common TE reservoir, to reducethe analysis time and sample variability between runs. As wehave shown in a separate work,8 the FCA assay can beintegrated in a self-contained hand-held device. We envisionimplementing this identification technique and its relatedalgorithms to enable low-cost and portable identification ofanalytes in point of service settings.
SUPPORTING INFORMATION AVAILABLEAdditional information as noted in text. This material is
available free of charge via the Internet at http://pubs.acs.org.
Received for review November 10, 2009. AcceptedDecember 26, 2009.
AC9025658(14) Knovel Critical Tables, 2nd ed.; Knovel Corp.: Norwich, NY, 2003.(15) Bartak, P.; Cap, L. J. Chromatogr., A 1997, 767, 171–175.