Page 1
http://method-gapp.com
Method – GAPPPredicting and Profiling of End-User Performance while Focussing
on AWR Data
Gerwin HendriksenIT Architect
a Method to Diagnose and Predict Performance in Complex Architectures
V1.2
[email protected]
Page 2
http://method-gapp.com
Who I am…
• Started as DBA at Dedicate (later called Parity) for 1.5 years
• Worked for 5 years at Oracle The Netherlands– First 1.5 year as RDBMS analyst
– Rest worked as ARE EBS Performance and RAC• This included Content Lead of EBS with RAC world wide
• Worked for 2 years at IBM– Business Consultancy Services
• Worked for 3 years at AMIS Services BV
• Currently working for IT-eye as IT Architect
2
Page 3
http://method-gapp.com
Agenda…
• What is Method-GAPP
• When to use Method-GAPP
• End-User processes and infrastructure
• The Five D’s from Method-GAPP
• AWR data usage
• Conclusions
• Q/A
3
Page 4
http://method-gapp.com
What is Method-GAPP
4
Page 5
http://method-gapp.com
What is Method-GAPP…
“GAPP” is an abbreviation of:
“General Approach Performance
Profiling”
5
Method-GAPP is a performance method which makes
smart use of underlying queuing models and data
mining to find bottlenecks in complex architectures, for
specific end-user processes within an enterprise.
Page 6
http://method-gapp.com
The Five D’s from Method-GAPP…
• Data Collection
• Data Synchronization
• Data Modeling
• Data Mining
• Data Interpretation
6© Slide by G. Hendriksen 2010
Mixed a bit !!
Page 7
http://method-gapp.com
When to use
Method-GAPP
7
Page 8
http://method-gapp.com
When…
• End user processes are sometimes too slow and
the cause hard to be determined.
• The technical infrastructure has shared
components like a SAN, Server, etc.
• The application is hard to be debugged, because it
is a third party application.
8
Page 9
http://method-gapp.com
• Virtualization
• Shared Components
• Many applications, sharing the same technical infra structure
– 10’s - 1000’s
• Performance problems occur in production can’t be all reproduced in test due to unknown inter-application influences
9
© Slide by G. Hendriksen 2011
Page 10
http://method-gapp.com
It would be great if…
• You could find the cause of such problems without
– Changing code (hooks)
– Technology dependency
• You could even find out the influence of other applications on our end user processes.
• You could predict what the performance impact would be before doing investments.
10
Page 11
http://method-gapp.com
End-User processes and
infrastructure
11
Page 12
http://method-gapp.com
Method-R and the sequence diagram…
AS NET DS SAN STOR • The Business Processes are
shown in different colors.
• R=S+Q or R=R1+R2+…
• Response Time (R)
• Service Time (S)
• Wait Time (Q)
R
R
R
R
R
RQ
S
Time Time Time
Tiers
12© Diagram by G. Hendriksen 2008, inspired by diagrams from Cary Millsap
Page 13
http://method-gapp.com
Highlighted the “Red” process…
AS NET DS SAN STOR
R R
Q S
Time Time Time
Tiers
Time
13© Diagram by G. Hendriksen 2008, inspired by diagrams from Cary Millsap
Page 14
http://method-gapp.com
The First Two D’s
Data Collection & Data
Synchronization14
Page 15
http://method-gapp.com
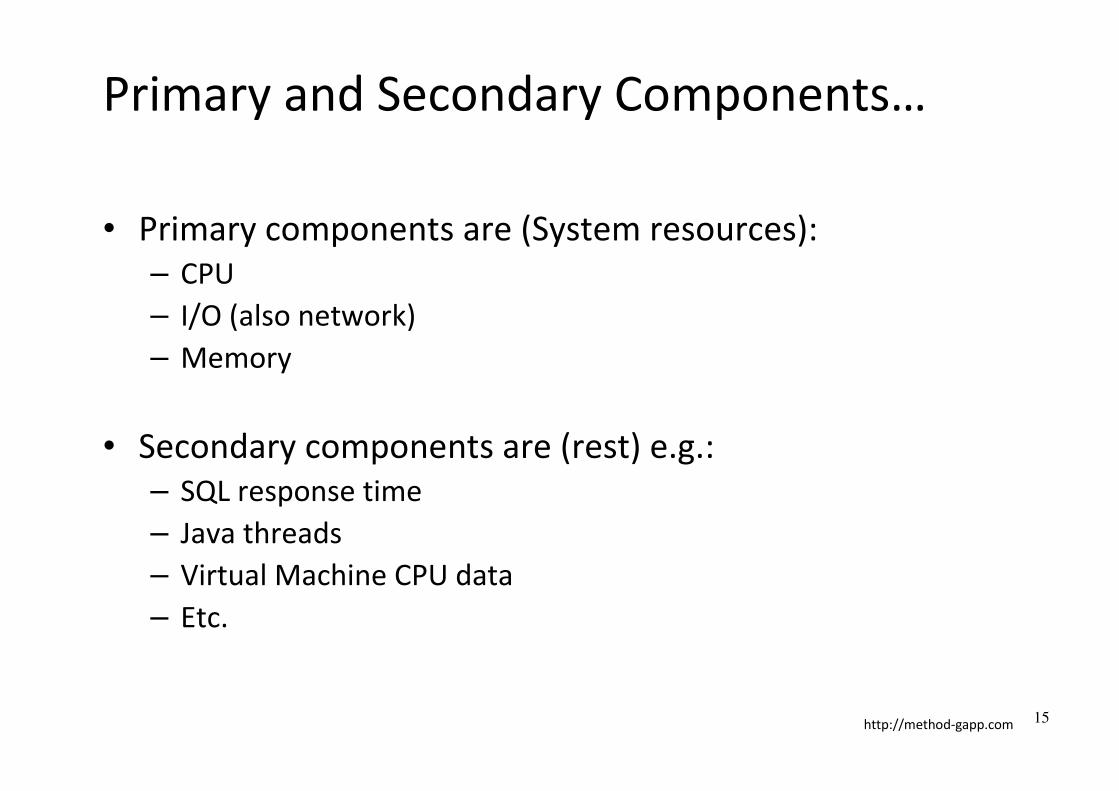
Primary and Secondary Components…
• Primary components are (System resources):
– CPU
– I/O (also network)
– Memory
• Secondary components are (rest) e.g.:
– SQL response time
– Java threads
– Virtual Machine CPU data
– Etc.
15
Page 16
http://method-gapp.com
Data Collection and Data Synchronization…
Etc……
© Graphs by G. Hendriksen 2008 16© Picture by G. Hendriksen 2008
Page 17
http://method-gapp.com
Data Synchronization…
• Aggregate data on time stamps
• Be aware of time differences
• Make sure that big workload changes are
identified in your data
• Values examination
• Etc.
17
Page 18
http://method-gapp.com
The Fourth D
Data Mining – Explain(The third D will be explained later)
18
Page 19
http://method-gapp.com
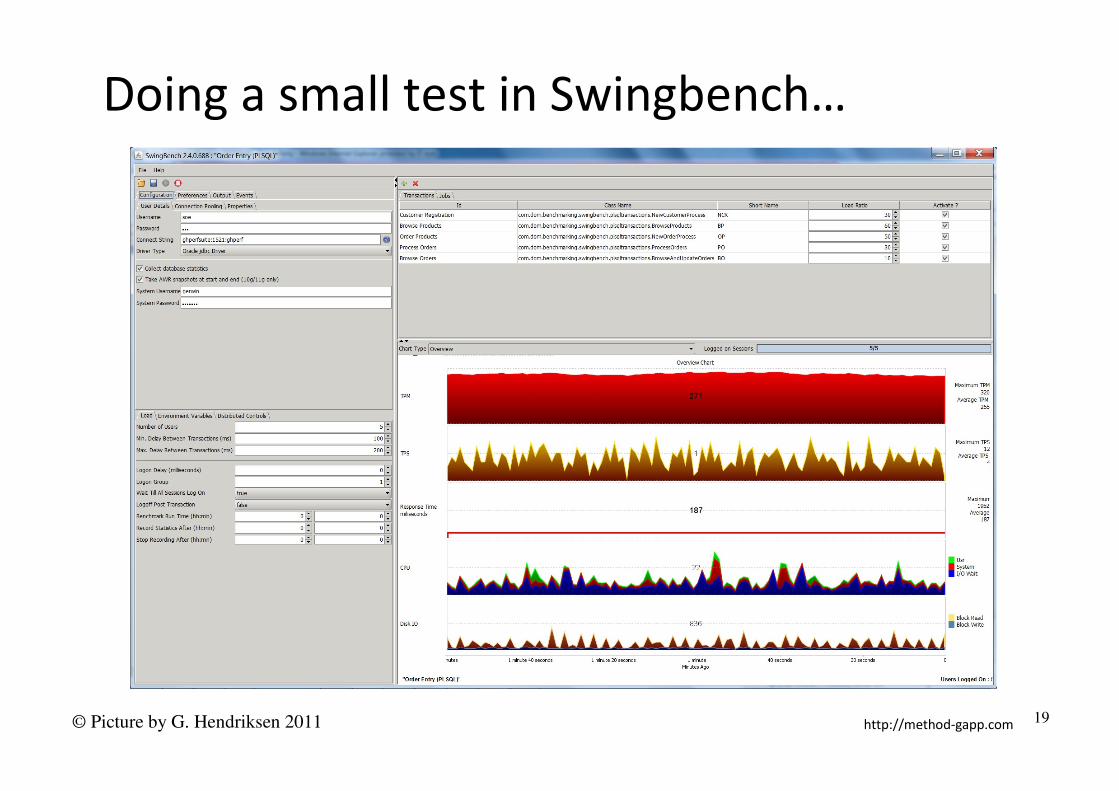
Doing a small test in Swingbench…
© Picture by G. Hendriksen 2011 19
Page 20
http://method-gapp.com
Gathered data in the test…
• Client data (Swingbench)
• SAR data on the linux virtual machine
• AWR data on the 11.2.0.3 database
20
Do the data synchronization and…
Page 21
http://method-gapp.com
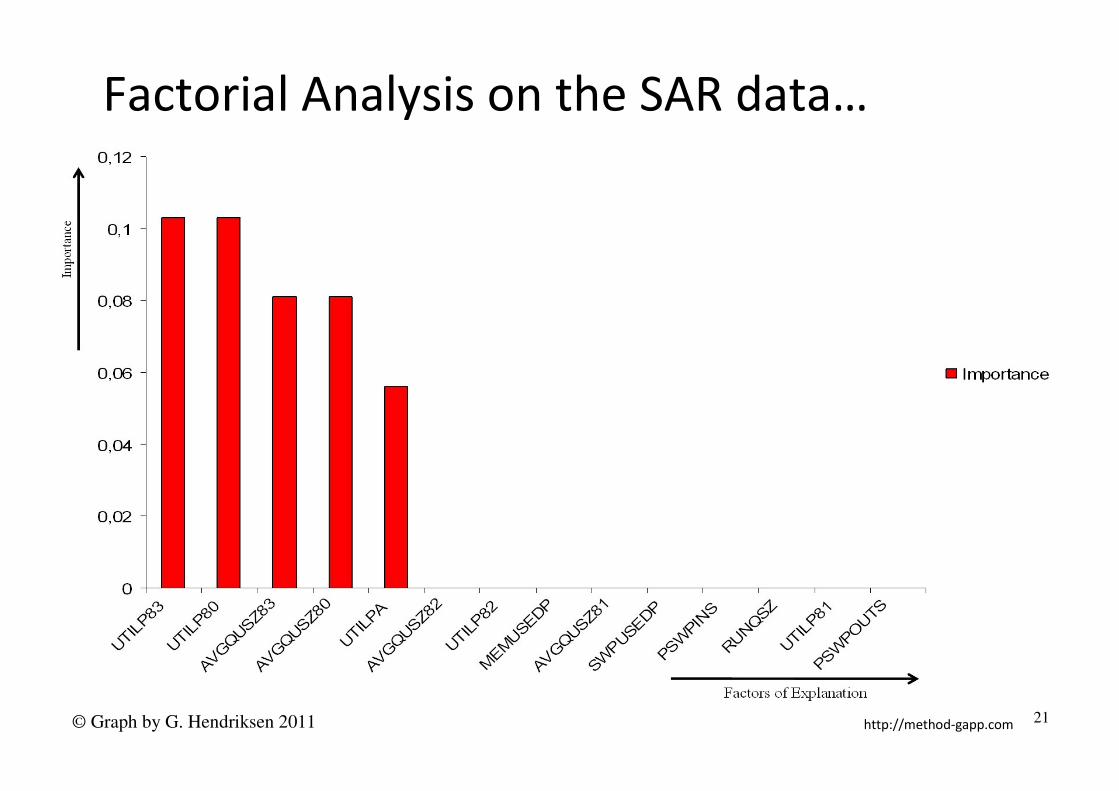
Factorial Analysis on the SAR data…
© Graph by G. Hendriksen 2011 21
Page 22
http://method-gapp.com
The Importance / Index number…
• Basically we search for the block with the
biggest variance
• The factor with the biggest variance in the
total of “Wait Time” + “Stretched Service
Time”, will have the highest index number.
• So the higher the Index number, the higher
the impact on the total variance of R, and so
worth investigation.
22
R
Q S
Time
Coherency
Delay *
Highest
Index
number
* Coherency Delay simplified
© Diagram by G. Hendriksen 2010, inspired by diagrams from Cary Millsap
Page 23
http://method-gapp.com
The Third D
Data Modeling
23
Page 24
http://method-gapp.com
Normalized R based on Erlang-C…
0
2
4
6
8
10
0,0 0,1 0,2 0,3 0,4 0,5 0,6 0,7 0,8 0,9 1,0
R_M1
R_M2
R_M4
R_M8
R_M16
R_M32
R_M64
Norm
aliz
ed R
esponse
tim
e R
/S (
ms)
utilization (ρ)
© Graph by G. Hendriksen 2011 24
Page 25
http://method-gapp.com
∑−
=+−
=1
0 !
)(
!
)()1(
!
)(
),(m
n
mn
m
m
m
n
m
m
m
mCρρ
ρ
ρ
ρ
Sm
SmCR +
−=
)1(
),(
ρ
ρ
Erlang-C formula and R calculation…
© Formula’s from Erlang, derived from “Analyzing Comp. System Perf.” by N.J. Gunther, 2005 25
Page 26
http://method-gapp.com
Why doing data modeling…
• The data modeling is done to be able to do:
– Multi Linear Regression Data Mining
– Able to create a linear function to describe the end-
user response time (R)
– When having a linear function we can determine the
service time (S) and queuing time (Q) per component
26
Page 27
http://method-gapp.com
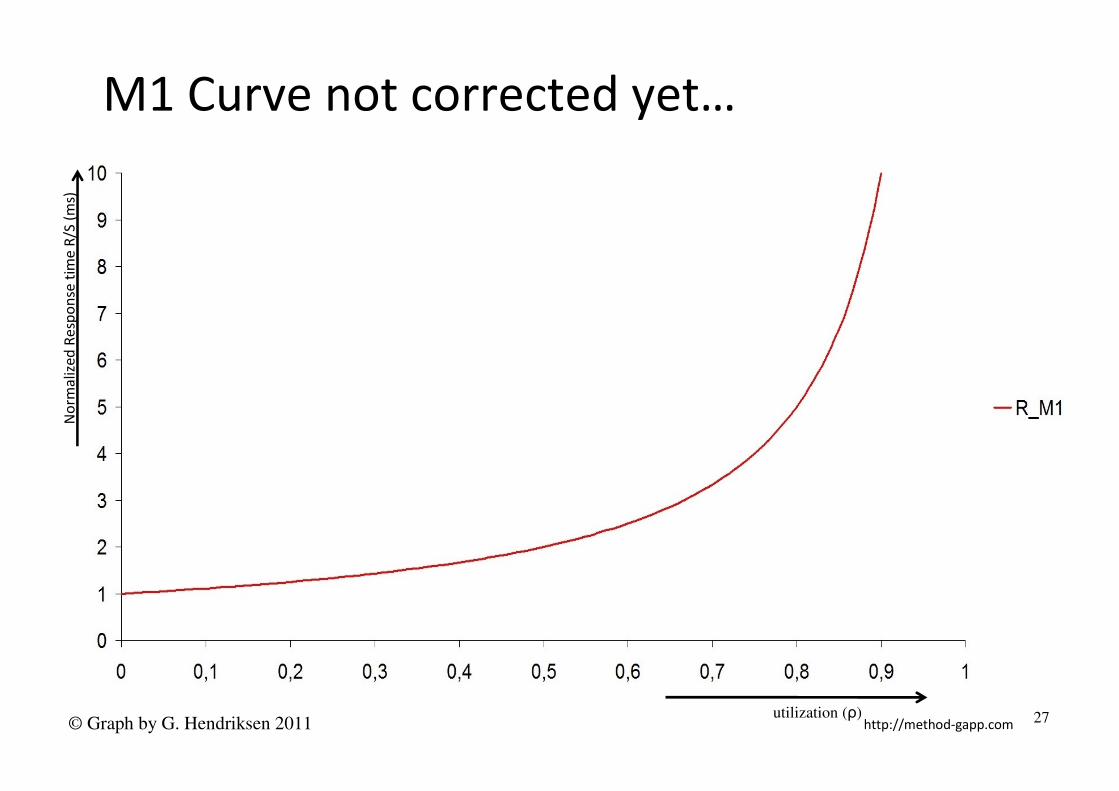
M1 Curve not corrected yet…N
orm
aliz
ed
Re
spo
nse
tim
e R
/S (
ms)
utilization (ρ) 27© Graph by G. Hendriksen 2011
Page 28
http://method-gapp.com
0,9
28
0 0,5 0,8
M1 Curve corrected by the modelling…N
orm
aliz
ed
Re
spo
nse
tim
e R
/S (
ms)
utilization (ρ)© Graph by G. Hendriksen 2011
Page 29
http://method-gapp.com
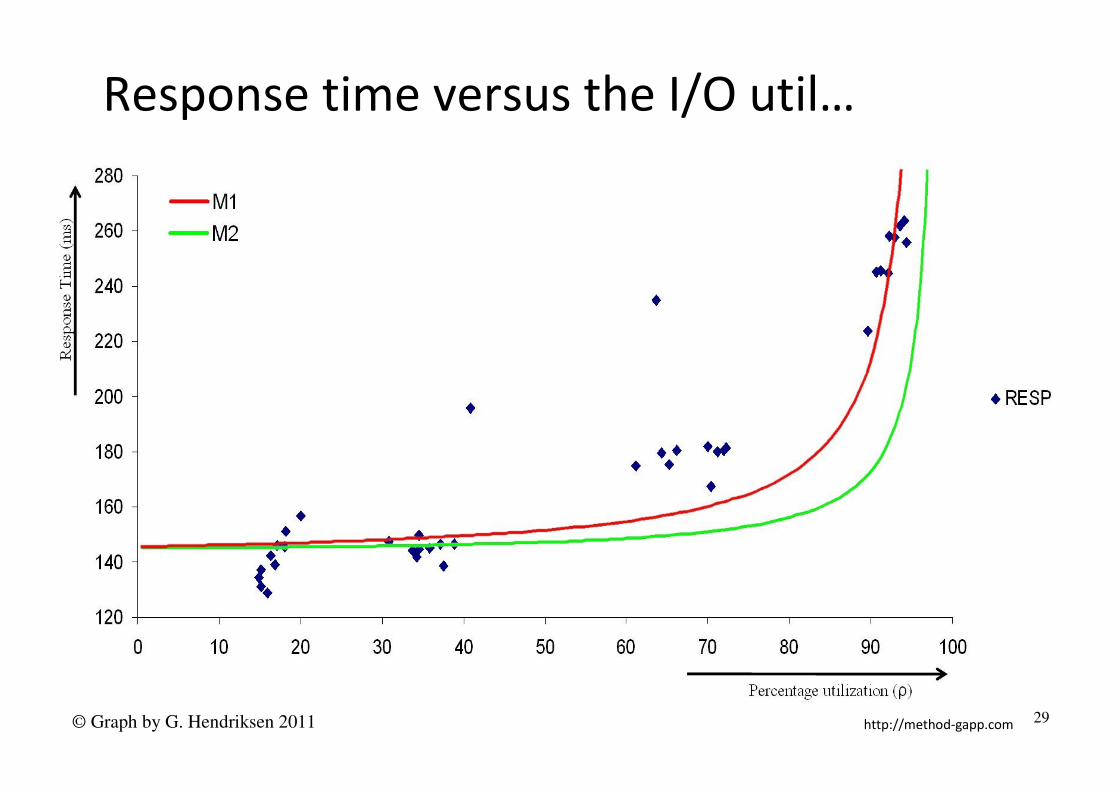
Response time versus the I/O util…
© Graph by G. Hendriksen 2011 29
Page 30
http://method-gapp.com
The Fourth D
Data Mining – Model(Second part of the fourth D)
30
Page 31
http://method-gapp.com
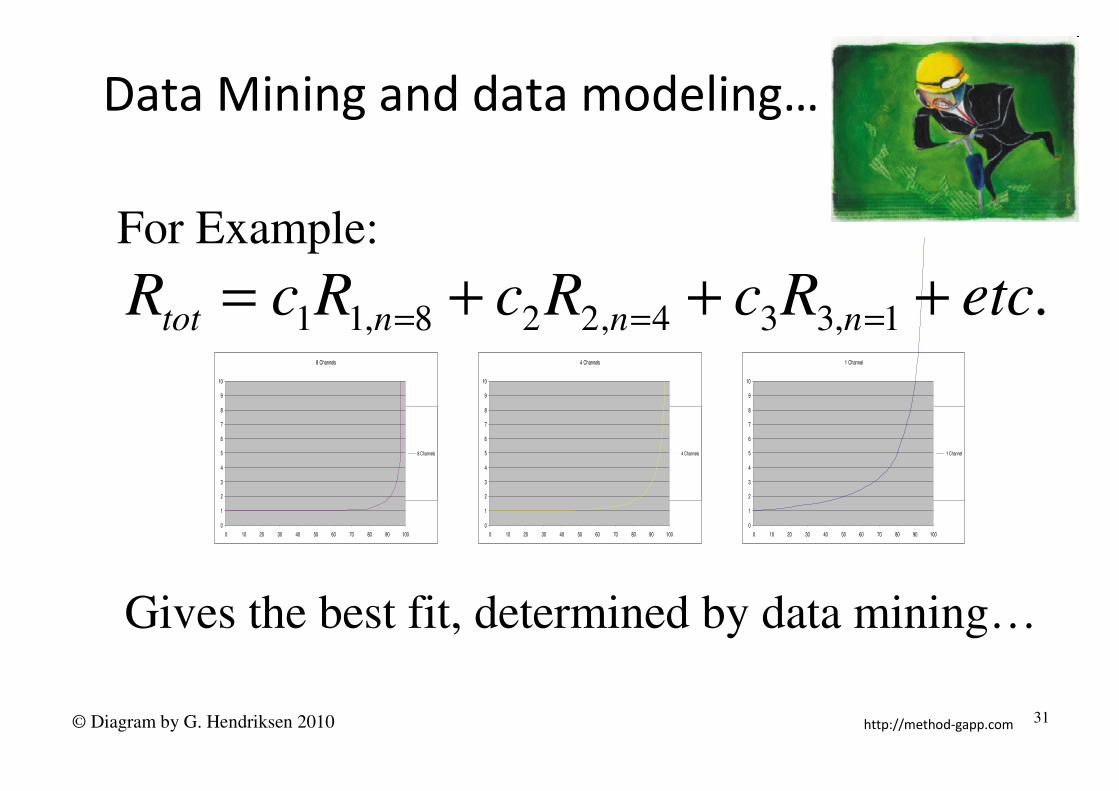
Data Mining and data modeling…
1 Channel
0
1
2
3
4
5
6
7
8
9
10
0 10 20 30 40 50 60 70 80 90 100
1 Channel
4 Channels
0
1
2
3
4
5
6
7
8
9
10
0 10 20 30 40 50 60 70 80 90 100
4 Channels
8 Channels
0
1
2
3
4
5
6
7
8
9
10
0 10 20 30 40 50 60 70 80 90 100
8 Channels
For Example:
Gives the best fit, determined by data mining…
.1,334,228,11 etcRcRcRcR nnntot +++====
31© Diagram by G. Hendriksen 2010
Page 32
http://method-gapp.com
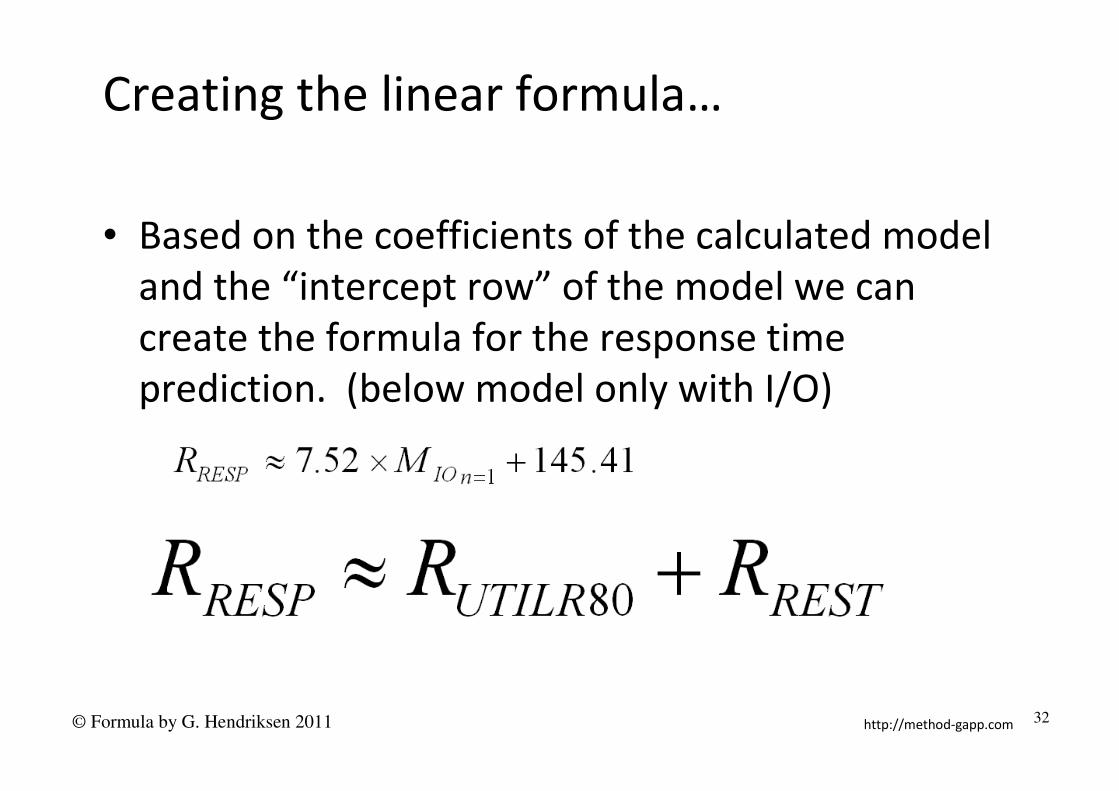
Creating the linear formula…
• Based on the coefficients of the calculated model
and the “intercept row” of the model we can
create the formula for the response time
prediction. (below model only with I/O)
32© Formula by G. Hendriksen 2011
Page 33
http://method-gapp.com
Finding Service Time (S)…
• When the corrected factors of the components
are normalized, that means R/S (M-Curve fitting)
– Than c1 is the Service time (S) for CPU (UTILRAU)
– Than c2 is the Service time (S) for I/O util. (UTILR80)
© Formula by G. Hendriksen 2011 33
Page 34
http://method-gapp.com
The modeled I/O utilization with M1…
© Graph by G. Hendriksen 2011 34
Page 35
http://method-gapp.com
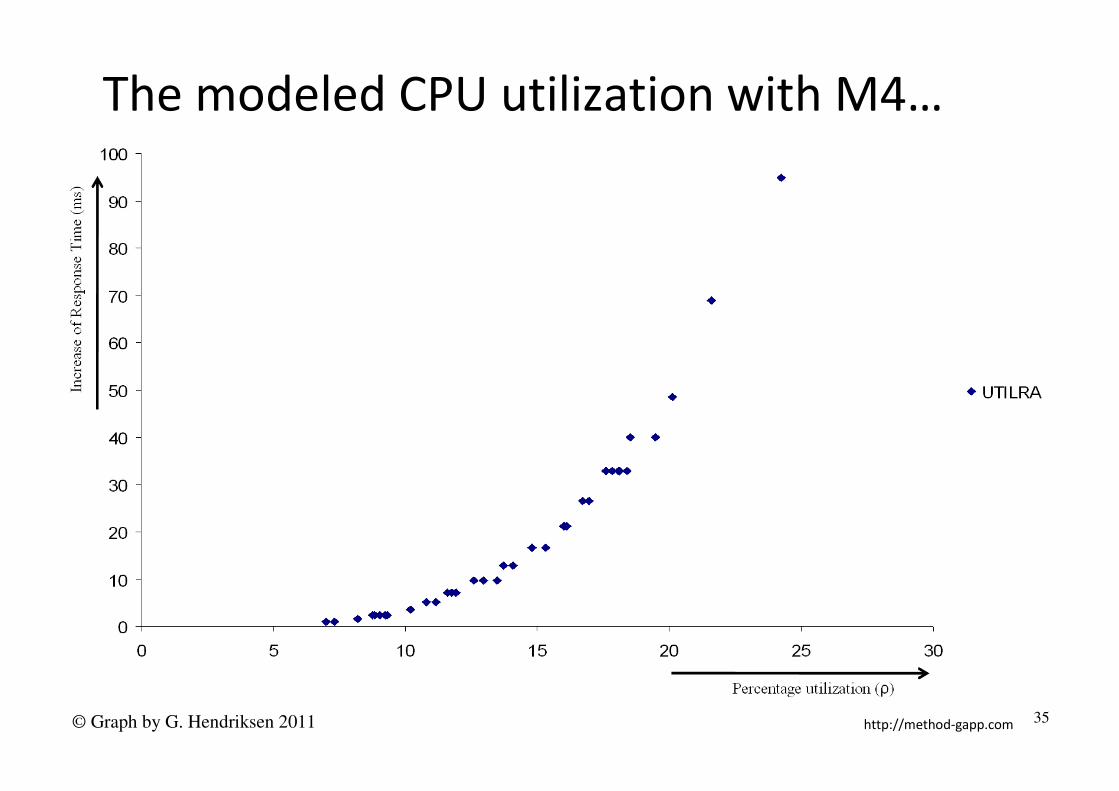
The modeled CPU utilization with M4…
© Graph by G. Hendriksen 2011 35
Page 36
http://method-gapp.com
The model with the breakdown…
© Graph by G. Hendriksen 2011 36
Page 37
http://method-gapp.com
Models in compare with R measured…
© Graph by G. Hendriksen 2011 37
Page 38
http://method-gapp.com
AWR Data usageFourth D Data Mining – Explain
using secondary component data
38
Page 39
http://method-gapp.com
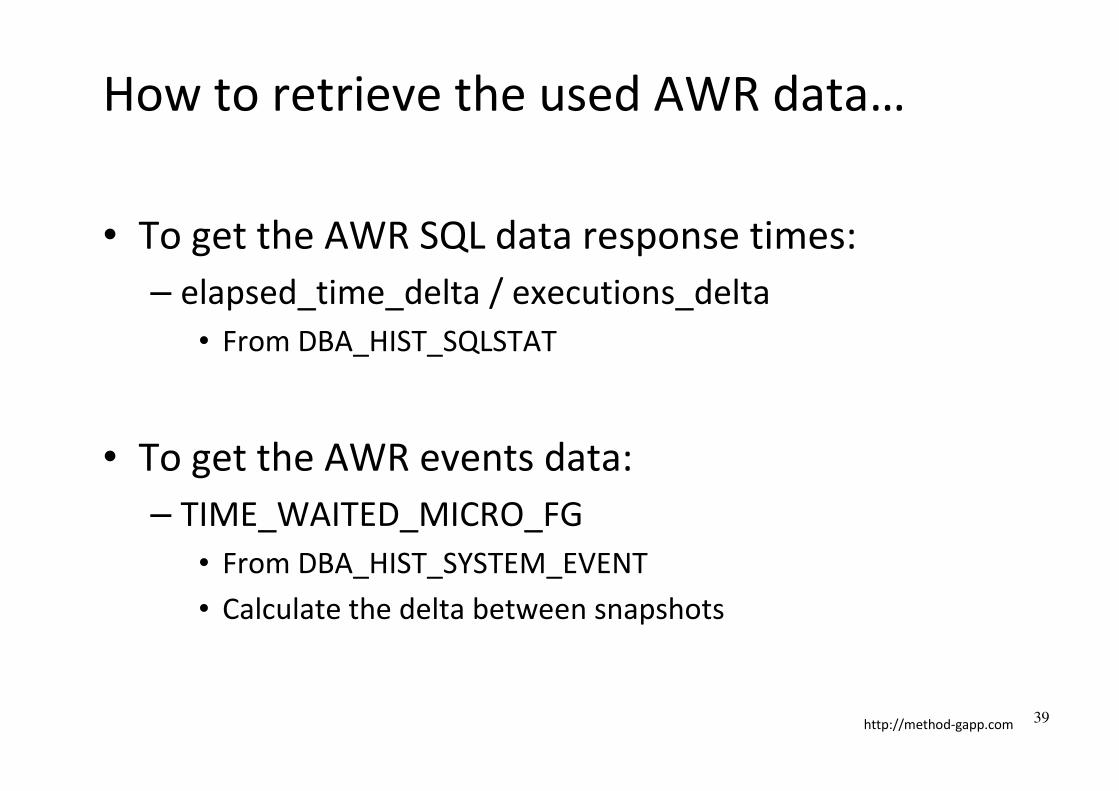
How to retrieve the used AWR data…
• To get the AWR SQL data response times:
– elapsed_time_delta / executions_delta
• From DBA_HIST_SQLSTAT
• To get the AWR events data:
– TIME_WAITED_MICRO_FG
• From DBA_HIST_SYSTEM_EVENT
• Calculate the delta between snapshots
39
Page 40
http://method-gapp.com
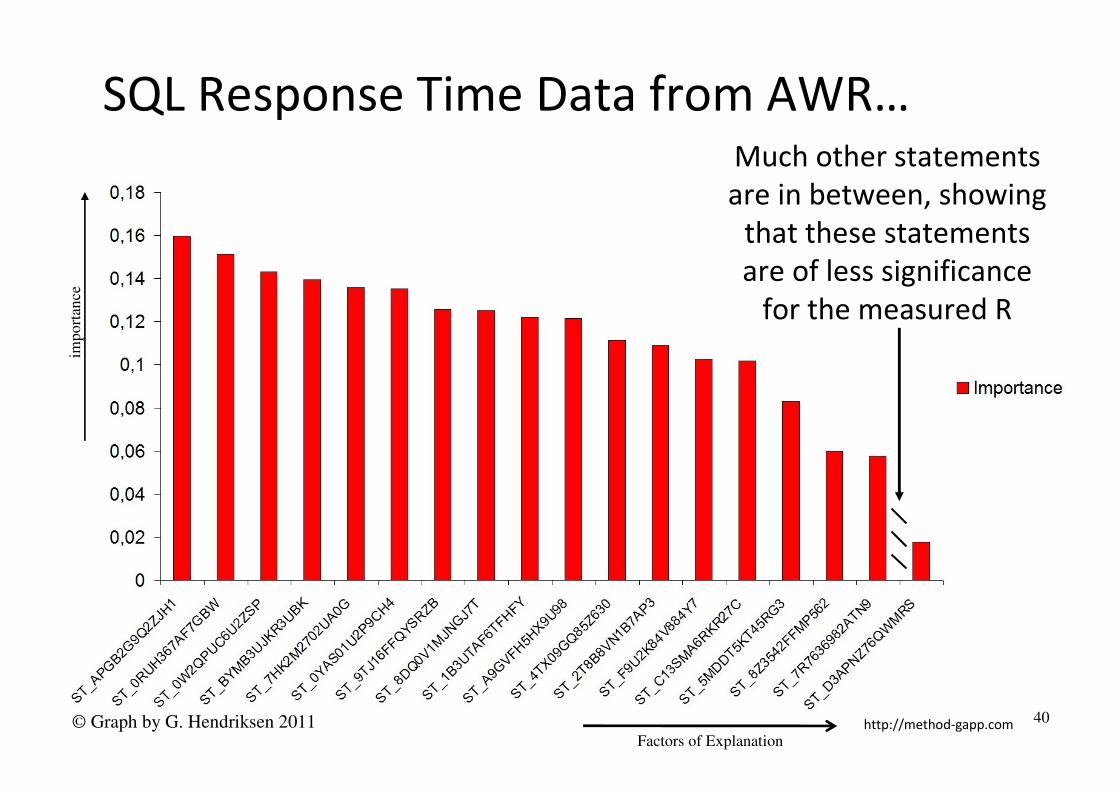
SQL Response Time Data from AWR…Much other statements
are in between, showing
that these statements
are of less significance
for the measured R
import
ance
Factors of Explanation
40© Graph by G. Hendriksen 2011
Page 41
http://method-gapp.com
Involved important Statements…• 'apgb2g9q2zjh1‘
– BEGIN :1 := orderentry.browseandupdateorders(:2 ,:3 ,:4 ); END;
• '0ruh367af7gbw‘
– SELECT ORDER_ID, ORDER_MODE, CUSTOMER_ID, ORDER_STATUS, ORDER_TOTAL, SALES_REP_ID, PROMOTION_ID FROM ORDERS WHERE CUSTOMER_ID = :B2 AND ROWNUM < :B1
• '0w2qpuc6u2zsp‘
– BEGIN :1 := orderentry.neworder(:2 ,:3 ,:4 ); END;
• 'bymb3ujkr3ubk‘
– INSERT INTO ORDERS(ORDER_ID, ORDER_DATE, CUSTOMER_ID, WAREHOUSE_ID) VALUES (ORDERS_SEQ.NEXTVAL + :B3 , SYSTIMESTAMP , :B2 , :B1 ) RETURNING ORDER_ID INTO :O0
• '7hk2m2702ua0g‘
– WITH NEED_TO_PROCESS AS (SELECT ORDER_ID, CUSTOMER_ID FROM ORDERS WHERE ORDER_STATUS <= 4 AND WAREHOUSE_ID = :B1 AND ROWNUM < 10 ) …
• '0yas01u2p9ch4‘
– INSERT INTO ORDER_ITEMS(ORDER_ID, LINE_ITEM_ID, PRODUCT_ID, UNIT_PRICE, QUANTITY) VALUES (:B4 , :B3 , :B2 , :B1 , 1)
• Etc.
• Not significant statement: 'd3apnz76qwmrs'
– select pol#, usr_name, usr_labels, package, privs from lbac$user_logon where usr_name = :username
41
Page 42
http://method-gapp.com
Events Data from AWR…im
port
ance
Factors of Explanation42© Graph by G. Hendriksen 2011
Page 43
http://method-gapp.com
Involved wait events…
• SQL*Net message from client
• PL/SQL lock timer
• SQL*Net message to client
• log file sync
• latch: row cache objects
• control file sequential read
• db file sequential read
• Etc.
43
The data used in Method-GAPP was over a lot of hours the
AWR report shown only over a 10 minute time slice.
Page 44
http://method-gapp.com
The Fourth D
Data Mining - Predict
44
Page 45
http://method-gapp.com
What will happen with 2 channels…
© Graph by G. Hendriksen 2011 45
Page 46
http://method-gapp.com
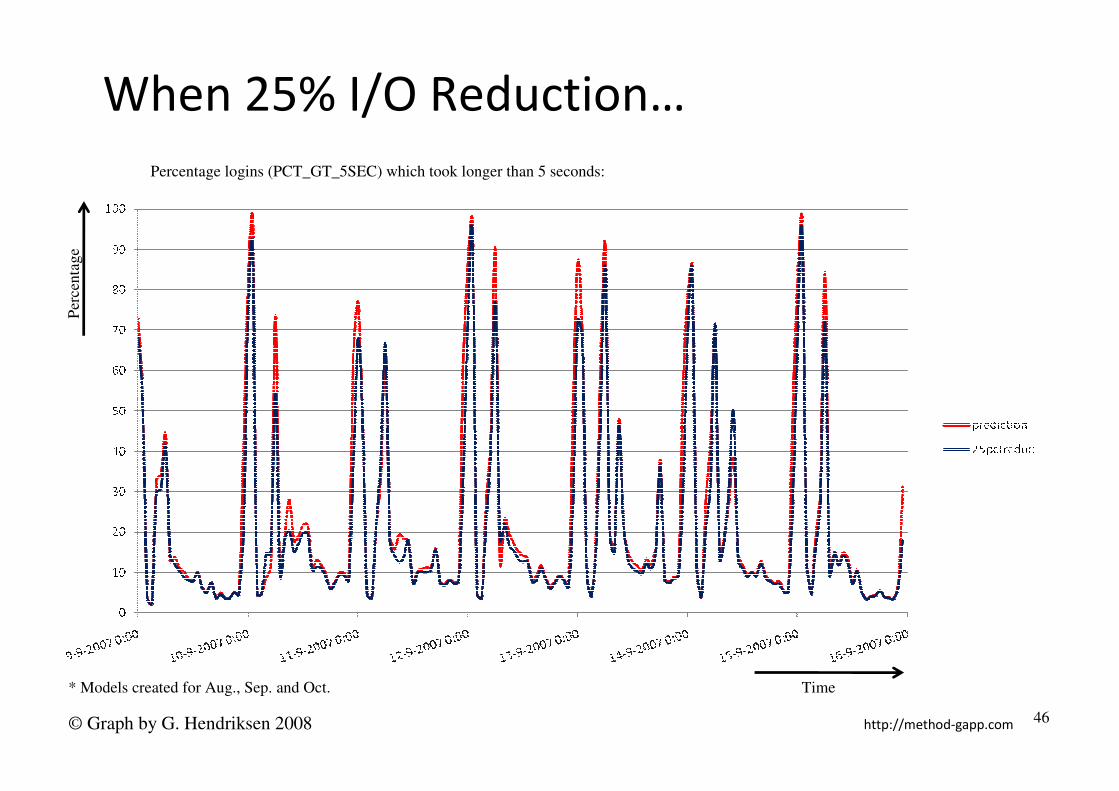
When 25% I/O Reduction…
Time
Per
centa
ge
Percentage logins (PCT_GT_5SEC) which took longer than 5 seconds:
* Models created for Aug., Sep. and Oct.
© Graph by G. Hendriksen 2008 46
Page 47
http://method-gapp.com
The Fifth D
Data Interpretation
47
Page 48
http://method-gapp.com
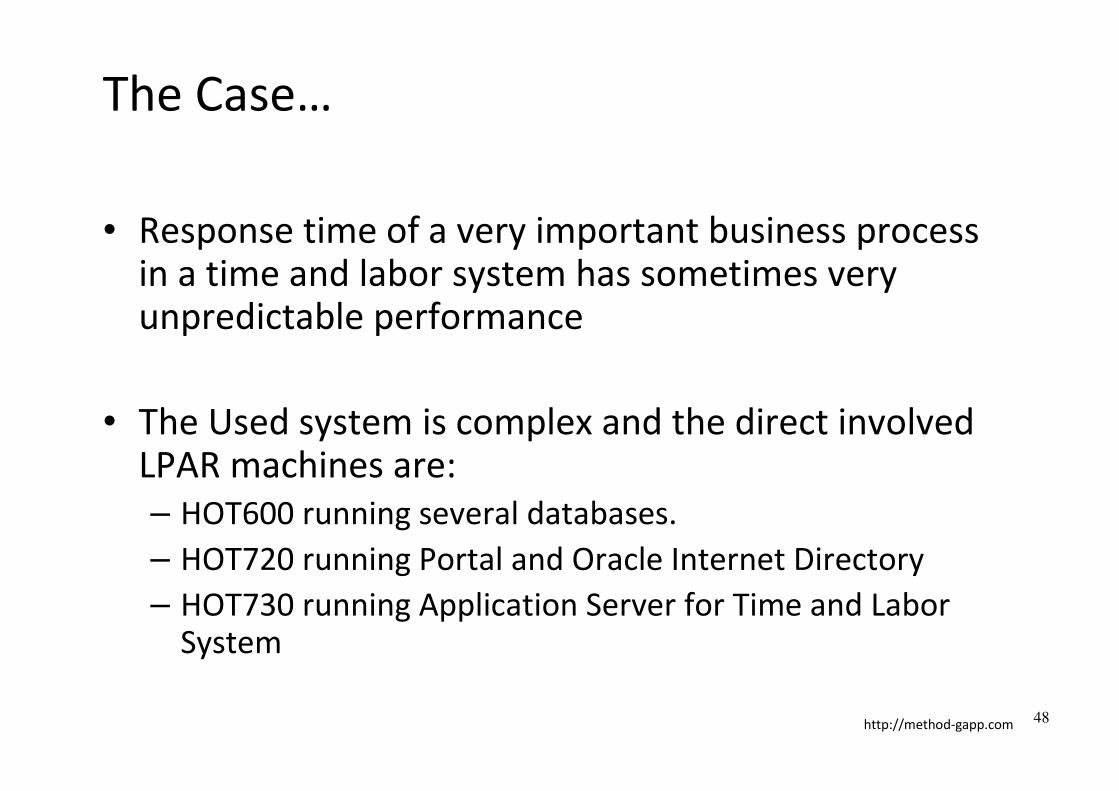
The Case…
• Response time of a very important business process in a time and labor system has sometimes very unpredictable performance
• The Used system is complex and the direct involved LPAR machines are:
– HOT600 running several databases.
– HOT720 running Portal and Oracle Internet Directory
– HOT730 running Application Server for Time and Labor System
48
Page 49
http://method-gapp.com
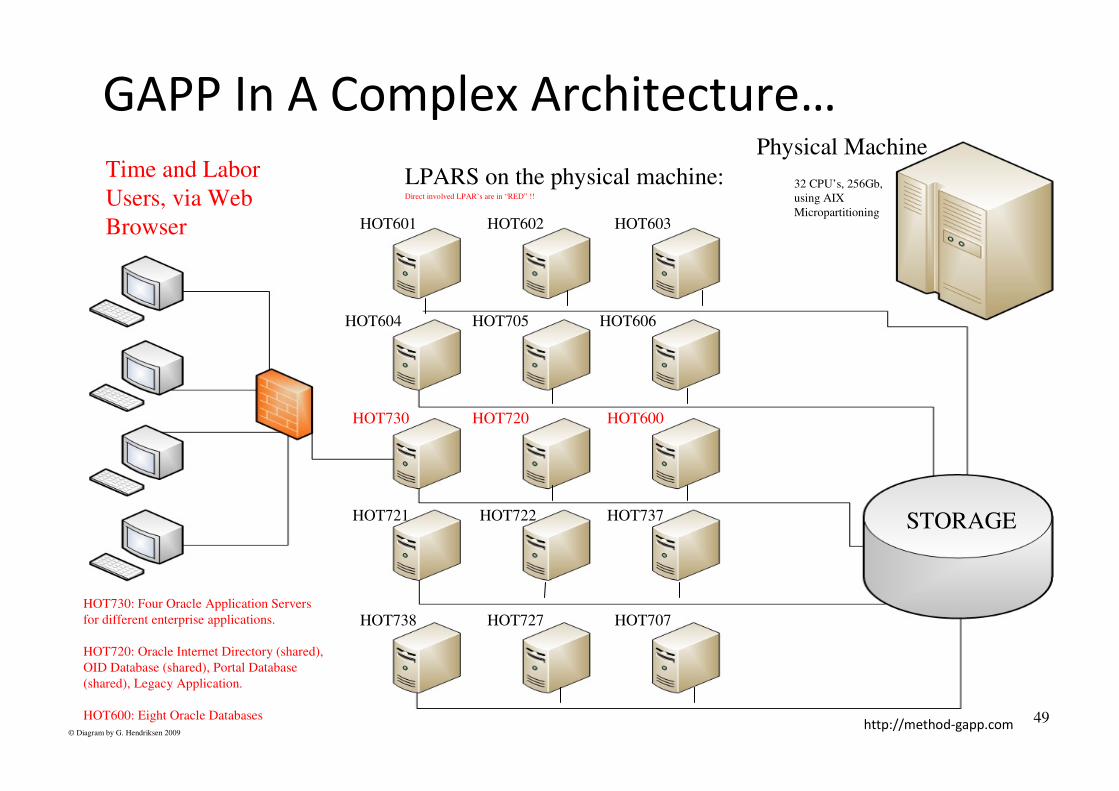
GAPP In A Complex Architecture…
49
STORAGE
LPARS on the physical machine:
Physical Machine
HOT730 HOT720 HOT600
HOT601 HOT602 HOT603
HOT604 HOT705 HOT606
HOT721 HOT722 HOT737
HOT738 HOT727 HOT707
32 CPU’s, 256Gb,
using AIX
Micropartitioning
Time and Labor
Users, via Web
Browser
HOT730: Four Oracle Application Servers
for different enterprise applications.
HOT720: Oracle Internet Directory (shared),
OID Database (shared), Portal Database
(shared), Legacy Application.
HOT600: Eight Oracle Databases
© Diagram by G. Hendriksen 2009
Direct involved LPAR’s are in “RED” !!
Page 50
http://method-gapp.com
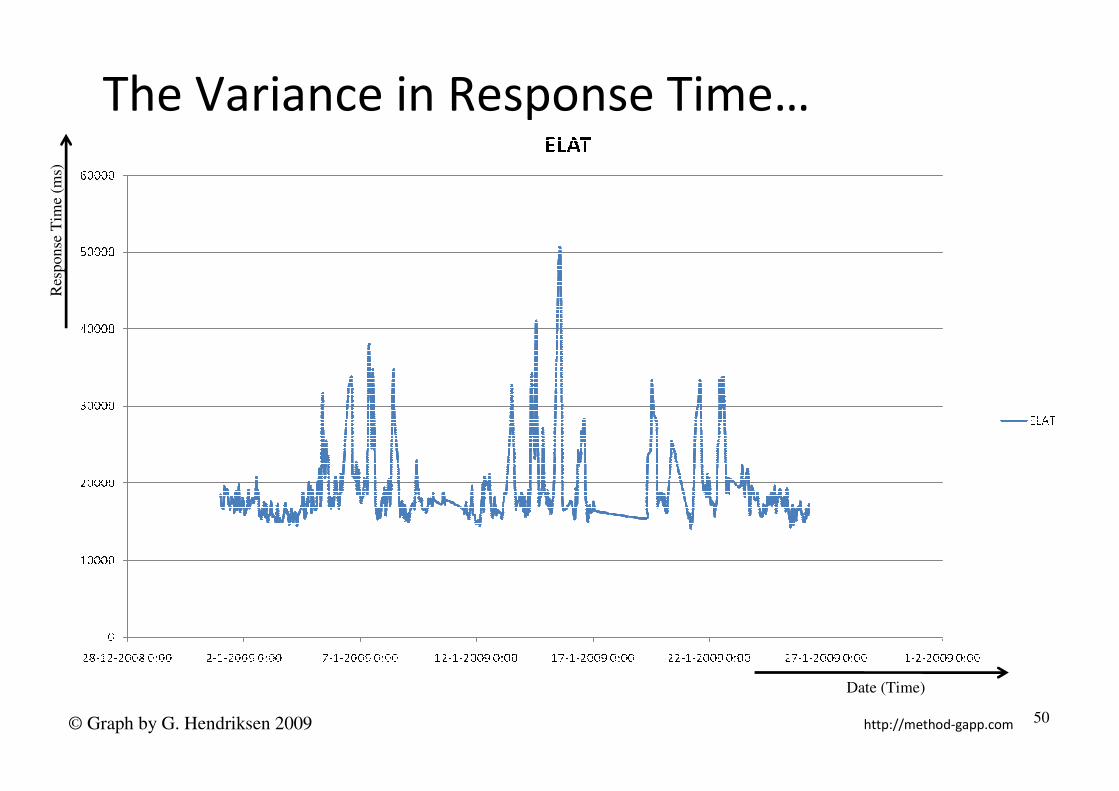
The Variance in Response Time…
50
Res
ponse
Tim
e (m
s)
Date (Time)
© Graph by G. Hendriksen 2009
Page 51
http://method-gapp.com
The Factorial Analyses (Explain)…
51
Ind
ex n
um
ber
Factors of Explanation
Only direct involved machines were in the analysis !!!
© Graph by G. Hendriksen 2009
Page 52
http://method-gapp.com
The Model (Predict)…
52
Res
ponse
Tim
e (m
s)
Date (Time)
Only direct involved machines were in the analysis !!!
© Graph by G. Hendriksen 2009
Page 53
http://method-gapp.com
The Factorial Analyses (Explain)…
53
Ind
ex n
um
ber
Factors of Explanation
Indirect involved machines were now also in the analysis !!!
© Graph by G. Hendriksen 2009
Page 54
http://method-gapp.com
The Model (Predict)…
54
Res
ponse
Tim
e (m
s)
Date (Time)
Indirect involved machines were now also in the analysis !!!
© Graph by G. Hendriksen 2009
Page 55
http://method-gapp.com
Interpretation…
• Most of the peaks are very well explained:
– The performance of the involved business process was very depending on the machine’s overall resources.
– Beside the HOT730 and HOT720, the HOT602 and HOT722 had also much impact.
• The GAPP analyses showed that at the moment the physical machine gets short on physical Cpu all the different machines will have high impact on each other due to competition in hardware resources.
– By Workload Scheduling the biggest problems could be solved
55
Page 56
http://method-gapp.com
Conclusions
56
Page 57
http://method-gapp.com
Conclusions…
• Although you didn’t made “hooks” in the application you were able to find the problem, independent of technology.
• After your analyses was done you found out that also components in the infrastructure not part of the application were responsible for the encountered problem.
• The model you made, made it possible to do predictions of the impact of a possible investment on the end-user process performance.
• Adding secondary components data to the analyses can give a lot of extra detailed information regarding the faced performance problems.
57
Page 58
http://method-gapp.com
Considerations…
• Adding as secondary components “variance” of
different components can be used to detect skew
with Method-GAPP
• Adding as secondary components “Business
Activity Metrics” can make Method-GAPP the way
to connect business data with technical data.
58
Page 59
http://method-gapp.com
What could you use for the mining…
• Oracle Data Mining (ODM)
– Cost 15K per CPU above EE
– Makes method-GAPP dependent on ORACLE
– Data can be stored in Oracle DB and be mined
• Project R:
– Is Open Source
– Makes method-GAPP completely platform independent
– Needs Database (which could be open source)
59
Page 60
http://method-gapp.com
Reference…
• Personal blog:
– http://blog.gerwinhendriksen.com
– http://method-gapp.com
• Method-R:
– Oracle Performance by Cary Millsap (http://method-r.com/)
• Formula’s:
– Analyzing Computer Sys. Perf. By Dr. N.J. Gunther
• Oracle Data Mining:
– http://www.oracle.com/technology/products/bi/odm/index.html
• Hadoop
– http://hadoop.apache.org/
60
Page 61
http://method-gapp.com
Thank
you for
your
attention Q/A61