Identification and MS-assisted interpretation ofgenetically influenced NMR signals inhuman plasmaJohannes Raffler1,2, Werner Römisch-Margl1, Ann-Kristin Petersen3, Philipp Pagel4, Florian Blöchl4,Christian Hengstenberg5, Thomas Illig6,7, Christa Meisinger8, Klaus Stark5,9, H-Erich Wichmann10, Jerzy Adamski11,Christian Gieger3, Gabi Kastenmüller1 and Karsten Suhre1,12*
Abstract
Nuclear magnetic resonance spectroscopy (NMR) provides robust readouts of many metabolic parameters in oneexperiment. However, identification of clinically relevant markers in 1H NMR spectra is a major challenge.Association of NMR-derived quantities with genetic variants can uncover biologically relevant metabolic traits.Using NMR data of plasma samples from 1,757 individuals from the KORA study together with 655,658 geneticvariants, we show that ratios between NMR intensities at two chemical shift positions can provide informative androbust biomarkers. We report seven loci of genetic association with NMR-derived traits (APOA1, CETP, CPS1, GCKR,FADS1, LIPC, PYROXD2) and characterize these traits biochemically using mass spectrometry. These ratios may nowbe used in clinical studies.
BackgroundIdentification of the genetic and environmental determi-nants of human metabolism is key to the understanding ofcomplex disorders. Metabolic profiling of blood samplesfrom cohort studies is a major tool in the discovery ofnew disease relevant biomarkers and the metabolic indivi-duality in the general population. Two major techniquesare generally used: mass spectrometry (MS) and nuclearmagnetic resonance spectroscopy (NMR). At the basis,both platforms are complementary in many regards. Forinstance, MS is more sensitive and allows obtaining moredetailed information while using small sample volume, butis also quite sensitive to changing experimental conditions,and sample preparation is more demanding. NMR-basedmeasurements, on the other hand, require higher samplevolumes and the interpretation of the raw spectra is notalways straightforward. Still, the strongest advantages ofNMR are simplicity of sample preparation and excellentreproducibility of quantitative metabolic readouts. It has
previously been shown that the stability of NMR measure-ments is to some extend independent of the NMR plat-forms and laboratory practices [1,2]. Therefore, NMRspectrometry is predestined for routine clinical applica-tions as it generates datasets that are comparable betweenclinics and over time.Previously, we and others have shown the potential of
MS-based and NMR-based metabolomics in discoverystudies such as the KORA study [3-7]. Using a genome-wide association approach with metabolite concentra-tions, so-called ‘genetically influenced metabotypes’(GIM) have been discovered. These GIMs, which definethe genetic basis of human metabolic individuality, have,in many cases, been linked to clinically relevant end-points. For instance, polymorphisms in the fatty aciddesaturase 1 (FADS1) locus are associated with Crohn’sdisease [8] and are furthermore suspected to play a rolein cardiovascular disorders through association withcholesterol and triglycerides [9]. As further examples,the glucokinase regulator (GCKR) gene is a risk locusfor several diabetes-relevant traits [10], and genetic var-iants at the carbamoyl-phosphatase 1 (CPS1) locus areassociated with risk factors for chronic kidney disease[11].
* Correspondence: [email protected] of Bioinformatics and Systems Biology, Helmholtz ZentrumMünchen, German Research Center for Environmental Health, IngolstädterLandstraße 1, 85764 Neuherberg, GermanyFull list of author information is available at the end of the article
Raffler et al. Genome Medicine 2013, 5:13http://genomemedicine.com/content/5/2/13
Up to now, GWAS using metabolic traits mainlyfocused on metabolites that were identified by the anno-tation of MS and NMR spectra using reference spectrain existing databases.Here, we address the question of whether known clini-
cally relevant GIMs can be derived from raw NMRspectra in blood plasma without prior annotation. Wetake a hypothesis-free approach to identify geneticallyinfluenced NMR features and investigate whether speci-fic ratios between NMR intensities at two chemicalshifts can provide informative and robust biomarkers.Finally, we interpret our findings using correlations toMS determined metabolite concentrations.With the KORA F4 study cohort, we have unique
access to a large number of samples of the generalpopulation, which are metabolically deeply characterizedboth using MS and NMR methods. In previous studiesbased on these data, we showed that using ratiosbetween metabolite concentrations can strengthen geno-type-metabotype associations. In such cases, the ratiosoften reflect educt-product pairs of enzymatic reactions[12]. Based on this idea, we here conduct a genome-wide association study (GWAS) on the binned NMRspectra, in combination with testing ratios between pairsof intensity values at different chemical shift positions.We then confront our results with findings from pre-vious GWAS with MS based metabolomics [4,5] andNMR derived lipid subclasses [13]. Finally, we interpretthe results in the light of the existing MS determinedmetabolite concentrations and data originating fromclinical biochemistry measurements.
MethodsStudy populationThe KORA study is an independent population-basedsurvey from the general population living in the regionof Augsburg, Germany. The KORA S4 study was con-ducted in 1999-2001 and comprises a total of 4,261 par-ticipants [14]. Between 2006 and 2008, a total of 3,080subjects participated in a follow-up examination, KORAF4, which is the basis for the results presented here. Allparticipants gave their signed informed consent and thelocal ethics committee approved the studies.
Blood samplingBlood samples for metabolic analysis and DNA extrac-tion were collected as part of the KORA F4 follow-upstudy. To avoid variation due to circadian rhythm, bloodwas drawn in the morning between 08:00 and 10:30 afterovernight fasting. A part of the blood was drawn intoserum gel tubes, gently inverted twice, and then allowedto rest for 30 min at room temperature (18-25°C) toobtain complete coagulation. The material was then cen-trifuged for 10 min (2,750 g at 15°C). Serum was divided
into aliquots and kept for a maximum of 6 h at 4°C, afterwhich it was frozen at -80°C until final analysis. Anotherpart of the blood was drawn into ethylene diaminetetraa-cetic acid (EDTA) tubes, gently inverted twice, and lefton the Sarstedt Universal mixer <5 min to avoid mechan-ical hemolysis, followed by centrifugation at 15°C for10 min at 2,750 g. Thereafter, plasma was separated,divided into 200 mL aliquots and kept at 4°C, after whichit was deep-frozen to -80°C. Within 2 weeks, plasma wasstored in the gaseous phase of liquid nitrogen at -196°C.
GenotypingFor all individuals profiled from the KORA study, gen-ome-wide single nucleotide polymorphism (SNP) datawere already available. These data have been used anddescribed extensively in the past in the context of sev-eral GWAS (for example, [4,5]). Therefore, we summar-ize only the essential details here. For genotyping, 1,814randomly selected participants of KORA F4 wereincluded. These samples were genotyped using the Affy-metrix Human SNP Array 6.0 (sample call rate >93%).Genotypes were determined using the Birdseed2 cluster-ing algorithm. For quality assurance, the criteria of SNPcall rate >95%, minor allele frequency >1%, and P(Hardy-Weinberg) >10-6 were applied as filters. In total,655,658 autosomal SNPs satisfied these criteria.
Metabolomics measurementsMetabolic analyses were conducted using clinical bio-chemistry methods, two distinct MS-based platforms(targeted and non-targeted), and NMR spectrometry(lipid classes and binned spectral data). For the jointanalysis, metabolomics and genotype data were availablefor a total of 1,757 individuals. All metabolite measure-ments have been reported before. We therefore onlysummarize here the points that are essential for the pre-sent study.Clinical biochemistryThe following serum lipids were measured on fresh sam-ples using the Dimension RxL (Dade Behring). TC wasdetermined by cholesterol esterase method (CHOL Flex,Dade-Behring, CHOD-PAP method), HDL-C using theAHDL Flex (Dade-Behring, CHOD-PAP method afterselective release of HDL-C), LDL-C using the ALDL Flex(Dade Behring, CHOD-PAP method after colorless usageof all non-LDL-C), and TG was measured using a TGLFlex (Dade Behring, enzymatic colorimetric test, GPO-PAP method).Targeted metabolomicsThe Biocrates AbsoluteIDQ p150 kit was used for abso-lute quantification of a defined set of serum metabolites.Sample analyses were done on an API 4000 Q TRAP LC/MS/MS system (Applied Biosystems) equipped with aSchimadzu Prominence LC20AD pump and a SIL-20AC
Raffler et al. Genome Medicine 2013, 5:13http://genomemedicine.com/content/5/2/13
Page 2 of 15
autosampler. The complete analytical process was per-formed using the MetIQ software package, which is anintegral part of the AbsoluteIDQ kit. In total, we detected163 different metabolites. The metabolomics dataset con-tains 14 amino acids, hexose (H1), free carnitine (C0), 40acylcarnitines (Cx:y), hydroxylacylcarnitines (C(OH)x:y),and dicarboxylacylcarnitines (Cx:y-DC), 15 sphingomye-lins (SM Cx:y) and N-hydroxylacyloylsphingosylphospho-choline (SM(OH) Cx:y), 77 phosphatidylcholines (PC,aa = diacyl, ae = acyl-alkyl) and 15 lyso-phosphatidylcho-lines. Lipid side chain composition is abbreviated as Cx:y,where x denotes the number of carbons in the side chainand y the number of double bonds. For further details onthis dataset and the coefficients of variation (CVs) ofmetabolite quantification see [4].Non-targeted metabolomicsMetabolon, a commercial supplier of metabolic analyses,developed a platform that integrates the chemical analysis,including identification and relative quantification, data-reduction, and quality-assurance components of the pro-cess. The analytical platform incorporates two separateultrahigh-performance liquid chromatography/tandemmass spectrometry (UHPLC/MS/MS2) injections and onegas chromatography/mass spectrometry (GC/MS) injec-tion per sample. The UHPLC injections were optimizedfor basic and acidic species. The LC/MS portion of theplatform was based on a Waters ACQUITY UPLC and aThermo-Finnigan LTQ mass spectrometer, which con-sisted of an electrospray ionization (ESI) source and a lin-ear ion-trap (LIT) mass analyzer. For GC/MS, the sampleswere analyzed on a Thermo-Finnigan Trace DSQ fast-scanning single-quadrupole mass spectrometer using elec-tron impact ionization. A total of 295 serum metaboliteswere measured, spanning several relevant classes (aminoacids, acylcarnitines, sphingomyelins, glycerophospholi-pids, carbohydrates, vitamins, lipids, nucleotides, peptides,xenobiotics, and steroids). The detection of the entirepanel was carried out with 24 min of instrument analysistime (two injections at 12-min each), while maintaininglow median process variability (<12% across all com-pounds). The resulting MS/MS2 data were searchedagainst a standard library generated by Metabolon thatincluded retention time, molecular mass to charge ratio(m/z), preferred adducts and in-source fragments as wellas their associated MS/MS spectra for all molecules in thelibrary. The library allowed for the identification of theexperimentally detected molecules on the basis of a multi-parameter match without the need for additional analyses.For further details on this dataset and the coefficients ofvariation (CVs) of the metabolite measurements see [5].NMR-derived lipid classesNMR spectra measurements were carried out atnumares (formerly LipoFIT), Regensburg. The bloodplasma spectra were recorded on a Bruker 600 MHz
Avance IIplus spectrometer. The spectra were phasedand baseline corrected. Since no reference compoundwas added, all spectra were horizontally aligned to theprominent lactate signals at 1.36 and 1.37 ppm. Basedon a proprietary approach that uses complex deconvolu-tion algorithms on the spectral regions between 0.6 and1.5 ppm, a set of 15 lipoprotein subfractions was derivedfrom the spectra. These fractions correspond to HDL(small = L1, medium = L2, large = L3, very large = L4),LDL (very small = L5, small = L6, medium = L7, large =L8, very large = L9), IDL (L10), VLDL (small = L11,large = L12), remnants (L13), and chylomicrons (small =L14, large = L15). For further details on this dataset see[13].NMR binned dataFor the purpose of this study, the spectra were limitedto a range from 0 to 9 ppm and divided into 10,000bins of equal width (0.001 ppm). Spectral binning is astandard procedure in NMR-based metabolomics studiesthat reduces the data complexity and compensates forslight jitter of the signals’ chemical shifts [15]. Theintensity values were log10-transformed prior to analysis.To diminish the effect of outliers, for each bin individualintensity values more than three times the standarddeviation away from the mean were excluded. Also, thespectral region affected by the water peak (δ = 4.6-5ppm) was excluded from further analysis.
Statistical analysisTo test for associations between genetic polymorphismsand individual NMR signal bins, we created age- and gen-der-adjusted linear additive models using PLINK (Version1.07) [16]. Testing all possible ratios between NMR signalsall over the spectrum would not be feasible due to thehuge amount of computational time that would be needed.Therefore, we performed a simple feature selection. Inmost cases SNPs do not associate with only one NMR sig-nal bin but with a number of adjacent bins. Thus, we per-formed a search for local minima on the pseudo-spectra(chemical shift vs. strength of association) resulting fromthe first GWAS run to pick the positions on the spectrawhich show the strongest associations. We then used the500 best-scoring NMR signal positions to compute pairwise ratios (124,750 in total). As before, we used age- andgender-adjusted linear additive models in PLINK to testfor associations.We applied a conservative Bonferroni correction to
control for false-positive error rates resulting from multi-ple testing. We corrected for tests on 655,658 SNPs and133,350 NMR features at a nominal significance level of5%, thus obtaining an adjusted P value of 0.05/655,658/133,350 = 5.72 × 10⁻¹³.Spearman correlations between biochemically and MS
determined metabolite concentrations and NMR signal
Raffler et al. Genome Medicine 2013, 5:13http://genomemedicine.com/content/5/2/13
Page 3 of 15
intensities were calculated using the statistical analysissystem R (Version 2.15.1). To avoid false-positive asso-ciations due to small sample sizes, only metabolic traitswith at least 300 non-missing values were included.Furthermore, metabolite concentrations that were morethan three times the standard deviation away from themean were excluded.
ResultsSeven genetic associations identifiedWe adopted a two-stage approach to detect associationsbetween genetic variants and NMR signals. In the firststep, we performed a GWAS using the NMR intensityreadouts of the 1H-NMR spectra from 1,757 plasma sam-ples. To this end, we binned the spectral region rangingfrom 0 to 9 ppm at a high resolution of 0.001 ppm. Theregion surrounding the water peak (δ = 4.6-5 ppm) wasdiscarded. NMR intensities were log10-scaled and extremeoutliers were removed (see Methods). Usually, NMR-based GWAS either use a selection of chemical shifts orperform spectral annotation to reduce the NMR data tothe underlying metabolite concentrations (for example,[6,7,17]). In contrast, our approach uses the signal intensi-ties at almost all chemical shift positions of the NMRspectra.In the second step, we selected the 500 bins in the NMR
spectrum that exhibited the strongest signal of association.In cases where neighboring bins all displayed associationsof comparable strength to the same single nucleotide poly-morphism (SNP), the bin with the lowest P value wasselected. In a second GWAS, we then tested all possibleratios between the intensities at these 500 chemical shiftpositions for associations with all genetic variants. To ourknowledge, this is the first GWAS that uses a ratio-based,hypothesis-free approach with raw NMR spectral data as aphenotype. For both GWAS, age and gender were used ascovariates. In the subsequent analysis, we considered onlyrobust associations of frequent SNPs with minor allele fre-quencies (MAF) >10%.In total, seven loci (LIPC, CETP, FADS1, GCKR,
APOA1, CPS1, PYROXD2) displayed a signal of associa-tion that attained the genome-wide level of significance(P < 5.72 × 10⁻¹³) after Bonferroni correction for 655,658tested SNPs and 133,350 NMR traits (133,350 = 500*499/2 ratios + 8,600 chemical shifts). Table 1 lists the lociwith significant associations to NMR features, the leadSNPs showing the strongest associations within the loci,respectively, and the strength of association. Additionalfile 1 provides regional association plots, boxplots, andquantile-quantile plots for all associations listed in Table1. All loci were previously reported in the same KORAF4 dataset using MS [3-5], with the exception of thePYROXD2 locus, which has been reported by Nicholsonet al. in 2011 [6].
Overlap with NMR-derived lipid subclassesRecently, Petersen et al. reported an association studywith NMR-derived lipoprotein subclasses [13]. Theiranalysis is based on the same NMR data as used in thisstudy. In contrast to our non-targeted approach, theyused a targeted approach that derives 15 different lipo-protein subclasses from the spectral region between 0.6ppm and 1.5 ppm. The authors tested 101 SNPs inknown lipid loci for associations with these lipoproteinsubclasses. As a result, they identified eight loci thatassociated specifically with one or more of these sub-classes. Of the eight loci reported by Petersen et al., weidentified five (LIPC, CETP, FADS1, GCKR, APOA1) inassociation with NMR intensities at single chemical shiftpositions (NMR bins) in our genome-wide approach.Note that in comparison, the strength of association isgenerally weaker when testing NMR bins instead of lipidsubclasses, as one would expect when using a less aggre-gated parameter. However, in the GWAS with ratios ofchemical shift pairs (NMR ratios), we observe a strongincrease in the strength of association for four loci(LIPC, CETP, FADS1, GCKR), resulting in P values thatare between 9 and 89 orders of magnitude lower thanthe values reported by Petersen et al. for the associa-tions with lipid subclasses (Table 2). In these four cases,the ratios represent stronger readouts of metabolic phe-notypes that are modified by the genetic variant than doeither the binned NMR intensities or the NMR-derivedlipid subclasses. These ratios are thus worthy of furtherinvestigation (see below).
Strong correlations of NMR signals to MS-based andfurther metabolite concentrationsA 1H-NMR spectrum of a biological sample is the super-position of the resonance spectra of all individual metabo-lites measured in that sample. The signals of differentmetabolites thus overlap in the NMR spectrum. Identifica-tion and annotation of individual metabolites is a challen-ging task. Here we compute ‘correlation spectra’ tovisualize the degree of correlation between NMR bins andMS-derived or biochemically determined metabolite con-centrations. Note that all measurements (NMR, MS, clini-cal biochemistry) were performed on blood samples fromthe same draw and subject. Correlation spectra thus linkthe chemical identity of the metabolites detected by otherplatforms to chemical shifts in the NMR spectra, wherethe chemical shifts may correspond to the same metabo-lite, but also to a metabolite on a related biochemical path-way. As an example, Figure 1 shows the correlationspectrum for MS determined glycine. We also observed anumber of correlations with phosphatidylcholines (PCs)(Figure 2), and with parameters that were determinedindependently using standard clinical biochemistry meth-ods, namely triglycerides (TG), high-density lipoproteins
Raffler et al. Genome Medicine 2013, 5:13http://genomemedicine.com/content/5/2/13
Page 4 of 15
Table 1 Genetic associations with NMR intensities and ratios between NMR intensities.
Locus SNP CHRa POSa Aa Ba MAF Chemical shift(ppm) n Beta’b P value Chemical shifts for ratios (ppm) n Beta’ ratiosb P value ratios Pgainc
GCKR rs780094 2 27,594,741 T C 41.4% 1.370 1,688 0.0413 1.2x10⁻¹⁰ 3.286/1.370 1,667 -0.0407 2.8x10⁻¹⁵ 4.3x10⁴
CPS1 rs2216405 2 211,325,139 C T 19.3% 3.599 1,719 0.0456 4.5x10⁻¹⁴ 3.599/2.475 1,718 0.0459 1.8x10⁻¹⁹ 2.5x10⁵
PYROXD2 rs4488133 10 100,149,126 A T 34.3% 2.757 1,735 -0.0190 7.3x10⁻¹² 2.757/2.755 1,734 -0.0123 2.9x10-94 2.5x1082
FADS1 rs174547 11 61,327,359 C T 30.0% 2.801 1,733 -0.0408 4.0x10⁻³⁵ 2.801/2.017 1,724 -0.0449 1.1x10-94 3.8x1059
APOA1 rs3741298 11 116,162,771 C T 21.4% 2.038 1,724 0.0363 8.4x10⁻¹¹ 4.162/4.082 1,715 -0.0138 1.8x10⁻¹⁴ 4.6x10³
LIPC rs4775041 15 56,461,987 C G 28.5% 1.283 1,671 0.0320 1.4x10⁻¹⁰ 1.068/1.029 1,664 -0.0056 3.6x10⁻²¹ 4.0x10¹⁰
CETP rs247617 16 55,548,217 A C 31.3% 3.259 1,705 0.0529 7.6x10⁻¹⁵ 2.211/2.011 1,695 -0.0124 1.1x10⁻¹⁸ 6.8x10³
The locus name indicates the gene that most likely hosts the causative SNP.
A/B: minor/major allele; MAF: minor allele frequency; n: number of samples where genetic and NMR data are jointly available; ppm: parts per million.aChromosomal location (CHR, POS), minor (effect, A) and major (B) alleles are reported with respect to the positive strand of the human genome (NCBI build 36.1).bBeta’: relative effect size, defined as beta’ = (10beta- 1), where beta is the slope in the linear model (using log10-scaled traits) and genotype is coded as 0-1-2 (major-hetero-minor genotype). Beta’ represents therelative difference per copy of the minor allele for the unscaled metabolic trait (NMR bin or NMR ratio) compared to the estimated mean of the major allele homozygote group (intercept of the linear model).cThe P gain is defined as min(p(S1)/p(S1/S2), p(S2)/p(S1/S2)), where p(S1), p(S2), and p(S1/S2) denote the P values of association of two log-scaled NMR intensities at chemical shift S1 and S2, and of their ratio S1/S2,respectively.
Raffleret
al.Genom
eMedicine
2013,5:13http://genom
emedicine.com
/content/5/2/13Page
5of
15
Table 2 Comparison with association data from previous studies on the same specimen.
Locus Mass spectrometry Targeted,quantitative [3,4]
Mass spectrometry Non-targeted, semi-quantitative [5] NMR Lipidsubclasses [13]
NMR Ratios between chemical shifts(this study)
GCKR Trait Pc ae C34:2/Pc aa C32:2 Glucose/Mannose L10 3.286 ppm/1.370 ppm
SNP (locus not reported) rs247617 rs3764261, LD r2 =1.0
rs247617
Pvalue
P = 0.00039 P = 3.6x10⁻⁷ P = 1.1x10⁻¹⁸
Association data from previous GWAS for the loci reported in this study are reported either on the same SNP, or, if a different SNP was reported, the correlation with the SNP in linkage disequilibrium (r2 LD) is given(based on HapMap, release #27, phases I, II, III, CEU population).
Raffleret
al.Genom
eMedicine
2013,5:13http://genom
emedicine.com
/content/5/2/13Page
6of
15
(HDL), low-density lipoproteins (LDL), total cholesterol(TC), and glucose (Figure 3), and a number of other meta-bolites. Most of the correlations we observed are positive,meaning that a stronger NMR signal at the given chemicalshift goes with a higher concentration of the correlatedmetabolite, as one would expect in cases where MS andNMR are targeting identical or closely-related metabolites.In a few cases, we also observe negative correlationsbetween NMR bins and MS-determined metabolites. Thismay indicate cases where the NMR signal is indirectlyrelated to a MS-measured metabolite. It could, for instance,
correspond to the product or substrate of a metabolitequantified on the MS platform.In the case of correlation with lipid-related parameters,
the correlation spectra generally show wider areas of theNMR spectrum corresponding to these metabolites (forexample, PCs in Figure 2, triglyceride levels in Figure 3).In contrast, correlations with non-lipid metabolites arevisible as individual, sharp peaks (for example, glycine inFigure 1 and glucose in Additional file 2). These peakscorrelate, among others, with the concentrations of glu-cose, lactate, proline, and glycine with squared Spearman
6 5 4 3 2 1 0
02
46
812
chemical shift
−log
10(p
)
wat
er p
eak
6 5 4 3 2 1 0
Association spectrum for SNP rs2216405 (CPS1 locus)
6 5 4 3 2 1 0
0.0
0.1
0.2
0.3
0.4
chemical shift
corr
elat
ion
r²
wat
er p
eak
6 5 4 3 2 1 0
Correlation spectrum for glycine
6 5 4 3 2 1 00.0e
+00
1.5e
+08
chemical shift
sign
al in
tens
ity
6 5 4 3 2 1 0
sample with spiked glycineregular sample
NMR spectra of spiking experiment for glycine
3.65 3.60 3.55
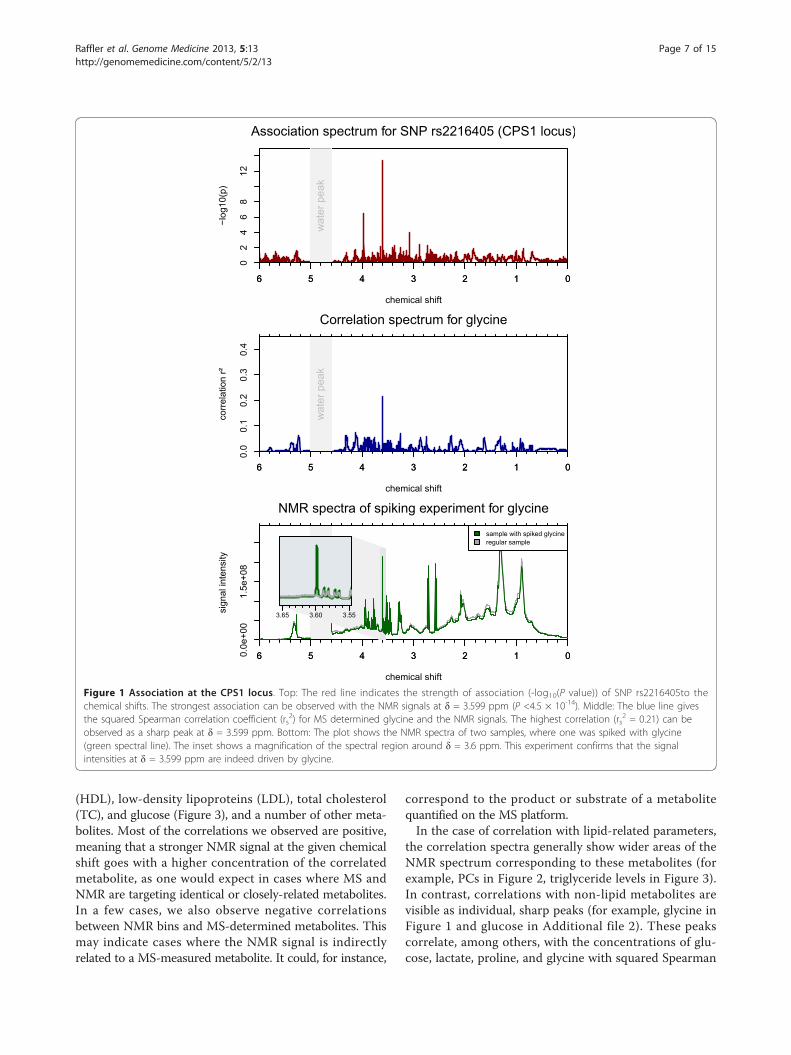
Figure 1 Association at the CPS1 locus. Top: The red line indicates the strength of association (-log10(P value)) of SNP rs2216405to thechemical shifts. The strongest association can be observed with the NMR signals at δ = 3.599 ppm (P <4.5 × 10⁻¹⁴). Middle: The blue line givesthe squared Spearman correlation coefficient (rs
2) for MS determined glycine and the NMR signals. The highest correlation (rs2 = 0.21) can be
observed as a sharp peak at δ = 3.599 ppm. Bottom: The plot shows the NMR spectra of two samples, where one was spiked with glycine(green spectral line). The inset shows a magnification of the spectral region around δ = 3.6 ppm. This experiment confirms that the signalintensities at δ = 3.599 ppm are indeed driven by glycine.
Raffler et al. Genome Medicine 2013, 5:13http://genomemedicine.com/content/5/2/13
Page 7 of 15
correlation coefficients (rs2) up to 0.61. In most cases, we
can verify the validity of the correlations using experi-mental spectra of pure compounds from HMDB [18].For glycine, we conducted an additional spiking
experiment to confirm that the NMR signal at δ = 3.599ppm indeed is driven by glycine. However, since manymetabolites are by nature interlinked in metabolic net-works, some signal correlations do not reflect just a
010
2030
40
chemical shift
−log
10(p
)
wat
er p
eak
6 5 4 3 2 1 0
Association spectrum for SNP rs174547 (FADS1 locus)
0.0
0.2
0.4
0.6
0.8
chemical shift
corr
elat
ion
r²
Correlation spectra for PC aa C36:3 and PC aa C36:4w
ater
pea
k
6 5 4 3 2 1 0
PC aa C36:3PC aa C36:4
0.0
0.2
0.4
2.1 2.0 1.9
0.0
0.2
0.4
2.9 2.8 2.7
Figure 2 Association at the FADS1 locus. SNPrs174547 associates most strongly with the NMR signal at chemical shift δ = 2.801 ppm (P = 3.7× 10⁻³⁵) (top). When ratios between NMR intensities are tested, the strength of association increases by 59 orders of magnitude for the ratiobetween NMR intensities at 2.801 ppm and 2.017 ppm (P = 1.1×10-94) (Table 1). A similar increase in the strength of association has beenobserved in previous GWAS for this locus with ratios between phospholipids containing C20:3 and C20:4 fatty acids, such as PC aa C36:3 and PCaa C36:4 [3]. The FADS1 codes for a delta-5 fatty acid desaturase; C20:3 and C20:4 fatty acids are their substrate-product pair. The correlation plotbetween these lipid species and the NMR intensities (bottom) indicates that the region around δ = 2.801 ppm correlates more strongly withC20:4 fatty acid-containing lipids, while the region around δ = 2.017 ppm more with C20:3 lipids (bottom insets). The ratio between intensities atδ = 2.801 ppm and δ = 2.017 ppm is therefore a likely proxy for the ratio between three- and four-fold desaturated log chain fatty acids.
0.0
0.2
0.4
0.6
0.8
1.0
chemical shift
corr
elat
ion
r²
Correlation spectra for triglyceride and glucose
wat
er p
eak
6 5 4 3 2 1 0
triglycerideglucose
0.0
0.2
0.4
3.30 3.28
Figure 3 Association at the GCKR locus. SNP rs780094 (and SNPs in LD) have been associated with different diabetes-relevant traits, includingfasting glucose and triglyceride levels (TG). We observe a genome-wide significant association (P = 2.8x10⁻¹⁵) at this locus with the ratio ofintensities at δ = 3.286 ppm and δ = 1.370 ppm (dashed lines) (Table 1). The correlation spectra for glucose and TG (both parameters weredetermined by clinical biochemistry) show that the association signal at δ = 3.286 ppm is mainly driven by glucose and that at δ = 1.370 ppmby TG. The ratio of these two NMR intensities is thus a likely proxy for a diabetes-relevant composite readout on the GCKR pathway.
Raffler et al. Genome Medicine 2013, 5:13http://genomemedicine.com/content/5/2/13
Page 8 of 15
single compound but a mixture of co-regulated (andtherefore auto-correlated) metabolites. Also, due to over-lapping signals in NMR spectra, there may be multiple,non-related metabolites showing correlations at the samechemical shift position.Additional file 3, Table S1 lists all metabolites that
correlate with NMR signals at rs2 = 0.20 (or above) and
the chemical shift where the correlation coefficient ishighest. The corresponding correlation spectra are pro-vided in Additional file 2.For all associations between NMR bins and genetic loci,
we report the best correlating biochemically or MS-determined metabolite at the given chemical shift posi-tion (Table 3). In case of NMR ratios, we report eitherthe correlations with single metabolite concentrations or,if stronger, the correlations with ratios of metabolite con-centrations. The rationale behind this procedure is thattwo different chemical shifts might be representative fortwo specific pairs of metabolites and a strong correlationwould indicate a potential biochemical match betweenNMR chemical shifts and the biochemically or MS-derived metabolites.
DiscussionIn this study, we perform a GWAS with binned NMRspectra and ratios between pairs of chemical shifts in ahypothesis-free approach without prior annotation ofNMR features. In total, we identify seven genetic loci.Four of these associations (LIPC, PYROXD2, GCKR,APOA1) only reach a genome-wide significance levelwhen ratios between the signal intensities at two differentchemical shift positions are tested. Five of the seven loci(LIPC, CETP, FADS1, GCKR, APOA1) are also knownlipid risk loci, and all have previously been identified inGWAS with metabolic traits. There is thus no doubtabout the functional role of these genetic loci in inducing
a metabolic phenotype. Moreover, correlating NMR fea-tures to known metabolic phenotypes determined onother platforms can help in the interpretation of theobserved genetic associations for various loci and thecharacterization of the associated NMR trait, as shown inthis study for the CPS1, FADS1, and GCKR loci.Given the fact that these loci have already been largely
studied for their interest from a biomedical point of view,we focus here on aspects that highlight NMR-specificfeatures of the associations. The features presented inthis work may now be used in future studies with clinicaldisease endpoints or may potentially be established asbiomarkers. In the following, we focus on four of the loci,each of them highlighting a different situation.
Singular NMR intensities (peaks) correlate with MS-basedglycine measurements and provide comparable geneticassociations (CPS1 locus)The carbamoyl-phosphate synthase 1 (CPS1) controls thefirst step in the urea cycle. Klaus et al. report two muta-tions of the CPS1 gene that contribute to the onset ofCPS1 deficiency, an inborn error of metabolism thatcauses hyperammonemia [19]. In 2010, Illig et al.reported an association of SNP rs2216405 with glycineconcentrations at a nominal P value of 2.59×10⁻²⁶ [4].Glycine is metabolically related to carbamoyl phosphate,which in turn is the product of CPS1. Thus, Illig et al.presented a genetically influenced metabotype that mightrepresent a mild form of CPS1 deficiency.Here, we find an association of the same SNP with the
NMR signals at δ = 3.599 ppm (P = 4.46×10⁻¹⁴). Thecorrelation between MS determined glycine and theNMR signals at that chemical shift is rs
2 = 0.22.Although this correlation is modest, the correlationspectrum for glycine shows a distinct peak at δ = 3.599ppm (Figure 1). A reference spectrum for glycine taken
Table 3 Spearmancorrelations between NMR intensities and metabolic traits determined by MS and clinicalbiochemistry.
LIPC rs4775041 1.283 PC aa C36:1 0.42 1.068/1.029 4-methyl-2-oxopentanoate/Totalcholesterol
0.21
CETP rs247617 3.259 HDLcholesterol
0.55 2.211/2.011 HDL cholesterol 0.68
The ‘Metabolite’ and ‘Metabolite ratios’ columns list the MS and biochemically determined metabolites (or ratios thereof) that correlate best at the chemical shiftpositions (or ratios) identified in the GWAS.
ppm: parts per million.
Raffler et al. Genome Medicine 2013, 5:13http://genomemedicine.com/content/5/2/13
Page 9 of 15
from HMDB [18] shows a single peak at δ = 3.54 ppm.While the spectra used in this study were referenced tolactate and the sample pH was 7.4, the HMDB spectrumwas referenced to 4,4-dimethyl-4-silapentane-1-sulfonicacid (DSS) and the sample pH was 7.0. Thus, the 0.06ppm distance between the putative glycine peak in thisstudy and the HMDB glycine peak can be explained bydifferent experimental conditions. In a separate spikingexperiment comparing two spectra with and withoutaddition of glycine, we confirmed that the signal at δ =3.599 ppm indeed corresponds with glycine.Thus, in this case we find that information obtained
from a GWAS with NMR data provides comparableresults to what was obtained with MS, albeit thestrength of the association observed with NMR data isweaker in this case. The NMR chemical shift δ = 3.599ppm could potentially be used as a marker for mildforms of perturbations in the ammonia metabolismcaused by genetic variations in the CPS1 locus.
Associations with ratios between NMR intensities indicatespectral regions which are representative of triple andquadruple fatty acid desaturation (FADS1 locus)The fatty-acid desaturase 1 (FADS1) gene product cata-lyzes the desaturation reaction of 8,11,14-eicosatrienoyl-CoA to arachidonoyl-CoA (C20:3 ® C20:4). Genetic var-iants in this locus have been linked to Crohn’s disease [8]and risk factors for cardiovascular disorders, namely cho-lesterol and triglyceride levels [9]. Recently, two indepen-dent studies showed that dietary intake of long-chainpolyunsaturated fatty acids (for example, C20:3 andC20:4) modulates the association between genetic varia-tion in FADS1 and serum lipid levels, and thereby poten-tially also modifies the risk of cardiovascular disease[20,21]. In their previous GWAS, Gieger et al. [3] andIllig et al. [4] identified strong associations of SNPrs174547 (intronic region of FADS1) with a number ofglycerophospholipids, many containing lipid side chainswith C20:3 and C20:4 polyunsaturated omega-3 andomega-6 fatty acids (PUFAs). The authors observed anexceptionally large increase in the strength of the associa-tion when ratios between phospholipids containingPUFAs with <4 double bonds and ≥4 double bonds weretestedin pairs [4]. This observation can be explained bythe fact that ratios between substrate: product pairsapproximate the underlying enzymatic reaction rate andalso because ratios between related metabolites reducethe overall variance that is observed between individualswith different levels of overall blood PUFA concentra-tions [12].In our data, the correlation spectra for glycerophospholi-
pid levels show distinct differences depending on whetherthe degree of saturation of the side chains is below fourdouble bonds (precursor of substrates of FADS1 enzymatic
reaction) or equal or above four double bonds (productsdownstream of FADS1) (Figure 2). When testing binnedNMR intensities for association, SNP rs174547 displaysassociations at a wider range of chemical shifts, with thestrongest signal at δ = 2.801 ppm (P = 3.96×10⁻³⁵). Interest-ingly, when using ratios between the NMR intensities atδ = 2.801 ppm and 2.017 ppm, the strength of associationincreases by nearly 60 orders of magnitude (P = 1.1×10-94),similar to the MS-based case. The NMR ratio δ = 2.801ppm/δ = 2.017 ppm is therefore a likely proxy for the ratiobetween three- and four-fold desaturated long chain fattyacids. As a metabolic marker, this ratio might be a readoutfor the efficacy of the FADS1 enzymatic reaction in thecontext of dietary intake of PUFAs.
A ratio between NMR intensities in the triglyceride and inthe glucose range of the spectrum constitutes anintegrated pleiotropic diabetes risk marker (GCKR locus)The product of the glucokinase regulator (GCKR) geneboth transports and regulates glucokinase, a key enzymeof glucose metabolism [22]. GCKR is a genetic risklocus for diabetes-related traits [10].In our study, SNP rs780094 (intronic region of GCKR)
associates with NMR intensities at δ = 1.370 ppm. At thisspectral position, we observe a high correlation betweenNMR signals and TG levels (rs
2 = 0.61) (Figure 3). How-ever, this association is not of genome-wide significance(P = 1.2×10⁻¹⁰). When testing ratios for association, thestrength of association increases by five orders of magni-tude, with a P value of 2.8×10⁻¹⁵ for the association ofSNP rs780094 to the NMR ratio δ = 1.370 ppm/δ = 3.286ppm. The correlation spectrum with glucose shows a dis-tinct signal at δ = 3.286 ppm (rs
2 = 0.28). This chemicalshift is indeed located within a known glucose-relatedspectral region. Furthermore, this NMR ratio correlateswith the triglyceride/glucose ratio (rs
2 = 0.42). Interest-ingly, GCKR is a diabetes risk locus that inversely modu-lates triglyceride and fasting glucose levels [4,23-26].Thus, the combination of these two chemical shifts
likely provides a combined measure of two main dia-betes-risk readouts that have been independently asso-ciated with the GCKR locus before. We suggest that thisratio therefore may constitute an integrated biomarkerfor the pleiotropic biological processes related to pertur-bations in the GCKR pathway.
Ratios between neighboring NMR intensities act as alocal baseline correction and strengthen the geneticassociation (PYROXD2 locus)PYROXD2 is a probable pyridine nucleotide-disulphideoxidoreductase gene. Nicholson et al. recently foundthis locus to be associated with dimethylamine concen-trations in plasma, also using NMR spectrometry [6]. Atthe time when our study was conducted, metabolomics
Raffler et al. Genome Medicine 2013, 5:13http://genomemedicine.com/content/5/2/13
Page 10 of 15
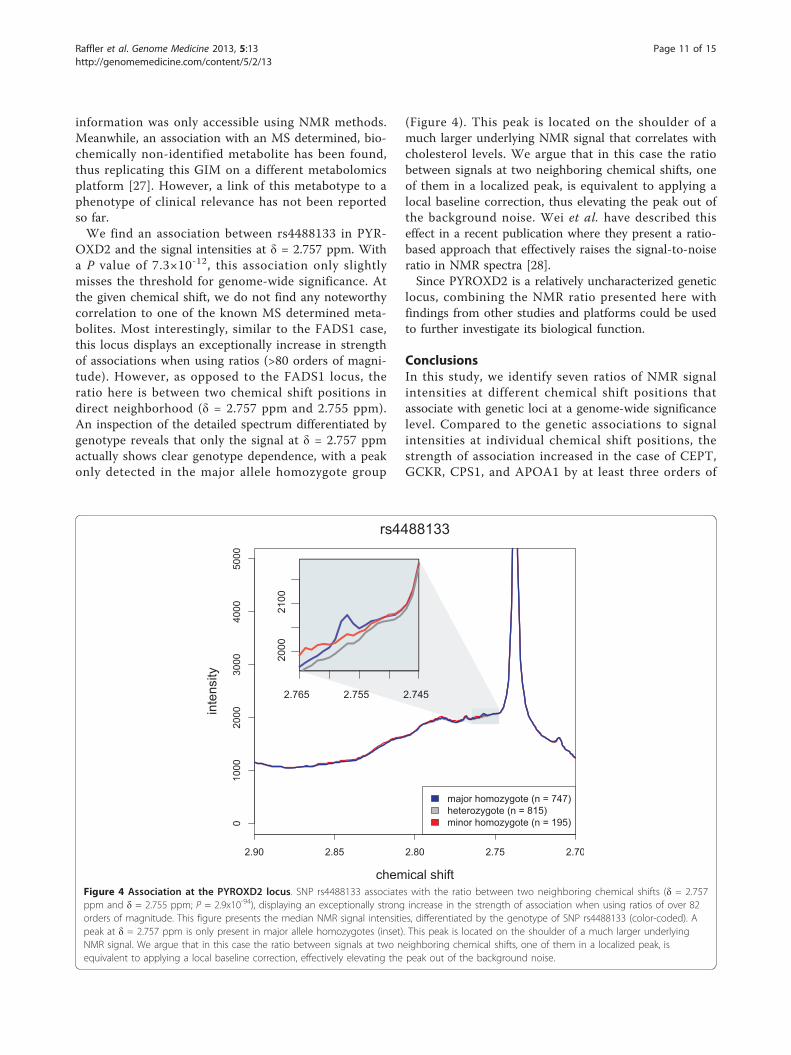
information was only accessible using NMR methods.Meanwhile, an association with an MS determined, bio-chemically non-identified metabolite has been found,thus replicating this GIM on a different metabolomicsplatform [27]. However, a link of this metabotype to aphenotype of clinical relevance has not been reportedso far.We find an association between rs4488133 in PYR-
OXD2 and the signal intensities at δ = 2.757 ppm. Witha P value of 7.3×10⁻¹², this association only slightlymisses the threshold for genome-wide significance. Atthe given chemical shift, we do not find any noteworthycorrelation to one of the known MS determined meta-bolites. Most interestingly, similar to the FADS1 case,this locus displays an exceptionally increase in strengthof associations when using ratios (>80 orders of magni-tude). However, as opposed to the FADS1 locus, theratio here is between two chemical shift positions indirect neighborhood (δ = 2.757 ppm and 2.755 ppm).An inspection of the detailed spectrum differentiated bygenotype reveals that only the signal at δ = 2.757 ppmactually shows clear genotype dependence, with a peakonly detected in the major allele homozygote group
(Figure 4). This peak is located on the shoulder of amuch larger underlying NMR signal that correlates withcholesterol levels. We argue that in this case the ratiobetween signals at two neighboring chemical shifts, oneof them in a localized peak, is equivalent to applying alocal baseline correction, thus elevating the peak out ofthe background noise. Wei et al. have described thiseffect in a recent publication where they present a ratio-based approach that effectively raises the signal-to-noiseratio in NMR spectra [28].Since PYROXD2 is a relatively uncharacterized genetic
locus, combining the NMR ratio presented here withfindings from other studies and platforms could be usedto further investigate its biological function.
ConclusionsIn this study, we identify seven ratios of NMR signalintensities at different chemical shift positions thatassociate with genetic loci at a genome-wide significancelevel. Compared to the genetic associations to signalintensities at individual chemical shift positions, thestrength of association increased in the case of CEPT,GCKR, CPS1, and APOA1 by at least three orders of
Figure 4 Association at the PYROXD2 locus. SNP rs4488133 associates with the ratio between two neighboring chemical shifts (δ = 2.757ppm and δ = 2.755 ppm; P = 2.9x10-94), displaying an exceptionally strong increase in the strength of association when using ratios of over 82orders of magnitude. This figure presents the median NMR signal intensities, differentiated by the genotype of SNP rs4488133 (color-coded). Apeak at δ = 2.757 ppm is only present in major allele homozygotes (inset). This peak is located on the shoulder of a much larger underlyingNMR signal. We argue that in this case the ratio between signals at two neighboring chemical shifts, one of them in a localized peak, isequivalent to applying a local baseline correction, effectively elevating the peak out of the background noise.
Raffler et al. Genome Medicine 2013, 5:13http://genomemedicine.com/content/5/2/13
Page 11 of 15
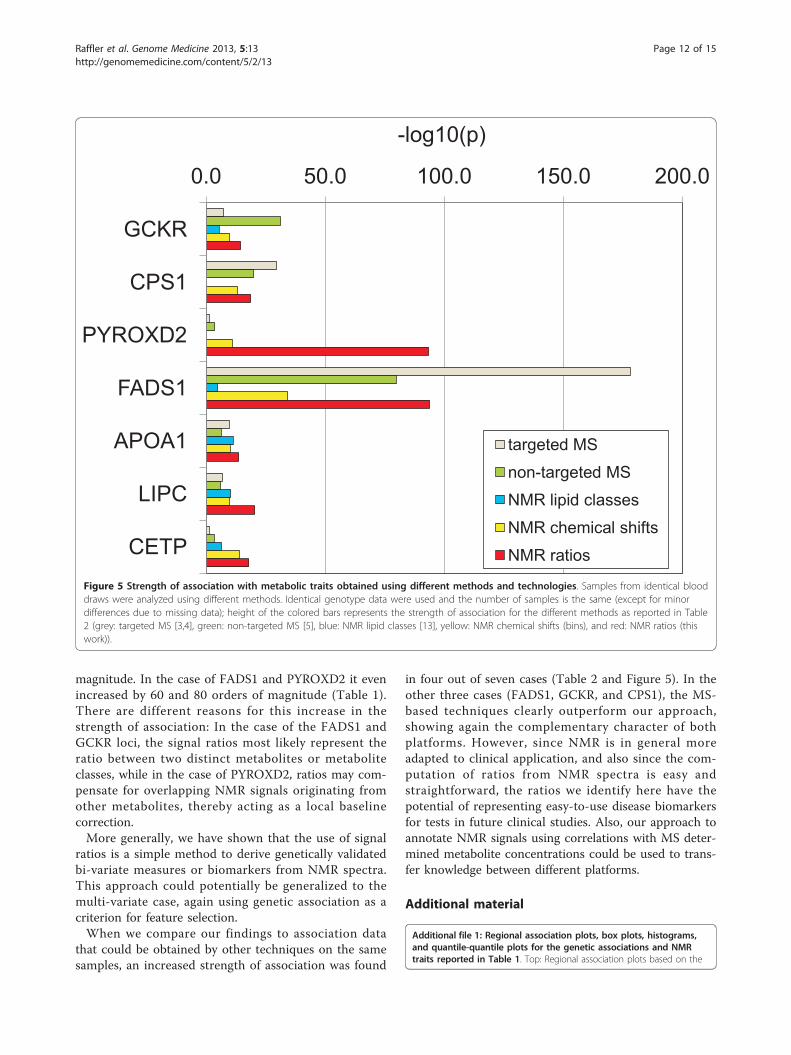
magnitude. In the case of FADS1 and PYROXD2 it evenincreased by 60 and 80 orders of magnitude (Table 1).There are different reasons for this increase in thestrength of association: In the case of the FADS1 andGCKR loci, the signal ratios most likely represent theratio between two distinct metabolites or metaboliteclasses, while in the case of PYROXD2, ratios may com-pensate for overlapping NMR signals originating fromother metabolites, thereby acting as a local baselinecorrection.More generally, we have shown that the use of signal
ratios is a simple method to derive genetically validatedbi-variate measures or biomarkers from NMR spectra.This approach could potentially be generalized to themulti-variate case, again using genetic association as acriterion for feature selection.When we compare our findings to association data
that could be obtained by other techniques on the samesamples, an increased strength of association was found
in four out of seven cases (Table 2 and Figure 5). In theother three cases (FADS1, GCKR, and CPS1), the MS-based techniques clearly outperform our approach,showing again the complementary character of bothplatforms. However, since NMR is in general moreadapted to clinical application, and also since the com-putation of ratios from NMR spectra is easy andstraightforward, the ratios we identify here have thepotential of representing easy-to-use disease biomarkersfor tests in future clinical studies. Also, our approach toannotate NMR signals using correlations with MS deter-mined metabolite concentrations could be used to trans-fer knowledge between different platforms.
Additional material
Additional file 1: Regional association plots, box plots, histograms,and quantile-quantile plots for the genetic associations and NMRtraits reported in Table 1. Top: Regional association plots based on the
Figure 5 Strength of association with metabolic traits obtained using different methods and technologies. Samples from identical blooddraws were analyzed using different methods. Identical genotype data were used and the number of samples is the same (except for minordifferences due to missing data); height of the colored bars represents the strength of association for the different methods as reported in Table2 (grey: targeted MS [3,4], green: non-targeted MS [5], blue: NMR lipid classes [13], yellow: NMR chemical shifts (bins), and red: NMR ratios (thiswork)).
Raffler et al. Genome Medicine 2013, 5:13http://genomemedicine.com/content/5/2/13
SNPs that were used in our GWAS. Gene annotations and SNP positionsare based on human genome hg18 (NCBI 36.1); linkage equilibriumcorrelation coefficients (r2) are based on Hapmap, release 21. Bottom left:Box plots of NMR signal intensities or NMR ratios for each genotype (inorder major allele homozygotes, heterozygotes, minor allele homozygotes).The number of samples per group is indicated below the plot. Data arepresented on a log10-normal scale. Bottom center: Histograms for NMRsignal intensities or NMR ratios. The blue line and blue boxes indicate thedistribution of the log10-scaled data, the red line indicates a normaldistribution with the same mean and standard deviation as found in thelog10-scaled data. Bottom right: Q-Q plots showing the observed versusthe theoretically expected distribution of the associations’ P values for alltested SNPs to the given NMR bin or NMR ratio.
Additional file 2: Spearman correlation plots between NMRchemical shifts and metabolite concentrations. The plots correspondto the correlations between metabolites and chemical shifts reported inAdditional file 3, Table S1. For some metabolites, reference NMR spectraof the pure compound wereavailable as Free Induction Decay (FID) filesfrom HMDB [18]. In these cases, the reference spectra are plotted belowthe corresponding correlation spectra. Note that in comparison with thecorrelation spectra, the peaksin the HMDB spectra may be shifted due todifferent experimental conditions such as sample pH and calibration to adifferent reference compound.
Additional file 3: Table S1. Spearman correlations between NMRintensities and metabolite concentrations measured on differentplatforms. The ‘Chemical Shift’ column lists the position of the signalintensities that show the best correlation (for rs
2≥0.20) with the chemicalcompound noted in the ‘Metabolite’ column. ‘▲’ ‘indicates positivecorrelation, ‘▼’ anticorrelation. ‘N’ is the number of samples used forcalculating the correlations where valid NMR data points and metaboliteconcentrations were jointly available.’CV’ gives the coefficient of variationin the quality control samples, where available. Chemical shifts arereported in parts per million (ppm).Table S2. Non-parametric tests forgenetic associations with NMR bins and NMR ratios. All associationslisted in Table 1 were tested separately using a non-parametric test. Totest for associations between a SNP and an NMR trait (individualchemical shift or ratio between intensities at two different chemicalshifts), Spearman’s rho statistic was used; the resulting P values are givenas ps. For comparison, the P values of the age- and gender-correctedlinear models are given as plm. Chemical shifts are reported in parts permillion (ppm). See Table 1 for details about the SNPs and the number oftested traits for each variant.
AbbreviationsAPOA1: Apolipoprotein A1; C(OH)x:y: Hydroxylacylcarnitine (x = number ofcarbons in fatty acid side chain, y = number of double bonds in fatty acidside chain); C0: Free carnitine; CETP: Cholesterylester transfer protein; CEU:Utah Residents with Northern and Western European Ancestry; CHR:Chromosome; CPS1: Carbamoyl-phosphate synthetase 1; CV: Coefficient ofvariation; Cx:y: Acylcarnitine (x = number of carbons in fatty acid side chain,y = number of double bonds in fatty acid side chain); Cx:y-DC:Dicarboxylacylcarnitine (x = number of carbons in fatty acid side chain, y =number of double bonds in fatty acid side chain); DNA: Deoxyribonucleicacid; DSS: 4,4-dimethyl-4-silapentane-1-sulfonic acid; EDTA: Ethylenediaminetetraacetic acid; ESI: Electro spray ionization; FADS1: Delta-5 fatty aciddesaturase 1; FID: Free induction decay; GC: Gas chromatography; GCKR:Glucokinase regulator; GIM: Genetically influenced metabotype; GWAS:Genome-wide association study; H1: Hexose; HLD-C: High-density lipoproteincholesterol; HMDB: Human Metabolome Database; IDL: Intermediate-densitylipoprotein; KORA: Kooperative Gesundheitsforschung in der RegionAugsburg (Cooperative Health Research in the Region of Augsburg); LC:Liquid chromatography; LD: Linkage disequilibrium; LDL-C: Low-densitylipoprotein cholesterol; LIPC: Hepatic lipase; LIT: Linear ion trap; m/z: Mass-to-charge ratio; MAF: Minor allele frequency; MS: Mass spectrometry; NCBI:National Center for Biotechnology Information; NMR: Nuclar magneticresonance spectroscopy; PC aa Cx:y: Diacyl phosphatidylcholine (x = numberof carbons in fatty acid side chain, y = number of double bonds in fattyacid side chain); PC ae Cx:y: Acyl-alkyl phosphatidylcholine(x = number of
carbons in fatty acid side chain, y = number of double bonds in fatty acidside chain); POS: Position; ppm: Parts per million; PUFA: Polyunsaturated fattyacid; PYROXD2: Pyridine nucleotide-disulphide oxidoreductase domain 2; Q-Q: Quantile-quantile; SM(OH) Cx:y: N-hydroxylacyloylsphingosylphosphocholine (x = number of carbons in fattyacid side chain, y = number of double bonds in fatty acid side chain); SMCx:y: Sphingomyelin (x = number of carbons in fatty acid side chain, y =number of double bonds in fatty acid side chain); SNP: Single nucleotidepolymorphism; TC: Total cholesterol; TG: Triglyceride; UHPLC: Ultrahighperformance liquid chromatography; VLDL: Very low-density lipoprotein.
Authors’ contributionsDesigned the study and wrote the paper: GK, JR, WR, KSu Contributed todata analysis and/or interpretation: JA, FB, CG, CH, TI, CM, AP, PP, KSt, HWProvided material and/or data: JA, CG, CH, TI, CM, HW All authors read andapproved the final manuscript.
Competing interestsFB and PP are employed by numares GmbH. They contributed only tologistics, optimization of NMR spectroscopy, and to NMR data interpretation.numares was not involved in the design of the study, statistical analyses, orinterpretation of the results. All other authors declare that they have nocompeting interests.
AcknowledgementsThe KORA research platform was initiated and financed by the HelmholtzCenter Munich, German Research Center for Environmental Health, which isfunded by the German Federal Ministry of Education and Research (BMBF)and by the State of Bavaria.Computing resources were made available by the Leibnitz SupercomputingCentre of the Bavarian Academy of Science and Humanities and the DEISAExtreme Computing Initiative (Project MeMGenA).AP is supported by the ENGAGE Exchange and Mobility Program (HEALTH-F4-2007-201413). JR is supported by DFG international research traininggroup ‘GRK 1563, Regulation and Evolution of Cellular Systems (RECESS)’. WRis supported by BMBF grant 03IS2061B (project Gani_Med). KS is supportedby ‘Biomedical Research Program’ funds at Weill Cornell Medical College inQatar, a program funded by the Qatar Foundation.
Author details1Institute of Bioinformatics and Systems Biology, Helmholtz ZentrumMünchen, German Research Center for Environmental Health, IngolstädterLandstraße 1, 85764 Neuherberg, Germany. 2Faculty of Biology, Ludwig-Maximilians-Universität, Großhaderner Straße 2, 82152 Planegg-Martinsried,Germany. 3Institute of Genetic Epidemiology, Helmholtz Zentrum München,German Research Center for Environmental Health, Ingolstädter Landstraße1, 85764 Neuherberg, Germany. 4numares GmbH, Josef-Engert-Str. 9, 93053Regensburg, Germany. 5Klinik und Poliklinik für Innere Medizin II, Universityof Regensburg, Franz-Josef-Strauss-Allee 11, 93053 Germany. 6Research Unitof Molecular Epidemiology, Helmholtz Zentrum München, German ResearchCenter for Environmental Health, Ingolstädter Landstraße 1, 85764Neuherberg, Germany. 7Hannover Unified Biobank, Hannover MedicalSchool, Carl-Neuberg-Straße 1, 30625 Hannover, Germany. 8Institute ofEpidemiology II, Helmholtz Zentrum München, German Research Center forEnvironmental Health, Ingolstädter Landstraße 1, 85764 Neuherberg,Germany. 9Department of Epidemiology and Preventive Medicine, Universityof Regensburg, Franz-Josef-Strauss-Allee 11, 93053 Germany. 10Institute ofEpidemiology I, Helmholtz Zentrum München, German Research Center forEnvironmental Health, Ingolstädter Landstraße 1, 85764 Neuherberg,Germany. 11Institute of Experimental Genetics, Genome Analysis Center,Helmholtz Zentrum München, German Research Center for EnvironmentalHealth, Ingolstädter Landstraße 1, 85764 Neuherberg, Germany.12Department of Physiology and Biophysics, Weill Cornell Medical College inQatar, Education City, Qatar Foundation, P.O. BOX 24144, Doha, Qatar.
Received: 30 November 2012 Revised: 21 December 2012Accepted: 15 February 2013 Published: 15 February 2013
References1. Ward JL, Baker JM, Miller SJ, Deborde C, Maucourt M, Biais B, Rolin D,
Moing A, Moco S, Vervoort J, Lommen A, Schafer H, Humpfer E, Beale MH:
Raffler et al. Genome Medicine 2013, 5:13http://genomemedicine.com/content/5/2/13
An inter-laboratory comparison demonstrates that [H]-NMR metabolitefingerprinting is a robust technique for collaborative plant metabolomicdata collection. Metabolomics 2010, 6:263-273.
2. Viant MR, Bearden DW, Bundy JG, Burton IW, Collette TW, Ekman DR,Ezernieks V, Karakach TK, Lin CY, Rochfort S, de Ropp JS, Teng Q, Tjeerdema RS,Walter JA, Wu H: International NMR-based environmental metabolomicsintercomparison exercise. Environ Sci Technol 2009, 43:219-225.
3. Gieger C, Geistlinger L, Altmaier E, Hrabe de Angelis M, Kronenberg F,Meitinger T, Mewes HW, Wichmann HE, Weinberger KM, Adamski J, Illig T,Suhre K: Genetics meets metabolomics: a genome-wide association studyof metabolite profiles in human serum. PLoS Genet 2008, 4:e1000282.
5. Suhre K, Shin SY, Petersen AK, Mohney RP, Meredith D, Wagele B,Altmaier E, Deloukas P, Erdmann J, Grundberg E, Hammond CJ, deAngelis MH, Kastenmuller G, Kottgen A, Kronenberg F, Mangino M,Meisinger C, Meitinger T, Mewes HW, Milburn MV, Prehn C, Raffler J,Ried JS, Romisch-Margl W, Samani NJ, Small KS, Wichmann HE, Zhai G,Illig T, Spector TD, et al: Human metabolic individuality in biomedical andpharmaceutical research. Nature 2011, 477:54-60.
6. Nicholson G, Rantalainen M, Li JV, Maher AD, Malmodin D, Ahmadi KR,Faber JH, Barrett A, Min JL, Rayner NW, Toft H, Krestyaninova M, Viksna J,Neogi SG, Dumas ME, Sarkans U, Donnelly P, Illig T, Adamski J, Suhre K,Allen M, Zondervan KT, Spector TD, Nicholson JK, Lindon JC, Baunsgaard D,Holmes E, McCarthy MI, Holmes CC: A genome-wide metabolic QTLanalysis in Europeans implicates two loci shaped by recent positiveselection. PLoS Genet 2011, 7:e1002270.
7. Kettunen J, Tukiainen T, Sarin AP, Ortega-Alonso A, Tikkanen E,Lyytikainen LP, Kangas AJ, Soininen P, Wurtz P, Silander K, Dick DM, Rose RJ,Savolainen MJ, Viikari J, Kahonen M, Lehtimaki T, Pietilainen KH, Inouye M,McCarthy MI, Jula A, Eriksson J, Raitakari OT, Salomaa V, Kaprio J,Jarvelin MR, Peltonen L, Perola M, Freimer NB, Ala-Korpela M, Palotie A,Ripatti S: Genome-wide association study identifies multiple lociinfluencing human serum metabolite levels. Nat Genet 2012, 44:269-276.
8. Franke A, McGovern DP, Barrett JC, Wang K, Radford-Smith GL, Ahmad T,Lees CW, Balschun T, Lee J, Roberts R, Anderson CA, Bis JC, Bumpstead S,Ellinghaus D, Festen EM, Georges M, Green T, Haritunians T, Jostins L,Latiano A, Mathew CG, Montgomery GW, Prescott NJ, Raychaudhuri S,Rotter JI, Schumm P, Sharma Y, Simms LA, Taylor KD, Whiteman D, et al:Genome-wide meta-analysis increases to 71 the number of confirmedCrohn’s disease susceptibility loci. Nat Genet 2010, 42:1118-1125.
9. Kathiresan S, Willer CJ, Peloso GM, Demissie S, Musunuru K, Schadt EE,Kaplan L, Bennett D, Li Y, Tanaka T, Voight BF, Bonnycastle LL, Jackson AU,Crawford G, Surti A, Guiducci C, Burtt NP, Parish S, Clarke R, Zelenika D,Kubalanza KA, Morken MA, Scott LJ, Stringham HM, Galan P, Swift AJ,Kuusisto J, Bergman RN, Sundvall J, Laakso M, et al: Common variants at30 loci contribute to polygenic dyslipidemia. Nat Genet 2009, 41:56-65.
10. Dupuis J, Langenberg C, Prokopenko I, Saxena R, Soranzo N, Jackson AU,Wheeler E, Glazer NL, Bouatia-Naji N, Gloyn AL, Lindgren CM, Magi R,Morris AP, Randall J, Johnson T, Elliott P, Rybin D, Thorleifsson G,Steinthorsdottir V, Henneman P, Grallert H, Dehghan A, Hottenga JJ,Franklin CS, Navarro P, Song K, Goel A, Perry JR, Egan JM, Lajunen T, et al:New genetic loci implicated in fasting glucose homeostasis and theirimpact on type 2 diabetes risk. Nat Genet 2010, 42:105-116.
11. Kottgen A, Pattaro C, Boger CA, Fuchsberger C, Olden M, Glazer NL,Parsa A, Gao X, Yang Q, Smith AV, O’Connell JR, Li M, Schmidt H, Tanaka T,Isaacs A, Ketkar S, Hwang SJ, Johnson AD, Dehghan A, Teumer A, Pare G,Atkinson EJ, Zeller T, Lohman K, Cornelis MC, Probst-Hensch NM,Kronenberg F, Tonjes A, Hayward C, Aspelund T, et al: New loci associatedwith kidney function and chronic kidney disease. Nat Genet 2010,42:376-384.
12. Petersen AK, Krumsiek J, Wagele B, Theis FJ, Wichmann HE, Gieger C,Suhre K: On the hypothesis-free testing of metabolite ratios in genome-wide and metabolome-wide association studies. BMC Bioinformatics 2012,13:120.
13. Petersen AK, Stark K, Musameh MD, Nelson CP, Romisch-Margl W,Kremer W, Raffler J, Krug S, Skurk T, Rist MJ, Daniel H, Hauner H, Adamski J,Tomaszewski M, Doring A, Peters A, Wichmann HE, Kaess BM, Kalbitzer HR,
Huber F, Pfahlert V, Samani NJ, Kronenberg F, Dieplinger H, Illig T,Hengstenberg C, Suhre K, Gieger C, Kastenmuller G: Genetic associationswith lipoprotein subfractions provide information on their biologicalnature. Hum Mol Genet 2012, 21:1433-1443.
14. Wichmann HE, Gieger C, Illig T: KORA-gen–resource for populationgenetics, controls and a broad spectrum of disease phenotypes.Gesundheitswesen 2005, , Suppl 1: S26-30.
15. Smolinska A, Blanchet L, Buydens LM, Wijmenga SS: NMR and patternrecognition methods in metabolomics: From data acquisition tobiomarker discovery: A review. Anal Chim Acta 2012, 750:82-97.
16. Purcell S, Neale B, Todd-Brown K, Thomas L, Ferreira MA, Bender D, Maller J,Sklar P, de Bakker PI, Daly MJ, Sham PC: PLINK: a tool set for whole-genome association and population-based linkage analyses. Am J HumGenet 2007, 81:559-575.
17. Suhre K, Wallaschofski H, Raffler J, Friedrich N, Haring R, Michael K,Wasner C, Krebs A, Kronenberg F, Chang D, Meisinger C, Wichmann HE,Hoffmann W, Volzke H, Volker U, Teumer A, Biffar R, Kocher T, Felix SB,Illig T, Kroemer HK, Gieger C, Romisch-Margl W, Nauck M: A genome-wideassociation study of metabolic traits in human urine. Nat Genet 2011,43:565-569.
18. Wishart DS, Knox C, Guo AC, Eisner R, Young N, Gautam B, Hau DD,Psychogios N, Dong E, Bouatra S, Mandal R, Sinelnikov I, Xia J, Jia L, Cruz JA,Lim E, Sobsey CA, Shrivastava S, Huang P, Liu P, Fang L, Peng J, Fradette R,Cheng D, Tzur D, Clements M, Lewis A, De Souza A, Zuniga A, Dawe M,et al: HMDB: a knowledgebase for the human metabolome. Nucleic AcidsRes 2009, 37:D603-610.
19. Klaus V, Vermeulen T, Minassian B, Israelian N, Engel K, Lund AM,Roebrock K, Christensen E, Haberle J: Highly variable clinical phenotype ofcarbamylphosphate synthetase 1 deficiency in one family: an effect ofallelic variation in gene expression?. Clin Genet 2009, 76:263-269.
20. Dumont J, Huybrechts I, Spinneker A, Gottrand F, Grammatikaki E,Bevilacqua N, Vyncke K, Widhalm K, Kafatos A, Molnar D, Labayen I,Gonzalez-Gross M, Amouyel P, Moreno LA, Meirhaeghe A, Dallongeville J:FADS1 genetic variability interacts with dietary alpha-linolenic acidintake to affect serum non-HDL-cholesterol concentrations in Europeanadolescents. J Nutr 2011, 141:1247-1253.
21. Lu Y, Feskens EJ, Dolle ME, Imholz S, Verschuren WM, Muller M, Boer JM:Dietary n-3 and n-6 polyunsaturated fatty acid intake interacts with FADS1genetic variation to affect total and HDL-cholesterol concentrations in theDoetinchem Cohort Study. Am J Clin Nutr 2010, 92:258-265.
22. van Schaftingen E, Veiga-da-Cunha M, Niculescu L: The regulatory proteinof glucokinase. Biochem Soc Trans 1997, 25:136-140.
23. Vaxillaire M, Cavalcanti-Proenca C, Dechaume A, Tichet J, Marre M, Balkau B,Froguel P: The common P446L polymorphism in GCKR inverselymodulates fasting glucose and triglyceride levels and reduces type 2diabetes risk in the DESIR prospective general French population.Diabetes 2008, 57:2253-2257.
24. Saxena R, Voight BF, Lyssenko V, Burtt NP, de Bakker PI, Chen H, Roix JJ,Kathiresan S, Hirschhorn JN, Daly MJ, Hughes TE, Groop L, Altshuler D,Almgren P, Florez JC, Meyer J, Ardlie K, Bengtsson Bostrom K, Isomaa B,Lettre G, Lindblad U, Lyon HN, Melander O, Newton-Cheh C, Nilsson P,Orho-Melander M, Rastam L, Speliotes EK, Taskinen MR, Tuomi T, et al:Genome-wide association analysis identifies loci for type 2 diabetes andtriglyceride levels. Science 2007, 316:1331-1336.
25. Horvatovich K, Bokor S, Polgar N, Kisfali P, Hadarits F, Jaromi L, Csongei V,Repasy J, Molnar D, Melegh B: Functional glucokinase regulator genevariants have inverse effects on triglyceride and glucose levels, anddecrease the risk of obesity in children. Diabetes Metab 2011, 37:432-439.
26. Kristiansson K, Perola M, Tikkanen E, Kettunen J, Surakka I, Havulinna AS,Stancakova A, Barnes C, Widen E, Kajantie E, Eriksson JG, Viikari J,Kahonen M, Lehtimaki T, Raitakari OT, Hartikainen AL, Ruokonen A, Pouta A,Jula A, Kangas AJ, Soininen P, Ala-Korpela M, Mannisto S, Jousilahti P,Bonnycastle LL, Jarvelin MR, Kuusisto J, Collins FS, Laakso M, Hurles ME,et al: Genome-wide screen for metabolic syndrome susceptibility Locireveals strong lipid gene contribution but no evidence for commongenetic basis for clustering of metabolic syndrome traits. Circ CardiovascGenet 2012, 5:242-249.
27. Krumsiek J, Suhre K, Evans AM, Mitchell MW, Mohney RP, Milburn MV,Wagele B, Romisch-Margl W, Illig T, Adamski J, Gieger C, Theis FJ,Kastenmuller G: Mining the unknown: a systems approach to metabolite
Raffler et al. Genome Medicine 2013, 5:13http://genomemedicine.com/content/5/2/13
identification combining genetic and metabolic information. PLoS Genet2012, 8:e1003005.
28. Wei SW, Zhang J, Liu LY, Ye T, Gowda GAN, Tayyari F, Raftery D: Ratioanalysis nuclear magnetic resonance spectroscopy for selectivemetabolite identification in complex samples. Analytical Chemistry 2011,83:7616-7623.
doi:10.1186/gm417Cite this article as: Raffler et al.: Identification and MS-assistedinterpretation of genetically influenced NMR signals in human plasma.Genome Medicine 2013 5:13.
Submit your next manuscript to BioMed Centraland take full advantage of:
• Convenient online submission
• Thorough peer review
• No space constraints or color figure charges
• Immediate publication on acceptance
• Inclusion in PubMed, CAS, Scopus and Google Scholar
• Research which is freely available for redistribution
Submit your manuscript at www.biomedcentral.com/submit
Raffler et al. Genome Medicine 2013, 5:13http://genomemedicine.com/content/5/2/13