INTERNATIONAL STANDARDS FOR PHYTOSANITARY MEASURES
ISPM 31
METHODOLOGIES FOR SAMPLING OF CONSIGNMENTS
(2009)
Produced by the Secretariat of the International Plant Protection Convention
Publication history This is not an official part of the standard 2004-04 ICPM-6 added topic Sampling of consignments (2004-030) 2004-04 SC approved Specification 20 Guidelines on sampling of consignments 2005-07 EWG developed draft text 2006-05 SC requested comments via e-mail 2007-05 SC revised draft text and approved for MC 2007-06 Sent for MC 2007-11 SC revised draft text 2008-04 CPM-3 adopted standard ISPM 31. 2008. Methodologies for sampling of consignments. Rome, IPPC, FAO. Publication history: Last modified August 2011
Methodologies for sampling of consignments ISPM 31
5.1 Pests distribution unknown in the lot ........................................................................ 31-12 5.2 Pest distribution aggregated in the lot ....................................................................... 31-12
6. Varying Level of Detection....................................................................................................... 31-13
ISPM 31 Methodologies for sampling of consignments
ISPM 31-4
7. Outcome of Sampling ............................................................................................................... 31-13 APPENDIX 1: Formulae used in Appendixes 2–5 .......................................................................... 31-14 APPENDIX 2: Calculating sample sizes for small lots: hypergeometric-based sampling
(simple random sampling) ........................................................................................................ 31-15
APPENDIX 3: Sampling of large lots: binomial or Poisson based sampling .................................. 31-18 APPENDIX 4: Sampling for pests with an aggregated distribution: beta-binomial based
sampling.................................................................................................................................... 31-20 APPENDIX 5: Comparison of hypergeometric and fixed proportion sampling results .................. 31-21
Methodologies for sampling of consignments ISPM 31
ISPM 31-5
Adoption This standard was adopted by the Third Session of the Commission on Phytosanitary Measures in April 2008.
INTRODUCTION
Scope This standard provides guidance to national plant protection organizations (NPPOs) in selecting appropriate sampling methodologies for inspection or testing of consignments to verify compliance with phytosanitary requirements.
This standard does not give guidance on field sampling (for example, as required for surveys).
References Cochran, W.G. 1977. Sampling techniques. 3rd edn. New York, John Wiley & Sons. 428 pp. ISPM 1. 2006. Phytosanitary principles for the protection of plants and the application of
phytosanitary measures in international trade. Rome, IPPC, FAO. ISPM 5. Glossary of phytosanitary terms. Rome, IPPC, FAO. ISPM 11. 2004. Pest risk analysis for quarantine pests including analysis of environmental risks and
living modified organisms. Rome, IPPC, FAO. ISPM 20. 2004. Guidelines for a phytosanitary import regulatory system. Rome, IPPC, FAO. ISPM 21. 2004. Pest risk analysis for regulated non-quarantine pests. Rome, IPPC, FAO. ISPM 23. 2005. Guidelines for inspection. Rome, IPPC, FAO.
Definitions Definitions of phytosanitary terms used in the present standard can be found in ISPM 5 (Glossary of phytosanitary terms).
Outline of Requirements The sampling methodologies used by NPPOs in selecting samples for the inspection of consignments of commodities moving in international trade are based on a number of sampling concepts. These include parameters such as acceptance level, level of detection, confidence level, efficacy of detection and sample size.
The application of statistically based methods, such as simple random sampling, systematic sampling, stratified sampling, sequential sampling or cluster sampling, provides results with a statistical confidence level. Other sampling methods that are not statistically based, such as convenience sampling, haphazard sampling or selective sampling, may provide valid results in determining the presence or absence of a regulated pest(s) but no statistical inference can be made on their basis. Operational limitations will have an effect on the practicality of sampling under one or another method.
In using sampling methodologies, NPPOs accept some degree of risk that non-conforming lots may not be detected. Inspection using statistically based methods can provide results with a certain level of confidence only and cannot prove the absence of a pest from a consignment.
ISPM 31 Methodologies for sampling of consignments
ISPM 31-6
BACKGROUND This standard provides the statistical basis for, and complements, ISPM 20:2004 and ISPM 23:2005. Inspection of consignments of regulated articles moving in trade is an essential tool for the management of pest risks and is the most frequently used phytosanitary procedure worldwide to determine if pests are present and/or the compliance with phytosanitary import requirements.
It is usually not feasible to inspect entire consignments, so phytosanitary inspection is performed mainly on samples obtained from a consignment. It is noted that the sampling concepts presented in this standard may also apply to other phytosanitary procedures, notably selection of units for testing.
Sampling of plants, plant products and other regulated articles may occur prior to export, at the point of import, or other points as determined by NPPOs.
It is important that sampling procedures established and used by NPPOs are documented and transparent, and take into account the principle of minimum impact (ISPM 1:2006), particularly because inspection based on sampling may lead to the refusal to issue a phytosanitary certificate, refusal of entry, or treatment or destruction of a consignment or part of a consignment.
Sampling methodologies used by NPPOs will depend on the sampling objectives (for example, sampling for testing) and may be solely statistically based or developed noting particular operational constraints. Methodologies developed to achieve the sampling objectives, within operational constraints, may not yield the same statistical confidence levels in the results as fully statistically based methods, but such methods may still give valid results depending on the desired sampling objective. If the sole purpose of sampling is to increase the chance of finding a pest, selective or targeted sampling is also valid.
OBJECTIVES OF SAMPLING OF CONSIGNMENTS Sampling of consignments is done for inspection and/or testing in order to: - detect regulated pests - provide assurance that the number of regulated pests or infested units in a consignment does not
exceed the specified tolerance level for the pest - provide assurance of the general phytosanitary condition of a consignment - detect organisms for which a phytosanitary risk has not yet been determined - optimize the probability of detecting specific regulated pests - maximize the use of available sampling resources - gather other information such as for monitoring of a pathway - verify compliance with phytosanitary requirements - determine the proportion of the consignment infested.
It should be noted that inspection and/or testing based on sampling always involves a degree of error. The acceptance of some probability that the pests are present is inherent in the use of sampling procedures for inspection and/or testing. Inspection and/or testing using statistically based sampling methods can provide a level of confidence that the incidence of a pest is below a certain level, but it does not prove that a pest is truly absent from a consignment.
Methodologies for sampling of consignments ISPM 31
ISPM 31-7
REQUIREMENTS
1. Lot Identification A consignment may consist of one or more lots. Where a consignment comprises more than one lot, the inspection to determine compliance may have to consist of several separate visual examinations, and therefore the lots will have to be sampled separately. In such cases, the samples relating to each lot should be segregated and identified in order that the appropriate lot can be clearly identified if subsequent inspection or testing reveals non-compliance with phytosanitary requirements. Whether or not a lot will be inspected should be determined using factors stated in ISPM 23:2005 (section 1.5).
A lot to be sampled should be a number of units of a single commodity identifiable by its homogeneity in factors such as: - origin - grower - packing facility - species, variety, or degree of maturity - exporter - area of production - regulated pests and their characteristics - treatment at origin - type of processing.
The criteria used by the NPPO to distinguish lots should be consistently applied for similar consignments.
Treating multiple commodities as a single lot for convenience may mean that statistical inferences can not be drawn from the results of the sampling.
2. Sample Unit Sampling first involves the identification of the appropriate unit for sampling (for example, a fruit, stem, bunch, unit of weight, bag or carton). The determination of the sample unit is affected by issues related to homogeneity in the distribution of pests through the commodity, whether the pests are sedentary or mobile, how the consignment is packaged, intended use, and operational considerations. For example, if determined solely on pest biology, the appropriate sample unit might be an individual plant or plant product in the case of a low-mobility pest, whereas in the case of mobile pests, a carton or other commodity container may be the preferred sample unit. However, when inspection is to detect more than one type of pest, other considerations (for example, practicality of using different sample units) may apply. Sample units should be consistently defined and independent from each other. This will allow NPPOs to simplify the process of making inferences from the sample to the lot or consignment from which the sample was selected.
3. Statistical and Non-Statistical Sampling The sampling method is the process approved by the NPPO to select units for inspection and/or testing. Sampling for phytosanitary inspection of consignments or lots is done by taking units from the consignment or lot without replacement of the units selected1
1 Sampling without replacement is selecting a unit from the consignment or lot without replacing the unit before the next units are selected. Sampling without replacement does not mean that a selected item cannot be returned to a consignment (except for destructive sampling); it means only that the inspector should not return it before selecting the remainder of the sample.
. NPPOs may choose either a statistically based or non-statistical sampling methodology.
ISPM 31 Methodologies for sampling of consignments
ISPM 31-8
Sampling based on statistical or targeted methods is designed to facilitate the detection of a regulated pest(s) in a consignment and/or lot.
3.1 Statistically based sampling Statistically based sampling methods involve the determination of a number of interrelated parameters and the selection of the most appropriate statistically based sampling method.
3.1.1 Parameters and related concepts Statistically based sampling is designed to detect a certain percentage or proportion of infestation with a specific confidence level, and thus requires the NPPO to determine the following interrelated parameters: acceptance number, level of detection, confidence level, efficacy of detection and sample size. The NPPO may also establish a tolerance level for certain pests (for example, regulated non-quarantine pests).
3.1.1.1 Acceptance number The acceptance number is the number of infested units or the number of individual pests that are permissible in a sample of a given size before phytosanitary action is taken. Many NPPOs determine this number to be zero for quarantine pests. For example, if the acceptance number is zero and an infested unit is detected in the sample then phytosanitary action will be taken. It is important to appreciate that a zero acceptance number within a sample does not imply a zero tolerance level in the consignment as a whole. Even if no pests are detected in the sample there remains a probability that the pest may be present in the remainder of the consignment, albeit at a very low level.
The acceptance number is linked to the sample. The acceptance number is the number of infested units or the number of individual pests that are permissible in the sample whereas the tolerance level (see section 3.1.1.6) refers to the status of the entire consignment.
3.1.1.2 Level of detection The level of detection is the minimum percentage or proportion of infestation that the sampling methodology will detect at the specified efficacy of detection and level of confidence and which the NPPO intends to detect in a consignment.
The level of detection may be specified for a pest, a group or category of pests, or for unspecified pests. The level of detection may be derived from: - a decision based on pest risk analysis to detect a specified level of infestation (the infestation
determined to present an unacceptable risk) - an evaluation of the effectiveness of phytosanitary measures applied before inspection - an operationally based decision that inspection intensity above a certain level is not practical.
3.1.1.3 Confidence level The confidence level indicates the probability that a consignment with a degree of infestation exceeding the level of detection will be detected. A confidence level of 95% is commonly used. The NPPO may choose to require different confidence levels depending on the intended use of the commodity. For example, a higher confidence level for detection may be required for commodities for planting than for commodities for consumption, and the confidence level may also vary with the strength of the phytosanitary measures applied and historical evidence of non-compliance. Very high confidence level values quickly become difficult to achieve, and lower values become less meaningful for decision-making. A 95% confidence level means that the conclusions drawn from the results of sampling will detect a non-compliant consignment, on average, 95 times out of 100, and therefore, it may be assumed that, on average, 5% of non-compliant consignments will not be detected.
Methodologies for sampling of consignments ISPM 31
ISPM 31-9
3.1.1.4 Efficacy of detection The efficacy of detection is the probability that an inspection or test of an infested unit(s) will detect a pest. In general the efficacy should not be assumed to be 100%. For example, pests may be difficult to detect visually, plants may not express symptoms of disease (latent infection), or efficacy may be reduced as a result of human error. It is possible to include lower efficacy values (for instance, an 80% chance of detecting the pest when an infested unit is inspected) in the determination of sample size.
3.1.1.5 Sample size The sample size is the number of units selected from the lot or consignment that will be inspected or tested. Guidance on determining the sample size is provided in section 5.
3.1.1.6 Tolerance level Tolerance level refers to the percentage of infestation in the entire consignment or lot that is the threshold for phytosanitary action.
Tolerance levels may be established for regulated non-quarantine pests (as described in ISPM 21:2004, section 4.4) and may also be established for conditions related to other phytosanitary import requirements (for example, bark on wood or soil on plant roots).
Most NPPOs have a zero tolerance level for all quarantine pests, taking into account probabilities of pest presence in the non-sampled units as described in section 3.1.1.1. However, an NPPO may determine to establish a tolerance level for a quarantine pest based on pest risk analysis (as described in ISPM 11:2004, section 3.4.1) and then determine sampling rates from this. For example, NPPOs may determine a tolerance level that is greater than zero because small numbers of the quarantine pest may be acceptable if the establishment potential of the pest is considered low or if the intended end use of the product (for example, fresh fruit and vegetables imported for processing) limits the potential of entry of the pest into endangered areas.
3.1.2 Links between the parameters and tolerance level The five parameters (acceptance number, level of detection, confidence level, efficacy of detection and sample size) are statistically related. Taking into account the established tolerance level, the NPPO should determine the efficacy of the detection method used and decide upon the acceptance number in the sample; any two of the remaining three parameters can also be chosen, and the remainder will be determined from the values chosen for the rest.
If a tolerance level greater than zero has been established, the level of detection chosen should be equal to (or less than, if the acceptance number is greater than zero) the tolerance level to ensure that consignments having an infestation level greater than the tolerance level will be detected with the specified confidence level.
If no pests are detected in the sample unit, then the percentage of infestation in the consignment can not be stated beyond the fact that it falls below the level of detection at the stated confidence level. If the pest is not detected with the appropriate sample size, the confidence level gives a probability that the tolerance level is not exceeded.
3.1.3 Statistically based sampling methods
3.1.3.1 Simple random sampling Simple random sampling results in all sample units having an equal probability of being selected from the lot or consignment. Simple random sampling involves drawing the sample units in accordance with a tool such as a random numbers table. The use of a predetermined randomization process is what distinguishes this method from haphazard sampling (described in section 3.2.2).
ISPM 31 Methodologies for sampling of consignments
ISPM 31-10
This method is used when little is known about the pest distribution or rate of infestation. Simple random sampling can be difficult to apply correctly in operational situations. To use this method, each unit should have an equal probability of selection. In cases where a pest is not distributed randomly through the lot, this method may not be optimal. Simple random sampling may require greater resources than other sampling methods. The application can be dependent on the type and/or configuration of the consignment.
3.1.3.2 Systematic sampling Systematic sampling involves drawing a sample from units in the lot at fixed, predetermined intervals. However, the first selection must be made at random through the lot. Biased results are possible if pests are distributed in a manner similar to the interval chosen for sampling.
Two advantages of this method are that the sampling process may be automated through machinery and that it requires the use of a random process only to select the first unit.
3.1.3.3 Stratified sampling Stratified sampling involves separating the lot into separate subdivisions (that is, strata) and then drawing the sample units from each and every subdivision. Within each subdivision, sample units are taken using a particular method (systematic or random). Under some circumstances, different numbers of sample units may be taken from each subdivision – for instance, the number of sample units may be proportional to the size of the subdivision, or based on prior knowledge concerning the infestation of the subdivisions.
If at all feasible, stratified sampling will almost always improve detection accuracy. The smaller variation associated with stratified sampling yields more accurate results. This is especially true when infestation levels may vary across a lot depending on packing procedures or storage conditions. Stratified sampling is the preferred choice when knowledge about the pest distribution is presumed and operational considerations will allow it.
3.1.3.4 Sequential sampling Sequential sampling involves drawing a series of sample units using one of the above methods. After each sample (or group) is drawn, the data are accumulated and compared with predetermined ranges to decide whether to accept the consignment, reject the consignment or continue sampling.
This method can be used when a tolerance level greater than zero is determined and the first set of sample units does not provide sufficient information to allow a decision to be made on whether or not the tolerance level is exceeded. This method would not be used if the acceptance number in a sample of any size is zero. Sequential sampling may reduce the number of samples required for a decision to be made or reduce the possibility of rejecting a conforming consignment.
3.1.3.5 Cluster sampling Cluster sampling involves selecting groups of units based on a predefined cluster size (for example, boxes of fruit, bunches of flowers) to make up the total number of sample units required from the lot. Cluster sampling is simpler to evaluate and more reliable if the clusters are of equal size. It is useful if resources available for sampling are limited and works well when the distribution of pests is expected to be random.
Cluster sampling can be stratified, and can use either systematic or random methods for selecting the groups. Of the statistically based methods, this method is often the most practical to implement.
Methodologies for sampling of consignments ISPM 31
ISPM 31-11
3.1.3.6 Fixed proportion sampling Sampling a fixed proportion of the units in the lot (for example, 2%) results in inconsistent levels of detection or confidence levels when lot size varies. As shown in Appendix 5, fixed proportion sampling results in changing confidence levels for a given level of detection, or in changing levels of detection for a given confidence level.
3.2 Non-statistically based sampling Other sampling methods that are not statistically based, such as convenience sampling, haphazard sampling or selective or targeted sampling, may provide valid results in determining the presence or absence of a regulated pest(s). The following methods may be used based on specific operational considerations or when the goal is purely detection of pests.
3.2.1 Convenience sampling Convenience sampling involves selecting the most convenient (for example, accessible, cheapest, fastest) units from the lot, without selecting units in a random or systematic manner.
3.2.2 Haphazard sampling Haphazard sampling involves selecting arbitrary units without using a true randomization process. This may often appear to be random because the inspector is not conscious of having any selection bias. However, unconscious bias may occur, so that the degree to which the sample is representative of the lot is unknown.
3.2.3 Selective or targeted sampling Selective sampling involves deliberately selecting samples from parts of the lot most likely to be infested, or units that are obviously infested, in order to increase the chance of detecting a specific regulated pest. This method may rely on inspectors who are experienced with the commodity and familiar with the pest’s biology. Use of this method may also be triggered through a pathway analysis identifying a specific section of the lot with a higher probability of being infested (for example, a wet section of timber may be more likely to harbour nematodes). Because the sample is targeted, and hence statistically biased, a probabilistic statement about the infestation level in the lot can not be made. However, if the sole purpose of sampling is to increase the chance of finding a regulated pest(s), this method is valid. Separate samples of the commodity may be required to meet general confidence in detection of other regulated pests. The use of selective or targeted sampling may limit the opportunities to derive information about the overall pest status of the lot or consignment, because sampling is focused on where specific regulated pests are likely to be found not on the remainder of the lot or consignment.
4. Selecting a Sampling Method In most cases the selection of an appropriate sampling method is necessarily dependent on information available about pest incidence and distribution in the consignment or lot as well as the operational parameters associated with the inspection situation in question. In most phytosanitary applications operational limitations will dictate the practicality of sampling under one or another method. Subsequently determining the statistical validity of practical methods will narrow the field of alternatives.
The sampling method that is ultimately selected by the NPPO should be operationally feasible and be the most appropriate to achieve the objective and be well documented for transparency. Operational feasibility is clearly linked to judgements concerning situation-specific factors, but should be consistently applied.
ISPM 31 Methodologies for sampling of consignments
ISPM 31-12
If sampling is undertaken to increase the chance of detecting a specific pest targeted sampling (described in section 3.2.3) may be the preferred option as long as the inspectors can identify the section(s) of the lot with a higher probability of being infested. Without this knowledge, one of the statistically based methods will be more appropriate. Non-statistically based sampling methods do not result in each unit having an equal probability of being included in the sample and do not allow for quantification of a confidence level or level of detection.
Statistically based methods will be appropriate if sampling is undertaken to provide information about the general phytosanitary condition of a consignment, to detect multiple quarantine pests or to verify compliance with phytosanitary requirements.
In selecting a statistically based method, consideration may be given to how the consignment has been treated in harvesting, sorting and packing, and the likely distribution of the pest(s) in the lot. Sampling methods may be combined: for instance, a stratified sample may have either random or systematic selection of sample units (or clusters) within strata.
If sampling is undertaken to determine whether a specific non-zero tolerance level has been exceeded, a sequential sampling method may be appropriate.
Once a sampling method has been selected and correctly applied, repeating the sampling with the aim of achieving a different result is unacceptable. Sampling should not be repeated unless considered necessary for specific technical reasons (for example, suspected incorrect application of sampling methodology).
5. Sample Size Determination To determine the number of samples to be taken, the NPPO should select a confidence level (for example, 95%), a level of detection (for example, 5%) and an acceptance number (for example, zero), and determine the efficacy of detection (for example, 80%). From these values and the lot size, a sample size can be calculated. Appendixes 2–5 set out the mathematical basis for sample size determination. Section 3.1.3 of this standard provides guidance on the most appropriate statistical based sampling method when considering the distribution of the pest in the lot.
5.1 Pests distribution unknown in the lot Because sampling is done without replacement and the population size is finite, the hypergeometric distribution should be used to determine the sample size. This distribution gives a probability of detecting a certain number of infested units in a sample of a given size drawn from a lot of a given size, when a specific number of infested units exist in the lot (see Appendix 2). The number of infested units in the lot is estimated as the level of detection multiplied by the total number of units in the lot.
As lot size increases, the sample size required for a specific level of detection and confidence level approaches an upper limit. When the sample size is less than 5% of the lot size, the sample size can be calculated using either the binomial or Poisson distribution (see Appendix 3). All three distributions (hypergeometric, binomial and Poisson) give almost identical sample sizes for specific confidence and detection levels with large lot sizes, but binomial and Poisson distributions are easier to calculate.
5.2 Pest distribution aggregated in the lot Most pest populations are aggregated to some degree in the field. Because commodities may be harvested and packed in the field without being graded or sorted, the distribution of infested units in the lot may be clustered or aggregated. Aggregation of infested units of a commodity will always lower the likelihood of finding an infestation. However, phytosanitary inspections are aimed at detection of infested units and/or pest(s) at a low level. The effect of aggregation of the infested units on the efficacy of detection of a sample and on the required sample size is small in most cases. When
Methodologies for sampling of consignments ISPM 31
ISPM 31-13
NPPOs identify that there is a high likelihood that there will be aggregation of infested units in the lot a stratified sampling method may help increase the chance of detecting an aggregated infestation.
When pests are aggregated, the calculation of sample size should ideally be performed using a beta-binomial distribution (see Appendix 4). However, this calculation requires knowledge of the degree of aggregation, which is generally not known and therefore this distribution may not be practical for general use. One of the other distributions (hypergeometric, binomial or Poisson) can be used; however, the confidence level of the sampling will decline as the degree of aggregation increases.
6. Varying Level of Detection The choice of a constant level of detection may result in a varying number of infested units entering with imported consignments because lot size varies (for example, a 1% infestation level of 1000 units corresponds to 10 infested units, while a 1% infestation level of 10,000 units corresponds to 100 infested units). Ideally the selection of a level of detection will reflect in part the number of infested units entering on all consignments within a particular period of time. If NPPOs want to manage the number of infested units entering with each consignment as well, a varying level of detection may be used. A tolerance level would be specified in terms of a number of infested items per consignment, and the sample size would be set in order to give the desired confidence and detection levels.
7. Outcome of Sampling The outcome of activities and techniques related to sampling may result in phytosanitary action being taken (further details can be found in ISPM 23:2005, section 2.5).
ISPM 31 Methodologies for sampling of consignments - Appendix 1
ISPM 31-14
This appendix is for reference purposes only and is not a prescriptive part of the standard.
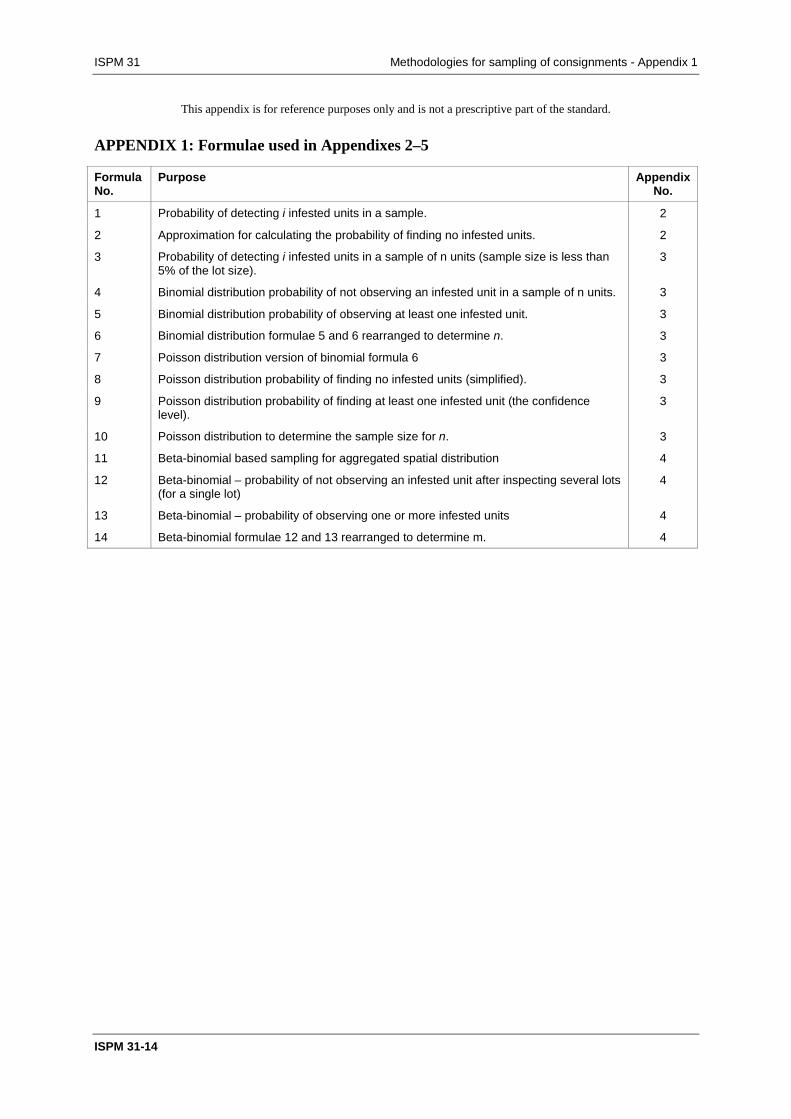
APPENDIX 1: Formulae used in Appendixes 2–5
Formula No.
Purpose Appendix No.
1 Probability of detecting i infested units in a sample. 2
2 Approximation for calculating the probability of finding no infested units. 2
3 Probability of detecting i infested units in a sample of n units (sample size is less than 5% of the lot size).
3
4 Binomial distribution probability of not observing an infested unit in a sample of n units. 3
5 Binomial distribution probability of observing at least one infested unit. 3
6 Binomial distribution formulae 5 and 6 rearranged to determine n. 3
7 Poisson distribution version of binomial formula 6 3
8 Poisson distribution probability of finding no infested units (simplified). 3
9 Poisson distribution probability of finding at least one infested unit (the confidence level).
3
10 Poisson distribution to determine the sample size for n. 3
11 Beta-binomial based sampling for aggregated spatial distribution 4
12 Beta-binomial – probability of not observing an infested unit after inspecting several lots (for a single lot)
4
13 Beta-binomial – probability of observing one or more infested units 4
14 Beta-binomial formulae 12 and 13 rearranged to determine m. 4
Methodologies for sampling of consignments - Appendix 2 ISPM 31
ISPM 31-15
This appendix is for reference purposes only and is not a prescriptive part of the standard.
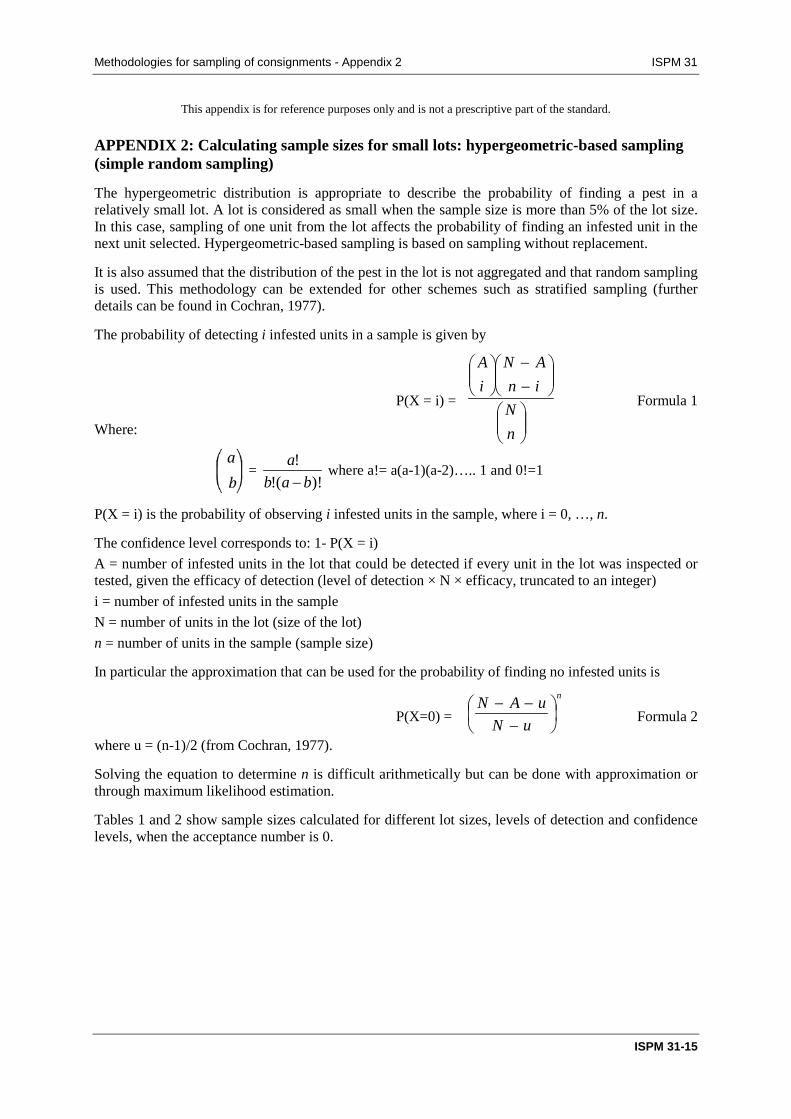
APPENDIX 2: Calculating sample sizes for small lots: hypergeometric-based sampling (simple random sampling)
The hypergeometric distribution is appropriate to describe the probability of finding a pest in a relatively small lot. A lot is considered as small when the sample size is more than 5% of the lot size. In this case, sampling of one unit from the lot affects the probability of finding an infested unit in the next unit selected. Hypergeometric-based sampling is based on sampling without replacement.
It is also assumed that the distribution of the pest in the lot is not aggregated and that random sampling is used. This methodology can be extended for other schemes such as stratified sampling (further details can be found in Cochran, 1977).
The probability of detecting i infested units in a sample is given by
P(X = i) = Formula 1
Where:
= )!(!
!bab
a−
where a!= a(a-1)(a-2)….. 1 and 0!=1
P(X = i) is the probability of observing i infested units in the sample, where i = 0, …, n.
The confidence level corresponds to: 1- P(X = i) A = number of infested units in the lot that could be detected if every unit in the lot was inspected or tested, given the efficacy of detection (level of detection × N × efficacy, truncated to an integer) i = number of infested units in the sample N = number of units in the lot (size of the lot) n = number of units in the sample (sample size)
In particular the approximation that can be used for the probability of finding no infested units is
P(X=0) = Formula 2
where u = (n-1)/2 (from Cochran, 1977).
Solving the equation to determine n is difficult arithmetically but can be done with approximation or through maximum likelihood estimation.
Tables 1 and 2 show sample sizes calculated for different lot sizes, levels of detection and confidence levels, when the acceptance number is 0.
−−
nN
inAN
iA
n
uNuAN
−−−
ISPM 31 Methodologies for sampling of consignments - Appendix 2
ISPM 31-16
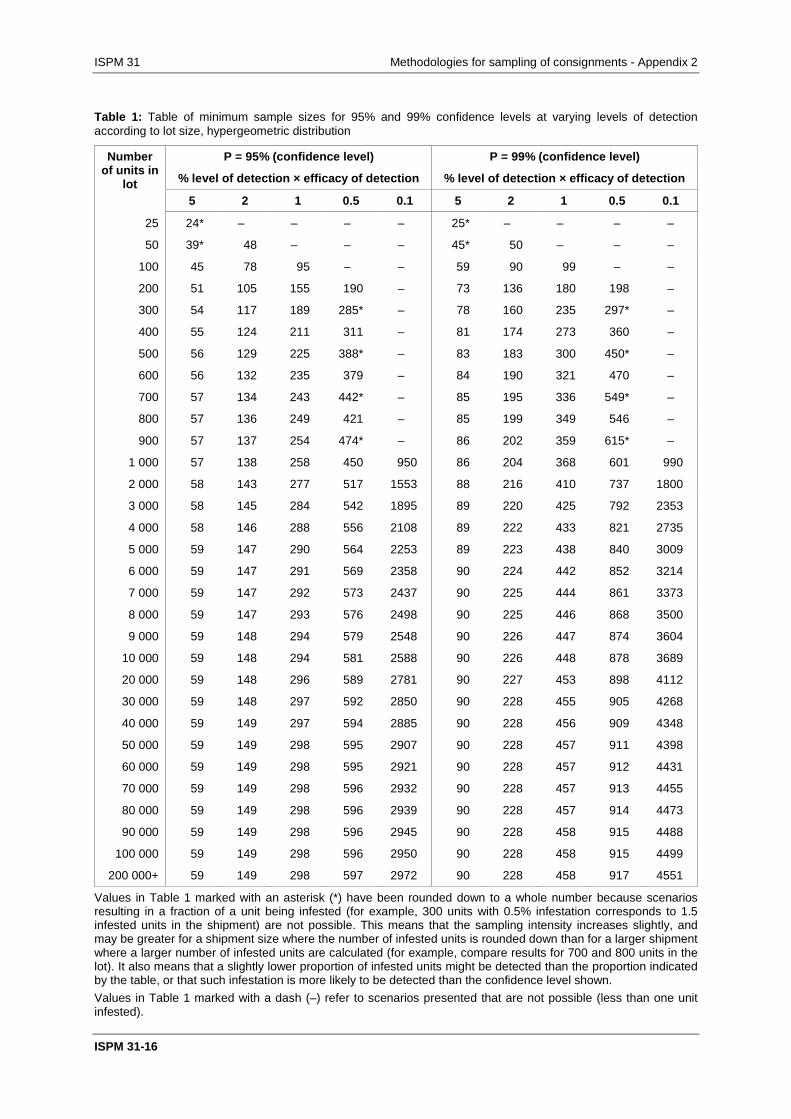
Table 1: Table of minimum sample sizes for 95% and 99% confidence levels at varying levels of detection according to lot size, hypergeometric distribution
Number of units in
lot
P = 95% (confidence level)
% level of detection × efficacy of detection
P = 99% (confidence level)
% level of detection × efficacy of detection
5 2 1 0.5 0.1 5 2 1 0.5 0.1
25 24* – – – – 25* – – – –
50 39* 48 – – – 45* 50 – – –
100 45 78 95 – – 59 90 99 – –
200 51 105 155 190 – 73 136 180 198 –
300 54 117 189 285* – 78 160 235 297* –
400 55 124 211 311 – 81 174 273 360 –
500 56 129 225 388* – 83 183 300 450* –
600 56 132 235 379 – 84 190 321 470 –
700 57 134 243 442* – 85 195 336 549* –
800 57 136 249 421 – 85 199 349 546 –
900 57 137 254 474* – 86 202 359 615* –
1 000 57 138 258 450 950 86 204 368 601 990
2 000 58 143 277 517 1553 88 216 410 737 1800
3 000 58 145 284 542 1895 89 220 425 792 2353
4 000 58 146 288 556 2108 89 222 433 821 2735
5 000 59 147 290 564 2253 89 223 438 840 3009
6 000 59 147 291 569 2358 90 224 442 852 3214
7 000 59 147 292 573 2437 90 225 444 861 3373
8 000 59 147 293 576 2498 90 225 446 868 3500
9 000 59 148 294 579 2548 90 226 447 874 3604
10 000 59 148 294 581 2588 90 226 448 878 3689
20 000 59 148 296 589 2781 90 227 453 898 4112
30 000 59 148 297 592 2850 90 228 455 905 4268
40 000 59 149 297 594 2885 90 228 456 909 4348
50 000 59 149 298 595 2907 90 228 457 911 4398
60 000 59 149 298 595 2921 90 228 457 912 4431
70 000 59 149 298 596 2932 90 228 457 913 4455
80 000 59 149 298 596 2939 90 228 457 914 4473
90 000 59 149 298 596 2945 90 228 458 915 4488
100 000 59 149 298 596 2950 90 228 458 915 4499
200 000+ 59 149 298 597 2972 90 228 458 917 4551
Values in Table 1 marked with an asterisk (*) have been rounded down to a whole number because scenarios resulting in a fraction of a unit being infested (for example, 300 units with 0.5% infestation corresponds to 1.5 infested units in the shipment) are not possible. This means that the sampling intensity increases slightly, and may be greater for a shipment size where the number of infested units is rounded down than for a larger shipment where a larger number of infested units are calculated (for example, compare results for 700 and 800 units in the lot). It also means that a slightly lower proportion of infested units might be detected than the proportion indicated by the table, or that such infestation is more likely to be detected than the confidence level shown. Values in Table 1 marked with a dash (–) refer to scenarios presented that are not possible (less than one unit infested).
Methodologies for sampling of consignments - Appendix 2 ISPM 31
ISPM 31-17
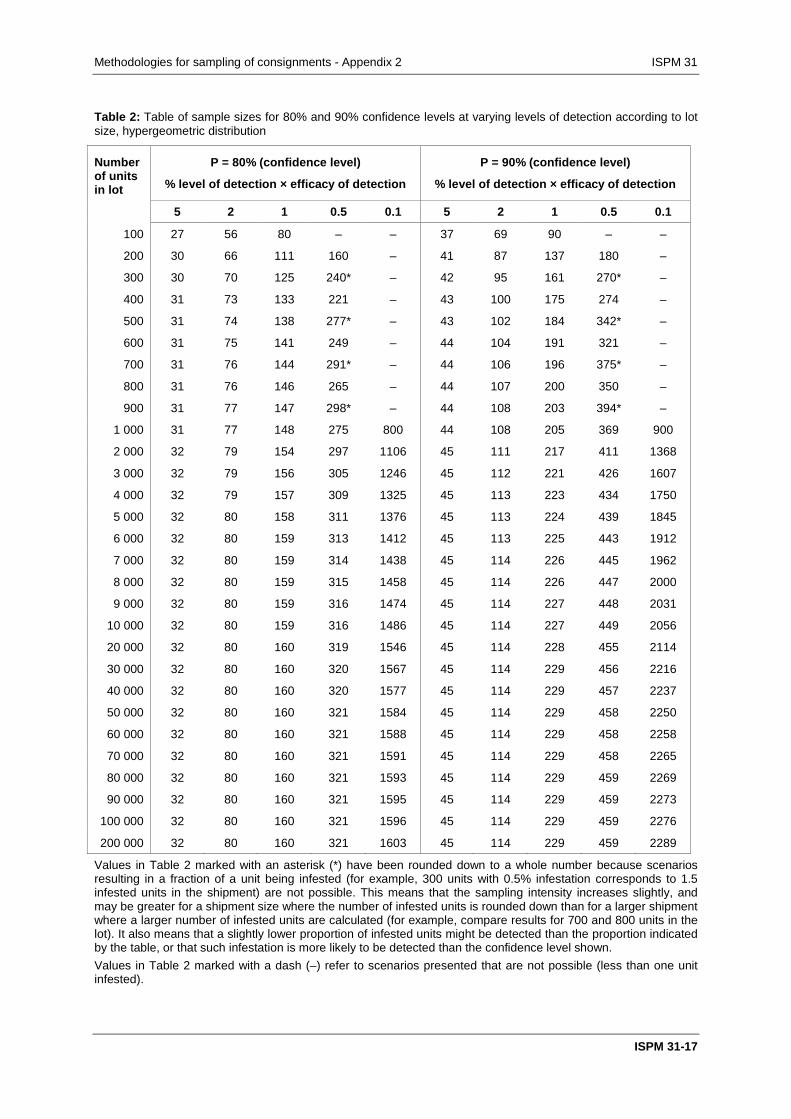
Table 2: Table of sample sizes for 80% and 90% confidence levels at varying levels of detection according to lot size, hypergeometric distribution
Number of units in lot
P = 80% (confidence level)
% level of detection × efficacy of detection
P = 90% (confidence level)
% level of detection × efficacy of detection
5 2 1 0.5 0.1 5 2 1 0.5 0.1
100 27 56 80 – – 37 69 90 – –
200 30 66 111 160 – 41 87 137 180 –
300 30 70 125 240* – 42 95 161 270* –
400 31 73 133 221 – 43 100 175 274 –
500 31 74 138 277* – 43 102 184 342* –
600 31 75 141 249 – 44 104 191 321 –
700 31 76 144 291* – 44 106 196 375* –
800 31 76 146 265 – 44 107 200 350 –
900 31 77 147 298* – 44 108 203 394* –
1 000 31 77 148 275 800 44 108 205 369 900
2 000 32 79 154 297 1106 45 111 217 411 1368
3 000 32 79 156 305 1246 45 112 221 426 1607
4 000 32 79 157 309 1325 45 113 223 434 1750
5 000 32 80 158 311 1376 45 113 224 439 1845
6 000 32 80 159 313 1412 45 113 225 443 1912
7 000 32 80 159 314 1438 45 114 226 445 1962
8 000 32 80 159 315 1458 45 114 226 447 2000
9 000 32 80 159 316 1474 45 114 227 448 2031
10 000 32 80 159 316 1486 45 114 227 449 2056
20 000 32 80 160 319 1546 45 114 228 455 2114
30 000 32 80 160 320 1567 45 114 229 456 2216
40 000 32 80 160 320 1577 45 114 229 457 2237
50 000 32 80 160 321 1584 45 114 229 458 2250
60 000 32 80 160 321 1588 45 114 229 458 2258
70 000 32 80 160 321 1591 45 114 229 458 2265
80 000 32 80 160 321 1593 45 114 229 459 2269
90 000 32 80 160 321 1595 45 114 229 459 2273
100 000 32 80 160 321 1596 45 114 229 459 2276
200 000 32 80 160 321 1603 45 114 229 459 2289
Values in Table 2 marked with an asterisk (*) have been rounded down to a whole number because scenarios resulting in a fraction of a unit being infested (for example, 300 units with 0.5% infestation corresponds to 1.5 infested units in the shipment) are not possible. This means that the sampling intensity increases slightly, and may be greater for a shipment size where the number of infested units is rounded down than for a larger shipment where a larger number of infested units are calculated (for example, compare results for 700 and 800 units in the lot). It also means that a slightly lower proportion of infested units might be detected than the proportion indicated by the table, or that such infestation is more likely to be detected than the confidence level shown. Values in Table 2 marked with a dash (–) refer to scenarios presented that are not possible (less than one unit infested).
ISPM 31 Methodologies for sampling of consignments - Appendix 3
ISPM 31-18
)1ln()]0(1ln[
pXPφ−>−
( )!i
pn pni φφ −e
This appendix is for reference purposes only and is not a prescriptive part of the standard.
APPENDIX 3: Sampling of large lots: binomial or Poisson based sampling
For large lots sufficiently mixed, the likelihood of finding an infested unit is approximated by simple binomial statistics. The sample size is less than 5% of the lot size. The probability of observing i infested units in a sample of n units is given by:
P(X=i) =
n
iφp i (1 − φp) n-i Formula 3
p is the average proportion of infested units (infestation level) in the lot and φ represents the percentage inspection efficacy divided by 100. P(X = i) is the probability of observing i infested units in the sample. The confidence level corresponds to: 1- P(X = i), i = 0, 1, 2, …, n.
For phytosanitary purposes, the probability of not observing a pest specimen or symptom in the sample is determined. The probability of not observing an infested unit in a sample of n units is given by
P(X=0) = (1 − φp)n Formula 4
The probability of observing at least one infested unit is then: P(X>0) = 1 − (1 − φp)n Formula 5
This equation can be rearranged to determine n n = Formula 6
The sample size n can be determined with this equation when the infestation level (p), efficacy (φ) and the confidence level (1- P (X > 0)) are determined by the NPPO.
The binomial distribution can be approximated with the Poisson distribution. As n increases and p decreases, the binomial distribution equation given above tends to the Poisson distribution equation given below,
P(X=i) = Formula 7
where e is the base-value of the natural logarithm.
The probability of finding no infested units simplifies to P(X=0) = e-nφp Formula 8
The probability of finding at least one infested unit (the confidence level) is calculated as P(X>0) = 1 − e-nφp Formula 9
Solving for n gives the following, which can be used to determine the sample size: n = − ln[1 − P(X>0)]/φp Formula 10
Tables 3 and 4 show sample sizes when the acceptance number is 0, calculated for different levels of detection, efficacy and confidence levels with the binomial and Poisson distributions, respectively. A comparison of the case for 100% efficacy with the sample sizes in Table 1 (see Appendix 2) shows that the binomial and Poisson give very similar results to the hypergeometric distribution when n is large and p is small.
Methodologies for sampling of consignments - Appendix 3 ISPM 31
ISPM 31-19
Table 3: Table of sample sizes for 95% and 99% confidence levels at varying levels of detection, according to efficacy values where lot size is large and sufficiently mixed, binomial distribution
Table 4: Table of sample sizes for 95% and 99% confidence levels at varying levels of detection, according to efficacy values where lot size is large and sufficiently mixed, Poisson distribution
ISPM 31 Methodologies for sampling of consignments - Appendix 4
ISPM 31-20
+
>−)1ln(
)0(1ln(θn
xP
This appendix is for reference purposes only and is not a prescriptive part of the standard.
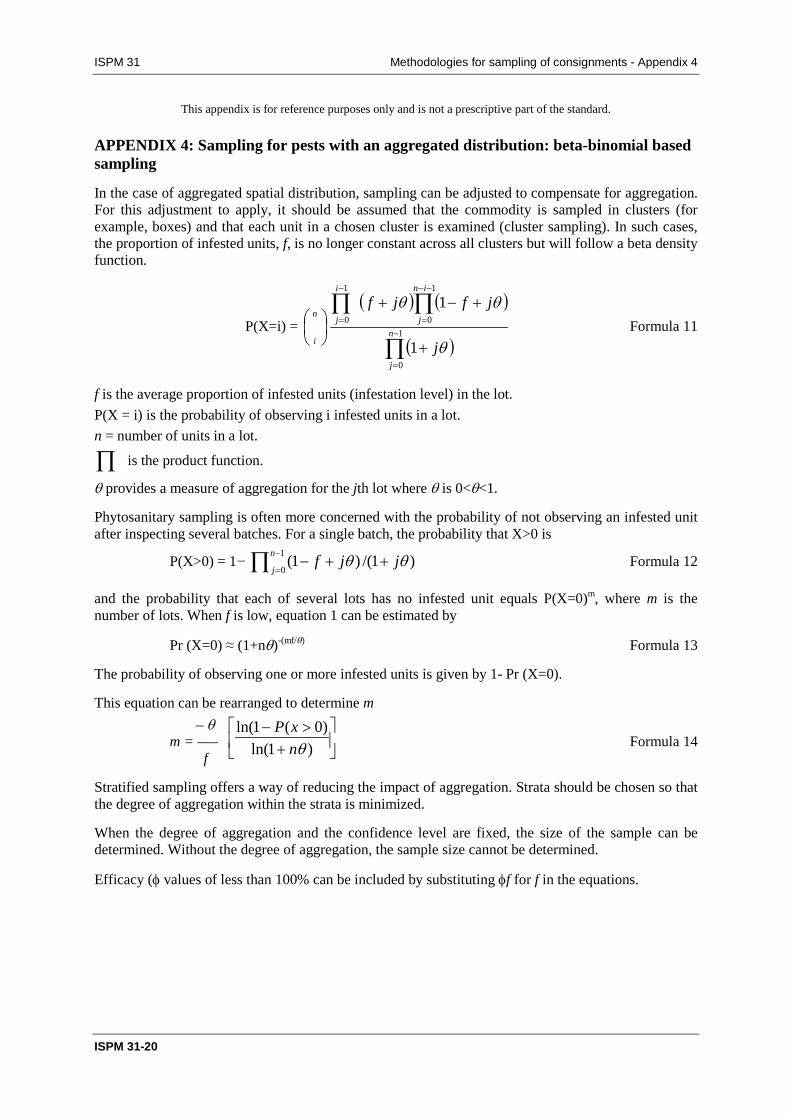
APPENDIX 4: Sampling for pests with an aggregated distribution: beta-binomial based sampling
In the case of aggregated spatial distribution, sampling can be adjusted to compensate for aggregation. For this adjustment to apply, it should be assumed that the commodity is sampled in clusters (for example, boxes) and that each unit in a chosen cluster is examined (cluster sampling). In such cases, the proportion of infested units, f, is no longer constant across all clusters but will follow a beta density function.
P(X=i) =
n
i
( ) ( )
( )∏
∏∏−
=
−−
=
−
=
+
+−+
1
0
1
0
1
0
1
1
n
j
in
j
i
j
j
jfjf
θ
θθ Formula 11
f is the average proportion of infested units (infestation level) in the lot. P(X = i) is the probability of observing i infested units in a lot. n = number of units in a lot.
∏ is the product function.
θ provides a measure of aggregation for the jth lot where θ is 0<θ<1.
Phytosanitary sampling is often more concerned with the probability of not observing an infested unit after inspecting several batches. For a single batch, the probability that X>0 is
P(X>0) = 1− ∏ −
=++−
1
0)1/()1(n
jjjf θθ Formula 12
and the probability that each of several lots has no infested unit equals P(X=0)m, where m is the number of lots. When f is low, equation 1 can be estimated by
Pr (X=0) ≈ (1+nθ)-(mf/θ) Formula 13
The probability of observing one or more infested units is given by 1- Pr (X=0).
This equation can be rearranged to determine m – θ
m = —– Formula 14 f
Stratified sampling offers a way of reducing the impact of aggregation. Strata should be chosen so that the degree of aggregation within the strata is minimized.
When the degree of aggregation and the confidence level are fixed, the size of the sample can be determined. Without the degree of aggregation, the sample size cannot be determined.
Efficacy (φ values of less than 100% can be included by substituting φf for f in the equations.
Methodologies for sampling of consignments - Appendix 5 ISPM 31
ISPM 31-21
This appendix is for reference purposes only and is not a prescriptive part of the standard.
APPENDIX 5: Comparison of hypergeometric and fixed proportion sampling results
Table 5: Confidence in the results of different sampling schemes for a 10% level of detection
Hypergeometric-based sampling (random sampling)
Fixed proportion sampling (2%)
Lot size sample size confidence level sample size confidence level
10 10 1 1 0.100
50 22 0.954 1 0.100
100 25 0.952 2 0.191
200 27 0.953 4 0.346
300 28 0.955 6 0.472
400 28 0.953 8 0.573
500 28 0.952 10 0.655
1 000 28 0.950 20 0.881
1 500 29 0.954 30 0.959
3 000 29 0.954 60 0.998
Table 6: Minimum levels that can be detected with 95% confidence using different sampling schemes