Policy Research Working Paper 8903 Climate Change Group Global Facility for Disaster Reduction and Recovery June 2019 Methodology and Findings for the Exposure Analysis of the Chinese Wastewater Sector to Flooding and Earthquakes Hazards Xi Hu Raghav Pant Conrad Zorn Weeho Lim Elco Koks Zhimin Mao Lifelines: The Resilient Infrastructure Opportunity Background Paper Public Disclosure Authorized Public Disclosure Authorized Public Disclosure Authorized Public Disclosure Authorized
Transcript
Policy Research Working Paper 8903
Climate Change GroupGlobal Facility for Disaster Reduction and Recovery June 2019
Methodology and Findings for the Exposure Analysis of the Chinese Wastewater Sector
to Flooding and Earthquakes Hazards Xi Hu
Raghav PantConrad ZornWeeho LimElco Koks
Zhimin Mao
Lifelines: The Resilient Infrastructure Opportunity
Background Paper
Pub
lic D
iscl
osur
e A
utho
rized
Pub
lic D
iscl
osur
e A
utho
rized
Pub
lic D
iscl
osur
e A
utho
rized
Pub
lic D
iscl
osur
e A
utho
rized
Produced by the Research Support Team
Abstract
The Policy Research Working Paper Series disseminates the findings of work in progress to encourage the exchange of ideas about development issues. An objective of the series is to get the findings out quickly, even if the presentations are less than fully polished. The papers carry the names of the authors and should be cited accordingly. The findings, interpretations, and conclusions expressed in this paper are entirely those of the authors. They do not necessarily represent the views of the International Bank for Reconstruction and Development/World Bank and its affiliated organizations, or those of the Executive Directors of the World Bank or the governments they represent.
Policy Research Working Paper 8903
This paper describes the methodology and findings for the extreme hazard exposure analysis of the Chinese wastewater sector to flooding and earthquakes hazards. This analysis is undertaken for changing flooding, under climate scenarios, and earthquake exposure of a spatially accurate wastewater treatment plants (WWTP) database for China, covering a total of 1,346 assets with additional attributes quantifying the treatment capacity and users dependent on each plant. For flooding, we apply and downscale a global river routing (CaMa-Flood) model that quantifies the change degree of flood exposures from the present time-period (1980–2005) to the near future time-period (2016–2035) to a far future time period (2036–2055). We find evidence that most cli-mate models project increasing number of WWTP assets face climate-induced flood hazards in both the near and far future, potentially affecting as many as 208 million
users by 2050. However, there are spatial and temporal variations from these projections which means that plan-ning for resilient wastewater infrastructure requires more detailed understanding of the vulnerability attributes of WWTPs including their exact location, the number of users they serve as well as their flood protection standards. For earthquakes, we examine the exposure of WWTPs to earth-quake hazards through both seismic shaking and induced liquefaction. Overall, we demonstrate the significant risk that earthquakes can have on the WWTP process—espe-cially on centralized systems. By considering liquefaction susceptibility in combination with shaking, we expose a number of WWTPs that face an increased level of exposure to damages following earthquakes compared to looking at shaking in isolation.
This paper is a product of the Global Facility for Disaster Reduction and Recovery, Climate Change Group. It is part of a larger effort by the World Bank to provide open access to its research and make a contribution to development policy discussions around the world. Policy Research Working Papers are also posted on the Web at http://www.worldbank.org/prwp. The authors may be contacted at [email protected].
Methodology and Findings for the Exposure Analysis of the Chinese Wastewater Sector to
1. Labor and Worklife Program, Harvard Law School, Harvard University, Cambridge, MA, USA 2. Environmental Change Institute, University of Oxford, Oxford, UK 3. National Bureau of Economic Research, Cambridge, MA, USA 4. Chinese Academy of Sciences, Beijing, China 5. Institute for Environmental Studies (IVM), Vrije Universiteit Amsterdam, The Netherlands 6. The World Bank, Washington DC, USA
north), Heilongjiang (east), Tibet (central) experience regional specific flood hazard.
Although the WWTPs here serve less users in general, if existing ones are not designed to
an appropriate level, they will face increase flooding hazards.
In the far future, flooding hazard escalate in large parts of Tibet, Xinjiang, and Inner
Mongolia. The WWTPs located in these regions, not previously exposed to flooding
hazards at return period 50, now face increasing risks. For RCP8.5, concentrations of
increasing flooding probability are similar to RCP4.5 during the period 2016‐2035, along
the Yangtze River. Notable differences are in regions such as northern Heilongjiang and
northern Inner Mongolia, which suffer increasing flood hazard whereas they do not in
RCP4.5. By 2055, hazards become widespread with very few areas left intact.
Earthquake exposure results
For earthquakes, we examine the exposure of WWTPs to earthquake hazards through both
seismic shaking and induced liquefaction. Overall, we demonstrate the significant risk that
earthquakes can have on the WWTP process – especially on centralized systems. By considering
liquefaction susceptibility in combination with shaking, we expose a number of WWTPs that face an
increased level of risk to damages following earthquakes compared to looking at shaking in isolation.
We find that, for 2475‐year return period PGA, 231 WWTPs are exposed to our definition
of medium shaking (0.18‐0.34g), however, the majority of these (>53%) could in fact be
at far greater risk to ground deformation induced damages given their High/Very High
liquefaction susceptibility groupings. Ultimately, this means that over half of these
WWTPs could be in fact far more vulnerable to seismic hazards than initially anticipated
if one was just to consider PGA as a sole indicator of risk. The potential number of users
affected amount to 64 million, 33 million of whom face High/Very High liquefaction
susceptibility.
Spatially, western regions and high population Beijing surrounds show the highest seismic
shaking risks. As actual damage to WWTPs depend greatly on the design standards of the
plants, the assigned VL areas are not necessarily safe, particularly when considering
potential ground deformation. Such higher liquefaction susceptibilities are observed in
the lower lying central east coast regions and far west, particularly surrounding the sandy
Tamrin Basin area where there are comparatively few treatment plants given lower
population densities.
4
1. Introduction
Wastewater infrastructure has seen phenomenal growth across China in recent decades
(Zhang et al., 2016; Mumbengegwi, Li and Muhoza, 2018). From 1991 to 2003, treatment capacities
have increased from 400 to 3800 ML (megalitres) and treatment efficiencies from 14.9% to 89.3%
(Zhang et al., 2016). Much of this infrastructure was built for the purposes of sanitation,
environmental health, and to serve the need to reuse water due to pressures of growing water
demand from rapid urbanization.
Typically, wastewater infrastructure systems span city‐scales with large collecting catchments
conveying water to centralized wastewater treatment plants (WWTPs), and finally a disposal to the
environment (Libralato, Ghirardini and Avezzù, 2012). While centralized treatment plants tend to be
more cost effective, they are highly reliant on single assets (i.e. the plants themselves) which means
that there is great potential for widespread services losses or significant reductions treatment capacity
should they become partly or completely inoperable.
Natural disasters have been known to cause problems in wastewater service provision.
Significant rainfall for example, may see increased rates of inflow and infiltration often leading to
system overflows of raw wastewater to the receiving environments whether it is land or a receiving
stormwater/river system. Similarly, WWTPs are often at greater direct risk to fluvial and coastal
flooding given the tendency to locate the assets in lower lying areas or near rivers and coasts to take
advantage of gravity conveyance and for proximity to a disposal water body. On the other hand,
earthquakes and related ground deformation may cause disruptions to the system through pipe
breakages, mechanical equipment failures, and structural failures of tanks and related storage
equipment.
In recent decades, no country other than China has experienced more frequent major
damaging natural hazard events, with only the exception of the USA suffering higher economic losses
(CRED and UNISDR, 2018). The majority of these expected annual damages in China can be attributed
to flooding and earthquakes (CRED and EM‐DAT, 2019). Some recent globally significant flooding and
earthquake events include the 2016 Yangzte and Huai River Flooding and the 2008 Sichuan Earthquake,
both of which resulted in widespread losses of life and property, and infrastructure damage. With
climate change, the frequency and severity of climate related flooding hazards are expected to rise,
thus posing an ever increasing threat to China’s wastewater infrastructure networks – in particular
WWTPs given their proximity to water bodies for treated effluent discharge.
In contrast, while the risk of earthquakes is not necessarily increasing (Shearer and Stark, 2012)
compared to climatic hazards, the potential damages from shaking, ground deformation, and
secondary hazards are particularly relevant for China given its vast size, proximity to fault lines, and
large river systems. Secondary hazards from earthquakes are also of concern, such as the increased
flood risk arising from landslide dams in upstream catchments, ground subsidence in coastal areas,
and where liquefaction, lateral spreading, and sedimentation leads to bed rises and narrowing of river
channels and flood plain.
5
The need to protect vulnerable assets against natural disasters is apparent and one of the first
steps towards achieving this is the understanding of how vulnerable assets are exposed to hazards. In
this report, we make use of an accurate dataset to identify the number and locations of Chinese
wastewater treatment plants exposed to changing probabilities flooding in the context of climate
change, as well as those plants that are exposed to significant earthquakes. We limit wastewater
network impacts to treatment plant facilities, ignoring any conveyance infrastructure, overflows, and
pumping assets located upstream. Further to this analysis, we calculate the number of users each
WWTP asset serves, according to population and usage data. Only direct outage, i.e. those caused
directly by the hazard are considered. Outages caused by dependent infrastructures, such as to
electricity networks supplying the WWTPs are not considered herein.
2. Methodology and Data
To examine how China’s WWTPs are exposed to flooding and earthquakes, we intersect their spatial
locations with hazard and susceptibility maps. We present detailed methodology below.
2.1. Wastewater Treatment Plants and Users
We firstly assemble a data set for wastewater treatment works (2,743 assets) from the
Chinese Ministry of the Environment (Ministry of the Environment, 2013). The dataset contains full
name of the treatment plant, daily capacity, actual amount of wastewater treated and city information.
As we do not know the exact location for each plant, we resort to a thorough process of searching
plant addresses online and geocoding these in Google Earth and/or Baidu to our database. We then
validate this dataset with Google Satellite Images to verify their exact locations. Unfortunately, the
location information of several of these treatment plants is either missing or inaccurate, with
sometimes the stated plants locations being kilometers away from their actual locations as seen by
satellite imagery. As such, we were able to locate 1,346 WWTPs, out of the orginial number 2,743. It
is noted that the assets are represented as points in the centroid of the WWTPs, as opposed to the
locations of control rooms or elsewhere. In addition, we only focus on complete facilities rather than
individual assets within the plants and do not consider exposure differences in treatment stages within
a plant nor do we taken into account of the type/quality of outlets which may affect the extent to
which WWPTs are impacted post‐disasters. Further, WWTPs not in current operation are not
considered.
Using the known WWTPs in the supplied dataset, we further estimate the population
dependent on the wth plant, Cw, as:
𝐶 𝑃 ∗ , (1)
where 𝑉 , is the daily volume treated in 10,000 m3 for waste treatment plant w in county b; Vb is
the total waste water treated for county b; and 𝑃 is the population of county b. In some cases, we
do not have population data for counties therefore our user sample of WWTPs is reduced to 891. Vb
is calculated by equation (2) as shown below, where we aggregate all the waste water treated in any
county b:
6
𝑉 ∑ 𝑉 , (2)
2.2. Flood Hazards and Impact on WWTPs
Flood hazards and their impact on China’s WWTP are done in the context of climate change.
Firstly, we apply and downscale the CaMa‐Flood model for 21st century China for RCP 4.5 and RCP8.5
at return periods greater than 30, 50 and 100 respectively. Based on these results, we then compute
how the probability of flooding may change for specified geographical locations in China and
superimpose the wastewater assets we collected onto the changing flood hazard maps. This way we
are able to pinpoint the exact infrastructures that face increasing, decreasing or non‐changing flooding
probabilities due to climate change.
2.2.1. Changing Flood Hazards
We drive a global river routing model – Catchment‐Based Macro‐scale Floodplain (CaMa‐
Flood) – using the daily runoff of the Atmospheric and Oceanic General Circulation Models (AOGCMs)
at a spatial resolution of 1° x 1°1 (Hu et al., 2017). The CaMa‐Flood model routes the runoff input
simulated by a land surface model into the oceans or lakes along a prescribed river network (Yamazaki
et al., 2011). It calculates river channel storage, floodplain storage, river discharge, river water depth,
and inundated area for each grid cell at a spatial resolution of 0.25° x 0.25°. A recently developed
Global Width Database for Large Rivers (GWD‐LR) is also incorporated into it (Yamazaki et al., 2011).
For the AOGCMs, we adopt a historic (1970–2005) and future period (2006–2100 2 ) at
representative concentration pathways (RCP) 4.5 and 8.5 (Stocker et al., 2013). RCPs 4.5 and 8.5 are
part of a new set of scenarios used in the new climate model simulations carried out under the
framework of the Coupled Model Inter‐comparison Project Phase of the World Climate Research
Programme. According to IPCC AR5, the RCPs are consistent with a wide range of possible changes in
future anthropogenic (i.e. human) greenhouse gas (GHG) emissions. RCP 4.5 assumes that global
annual GHG emissions (measured in CO2‐equivalents) peak around mid‐century and then stabilise
around 2100 whereas RCP 8.5 emissions continue to rise throughout the 21st century (Moss et
al.,2010 in IPCC 2014). From the daily river‐routing outputs, we extract the annual maxima value of
the river water depth (spatial resolutions: 0.25° x 0.25°) for each AOGCM (1970‐2100 (131 years) or
1970‐2099 (130 years).
For each grid‐cell within each AOGCM, we extract the annual maxima river water depth of the
period 1970–1999 to quantify the Gumbel distribution parameters, which represent extreme value
statistics for the late 20th century. With these parameters, we estimate the return period of the annual
maxima for 1970–2100 and 1970–2099. Based on the Gumbel distribution parameters of the baseline
period (Hu et al., 2016, Section 3.4.1), we calculate the 'equivalent' river water depth of the baseline
for each AOGCM as a way of reducing bias.
1 The full list of AOGCMs is available in the supplementary materials section of Hirabayashi et al. (2013), in Table S1. 2 For most of the AOGCMs, the period is 2006‐2100. For BCC‐CSM1.1, we have 2006‐2099.
7
Using high resolution DEM maps, we downscale and prepare the flood inundation map (i.e.
flood fraction 0 to 1.0) for each AOGCM (spatial resolutions: 2.5 min x 2.5 min) (Hu et al., 2015). From
these outcomes, we extract the flood extent for return periods greater than 1 in 100 years, 1 in 50
years and 1 in 30 years and produce the mean flood inundation map for 2016–2035 and 2036–2055
at RCP4.5 and RCP8.5 respectively. We selected these return periods because the flood protection
standard for Chinese infrastructures typically ranges between 1 in 10 years to 1 in 100 years, as
required by the law.
With the above outcomes, we evaluate the extent of changing flooding probability, calculating
the difference between two selected subsequent periods. Here we subtract the inundation value for
each grid (spatial resolutions: 2.5 min x 2.5 min) and estimate the total flooded area between period
1 as defined by the difference between 1986–2005 and 2016–2035, and period 2 as defined by the
difference between 1986–2005 and 2036–2055, for both pathways RCP4.5 and RCP8.5. This difference
indicates how specified grids in China would face different levels of changing flood probabilities –
increasing, decreasing or a continuation of the status quo.
2.2.2. Estimating impact on WWTP
To demonstrate how Chinese wastewater treatment plants may be exposed to the changing
probability of flooding, we identify those wastewater plants that face increasing, decreasing or non‐
changing flooding hazard by intersecting them with inundation cells, as estimated above. We
subsequently calculate the net change, as defined by the difference between the number of assets
facing increasing hazard and those that face decreasing hazard. We also calculate the number of users
each wastewater plant serves, as described in Section 2.1, as well as the those that face
increasing/decreasing flood hazards. Below we explain the detailed process of estimating the flood
exposure of China’s WWTPs.
To understand the exposure to flooding we look at the spatial intersection of particular assets
with the flood grid cells. The flood grid cells are denoted by 𝐻 ℎ , … , ℎ is space. For each
particular grid cell, ℎ , we first estimate the change in flood fraction ∆𝑓 between the representative
time period (e.g. 2016‐2035) and the baseline (1986‐2005) for the particular return period and RCP
scenarios.
To estimate the numbers of WWTPs flooding we intersect the wastewater assets with the
flood cells. We assemble the results based on whether the change is flood fractions are positive (for
increasing flood exposures) or negative (for decreasing flood exposures). Hence, two types of results
sets are created:(1) 𝑃 𝑎 : 𝑎 ∩ ℎ and ∆𝑓 0 for all assets with positives (increases) in flood
exposures; (2) 𝑁 𝑎 : 𝑎 ∩ ℎ and ∆𝑓 0 . Subsequently the number of assets (and their users) at
increasing exposure to flood are estimated as |𝑃|, and those (and their users) at decreasing exposure to flooding are estimated as |𝑁|, while the assets (and their users) with no‐changes in flood exposures are estimated as |𝐼| |𝑃| |𝑁| where |𝐼| is the total number of WWTPs.
8
2.3. Earthquake Hazards and Impact on WWTPs
Direct earthquake impacts on WWTPs are largely due to ground shaking and ground failures,
with individual components or stages of the wastewater treatment process responding in different
ways. For example, non‐structural elements, such as scrapers, aerators, and mechanical equipment
are largely be affected by excessive shaking. Whereas, ground deformation (in the form of fault
rupture, landslides, and liquefaction causing settlement or lateral spreading), lead to breakages, lifting,
and deformations of structural elements, such as tanks, pipes, or treatment pond bunds. The actual
shaking properties required to initiate such processes vary significantly spatially – even at very local
scales. This ensures predicting damage due to both shaking and ground deformation on a wider WWTP
facilities remains a challenge.
Given the myriad of data that is required to carry out a detailed analysis at each WWTP site,
we instead adopt two readily available measures to provide a proxy for estimating asset damage.
These are: Peak Ground Acceleration (PGA) and Liquefaction Susceptibility. PGA is an important
ground motion parameter used in earthquake engineering applications and design as structural
damage is often closely correlated. Liquefaction susceptibility is a measure of how susceptible local
ground conditions would be to liquefy given sufficient ground shaking is experienced. Combined these
parameters can give a proxy for a combined likelihood of a WWTP facility experiencing damage in an
earthquake via the two predominant causes: shaking and ground deformation.
As with the flooding exposure analysis above, PGA and Liquefaction Susceptibility parameters
are assigned to each WWTP through a simple spatial intersection. These datasets are described in the
following section.
2.3.1. Hazard Datasets
PGA hazard maps are for return periods of 250‐, 475‐, 950‐, 1500‐, and 2475‐years (UNISDR,
2015). As these were created at the global scale, we note that they may underestimate the hazard in
local areas for fault lines not captured in historical catalogues. As a result, rather than relying on
absolute values of horizontal acceleration, we instead group PGA into five discrete categories: Very
High VH (>0.65g), High H (0.34g ‐ 0.65g), Medium M (0.18g ‐ 0.34g), Low L (0.092g – 0.18g), and Very
Low VL (<0.092g). It should be noted that these labels are qualitative, and the actual impacts do not
necessarily correlate with the description given the great variability in local conditions and design
standards.
Similar categories are assumed for liquefaction susceptibility: VH, H, M, L, VL. These are based
on a readily available dataset created for use at the global scale (Zorn and Koks, 2019) using a
calibrated geospatial prediction model (Zhu, Baise and Thompson, 2017). This approach defines
liquefaction susceptibility based on a range of parameters such as: distance to rivers, depth to
groundwater, annual precipitation, distance to coast, and 30‐m averaged shear wave velocity (Vs30).
As with PGA, site specifics such as soil drainage, the use of infill, and Vs30 (amongst others) are
overlooked in the method. Regardless, this method has shown promising predictive capacity and is
9
adopted in a number of national and global applications (Lin et al., 2018; Koks et al., 2019) (Lin et al.
2018, Koks et al. 2019).
3. Results
3.1. Flood Exposure
We draw two main conclusions from this analysis. First, there will be more assets and users
that face increasing flood hazards in both the near future by 2035 and far future by 2055 (Figures 1‐
4). However, this number varies depending on the individual model and return periods examined. For
instance, the highest from Model BCC‐CSM1‐1 projects the number of assets exposed to net increase
flooding hazards is 472 and a potential 17.5 million users could be affected for RCP 4.5 at return period
30 by 2035. The lowest for the same set of assumptions projects 29 and a potential of 7.8 million
affected users. In particular, we find that the number of assets and their users facing net increasing
flooding hazards are almost always higher for a lower return period than a higher return period,
implying that the focus on extreme events is often overlooked and we should be paying more
attention to flood risks at lower magnitudes.
10
Figure 1. WWTP (top) and user exposure (bottom) to net change (positive, zero or negative) of flood hazards for all models at return periods greater than 1
in 30, 1 in 50 and 1 in 100 years for RCP 4.5. Time period: (1986–2005) to (2016–2035).
11
Figure 2. WWTP (top) and user exposure (bottom) to net change (positive, zero or negative) of flood hazards for all models at return periods greater than 1
in 30, 1 in 50 and 1 in 100 years for RCP 8.5. Time period: (1986–2005) to (2016–2035).
12
Figure 3. WWTP and user exposure to net change (positive, zero or negative) of flood hazards for all models at return periods greater than 1 in 30, 1 in 50
and 1 in 100 years for RCP 4.5. Time period: (1986–2005) to (2036–2055).
13
Figure 4. WWTP and user exposure to net change (positive, zero or negative) of flood hazards for all models at return periods greater than 1 in 30, 1 in 50
and 1 in 100 years for RCP8.5. Time period: (1986–2005) to (2036–2055)
14
Second, the spatial variation is extremely important for planning climate resilient
infrastructure as exposure of infrastructures to natural hazards is highly location‐sensitive. To
demonstrate this, we select WWTPs and superimpose changing flooding hazard maps for return
period > 50, varying RCP and time period for model MPI‐ESM‐LR (Figure 5). This model represents
the medium range of all models, which is a reasonable scenario of flooding extent in the future
periods concerned.
We observe that by 2035, flood hazards for RCP 4.5 are concentrated along the Yangtze
River (Figure 5a), in southern Hubei, northern Hunan, central Anhui, northern Jiangxi and Shanghai.
Provinces such as Guangxi, Guizhou and Ningxia face wide‐spread increasing flood hazard whereas
Shaanxi (north), Shandong (northwest), Qinghai (central‐north), Heilongjiang (east), Tibet (central)
experience regional specific flood hazard. The WWTPs located in these areas, if not designed to an
appropriate level, will face increase flooding hazards. By 2055, flooding hazard escalate in large
parts of Tibet and Xinjiang, Inner Mongolia. The WWTPs located in these regions, not previously
exposed to flooding hazards at return period 50, now face increasing risks. For RCP8.5,
concentrations of increasing flooding probability are similar to RCP4.5 during the period 2016‐2035,
along the Yangtze River. Notable differences are in regions such as northern Heilongjiang, Jilin and
northern Inner Mongolia, which suffer increasing flood hazard whereas they do not in RCP4.5. By
2055, hazards become widespread with very few areas left intact.
Decreasing flood hazard, on the other hand, is less in extent in general. For RCP 4.5, most
are concentrated in Hebei, eastern Sichuan and central Jiangsu, eastern Inner Mongolia. By 2055,
the overall number of areas facing decreasing probability of flooding declines. For RCP 8.5, it is
similar to RCP 4.5.
Not only understanding the location of WWTP is important, it is also crucial to know what
the protection standards are. In some cases, areas along the Yangtze River no longer face increasing
hazard (compare Figure 5a and 5c). However, this does not mean that the WWTPs are safe. If they
are designed at a return period lower than 50, for example, at 30, it could still be facing increasing
flood hazards.
15
Figure 5. Locations of WWTP exposed to changing (increasing, decreasing, non‐changing) flood
hazard for model MPI‐ESM‐LR. Squares are power plants facing decreasing flood hazard; triangles are power
plants facing increasing flood hazards; circles are power plants facing non‐changing flood hazards. All figures
are for return period greater than 50, but we vary RCP (4.5 in Figures 5a and 5c; 8.5 in Figures 5b and 5d).
Time period (1986–2005) to (2016–2035) is shown in Figures 5a and 5b whereas time period (1986–2005) to
(2036–2055) is shown in Figures 5c and 5d.
Note: The boundaries, colors, denominations and any other information shown on this map do not
imply, on the part of the World Bank Group, any judgment on the legal status of any territory, or any
endorsement or acceptance of such boundaries.
a b
c d
16
3.2. Earthquake Exposure
The spatial locations of WWTPs with respect to two return period PGA (250‐ and 2475‐year)
surfaces and liquefaction susceptibility are presented in Figure 6 below.
Figure 6: WWTP facility locations with respect to the greatest (250‐year) and smallest (2475‐year)
annual exceedance probabilities and liquefaction susceptibility.
Note: The boundaries, colors, denominations and any other information shown on this map do not
imply, on the part of the World Bank Group, any judgment on the legal status of any territory, or any
endorsement or acceptance of such boundaries.
PGA 250‐year
PGA 2475‐year
Liquefaction Susceptibility
17
In general, the western regions of mainland China and Beijing surrounds show the highest
seismic shaking risks. As actual damage to WWTPs dependent greatly on the design standards of
the plants, we note that the assigned VL areas are not necessarily risk free, particularly when
considering potential ground deformation and other secondary hazards. Such higher liquefaction
susceptibilities are observed in the lower lying central east coast regions and far west, particularly
surrounding the sandy Tamrin Basin area where there are comparatively few treatment plants
given lower population densities.
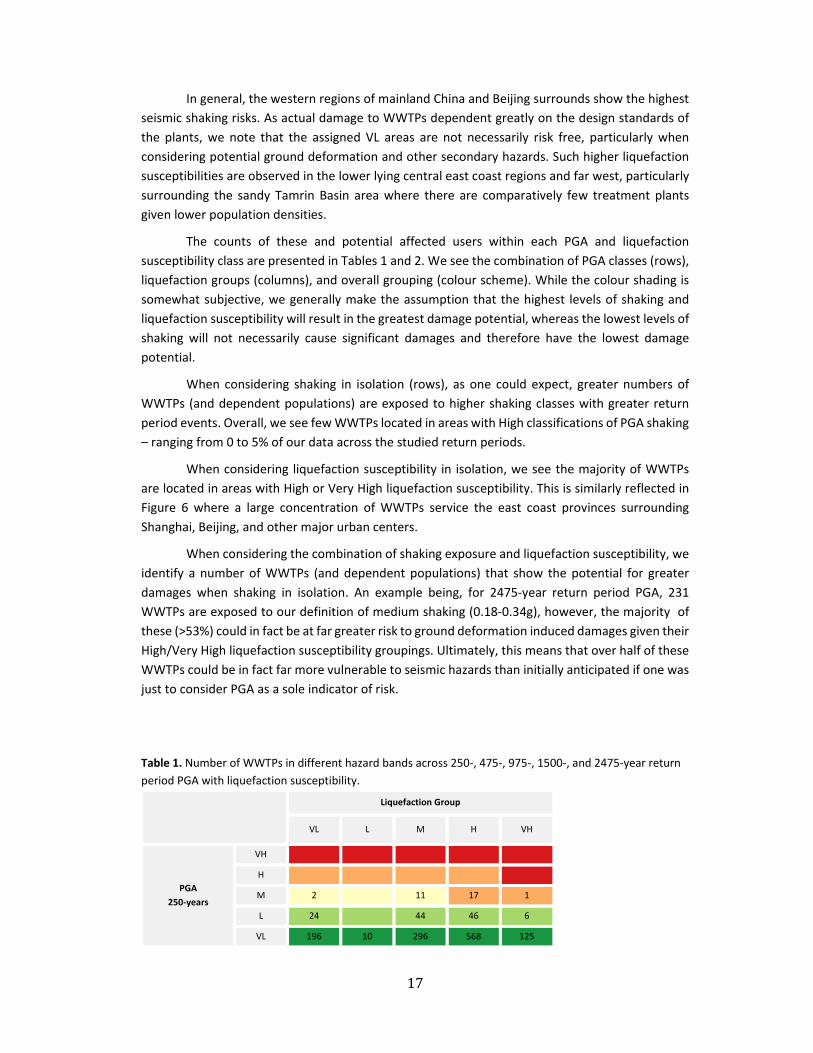
The counts of these and potential affected users within each PGA and liquefaction
susceptibility class are presented in Tables 1 and 2. We see the combination of PGA classes (rows),
liquefaction groups (columns), and overall grouping (colour scheme). While the colour shading is
somewhat subjective, we generally make the assumption that the highest levels of shaking and
liquefaction susceptibility will result in the greatest damage potential, whereas the lowest levels of
shaking will not necessarily cause significant damages and therefore have the lowest damage
potential.
When considering shaking in isolation (rows), as one could expect, greater numbers of
WWTPs (and dependent populations) are exposed to higher shaking classes with greater return
period events. Overall, we see few WWTPs located in areas with High classifications of PGA shaking
– ranging from 0 to 5% of our data across the studied return periods.
When considering liquefaction susceptibility in isolation, we see the majority of WWTPs
are located in areas with High or Very High liquefaction susceptibility. This is similarly reflected in
Figure 6 where a large concentration of WWTPs service the east coast provinces surrounding
Shanghai, Beijing, and other major urban centers.
When considering the combination of shaking exposure and liquefaction susceptibility, we
identify a number of WWTPs (and dependent populations) that show the potential for greater
damages when shaking in isolation. An example being, for 2475‐year return period PGA, 231
WWTPs are exposed to our definition of medium shaking (0.18‐0.34g), however, the majority of
these (>53%) could in fact be at far greater risk to ground deformation induced damages given their
High/Very High liquefaction susceptibility groupings. Ultimately, this means that over half of these
WWTPs could be in fact far more vulnerable to seismic hazards than initially anticipated if one was
just to consider PGA as a sole indicator of risk.
Table 1. Number of WWTPs in different hazard bands across 250‐, 475‐, 975‐, 1500‐, and 2475‐year return
period PGA with liquefaction susceptibility.
Liquefaction Group
VL L M H VH
PGA
250‐years
VH
H
M 2 11 17 1
L 24 44 46 6
VL 196 10 296 568 125
18
PGA
475‐years
VH
H 1
M 14 25 30 3
L 38 56 82 10
VL 170 10 269 519 119
PGA
975‐years
VH
H 9 15 1
M 21 45 39 5
L 76 92 205 21
VL 125 10 205 372 105
PGA
1500‐years
VH
H 3 16 18 1
M 34 50 61 11
L 80 2 117 283 22
VL 105 8 168 269 98
PGA
2475‐years
VH
H 13 26 27 2
M 43 65 111 12
L 78 3 128 298 37
VL 88 7 132 195 81
Table 2. Population (millions) with reduced wastewater system functionality in different hazard bands
across 250‐, 475‐, 975‐, 1500‐, and 2475‐year return period PGA with liquefaction susceptibility. The specific
return periods are given in each table. Columns add to ~460 million with values rounded for readability.
Liquefaction Group
VL L M H VH
PGA
250‐years
VH
H
M 0.7 3 6 0.6
L 7 13 12 2
VL 60 2 109 196 49
PGA
475‐years
VH
H 0.5
M 5 7 9 0.6
L 10 17 22 3
VL 53 2 101 182 48
PGA
975‐years
VH
H 3 6 0.6
M 6 13 10 2
L 23 30 61 5
VL 38 2 79 136 44
19
PGA
1500‐years
VH
H 1.3 5 6 .6
M 14 17 2 1
L 25 40 85 6
VL 32 2 65 105 41
PGA
2475‐years
VH
H 5 8 9 0.6
M 11 19 31 3
L 25 .7 48 97 16
VL 27 2 50 76 31
These combined PGA/liquefaction susceptibility classifications as indicated by their colour
shading are collated in Figure 7 (excluding dark green). Further example spatial distributions for
250‐ and 2475‐year return periods are shown in Figure 8.
Figure 7. Combined PGA/liquefaction susceptiibility classifications for those WWTPs using the same color
scheme as presented in Table 3.
20
Figure 8. Combined PGA and liquefaction susceptibility classes for the color scheme given in Table 3 and
Figure 7 across 250‐ and 2475‐year return period PGA events.
Note: The boundaries, colors, denominations and any other information shown on this map do not
imply, on the part of the World Bank Group, any judgment on the legal status of any territory, or any
endorsement or acceptance of such boundaries.
Overall, we see the combined PGA/liquefaction susceptibility groupings vary significantly
across China. Understandably, areas of high seismicity are generally higher rated given the
expected direct correlation with shaking and both structural and non‐structural damages.
Combined 250‐year PGA and Liquefaction Susceptibility
Combined 2475‐year PGA and Liquefaction Susceptibility
21
4. Next steps
There are a number of natural extensions to this work including: (i) defining explicit
fragilities of different WWTP components to better define a risk of damage to both shaking and
ground deformation, as well as to flood depths, (ii) a further completed wastewater network in
both WWTP assets and representations of outlet structures and possible conveyance infrastructure
densities in upstream catchments, (iii) a more complete understanding of the spatial variability in
earthquake/flood design standards to clarify the most appropriate return periods to use. For
earthquake specifically, we need to adopt more localized PGA and VS30 models derived specifically
for China, and PGV (peak ground velocity) maps for specific events to enable probabilities of
liquefaction to be presented as opposed to susceptibility.
References
CRED and EM‐DAT (2019) The OFDA/CRED ‐ International Disaster Database. Available at: www.emdat.be
(Accessed: 11 March 2019).
CRED and UNISDR (2018) Economic Losses, Poverty & Disasters 1998‐2017. Available at: