Please visit Thomson Reuters Customer Zone , the single online entry point for Thomson Reuters support and service functions, including on-line support capabilities via the “Contact Us” link located at the top left of the page. If you choose to contact Thomson Reuters by phone, please click here for global product contact information. METHODOLOGY FOR ESTIMATES A GUIDE TO UNDERSTANDING THOMSON REUTERS METHODOLOGIES, TERMS AND POLICIES FOR THE FIRST CALL AND I/B/E/S ESTIMATES DATABASES OCTOBER 2009
Transcript
Please visit Thomson Reuters Customer Zone, the single online entry point for Thomson Reuters support and service functions, including on-line support capabilities via the “Contact Us” link located at the top left of the page. If you choose to contact Thomson Reuters by phone, please click here for global product contact information.
METHODOLOGY FOR ESTIMATES A GUIDE TO UNDERSTANDING THOMSON REUTERS METHODOLOGIES, TERMS AND POLICIES FOR THE FIRST CALL AND I/B/E/S ESTIMATES DATABASES OCTOBER 2009
Copyright 10/2009 Thomson Reuters. All rights reserved.
NOTICE This document contains confidential and proprietary information of Thomson Reuters and may be used only by a recipient designated by and for purposes specified by Thomson Reuters. Reproduction of, dissemination of, modifications to, or creation of derivative works from this document, by any means and in any form or manner, is expressly prohibited, except with the prior written permission of Thomson Reuters. Permitted copies of this document must retain all proprietary notices contained in the original. The information in this document is subject to change without prior notice. Always confirm with Thomson Reuters that you are using the most current version of this document. Thomson Reuters is free to modify any of its products and services, in any manner and at any time, notwithstanding the information contained in this document. Certain information, including images, graphics, numerical or textual data pertaining to assets or securities may be included in this document to illustrate different types of products and services of Thomson Reuters. Such information may be fictitious or incomplete and should not be relied upon or considered investment advice. THE CONTENTS OF THIS DOCUMENT SHALL NOT CONSTITUTE ANY WARRANTY OF ANY KIND, EITHER EXPRESSED OR IMPLIED, INCLUDING BUT NOT LIMITED TO THE IMPLIED WARRANTIES OF MERCHANTABILITY AND/OR FITNESS FOR A PARTICULAR PURPOSE OR GIVE RISE TO ANY LIABILITY OF THOMSON REUTERS, ITS AFFILIATES OR ITS SUPPLIERS. The terms and conditions governing the use of this document shall consist of those set forth in written agreements with Thomson Reuters.
2
Copyright 10/2009 Thomson Reuters. All rights reserved.
TABLE OF CONTENTS INTRODUCTION ............................................................................................................................. 4
TREATMENT OF SMALL ESTIMATES REVISIONS ................................................................... 32
GLOSSARY OF ESTIMATES DATA MEASURES ...................................................................... 33
3
Copyright 10/2009 Thomson Reuters. All rights reserved.
INTRODUCTION About Thomson Reuters Thomson Reuters is the most complete source for integrated information and technology applications in the global financial services industry. Working in partnership with our clients, we develop individual workflow solutions that answer their specific data and analysis needs. Among those needs, clients would like insight on future earning prospects of publicly traded companies. As a result, Thomson Reuters tracks the reported and forecast earnings of these firms globally. Earnings Per Share is a key metric, and one most commonly utilized in two ways: to measure performance gains and to gauge companies’ results versus expectations. About This Document This document provides an in depth look at the methodologies Thomson Reuters uses for estimates. The purpose of this document is to outline, describe and provide reference for the different policies that affect Thomson Reuters estimates data.
ACCOUNTING REGULATIONS International Financial Reporting Standards (IFRS) The European Union has passed a regulation that requires listed European companies to comply with International Financial Reporting Standards (IFRS) in 2005 for their consolidated financial statements. There is a limited exception for certain companies to delay implementation until 2007. Generally, the regulation applies to consolidated financial statements for accounting periods starting on or after January 1, 2005. Thus for those companies with 12-month accounting periods covering the calendar year, IFRS will first apply to periods ending on December 31, 2005. As a result, companies will first publish IFRS financial information as at March 31, 2005 (if they report quarterly) or as at June 30, 2005 (if they report semi-annually). Estimates collected by Thomson Reuters will reflect the adoption of this ruling on a majority basis. The transition period to IFRS is visible for companies in Europe effective April 25, 2005. In addition to countries in Europe, IFRS will be adopted by parts of Asia, including Australia and New Zealand. The transition period to IFRS is visible for companies in Australia and New Zealand effective September 12, 2005. Dedicated company level footnotes are used to label the majority accounting basis for the company, as well as estimate level footnotes to label and exclude minority accounting basis estimates.
Instrument Level Footnote Code (Majority)
Footnote Text
3 Earnings on a fully adjusted basis 4 Accounting differences exist: Estimate on a Fully-Reported/GAAP basis W Estimates based on IFRS
Estimate Level Footnote Code (Minority)
Footnote Text
3 Earnings on a fully adjusted basis 4 Earnings on a fully reported basis W Estimates based on IFRS
4
Copyright 10/2009 Thomson Reuters. All rights reserved.
FAS123(R) On December 16, 2004, The Financial Accounting Standards Board (FASB) issued FAS123(R). This ruling requires companies to calculate the fair value of stock options granted to employees, and amortize that amount over the vesting period as an expense through the income statement. FAS123(R) is currently effective for fiscal years beginning after June 15, 2005, with company transition choices of: modified prospective, modified retrospective or early adoption. The effective date of the ruling was then extended from quarterly to annual periods beginning after June 15, 2005. Thomson Reuters will treat the expensing of stock options on a company-by-company basis. Stock option expenses will only be included in the primary EPS mean when the majority of the contributing analysts have included the expenses in their estimates. Estimates will be footnoted describing whether estimates include or exclude the options expense. Once the majority of the analysts are including stock option expenses in their estimates, the remaining estimates that do not include the expenses will be footnoted, filtered, and excluded from the primary EPS mean calculation. In the event that a contributing analyst provides two sets of EPS estimates for a given company (one including options expenses and one excluding), the majority basis estimate will appear under the EPS field and the alternative estimate will appear under the EPX field. The GAAP EPS measure (GPS) will however, include option expenses per FAS123(R) for periods where GAAP requires the inclusion of option expenses in reported results, and when the impact is known. When available, estimates from contributing analysts on a GAAP basis appear under the GPS measure. For periods where GAAP requires the inclusion of stock options expense, estimates excluding stock options expense will be filtered and footnoted once the impact of stock options expense is known for that period, as determined by any of the following:
• company issued guidance, • a quarterly report, • the presence of a GAAP estimate including options expense from a single contributor.
For example, if 10 brokers provide a GPS estimate that excludes stock options expense, but 1 broker provides an estimate that includes stock options expense for a period where GAAP requires inclusion, the 10 brokers excluding options will be filtered and footnoted and the 1 broker will remain unfiltered and comprise the GPS mean. Dedicated company level footnotes are used to label the majority accounting basis for the company, as well as estimate level footnotes to label and exclude minority accounting basis estimates.
Company Level Footnote Code (Majority)
Footnote Text
E Estimates reflect adoption of FAS123(R) F Estimates do not reflect adoption of FAS123(R) I Estimates have always reflected adoption of FAS123(R) N No known impact from FAS123(R) on estimates
FASB APB 14-1 On May 9, 2008 The Financial Accounting Standards Board (FASB) issued FASB APB 14-1. This ruling requires companies to change how they account for convertible debt in their financial statements - specifically, debt that can be converted into cash. Companies will be required to amortize the excess of the principal amount of the liability component over its carrying amount. This will result in higher interest costs. The effective date of the change will be the first fiscal year that begins after December 15, 2008, and will impact 2009 fiscal year estimates for most companies. For US traded companies carrying this type of debt, GAAP earnings will be negatively affected starting with 2009.
5
Copyright 10/2009 Thomson Reuters. All rights reserved.
Thomson Reuters will treat estimates impacted by FASB Staff Position APB 14-1 on a company-by-company basis. Post-FASB APB 14-1 estimates will only be included in the EPS mean when the majority of the contributing analysts have adopted this accounting change in their estimates. Estimates will be footnoted describing whether estimates reflect or do not reflect the accounting change. Once the majority of analysts reflect FASB APB 14-1 in their estimates, the remaining estimates that do not include the expenses will be footnoted, filtered, and excluded from the EPS mean calculation. The GAAP EPS (Fully Reported) measure will be post FASB APB 14-1 for periods where GAAP requires the amortization of cash-convertible debt in reported results and when the impact is known. When available, estimates from contributing analysts on a GAAP basis appear under the GAAP EPS measure on Thomson Reuters products. Dedicated company level footnotes are used to label the majority accounting basis for the company, as well as estimate level footnotes to label and exclude minority accounting basis estimates. Company Level Footnote Code (Majority)
Footnote Text
8 Estimates reflect FASB APB 14-1 9 Estimates do not reflect FASB APB 14-1
Estimate Level Footnote Code (Minority)
Footnote Text
8 Estimate reflects FASB APB 14-1 9 Estimate does not reflect FASB APB 14-1
ACTUALS Evaluation Thomson Reuters Market Specialists enter both quarterly period and annual actuals where analyst estimates exist on a real-time global basis - as sourced from multiple newswire feeds, press releases, company websites and public filings. When a company reports their earnings, the data is evaluated by a Market Specialist to determine if any Extraordinary or Non-Extraordinary Items (charges or gains) have been recorded by the company during the period. If no items have been recorded during the period the reported value is entered. If one or more items have been recorded during the period, actuals will be entered based upon the estimates majority basis at the time of reporting. The Market Specialist will still review each item in relation to the estimate submissions and how similar items have been treated in past periods. If after review it is determined that majority basis is to be changed, Thomson Reuters will update the actual and corresponding surprise values accordingly. Certain differences exist across regions pertaining to prioritization, coverage, and timeliness. Companies in Asia-Pacific, North America and Latin America are updated the same day of reporting. In the EMEA region, Tier1 companies (445 companies including FTSE 100 and other major indices) are also updated the same-day of reporting, with the Tier 2 companies updated within 15 days. Please note that Thomson Reuters collects actuals only for periods and measures where current analyst estimates exist. Majority Basis Thomson Reuters goal is to present actuals on an operating basis, whereby a corporation's reported earnings are adjusted to reflect the basis that the majority of contributors use to value the stock. In many cases, the reported figure contains unusual or one-time items that the majority of analysts exclude from their actuals. The majority accounting basis is determined on a quarter-by-quarter basis. Typical adjustments are for the effects of extraordinary and non-extraordinary items. Thomson Reuters examines each reported item, and includes or excludes the item from the actual based on how the majority of contributing analysts treat the item for that period. Once the Thomson Reuters Market Specialist determines
6
Copyright 10/2009 Thomson Reuters. All rights reserved.
whether the item is being included or excluded by the majority of contributors, they will enter the actual and a footnote detailing the type of the item, whether it is included or excluded, the size of the item, and the period affected. If after the comparable actual for the period is saved for a company and a go-forward majority is established on a different accounting basis, that actual will be replaced to reflect the change and footnoted to indicate the majority basis change. The announce and activation dates of the original comparable actual will remain. Any submission of an estimate by a contributing analyst using a non majority actual or on a non majority basis results in a call from a Thomson Reuters Market Specialist requiring the contributing analyst to adjust to the majority basis or have their estimates footnoted for an accounting difference and excluded from the mean calculation for the fiscal years in question. In all cases, appropriate footnotes are added to the estimate to denote what items are included or excluded. In some cases, a company’s actuals number will be temporarily withheld so that analysts may be contacted and additional research conducted. Elimination of Held-Out Actuals Practice (September 2009) Thomson Reuters made changes to the collection of actuals to provide increased data timeliness. As companies report, values will be adjusted to the estimates majority basis for the period, then entered into the database without a “hold out” period.
• Previously, when a company reported results, actuals were collected according to the estimates majority basis for the period at the time of report. If however, unexpected charges or gains were reported, actuals would temporarily be “held out” from products to see if the majority basis would change going forward.
o This process introduced possible timeliness issues whilst the sell-side analyst community reacted to the company news and issued reports, and subsequently Thomson Reuters re-evaluated the majority basis.
• Going forward, this “hold out” period will be eliminated in cases where unexpected charges or gains are reported. Actuals will be entered strictly based upon the estimates majority basis at the time of report – significantly increasing timeliness of actuals under these scenarios.
o The review of analyst reaction will still be done by Thomson Reuters, however only after the actual was already saved to the database and available on products.
o If the analyst majority basis changes after the fact, Thomson Reuters will update the actual and corresponding surprise values accordingly, and footnote the reason.
BASIC VS. DILUTED ESTIMATES Dilution occurs when a company issues securities that are convertible into common equity. Such issues can take the form of convertible bonds, rights, warrants or other instruments. When Thomson Reuters refers to “fully diluted” earnings estimates it means that the forecasts assume that all eligible shares are converted. Fully diluted earnings per share are, by definition, less than basic EPS (which is based solely on common shares outstanding).
• To be an eligible convertible security, the contributing analyst must predict that the share price will be greater than the strike price.
• If the contributing analyst predicts that the convertible security will be eligible, the convertible shares are included
in the analyst's share count, and the interest expense associated with the conversion is included in their EPS estimate. If the contributing analyst does not predict the convertible security will be eligible, the share count does not include the convertible shares, and there is no interest expense associated with the convertible. (Interest expense is associated with the conversion and this scenario has no conversion.)
Thomson Reuters determines whether a company is followed on basic versus diluted shares based on the majority rule. If a contributor is on the minority basis, the estimate is filtered, footnoted and excluded from the mean calculation using the estimate level footnotes listed below. Estimate Level Footnote Code (Minority)
Footnote Text
B Accounting differences exist: Estimate on a basic share count basis E Accounting differences exist: Estimate on a diluted share count basis
7
Copyright 10/2009 Thomson Reuters. All rights reserved.
North America Thomson Reuters defaults to using diluted shares in North America, as this is the most widely used valuation method. Estimates are displayed on a diluted basis taking into account all eligible convertible securities. The only circumstances where basic shares would be the default for a company would be when a company reports a loss, as basic is the more conservative valuation method. International For international companies, Thomson Reuters determines whether a company is followed on basic vs. diluted shares based on the majority rule, due to the high amount of variance in which companies are followed. In cases where an analyst follows a company on a basis that is different from the mean, filters/footnotes are applied to their estimates, which are then excluded from the mean calculation.
CORPORATE ACTIONS Corporate actions are defined as any event which can bring material change to a stock, which include the following:
Thomson Reuters obtains information on corporate actions via real-time news feeds as well as information received directly from companies. Thomson Reuters Market Specialists then process corporate actions on a real-time basis. Thomson Reuters Market Specialists verify the corporate action announcement by using original press releases from companies. Corporate action announcements are then footnoted in the appropriate tables (see examples below): Estimate Level Footnote Code (Minority)
Footnote Text
L Accounting differences exist: Estimate reflecting corporate action V Contributor update pending: Estimate not reflecting corporate action A Accounting Differences Exist
Example: St. Paul Travelers Cos Inc. (ticker STA) Corporate Action Announcement: 17-Nov-03 announced merger with Travelers Property Casualty Corp. Mergers, Acquisitions and Spin Off’s Thomson Reuters will reflect estimates on the post-event basis, reflecting the completion of a merger/acquisition/spin-off, when the first of two events occur:
• The majority of analysts covering the company submit estimates on a post-event basis or; • The event itself actually closes/completes (usually signified by a press release on or around the closure date).
When a corporate action occurs, before Thomson Reuters makes any data changes, all of the following action details are thoroughly researched:
• All information must be confirmed, including the action, the date, and how current and historical estimates will be treated going forward. For example, to which company estimates will be attached.
• Great importance is also placed on how the company will be treating its financial statements going forward. This research is done by using Datastream, the company's website, or by contacting the company's IR group directly.
• The corporate action is always treated in the database in accordance with the company's guidelines (who will be the surviving entity, etc.).
8
Copyright 10/2009 Thomson Reuters. All rights reserved.
Policies involved with introducing the Merger/Acquisition include:
• Footnotes will be added describing the announced merger/acquisition to all publicly traded companies involved that we have established in our database.
• All Thomson Reuters mean estimates will reflect a merger/acquisition according to how the majority of analysts covering the company treat the action. The mean will follow this majority policy up until the date the merger/acquisition closes. An additional footnote will be added to the database detailing how the mean is treating the action that will remain present until the action closes. Once the merger/acquisition is closed and finalized, the estimates must reflect the full affects of the action.
• Upon the date of closing several actions may need to be taken on the part of Thomson Reuters depending on the type of merger/acquisition that has occurred. All of the possible actions performed are to update the Thomson Reuters estimates database to reflect all effects of the closed corporate action. Below are some broader steps taken but more specific instructions are listed with each possible scenario below:
• The closing of the merger/acquisition is footnoted. All records and consensus data for surviving or newly formed companies affected by the merger/acquisition must now fully reflect the effects of the completed corporate action. This may involve company name or identifier changes of the acquiring company or the creation of a completely new entity in our database formed through a merger. It will involve making sure all estimate data included in consensus for these companies reflects the completed action. Historical estimates for the surviving company, normally the company doing the acquiring, will remain.
• If a company has been acquired or merges with another and no longer exists as a separate entity, the estimates/recommendations/price targets associated with that ticker must be stopped and the ticker end-dated upon closing of the action. Since the company will no longer exist, there will be no visible outstanding or active records on our products or database. Please note that when estimates are stopped, the user will not have a link between the former company and the newly created one. Thomson Reuters does, however, keep a record of the movement of companies in the central estimates database.
The policies Thomson Reuters follows in the case of Spin-Off/De-Merger include:
• Footnotes are added describing the announced spin-off/demerger to all publicly traded companies involved that are established in the Thomson Reuters database.
• All mean estimates will reflect a spin-off/demerger according to how the majority of analysts covering the company treat the action. The mean will follow this majority policy up until the date the spin-off/demerger closes. An additional footnote will be added to the database detailing how consensus is treating the action that will remain present until the action closes. Once the spin-off/demerger is closed and finalized, the estimates must reflect the full effects of the action.
• Upon the date of closing several actions may need to be taken on the part of Thomson Reuters depending on the type of spin-off/demerger that has occurred. All of the possible actions performed are to update the estimates database to reflect all effects of the closed corporate action. Below are some broader steps taken but more specific instructions are listed with each possible scenario below:
• The closing of the spin-off/demerger is footnoted. All records and consensus data for surviving or newly formed companies affected by the spin-off/demerger must now fully reflect the effects of the completed corporate action. This may involve the creation of a completely new entity in the estimates database formed through the spin-off/demerger. This will involve making sure that all estimate data included in consensus for these companies reflect the completed action.
• If a previously existing company will no longer exist or no longer trades publicly, all estimates, recommendations and price targets must be stopped and the ticker end-dated upon closing of the transaction.
Stock Splits & Stock Dividends A security begins trading on a post-split or post-stock dividend basis the day after the payment date (date the declared split or dividend is paid). Thomson Reuters enters a footnote that indicates the size of the stock split or stock dividend and the effective date (the day after the payment date). After the market closes on the day before the stock begins trading on the new basis, all estimates data in Thomson Reuters – both current and historical - will be adjusted for the new shares. If a contributing analyst submits estimates on an adjusted basis prior to the effective date or unadjusted basis after the effective date, Thomson Reuters will contact that analyst to request properly adjusted estimates. Please note that Thomson Reuters does not make adjustment factors for corporate actions which do not affect the number of shares. This document describes the actions taken when a company’s share count changes. This could include, but is not limited to, spin offs, mergers or cash payments / special payments.
9
Copyright 10/2009 Thomson Reuters. All rights reserved.
Example of Stock Split: Meritage Homes Corp [MTH] Footnote: 20-Dec-04 2 for 1 Split Effective 10-Jan-05 Thomson Reuters does not adjust estimates for cash payments. The effect of cash payments on estimates is treated as a revision by the contributing analyst. On the effective date of the cash payment, a Thomson Reuters market specialist will contact all contributing analysts to request updated figures that include the cash payment. Estimates that are not updated to reflect the cash payment are footnoted as update pending, and will be filtered from the mean until they are updated by the contributing analyst. Example of Stock Split with Cash Payment: United Business Media PLC [UBM] 14 for 17 share consolidation Special cash dividend of 89p per share Thomson Reuters will apply a split factor of 1.214 reflecting the share consolidation. It is expected that contributors will revise their models to reflect the 89p cash dividend. Contributors that do not revise their estimates to reflect the cash dividend will be footnoted as update pending and filtered from the mean estimate. Rights Issues Rights Issues are treated in the following manner:
• When rights issues becomes effective, like stock splits, the ex date triggers all current and historical adjustments for price, shares and earnings.
• Even before the majority of analysts switch to post rights issue estimates, estimates will be collected and displayed on products prior to the ex-date, but will be excluded from the mean with a new estimate level footnote type:
Estimate Level Footnote Code (Minority
Footnote Text
7 Accounting differences exist: Estimate reflecting rights issue prior to ex-date
• Once the ex-date occurs, footnotes of excluded estimates will be automatically end-dated and will be then added back into the mean calculation where appropriate.
CONTRIBUTOR REQUIREMENTS In order to maintain a quality, professional standard for all contributing analysts, Thomson Reuters Contributor Relations requires a candidate to pass a strict set of guidelines before being enlisted as a contributor. A potential contributor must provide information to establish that they are a reputable firm. This process includes providing example research reports, three references from institutional clients, three references from company investor relations, detail on the number of companies covered per analyst in the firm, and background information on the director of research. Thomson Reuters currently collects and analyzes the research, ratings and forecasts from many different sell-side or independent contributors. Please reference the Thomson Reuters Contributor Approval Policy document for further details.
CURRENCY The default currency displayed on Thomson Reuters is generally the currency in which the company reports*. Thomson Reuters will however, accept estimates in any currency.
10
Copyright 10/2009 Thomson Reuters. All rights reserved.
The following describes the treatment of non-default currency conversions on Thomson Reuters products: (Please note that product update schedules vary for currency conversions.)
• All estimates revisions received in a non-default currency are updated using the prior day’s currency conversion rate.
• All non-default estimates have the currency conversion recalculated on Friday night using Friday’s end of the day conversion rate.
• When a contributing analyst confirms a default currency estimate, there is no change in the raw value estimate stored in the database.
• Thomson Reuters provides normalized Summary and Detail history offerings which provide a smooth historical view for companies that have had a currency change over time and it is intended to simplify clients’ workflow.
A confirmation of a non-default currency estimate however, does result in a reconverted estimate being sent to products. This estimate will represent the conversion rate as of the day prior to the confirmation. Please note one exception: the per-share data measures of United Kingdom companies are always covered in BPN (pence) and the values for non-per share data measures are displayed in GBP (pounds). The label for all estimates, regardless of per share or non-per share measure type however are BPN. Treatment of Currency Changes Thomson Reuters follows companies based on their reporting currency. In some cases however, where the reporting currency does not reflect the clear majority of estimate submissions, Thomson Reuters may exercise the option to set the default based on the currency of the majority of estimate submissions. In cases where companies report in multiple currencies, Thomson Reuters will set the default currency based on the majority of estimate submissions. Occasionally, companies will change the currency in which they report and/or the majority of analysts covering a company will change the currency of their estimates. As a result, Thomson Reuters will change the default currency of a company in order to align with the reporting company or majority of contributing analysts as part of the operational process. Normalized Summary & Detail History (Currency) Thomson Reuters provides normalized summary and detail history in addition to regular summary and detail history, providing a smooth historical view for companies that have had a currency change over time and it is intended to simplify clients’ workflow. Whereas the regular summary and detail history offering provides a clear time series of when a company changes reporting currencies, the normalized offering will provide all historical estimates for a company in the current reporting currency of that company.
ENTITLEMENTS INFORMATION Thomson Reuters is recognized for providing the most timely and accurate estimates data available to investment professionals. This is made possible in part by an agreement with our contributing analysts which restricts the distribution of individual analyst’s estimates to certain parties. The following policy is strictly adhered to:
• Individual estimates with the associated contributor names are provided exclusively to institutional 'buy-side' investors and the research departments of the contributing analysts.
• Institutional investors are defined as users who are involved in executing trades through multiple brokerage firms. • Investment banking, corporate finance and trading firms are not considered institutional investors as they do not
have a trading relationship with any of the contributing firms and in effect, are competitors of those contributing analysts. Therefore, these firms are not privy to seeing individual analyst’s earnings estimates.
• Analyst’s research is considered proprietary information, unlike news articles or SEC filings. Detailed earnings estimates are also considered a part of an analyst’s research and therefore proprietary in nature.
Examples of disentitlement views by product would be:
• Thomson ONE Broker and analyst names are displayed while displaying estimate value as “PERMISSION DENIED”
• First Call Blank records for entire entry are sent with the detail record – no broker or analyst name or estimate value are displayed.
11
Copyright 10/2009 Thomson Reuters. All rights reserved.
• I/B/E/S Estimator and Analyst Name will be replaced by a numeric code, effectively meaning “Permission Denied” while displaying estimate value.
In order to gain access to the research reports of a broker with ‘Prior Approval’ status, a client need only speak with their Thomson Reuters Relationship Manager or Sales Representative directly. Thomson Reuters will contact those brokers in question and seek approval to access their reports on behalf of the client. If approved, the client will have access to view the research reports within 24-48 hours.
ESTIMATES COLLECTION Process Thomson Reuters gathers earnings forecasts and other data from hundreds of brokerage and independent analysts who track companies as part of their investment research work. Thomson Reuters calculates a mean consisting of estimates utilizing the same accounting standards (basis). Majority Policy Most institutional clients prefer to view estimates on an “operating” basis, reflecting the majority of the analysts covering a security. Consequently, Thomson Reuters follows a ‘majority’ policy, where the accounting basis of each company estimate is determined by the basis used by the majority of contributing analysts. Once the majority basis has been established, contributing analysts in the minority may keep their original estimates, or are also given the opportunity to adjust to the majority basis. On rare occasions, the majority basis may be revised as additional analysts are heard from or as some change their opinion. In all cases, appropriate footnotes are added to the Thomson Reuters database stating the appropriate basis of each estimate, and if the item has been included or excluded from the mean estimate. Adoption of Post-Event Mean (as of September 2009) As of September 21, 2009, Thomson Reuters adopted more stringent updating rules for analyst’s estimates which are not reflecting current company events, such as:
• Issuance of Company Guidance Detail estimates which have not been updated or confirmed following the issuance of guidance and do not fall within the guidance range (e.g. “$1.00 - $1.10”) will be filtered / excluded from the mean at the time of guidance. In those cases where single-point guidance is issued (e.g. “about $1.00”), estimates not within 5% of the guidance will be footnoted and excluded from the mean. The aforementioned guidance filter will only apply to the specific measure and period. Those estimates that are excluded will be labeled with a (N) estimate level footnote. Then, excluded estimates that are updated or confirmed will have the footnote end-dated and added back into the mean calculation.
• Actual(s) Reporting
Detail estimates for unreported periods which are not updated or confirmed within 10 business days of a prior-period reported actual will be excluded from the mean, based on the reporting of the EPS actual for that/their specified period(s). Those estimates that are excluded from the mean will be labeled with a type (P) estimate level footnote. The reported actual(s) filter will be applied to all measures and subsequent periods for that fiscal year. Then, excluded estimates that are updated or confirmed will have the footnote end-dated and added back into the mean calculation.
Estimate Level Footnote Code (Minority)
Footnote Text
N Contributor update pending: Estimate not reflecting recent company guidance P Contributor update pending: Estimate not reflecting recent reported actual
12
Copyright 10/2009 Thomson Reuters. All rights reserved.
Please note that all other scenarios, including corporate actions, will continue with the original policy of waiting for the full majority of analyst treatment however they will be enhanced with new descriptive footnotes, illustrated below in the Footnotes section of this document. Extraordinary Items Extraordinary items are defined by the accounting conventions of the Financial Accounting Standards Board. Companies are required to present extraordinary items as a separate item in their financial statements. Thomson Reuters will always exclude them from the reported figures, since the majority of contributing analysts always choose to exclude extraordinary items. Thomson Reuters uses the word "extraordinary" in the most limited sense as defined by accounting convention (some analysts have the habit of applying the word "extraordinary" to any unusual charges or gains). The most common extraordinary items are:
• Cumulative Effect of FASB Accounting Changes • Tax Loss Carry forwards • Discontinued Operations • Early Retirement of Debt
Please note that as each quarter is treated independently of each year, any exclusion from a given quarter would result in an exclusion from the annual estimate Example: Q1 Included Q2 Excluded, minority basis Q3 Included Q4 Included FY Excluded, due to Q2 exclusion Non-Extraordinary Items Non-extraordinary and non-operating items are charges or gains that may or may not be seen as pertinent to ongoing operations, depending on the industry and the opinion of the majority of contributing analysts. In contrast to the uniform recognition of extraordinary items, there is a great deal more variance within the analyst community concerning the treatment of non-extraordinary/non-operating items. When submitting estimates, contributors are encouraged to include or exclude any non-extraordinary items they deem non-recurring and/or non-operating. Once a non-extraordinary or non-operating item is recognized, a Thomson Reuters Market Specialist will poll all contributor’s estimates covering a particular company, to establish if the majority of them are including or excluding the event. If there is no clear majority, then the charge or gain is included in the mean. If at any point the majority basis cannot be determined, the Thomson Reuters Market Specialist will further research the affected estimates, including potentially contacting the contributing analysts, to determine the majority basis. Examples of Non-Extraordinary items include:
• Restructuring charges - larger ones are usually excluded • Asset sale gains or losses - larger ones are usually excluded • Inventory adjustments - included in the majority of cases • Currency adjustments - included in the majority of cases; always included in the Oil industry • Realized securities gains or losses - always excluded in the Insurance industry; always included in the Banking
industry • Acquisition expenses or gains from acquisition - larger ones are usually excluded • Litigation charges or gains from litigation • Tax settlements or adjustments • Write-offs
13
Copyright 10/2009 Thomson Reuters. All rights reserved.
Majority Basis Footnotes A new series of valuable company and estimate level footnotes is now available for enhanced transparency of estimate accounting basis and rationale for exclusions.
COMPANY LEVEL FOOTNOTE Footnote Code
Footnote Text
M Majority Basis includes/excludes… (freeform criteria utilized to define specific accounting scenario of the mean calculation)
This new company level footnote is designed for flexibility, and as such it will be edited to reflect any specific company scenario. Just a few possible examples of what this new freeform footnote will label include, but are not limited to, the following:
• Majority Basis excludes restructuring charge • Majority Basis includes tax adjustment gain • Majority Basis includes currency adjustment gain • Majority Basis excludes litigation charge
ESTIMATE LEVEL FOOTNOTES In addition to labeling a company’s majority accounting basis, Thomson Reuters also introduced new estimate level footnotes to clarify the specific reasoning of why an estimate was excluded from the mean. Both the company and estimate level footnotes work in tandem in the event of a change in basis (e.g. if a company’s basis changes, both sets of footnotes will be ‘flipped’ to account for the new majority basis). New / Modified footnotes to be used are as follows: Footnote Code
Footnote Text
4 Accounting differences exist: Estimate on a Fully-Reported/GAAP basis 7 Accounting differences exist: Estimate reflecting rights issue prior to ex-date B Accounting differences exist: Estimate on a basic share count basis E Accounting differences exist: Estimate on a diluted share count basis G Accounting differences exist: Excludes charge(s) H Accounting differences exist: Includes charge(s) I Accounting differences exist: Excludes gain(s) J Accounting differences exist: Includes gain(s) L Accounting differences exist: Estimate reflecting corporate action M Accounting differences exist: Estimate on a non-GAAP basis X Accounting differences exist: Estimate on a Cash EPS basis N Contributor update pending: Estimate not reflecting recent company guidance O Contributor update pending: Estimate failed freshness policy P Contributor update pending: Estimate not reflecting recent reported actual V Contributor update pending: Estimate not reflecting corporate action
Existing footnotes which will continue to be used where appropriate are as follows: Footnote Code
Footnote Text
3 Earnings on a fully adjusted basis 5 Estimates Include Stock Options Expense 6 Estimates Exclude Stock Options Expense 8 Estimate reflects FASB APB 14-1 9 Estimate does not reflect FASB APB 14-1 A* Accounting Differences Exist C Estimate Received directly from Analyst
14
Copyright 10/2009 Thomson Reuters. All rights reserved.
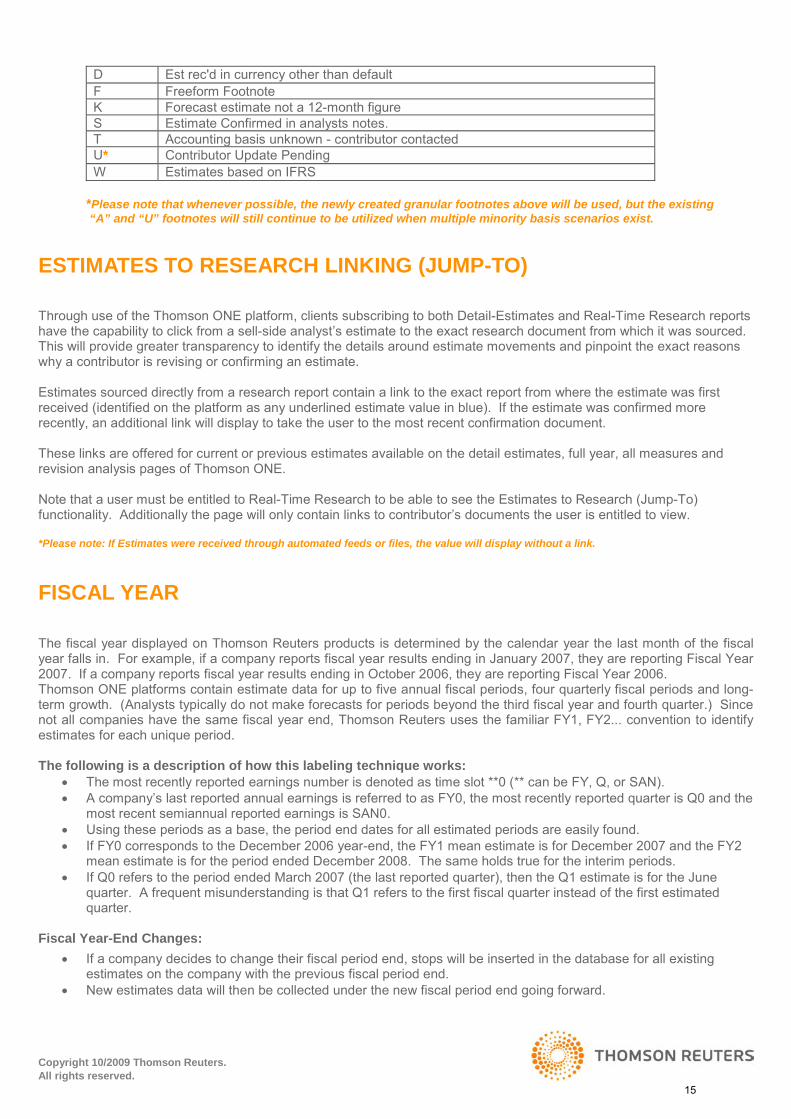
D Est rec'd in currency other than default F Freeform Footnote K Forecast estimate not a 12-month figure S Estimate Confirmed in analysts notes. T Accounting basis unknown - contributor contacted U* Contributor Update Pending W Estimates based on IFRS
*Please note that whenever possible, the newly created granular footnotes above will be used, but the existing “A” and “U” footnotes will still continue to be utilized when multiple minority basis scenarios exist.
ESTIMATES TO RESEARCH LINKING (JUMP-TO) Through use of the Thomson ONE platform, clients subscribing to both Detail-Estimates and Real-Time Research reports have the capability to click from a sell-side analyst’s estimate to the exact research document from which it was sourced. This will provide greater transparency to identify the details around estimate movements and pinpoint the exact reasons why a contributor is revising or confirming an estimate. Estimates sourced directly from a research report contain a link to the exact report from where the estimate was first received (identified on the platform as any underlined estimate value in blue). If the estimate was confirmed more recently, an additional link will display to take the user to the most recent confirmation document. These links are offered for current or previous estimates available on the detail estimates, full year, all measures and revision analysis pages of Thomson ONE. Note that a user must be entitled to Real-Time Research to be able to see the Estimates to Research (Jump-To) functionality. Additionally the page will only contain links to contributor’s documents the user is entitled to view. *Please note: If Estimates were received through automated feeds or files, the value will display without a link.
FISCAL YEAR The fiscal year displayed on Thomson Reuters products is determined by the calendar year the last month of the fiscal year falls in. For example, if a company reports fiscal year results ending in January 2007, they are reporting Fiscal Year 2007. If a company reports fiscal year results ending in October 2006, they are reporting Fiscal Year 2006. Thomson ONE platforms contain estimate data for up to five annual fiscal periods, four quarterly fiscal periods and long-term growth. (Analysts typically do not make forecasts for periods beyond the third fiscal year and fourth quarter.) Since not all companies have the same fiscal year end, Thomson Reuters uses the familiar FY1, FY2... convention to identify estimates for each unique period. The following is a description of how this labeling technique works:
• The most recently reported earnings number is denoted as time slot **0 (** can be FY, Q, or SAN). • A company’s last reported annual earnings is referred to as FY0, the most recently reported quarter is Q0 and the
most recent semiannual reported earnings is SAN0. • Using these periods as a base, the period end dates for all estimated periods are easily found. • If FY0 corresponds to the December 2006 year-end, the FY1 mean estimate is for December 2007 and the FY2
mean estimate is for the period ended December 2008. The same holds true for the interim periods. • If Q0 refers to the period ended March 2007 (the last reported quarter), then the Q1 estimate is for the June
quarter. A frequent misunderstanding is that Q1 refers to the first fiscal quarter instead of the first estimated quarter.
Fiscal Year-End Changes:
• If a company decides to change their fiscal period end, stops will be inserted in the database for all existing estimates on the company with the previous fiscal period end.
• New estimates data will then be collected under the new fiscal period end going forward.
15
Copyright 10/2009 Thomson Reuters. All rights reserved.
• For example if a company changed from an October year end to December year end, all 10-2007Y estimates would be stopped, then only 12-2007Y estimates would collected on the effective date of the change.
FOOTNOTES Footnotes are attached to estimates to alert clients as well as Thomson Reuters Market Specialists of special actions or situations affecting estimates. There are three distinct types of footnotes that can be entered: Company, Instrument and Estimate Level Footnotes. Company-Level Footnotes Company-level footnotes are footnotes that apply to estimates received from all contributors in a specific measure for a specific period. All company level footnotes apply to the majority EPS accounting basis, which translates down to all related data measures as well. Thomson Reuters Market Specialists use company-level footnotes to relay the majority basis of a table to clients. For example, if the analysts covering a company are including/excluding a specific charge or gain, a Company-level footnote would be attached to clearly identify this. The footnotes below show the types of Company-level footnotes available: Footnote Code
Purpose Footnote Text
8 Accounting Estimate reflects FASB APB 14-1 9 Accounting Estimate does not reflect FASB APB 14-1 A Accounting Quarters may not add to annual due to changes in shares outstanding B Accounting Estimates reflect adoption of SFAS 142 C Accounting Stock Carries Goodwill Amortization D Accounting No Goodwill Amortization Present In Stock E Accounting Estimates reflect adoption of FAS123(R) F Accounting Estimates do not reflect adoption of FAS123(R) G* Accounting Free Form Extraordinary Event Footnote I Accounting Estimates have always reflected adoption of FAS123(R) M* Accounting Majority basis Includes / Excludes <text> N Accounting No Known impact from FAS123(R) on estimates
*Footnote utilizes free-form criteria to define specific accounting scenarios of the mean calculation. Instrument-Level Footnotes Instrument-level footnotes are footnotes without a time frame or specific measure. These footnotes apply to all estimates entered on a particular ticker across every year and every measure. For example, if the company tracks FFO instead of EPS, an Instrument-level footnote would be attached to clearly identify this. Footnote Code
Purpose Footnote Text
3 Accounting Earnings on a fully adjusted basis 4 Accounting Earnings on a fully reported basis 8 Accounting Estimate reflects FASB APB 14-1 9 Accounting Estimate does not reflect FASB APB 14-1 A* Accounting Accounting Alert. Free Form C Accounting Accounting Alert, Company followed on a Cash Earnings basis E Accounting Estimates reflect adoption of FAS123(R) F Accounting Estimates do not reflect adoption of FAS123(R) G Accounting Accounting Alert, Company earnings before goodwill amortization I Accounting Estimates have always reflected adoption of FAS123(R) M* Accounting Majority basis Includes / Excludes <text>
16
Copyright 10/2009 Thomson Reuters. All rights reserved.
N Accounting No known impact from FAS123(R) on estimates W Accounting Estimates based on IFRS
*Footnote utilizes free-form criteria to define specific accounting scenarios of the mean calculation Estimate-Level Footnotes Estimate-level footnotes are attached to a specific contributor, ticker, year, measure, and/or period estimate. The footnotes below show the types of Estimate-level footnotes available. The purpose of Estimate-level footnotes is to exclude estimates from the mean calculation, and give a label as to the reason why it is excluded. Footnotes in italics however do not automatically exclude estimates from being part of the mean (C, D, F and S). Footnote Code
Purpose
Footnote Text
3 Accounting Earnings on a fully adjusted basis 4 Accounting Accounting differences exist: Estimate on a Fully-Reported/GAAP basis 5 Accounting Estimate includes stock option expenses 6 Accounting Estimate excludes stock option expenses 7 Accounting Accounting differences exist: Estimate reflecting rights issue prior to ex-date 8 Accounting Estimate reflects FASB APB 14-1 9 Accounting Estimate does not reflect FASB APB 14-1 A Accounting Accounting differences exist B Accounting Accounting differences exist: Estimate on a basic share count basis E Accounting Accounting differences exist: Estimate on a diluted share count basis G Accounting Accounting differences exist: Excludes charge(s) H Accounting Accounting differences exist: Includes charge(s) I Accounting Accounting differences exist: Excludes gain(s) J Accounting Accounting differences exist: Includes gain(s) K Accounting Forecast estimate not a 12-month figure. L Accounting Accounting differences exist: Estimate reflecting corporate action M Accounting Accounting differences exist: Estimate on a non-GAAP basis T Accounting Accounting basis unknown - contributor contacted W Accounting Estimates based on IFRS X Accounting Accounting differences exist: Estimate on a Cash EPS basis N Freshness Contributor update pending: Estimate not reflecting recent company guidance O Freshness Contributor update pending: Estimate failed freshness policy P Freshness Contributor update pending: Estimate not reflecting recent reported actual U Freshness Contributor update pending. V Freshness Contributor update pending: Estimate not reflecting corporate action C Supplemental Estimate received directly from analyst D Supplemental Est rec'd in currency other than default F Supplemental Freeform Footnote S Supplemental Estimate confirmed in analysts notes.
GLOBAL ESTIMATES FRESHNESS POLICIES Thomson Reuters strives to provide the freshest estimates content possible to clients and consequently, contributors are asked to regularly send confirmations of their existing estimates. Thomson Reuters maintains active policies on the ‘freshness’ of estimates provided by contributing analysts. All forecasted data measures are accompanied by original announce and confirmation dates (in Eastern Time) and are subject to policies designed to prevent stale data: Estimates If an estimate has not been updated for 105 days, the estimate is filtered, footnoted with the following estimate level footnote and excluded from the mean. (Estimates are updated by a contributing analyst sending a confirmation, revision or drop in coverage.)
17
Copyright 10/2009 Thomson Reuters. All rights reserved.
Footnote Code Footnote Text O Contributor update pending: Estimate failed freshness policy
• When Q4 is the current reporting period, Q4 and FY1 estimates are an exception to this rule: Q4 and FY1 estimates
will be filtered when they have not been updated for 120 days. (This allows extra time for companies to report year-end results.)
If an estimate is not updated for a total of 180 days, the estimate is stopped. Note:
• All non-updated estimates are auto-filtered at 105 days. If an estimate is later confirmed as current, the filter/footnote/exclusion will be end-dated and the estimate will be confirmed.
• All non-updated estimates are auto-stopped at 180 days. If an estimate is later re-sent by a contributor, it will be treated as a new estimate initiation.
Recommendations If a recommendation is not updated for a total of 180 days, the recommendation is stopped. (Recommendations are updated by a contributing analyst sending a confirmation, revision or drop in coverage.) Price Targets Price target data is stopped at the expiration of it’s time horizon (For example, a 12-month price target would be stopped 12 months after it was last revised by a contributing analyst).
GUIDANCE Guidance is any forward-looking expectation issued directly by a company regarding its future financial performance. Most importantly, guidance is used by company management to manage investor expectations and by investors to evaluate the company and predict future performance. Under current full disclosure regulations, guidance is the only legal method a company can utilize to communicate its expectations to investors. Thomson Reuters StreetEvents obtains guidance information via real-time news feeds as well as information received directly from companies. Thomson Reuters Market Specialists analyze estimates and guidance together on a real-time basis. Thomson Reuters Market Specialists verify the guidance by using original press releases from companies; comments made by analysts are not used as guidance. Guidance will be evaluated and compared with the earnings estimates mean before reflecting on product. Issuance of Company Guidance Detail estimates which are not updated in a timely fashion after the issuance of guidance will be excluded in order to create a post-event mean value. Detail estimates which have not been updated or confirmed following the issuance of guidance and do not fall within the guidance range (e.g. “$1.00 - $1.10”) will be excluded from the mean at the time of guidance. If a single-point guidance is issued (e.g. “about $1.00”), estimate(s) not within 5% of the guidance would be excluded from the mean with appropriate addition of footnotes (see below). Once excluded estimates are updated or confirmed, they will have the footnote end-dated and added back into the mean calculation.
Product Views In Q307, Thomson Reuters began offering a “Mean/Guidance Comparison” page on Thomson ONE, which is separate from the standard StreetEvents guidance offering. This enhancement allows clients to view mean estimates, actuals and guidance on the same accounting basis side-by-side to ensure a consistent analysis. Additionally, guidance and estimates not on the same accounting basis are indicated with a footnote. This comparable guidance data is fielded and adjusted for corporate actions. Most importantly it is normalized and adjusted to match the accounting basis of estimates; percentages are translated into values, extraordinary items are included/excluded to adhere to estimates majority.
Footnote Code Footnote Text N Contributor update pending: Estimate not reflecting recent company guidance
18
Copyright 10/2009 Thomson Reuters. All rights reserved.
Thomson Reuters offers estimates-comparable guidance on 14 data measures for over 2,350 companies globally, with history for the S&P500 back to January 2006. Thomson Reuters also offers Thomson Reuters Guidance Datafeed, bringing I/B/E/S Estimates and Guidance together into one consistent format allowing clients to perform true comparisons. Thomson Reuters Guidance is a unique, intra-day datafeed that offers quantitative (numeric) company expectations from press releases and transcripts of corporate events and plots them alongside the I/B/E/S mean estimate at the time of the release. This offering enables investment professionals to access company expectations alongside earnings forecasts in a single feed, and most importantly, direct from the market-leading source including the benefits of:
• Global coverage • Historical content dating back to 1994 • Available for fiscal quarters and years • Announcement dates and timestamps
Estimates Comparable Guidance is available for the following 14 data measures:
HISTORY Thomson Reuters I/B/E/S historical earnings database is revision-based. Therefore, a new ‘record’ is not written into history unless the current estimate changes (referred to as “revised”). In the event that a contributing analyst is confident in the current estimate and does not wish to revise the estimate, a confirmation is requested. Confirmations add integrity to the estimates (a 30-day old estimate, although in-line with all other estimates, is not regarded as confidently as a day-old estimate). Confirmations are easily identifiable in the database in that the announce (effective) date remains unchanged while the confirmation date is updated to the date of the confirmation. Error-Corrected History Thomson Reuters has traditionally made error corrections to historical data if it can be substantiated through published research documentation. While there are certain types of estimate data that contain “As published” information (e.g., Surprise values), the majority of the data is error corrected. Policies on historical corrections are defined by data item. In general, historical corrections are made upon request/review and are granted based on: corresponding documentation and if necessary, after the basis is verified. There are two main types of data items:
• Earnings forecasts and other period-specific data items • Recommendations or Target Prices
For each of the types, the following factors are taken into consideration when making historical changes:
Code Data Measure CPX Capital Expenditure DPX Dividends Per Share EBS EBITDA Per Share EBT EBITDA EPS Earnings Per Share FFO Funds From Operations Per Share GPS Fully Reported Earnings Per Share GRM Gross Margin NET Net Income OPR Operating Profit PRE Pre-Tax Income ROA Return On Assets (%) ROE Return On Equity (%) SAL Sales
19
Copyright 10/2009 Thomson Reuters. All rights reserved.
How long ago did the error occur?
• Within the last six months: Changes are made to the database. History is captured in the recalculated mean figures.
• Prior to the past six months: These changes are made but do not automatically result in recalculated mean figures. This is due to the need to adjust history products and tables, or else detail data will not match mean data. As a result, summary history may not match detail history due to such error corrections.
How was the data received?
• Data can be received via: Notes, PDF Research, or Universe Files. Types of changes made to historical data:
• Value, Effective Date (and Activation Date for Actuals), Analyst Coverage, Deletion, Addition of Missed Revision
Historical corrections are made to ensure the highest quality data. Errors are minimized; however it is possible that discrepancies exist due to contributing analysts never sending Thomson Reuters the data originally, or that it was sent incorrectly. As a general rule, corrections are only made, if the contributing analyst can support the value through published research. This policy has been in effect for the treatment of both recent and older history - regardless of whether or not the company reported.
As-Was Summary History In addition to the traditional ‘error-corrected’ history offering, Thomson Reuters has recently made a new historical summary-level dataset available, which is unaltered in any way. The As-Was historical daily mean estimates dataset provides daily mean values as they appeared on a particular day; regardless if the underlying detail estimates have since been corrected or not. Daily Historical Mean is a collection of detail estimates from analysts calculated on a daily basis. The mean is the average of the detail estimates as reported by the analyst at that particular point in time, without making any revisions or corrections to the data once it’s published. Quantitative researchers utilize “as was” data to analyze the market impact on the actual day the official record was released. Subscribers of this data set will have the ability to view over 20 financial measures, including 5 types of per share data for US and International companies.
• This powerful data set is extremely important to quantitative portfolio managers wishing to see historic data free from modifications due to error corrections.
• As-was history enables clients to see a true snapshot of the exact information available to the market at a given point in time - to see the effect that the company’s estimates had on market events.
**Note that Thomson Reuters presently only offers summary-level daily as-was history. As-was detail-level estimates history will be a future enhancement to this offering. Differences between ‘Error-Corrected’ and ‘As-Was’ History There are certain circumstances when Thomson Reuters needs to adjust or correct a historical detail estimate that has been stored in the database. This happens when brokers go back to Thomson Reuters to correct a previously provided estimate, or when an estimate was missed from an update. In these cases, Thomson Reuters will change the detailed estimate which may or may not cause the mean to change. If the mean changes, it is no longer an “as-was” figure. Instead, the mean becomes “error-corrected” because it is recalculated based on a corrected detail. Example: Company ABC has 10 estimates from 10 different brokers. As of 11-01-2006, the mean for the 12-06 quarter is $2.15. One of the brokers covering Company ABC is Broker XYZ who provided Thomson Reuters with an estimate of $2.20 for the same time period. On November 30, 2006, Broker XYZ told Thomson Reuters that their $2.20 should have been $2.26. Broker XYZ provides documented proof that the estimate that was sent to Thomson Reuters via a feed was incorrect, and that their research reports support that the estimate is actually $2.26. Thomson Reuters will apply the correct value to the detail estimate for the applicable quarter, on the date that the estimate was effective. Because of the change, the mean will change to $2.17. In this scenario, the “as-was” mean is $2.15 and the “error-corrected” mean is $2.17.
20
Copyright 10/2009 Thomson Reuters. All rights reserved.
In summary, all traditional estimates history products offer ‘error-corrected’ history in which any time an incorrect value is found, it is then corrected – on either a summary or detail estimate level. Thomson Reuters new ‘as-was’ history offers historical mean estimates, free of any modification, and shows any given mean estimate value as it appeared in that particular day. History is also available for Normalized Summary & Detail History (Currency) and is detailed in the Currency section above.
INDUSTRY CLASSIFICATIONS SOURCE / SCHEMA The sector/industry classification schema for I/B/E/S and Thomson ONE products presently are based upon:
• For U.S. companies follow the S&P scale for sector/industries/groups • For international companies the MSCI schema is used.
Future products will adopt the new proprietary Thomson Reuters Business Classification schema.
KEY PERFORMANCE INDICATORS Thomson Reuters offers Key Performance Indicators (KPIs) to quickly identify and retrieve analyst forecast information on key drivers within the retail, restaurant and pharmaceutical industries. These key performance indicators are industry-specific measures that facilitate comparisons among similar peer groups. Consensus and detail forecasts are available for Same Store Sales and Pharmaceutical Sales, including business segment and product breakdowns, enabling efficient comparisons between analysts’ expectations on these indicators and your own. Thomson Reuters collects and displays forecasted and reported industry-specific Key Performance Indicators on products including Thomson ONE Analytics and Thomson ONE Investment Management (under Security -> Estimates -> Detail – Single Period). Estimates data is available on both a detail analyst as well as summary mean level. Thomson Reuters also offers a Key Performance Indicators (KPI) datafeed collection of current detail and summary level estimates as well as actuals information. See “Glossary of Estimates Data Measures” section under “Product-Level Measures” for all KPIs collected.
MULTI LISTED SECURITIES Companies may enlist to trade on multiple exchanges or may have more than one share type trade on a common exchange. The Thomson Reuters estimates database will store forecast information for all listings covered by analysts. The primary listing is referred to as an “S” type Security (Instrument Type: S). This type of security’s I/B/E/S ticker will usually reflect the ticker used for trading on the local exchange, such as MSFT for Microsoft Corporation based in the US and traded on the NASDAQ exchange. It is usually the most liquid share class with the highest trading volume. In addition to the primary listing, companies may also have other listings including:
• Multiple Shares (Instrument Type M) • Multiple Listings/Inter-listed Securities (Canada Only) (Instrument Type D) • American Depository Receipts - ADR’s (Instrument Type A) • Combination of all Security Types • Dual Listed Companies
Multiple Share Classes (Instrument Type M) Please note: Presently, multiple share listings - indicated by Instrument Type M and having I/B/E/S Tickers with a slash “/” - are not displayed on Thomson Reuters platforms nor included in datafeeds such as I/B/E/S QFS & History.
21
Copyright 10/2009 Thomson Reuters. All rights reserved.
Multiple share classes of a company occur when more than one share class is traded for that company on the same exchange within the same country. The additional shares are referred to as multiple shares of the same equity. Multiple shares for companies are usually issued because:
• Different levels of voting rights are attached to each share class • There is a restriction within the market on foreign ownership and a secondary class is created for foreigners • The company wishes to increase the liquidity of its shares by adding share classes with small nominations • Other reasons as determined by the company
A multiple share of a company is added to the estimates database as a Multi Share listing (I/B/E/S Type: M). This type of security’s I/B/E/S ticker will always be the I/B/E/S ticker of the S type listing, with a slash “/” and a numeric digit suffix. For example, if the ticker for the S type listing of a company is @ALZ, the ticker for the M type listing will be @ALZ/1. If the numeric digit is greater than 9, then a letter is used in place of a numeric, for example: @ALZ/A.
Company Name Market Symbol I/B/E/S Ticker
I/B/E/S Type Exchange Country Exchange
Royal Dutch Shell RDSA.NL @RDN S NETHERLANDS Euronext Amsterdam Royal Dutch Shell RDSB.NL @RDN/1 M NETHERLANDS Euronext Amsterdam
Royal Dutch Shell plc has two classes of shares, "A" and "B" shares. "A" shares and "B" shares have identical rights except in relation to the source of dividend income where "A" shares have a Dutch source and "B" shares are intended to have a UK source. Source: www.unification.shell.com
• Unique tickers are created in the database for each share class – the primary share as type S and the additional share classes as type M (with a slash “/” in the ticker).
• All estimates forecasts (with the exception of price targets, DPS, and recommendations) are stored and displayed under the type S listing regardless of the listing sent by the contributor. Minority data are stored under the share class for which it was received and then copied over to the primary listing with the exception of Price targets, DPS, and recommendations.
Multi-listed Securities/Inter-listed Securities/Dual Listed Securities (Instrument Type D) A multi-listed/inter-listed security has the same class of shares listed on two different exchanges. Multi-listed securities are an additional listing of any security of the company, but are typically related to the primary listing. In this case, the company’s shares are listed on more than one stock exchange in two different geographic locations. Inter-listed securities are those listed on both Toronto Stock Exchange (TSX) and a US exchange, including the NASDAQ, AMEX or NYSE. Each inter-listed security has one CUSIP, is fungible, and can therefore be traded and cleared in either Canada or the US. A multi-listed/inter-listed security is added to the database as a D Type security under the same issuer name as the primary S type listing. The primary ticker is setup as an S type security and the secondary listing as a D type security. Example:
Company Name Market Symbol I/B/E/S Ticker
I/B/E/S Type Exchange Country Exchange Share Class
Royal Dutch Shell RDSA.NL @RDN S NETHERLANDS Euronext Amsterdam A Shares Royal Dutch Shell RDSA.GB @SHE D UNITED KINGDOM London Stock
Exchange A Shares
Company Name Market Symbol I/B/E/S Ticker
I/B/E/S Type Exchange Country Exchange
Barrick Gold RDSA.NL @RDN S NETHERLANDS Euronext Amsterdam Barrick Gold RDSA.GB @SHE D UNITED KINGDOM London Stock Exchange
Company Name Market Symbol I/B/E/S Ticker
I/B/E/S Type Exchange Country Exchange
Barrick Gold ABX.US ABXF S Canada TSX Barrick Gold ABX.CN ABX3 D USA NYSE
Copyright 10/2009 Thomson Reuters. All rights reserved.
• Unique tickers are created for each listing -- the listing on the local exchange as type S and the multi-listed/inter-listed as type D.
• Estimates are stored and displayed under the listing provided by the contributing broker. • Thomson Reuters platforms display both types of securities and feed files include data on both types of
securities. A dual-listed security is a Canadian company that trades on both the US and Canadian stock exchanges. In order to increase granularity of its data, Thomson Reuters uses the following method to capture estimate, recommendation and price target data for Canadian dual-listed companies.
• Thomson Reuters adds a secondary instrument or ticker for Canadian dual-listed companies when estimate data is received for both listings. In order to link the tickers, there are two types of securities: The primary security is denoted as type ‘S’ and the dual-listed security is denoted as type ‘D’.
• Duplicate identifiers (CUSIPS) exist since Canadian companies that trade both in Canada and the US share the same CUSIP, but carry a separate SEDOL for each exchange on which they trade. A CUSIP is a number identifying all stocks and registered bonds – Committee on Uniform Securities Identification Procedures. A SEDOL is a code which identifies a foreign stock that has a CUSIP number but does not trade in the U.S. – Stock Exchange Daily Official List.
• Thomson Reuters implements this process in a two-step approach in order to accommodate clients who currently use CUSIP as the identifier to load data. A second dual listed instrument is added and data is captured as received from contributing analysts. An artificial CUSIP is attached, which is the first seven digits of the primary listing and “X” as the last digit eg. 3748593X. The unique SEDOL for each listing is captured in the database in order to maintain correct pricing information.
• The second step requires that data file products be amended in order to adequately support duplicate CUSIPS. Once implemented, Thomson Reuters will continue to maintain the dual listed instruments by properly capturing data and attaching the correct CUSIP for both instruments. The correct digit will replace the artificial “X” once the long-term approach is implemented. At least three months notification will be provided to clients preceding any changes to the ID files.
• Thomson Reuters publishes estimates on whichever security a contributor provides estimates. If an analyst supplies forecasts under both securities then estimates/coverage will be made viewable on both securities. If the analyst supplies forecasts for one security, estimates will be displayed under that particular security and no other.
• Target Price will be the basis for determining which security is covered. For example, if an analyst sends their Target Price under the CAD listing yet supplies US estimates, Thomson Reuters will display coverage under the CAD security. Analyst’s have the ability to cover both listings as long as both target prices are supplied. The currency of estimates will have no determining factor on which listing an analyst covers. Dual-listed securities are shown in the exchange opposite of the primary security. For example, if the primary security is listed on the Canadian Exchange, the newly created security would be listed under the US Exchange.
Example of Dual-Listed Company: Canadian National Railway Local Tickers: U.S. – CNI Canada – CNR I/B/E/S Tickers: U.S. – CNI Canada – CN2 Thomson Reuters uses this policy on dual-listed companies due to the request of analysts. Analysts wish to show coverage with specific security. These methods allow analysts to forecast price targets for one or both securities. Having two separate securities increase granularity of data and allow for correct pricing information. It also allows for proper analyst ranking for each security. American Depository Receipts – ADR’s (I/B/E/S Type A) American Depository Receipts are listings for a foreign traded company on an American exchange. An ADR is a negotiable certificate issued by a U.S. bank representing a specified number of shares (or one share) in a foreign stock that is traded on a U.S. exchange. ADR’s are denominated in U.S. dollars, with the underlying security held by a U.S financial institution overseas, and help to reduce administration and duty costs on each transaction that would otherwise be levied. ADR’s make it easier for Americans to invest in foreign companies, due to the widespread availability of dollar-denominated price information, lower transaction costs, and timely dividend distributions.
23
Copyright 10/2009 Thomson Reuters. All rights reserved.
ADR’s are treated the same as US companies. If an ADR is covered by one of the Thomson Reuters contributing analysts, estimates are collected as well as actuals, and mean data is created based off the number of analysts included in the mean calculation. ADR’s are grouped, however, with US companies, and not by the countries of their local security. An ADR security is added to the I/B/E/S database as an A type security under the same issuer name as the primary S type listing. The primary ticker is setup as a type S and the secondary listing as a type A security. Example:
Company Name Market Symbol I/B/E/S Ticker
I/B/ES Type Exchange Country Exchange Share Class
Royal Dutch Shell RDSA.NL @RDN S NETHERLANDS Euronext Amsterdam A Shares Royal Dutch Shell RDS/A.US RD A USA NYSE A Shares
• Unique I/B/ES tickers are created for each listing - the listing on the local exchange as type S and the ADR as
type A. • Estimates are stored and displayed under the listing provided by the contributing broker. • All platforms display both types of securities and feed files include data on both types of securities.
Combination of All Security Types Some companies have a combination of different listing types including dual listings, multiple share classes and ADR's, as is the case for Royal Dutch Shell PLC. Example:
Company Name Market Symbol I/B/E/S Tickers
I/B/E/S Type Exchange Country Exchange Share Class
Royal Dutch Shell RDSA.NL @RDN S NETHERLANDS Euronext Amsterdam A Shares Royal Dutch Shell RDSB.NL @RDN/1 M NETHERLANDS Euronext Amsterdam B Shares Royal Dutch Shell RDSA.GB @SHE D UNITED KINGDOM London Stock
Exchange A Shares
Royal Dutch Shell RDSB.GB @SHE/1 M UNITED KINGDOM London Stock Exchange
B Shares
Royal Dutch Shell RDS/A.US RD A USA NYSE A Shares Royal Dutch Shell RDS/B.US RD/1 M USA NYSE B Shares
Thomson Reuters publishes estimates on whichever security a contributor provides estimates. If an analyst supplies forecasts under both securities then estimates/coverage will be made viewable on both securities. If the analyst supplies forecasts for one security, estimates will be displayed under that particular security and no other.
• Target Price will be the basis for determining which security is covered. For example, if an analyst sends their Target Price under the CAD listing yet supplies US estimates, Thomson Reuters will display coverage under the CAD security. Analyst’s have the ability to cover both listings as long as both target prices are supplied. The currency of estimates will have no determining factor on which listing an analyst covers. Dual-listed securities are shown in the exchange opposite of the primary security. For example, if the primary security is listed on the Canadian Exchange, the newly created security would be listed under the US Exchange.
PARENT / CONSOLIDATED INDICATOR Indicates whether the estimates of a company are carried (by Thomson Reuters) on a parent or consolidated basis. The way a company appears on the database is based on the majority of the earnings estimates received. Contributors are free to provide either parent or consolidated estimates for any given company. Using sales estimates as an example, consolidated sales estimates would be under SAL, whereas sales for parent company would be under SALPAR. The primary basis (either P or C) is determined by whichever is the majority basis.
24
Copyright 10/2009 Thomson Reuters. All rights reserved.
Consolidated Companies Companies are classified as consolidated when the earnings of the investee companies where the parent holds a 20% voting stake or more are combined with the earnings of the parent company, after elimination of inter-company transactions. Parent Companies Companies are classified as parent when only the earnings of the reporting entity, including dividends, interest, royalties, etc. received from its investee companies, are presented as net income. Companies Without Subsidiaries Companies without subsidiaries are classified as consolidated by default since a great majority of the markets adhere to the consolidated basis. Consolidated / Parent Companies If companies are carried in two-basis (Consolidated and Parent) and use a different calculation, a review and shifting of the affected measures are necessary to ensure that the majority and minority of broker submissions are stored in the right primary measures (Primary Parent/ Primary Consolidated) and secondary measures (Secondary Parent/ Secondary Consolidated). Switching the primary basis from secondary and vice versa is imperative when there is a significant drop or increase in either broker submission. Shifting Company Indicators The reason for the need to shift is that there are two main data products that are dependent on current collection:
• History- The detail history product only includes primary basis. Due to constraints it is imperative that the primary basis includes the majority of contribution.
• Global Aggregates- This product also offers history. If EPS history for primary basis is deleted/ removed/ relabeled calculations that includes these companies will be affected.
The switch from consolidated primary to parent primary or vice versa should be based on two main factors:
• Change in reporting standards/ actual availability - Availability of actual data for the basis identified as primary. When company does not have subsidiaries and no earnings to consolidate.
• Change in broker submission- when there is a shift in majority of basis brokers is sending their data. When a significant number of brokers are shifted to a different basis, the primary measure is shifted to the basis where the majority of the brokers are sending. The basis where the minority of the brokers are sending will be the new secondary measure. All measures for the same basis will be shifted all together. When equal contribution is submitted for both bases, the deciding factor should be the availability of the actuals for that company/market based on proposed/ reviewed and approved by the accounting board. When equal contributions are submitted for both bases and there is an actuals available for both bases as well, the company basis should remain as of the day of the review. When companies have minimal (1 or 2 contributor in the P/C status) difference in contribution and majority have shifted to a different basis, the current measures remain until a significant number of contributors have shifted. Significant number is considered as 60% if company has fewer than 8 estimates & 40% if it is has 9 estimates up.
PERIODICITY Periodicity is the frequency for which a company reports their full financial results. A company will have either a quarterly (QTR) periodicity, a semi annual (SAN) periodicity, or an annual (ANN) periodicity once it is established with the database and data is collected. Quarterly (QTR) periodicity is used when:
• Company reports full financial results quarterly;
25
Copyright 10/2009 Thomson Reuters. All rights reserved.
• Company reports full financial results semi annually, and contributors are making quarterly EPS or FFO estimates; and;
• Company reports full financial results annually and there are no contributors making interim estimates. Semi-Annual (SAN) periodicity is used when:
• Company reports full financial results semi annually, and contributors are not making quarterly EPS or FFO estimates. There are cases where contributors will supply quarterly sales estimates for companies that only report full financials semi annually. These sales estimates should not be used to determine the periodicity since it is not a shifting measure; and
• Company reports full financial results semi annually, and there are no contributors making interim estimates. Annual (ANN) periodicity is used when:
• Company reports full financial results every 12 months, and a period year consists of one annual. • A company’s periodicity should be set to the most frequent time interval based on one of the following: • The company report; or • EPS or FFO estimates periodicity supplied by contributors
Please note that quarterly periodicity is the most frequent interval used as the default periodicity when setting up new companies.
PRELIMINARY ESTIMATES When Thomson Reuters receives a contributor’s estimate, it goes through an extensive and thorough verification process prior to delivery to all estimates products to ensure accuracy and consistency. This value-added quality control process ensures estimates are of the highest quality and estimates are delivered to products in the quickest time possible, however there are times where this added level of process may affect the timeliness of estimates. As a solution for the most time-sensitive clients, Preliminary Estimates are available which combine real-time estimate availability, with an automated quality screening process. A Preliminary Estimate bypasses the manual portion of Thomson Reuters value-added quality control checks and verification tests – and is only subjected to limited automated verification tests. This data is then available in true real-time, enabling clients to view a contributor’s updated forecasts prior to the Thomson Reuters full verification, filtering and footnoting process. The majority of Preliminary Estimates will be followed by a ‘fully-verified’ estimate, which are subjected to all of Thomson Reuters quality control checks.
• Preliminary Estimates enable true real-time delivery to clients. • Preliminary Estimates are useful to any customers making investment decisions based on estimate revisions and
related time sensitive activity. • Preliminary estimates are currently being offered via the First Call Datalink feed, as well as Thomson ONE
Analytics and Thomson ONE Investment Management platforms. • First Call Datalink offers Preliminary Estimates for the following data measures: EPS, Sales, Cash Flow per
Share, Recommendations and Price Target. • Thomson ONE Analytics and Thomson ONE Investment Management offer Preliminary Estimates for all 26 data
measures. Please note that Preliminary Estimates are available in real-time after fielded receipt of estimate values from analysts (either once automated feeds/files are received from brokers, or once Thomson Reuters Market Specialists extract estimate values from PDF research documents.
PRICE FORECASTS In addition to publically traded companies, Thomson Reuters also collects forecasts on the price levels of commodities, as well as both bottom-up and top-down price forecasts on select indices. Commodity Price Forecasts Commodities are something that are relatively easily traded, that can be physically delivered, and that can be stored for a reasonable period of time. A common characteristic of commodities is that their prices are determined on the basis of an active market. Examples of commodities include metals, minerals, and energy sources such as crude oil, natural gas,
26
Copyright 10/2009 Thomson Reuters. All rights reserved.
aluminum, gold, diamonds, or silver. Sales and purchases of commodities are usually carried out under future contracts on exchanges, which standardize both the quantity and minimum quality of the commodity being traded. Commodity price forecasts are collected by Thomson Reuters if available from contributing analysts. Unique I/B/E/S tickers are created for each commodity with sell-side analyst estimates coverage and are set up as a Type “O” Instrument type. For a complete listing of all available commodity price forecasts, please reference the document “Thomson Reuters Top-Down Index & Commodity Price Forecasts”. Actuals Commodity price actuals are entered within 15 days of the end of the period by using the calculated average price of the preceding three (3) months period. Please note that this method is also used by the contributing analysts, who take the average closing price of the quarter to determine actuals, not the closing price at the end of the quarter.
Estimates Commodity price forecasts are based off spot prices and are entered using the same majority basis policy as estimates on companies. These estimates are sourced from the same sell-side analysts covering companies and related industries.
Index Price Forecasts Thomson Reuters collects and calculates price forecasts for a handful of US stock indices, most notably including the S&P500 and Dow Jones Industrial Average (DJIA). Unique I/B/E/S tickers are created for each index with sell-side analyst estimates coverage and are set up as a Type “I” Instrument type. For a complete listing of all available index price forecasts, please reference the document “Thomson Reuters Top-Down Index & Commodity Price Forecasts”. Two types of index price forecasts are available on Thomson Reuters; top-down, which are an average of market strategists’ forecasts, and bottom-up, which are aggregations of all analyst mean forecasts for each individual company in an index. Top-Down Estimates Index price forecasts are based off index prices and are entered using the same majority basis policy as estimates on individual companies. These detail estimates are sourced from sell side industry analysts, as well as market strategists who forecast based upon macroeconomic conditions, rather than individual company performance. All of these individual estimates are then averaged to create a mean (consensus) top down forecast. Bottom-Up Estimates In addition to Thomson Reuters collecting top-down forecasts from sell-side contributors, bottom-up forecasts are calculated as well. These forecasts are sourced from aggregating all of the individual mean estimates for each individual company in an index, and then weighted by market cap. The explicit bottom-up index forecasts calculation used by Thomson Reuters is as follows: Avg_eps = spi * total_cons_shares / total_price_shares
Where: Avg_eps = bottom-up index estimate displayed on products spi = price index value total_cons_shares = consensus eps * shares of each company of the Index total_price_share = price * shares of each company of the index Actuals The current policy for updating actuals for index estimates is to enter the bottom up calculated figure two quarters after the end of the period. Bottom-up estimates and actuals are calculated on a calendarized basis, in order to account for different fiscal year ends for companies and allow for comparison of companies regardless of fiscal period. The calendar quarter end is taken along with the month before and the month after to create a quarter number that allows companies with different fiscal periods to be compared against each other.
27
Copyright 10/2009 Thomson Reuters. All rights reserved.
Actuals Entry Schedule:
Quarter Period Ending Enter Actual Value on Q1 March 31 July 1 Q2 June 30 October 1 Q3 September 30 January 1 Q4 December 31 April 1
Calendarization Methodology:
Quarter Period Ending Q1 February, March, April Q2 May, June July Q3 August, September, October Q4 November, December, January (of next calendar year)
PRIORITIZATION Estimates and recommendations are researched and reviewed by Thomson Reuters Market Specialists to insure accuracy – prior to becoming available on products. Every revision is subject to a stringent quality control process – both before and after the data is available on products. If the accuracy or accounting basis cannot be verified by the data source alone, Thomson Reuters Market Specialists will further research the affected estimates/recommendations, by contacting the contributing analysts directly for clarification. It is however Thomson Reuters goal to deliver accurate and reliable estimate revisions as timely as possible. During peak times such as earning seasons, the added revision volume can sometimes cause slight delays. Thomson Reuters uses a rolling 'priority scheme' which gives higher priority to market movers, index constituents, higher market cap companies, companies in the news/reporting etc. – to ensure that estimate revisions for these types of companies are the first to be updated. All of the following would be considered as higher priorities when updating estimates; surprising earnings news, pre-announcements, reported earnings, S&P companies, market capitalization, major merger announcements/ completions and post-market prior day events (e.g., companies in the news to which the market has yet to react). Index Constituents tend to be considered market movers and therefore given priority over lesser-followed companies. For that reason, the mechanism is in place to highlight an index as a priority grouping. Please note that Preliminary Estimates are available in real-time after fielded receipt of estimate values from analysts – prior to the manual verification process. See Preliminary Estimates section for more details.
REASONS FOR CONTACT WITH CONTRIBUTING ANALYSTS All phone calls between Thomson Reuters Market Specialists and Contributors/IR Representatives are logged in a phone call database. Cases that would typically trigger Thomson Reuters to contact a contributor include but are not limited to:
• Quarterly estimates within the published research document do not add to the annual provided (indicating use of non-majority prior period actual).
• Quarterly or annual estimates received from a contributor (either via research or feed) which fail quality control tests and validations for accuracy, such as standard deviations, decimalization errors, etc.
• An accounting basis issue is identified within a contributor’s estimate or reported actual – contributor contacted and communicated what the ‘majority’ basis is using.
• A company issues guidance, and the contributor either does not update/confirm their estimate or it is outside of the guidance range.
• An estimate fails the Thomson Reuters Freshness Policy and a contributor is contacted to confirm/revise their estimates.
• A company announces a merger/acquisition/spinoff – a contributor is contacted for their post-event estimate.
28
Copyright 10/2009 Thomson Reuters. All rights reserved.
• A contributor’s estimates are not updated after a company reports their quarterly/annual results. • Pre-split estimates are provided in research, after a company has gone through a stock dividend or split of their
stock. • A company goes through a FYE change and the contributor sends numbers on the old FYE.
RECOMMENDATIONS Recommendation Mapping: Thomson Reuters I/B/E/S 1-5 Scale The Thomson Reuters I/B/E/S recommendation scale is as follows: 1 - Strong Buy 2 – Buy 3 – Hold 4 – Underperform 5 – Sell Each contributor determines how their individual recommendation scale maps to the Thomson Reuters I/B/E/S 5-point scale. Every firm, no matter if they have a 3-point scale or a dual-tiered system, must map their scale to the normalized 1-5 scale utilized by Thomson Reuters. The only stipulation being that the mapping requested must allow for negative to negative ratings, positive to positive ratings and neutral to neutral ratings when mapping to Thomson Reuters I/B/E/S 1-5 scale. A contributor using a 3-point scale of BUY, HOLD, SELL would not be allowed to have a mapping of 1,2,3 on the 1-5 Thomson Reuters Scale. Contributors are made aware that the 1-5 value will be calculated to create a mean and displayed across Thomson Reuters products. Please note that while contributors may have elaborate multi-tier recommendation scales, including both company and industry/sector ratings, all points in their scale must map back to the standardized Thomson Reuters I/B/E/S scale is 1-5. In cases of broker scales being greater than 5 points, multiple points in a broker’s scale may map back to a single point in the Thomson Reuters I/B/E/S scale. Recommendation Mapping: Impact on Products Clients viewing the Recommendations data measure, depending upon the product, can view analyst recommendations in multiple versions: • Contributor Text format – the actual text provided by the contributor • Normalized Text format – the corresponding text on Thomson Reuters normalized scale • Normalized Code format – the corresponding code on Thomson Reuters normalized scale
Contributor Text format is the exact recommendation language used by that specific contributing firm. Normalized Text and Code make the Contributor Text more consistent, by mapping the Contributor Text to Thomson Reuters standard 1-5 recommendation scale. It is the Normalized Codes which are used to calculate the Thomson Reuters Mean Recommendation. Recommendation Scale Changes If a contributor changes their recommendation scale, stops must be applied to the database to prevent false revisions, followed directly by new recommendations applied on the same day. When recommendation scale changes occur, Thomson Reuters Market Specialists work closely with the contributor to outline the implications, and make decisions on how the change should be represented, based on the guidelines Thomson Reuters uses in mapping contributor scales to the normalized scale. Note: Recommendation scale change requests received from contributors will be processed on a go-forward basis Recommendation Drops If a contributor drops coverage of a company, a stop is applied to the recommendation field. Additionally, if a contributor is “restricted” on the stock or has suspended their recommendation, a stop would be applied to the recommendation field.
29
Copyright 10/2009 Thomson Reuters. All rights reserved.
RESTATEMENT POLICY (ACTUALS) Thomson Reuters actuals restatement policy addresses the needs of two distinct sets of end users: those who prefer the actual data as it was initially reported and those who wish to view the company as it is constituted today.
• Thomson Reuters can restate actuals for any available measures; however the ones most commonly restated are EPS, Sales and FFO.
• Thomson Reuters will restate the quarterly figures for the current fiscal year, as well as the prior year’s actuals data to provide comparability. Thomson Reuters will not restate actual data for more than one year back.
• All other actuals data will be left as originally entered, to allow historical examination. • In all cases, footnotes will be entered to explain the basis of the modified figures. • Once a restatement has taken place, any existing estimates or new estimate submissions must use the restated
actual data: this ensures a proper apples-to-apples comparison among contributing analysts. If a contributor is not using the restated figure, a Thomson Reuters Market Specialist will contact the analyst to adjust to the restated basis, or will have their estimates footnoted and excluded from the mean for the fiscal year in question.
Examples of events that would require restatement include:
• Changes in the accounting basis • Classification of certain operations as discontinued • Sales and acquisitions of business lines
Example of company with restated actuals: Integrated Circuit Systems (ticker ICST) Restated EPS Actual: Q105 = 0.24R Accompanying Footnote: 11-Nov-04 SEP04Q Restated from 0.23 upward for accounting change *Thomson Reuters will only restate actuals after a company has officially made the restatement, and can be documented via a press release, or by confirmation of all the contributing analysts.
SHARE CLASS Default share class is determined by the majority of estimates submitted. Policies differ slightly for the US and International companies. U.S. 1. Determined by majority of coverage. 2. If there is not a majority of coverage, then defer to liquidity. 3. If liquidity is comparable then defer to the share class with the most voting rights. International 1. Determined by majority of coverage. 2. If there is not a majority of coverage, then defer to the share class with voting rights. *Only recommendations and target prices are affected by share class; all other estimates are generally available under the primary share class. Shares Outstanding Data Number of Shares Outstanding (NOSH) Current number of shares outstanding (NOSH) data is provided as a supplemental data item in I/B/E/S datafeeds as well as on Thomson ONE (Security->Overview->Snapshot). This data provided is based on the NOSH for the specific security (SEDOL-specific), and not on the consolidated/company level.
30
Copyright 10/2009 Thomson Reuters. All rights reserved.
Shares Outstanding Used in Per-Share Estimates The shares outstanding data, for per-share data measures, which is utilized in individual analyst’s detail estimates, and subsequently the summary level mean data, are all consolidated/company-specific data (it is not share class specific, like the NOSH data displayed on products is).
• The above is only for per-share measures. Exclusions would be Dividend Per Share and Price Targets, which would be based upon NOSH for the particular share class.
Example To illustrate, here is an example using Viacom:
• NOSH data would display 549.503m for VIAB, and VIAB/1 has 57.364m number of shares outstanding; each security showing security-specific shares outstanding.
• Analyst research reports, and subsequently estimates data, would show 607m number of shares outstanding; showing consolidated/company level shares outstanding.
STOP, FILTER AND DELETION SCENARIOS Stop - Results in a contributing analyst’s estimates no longer being displayed on products.
• The contributing analyst has dropped coverage. • The contributing analyst is “restricted” on the stock. • Estimate/recommendation has not been updated (confirmed or revised) for 180 days or more. • Recommendation / Target Price under review
Filter - Contributing analyst’s estimates are still displayed on products but are footnoted and excluded from the mean calculation.
• Estimate is on a different accounting basis than the majority of contributing analysts. • Estimate has not been confirmed or revised at the issuance of a company’s earnings guidance and it is either
outside of the guidance range or >5% of a single-point guidance value; applying only to the specific measure and period issued.
• Estimate is not on the majority basis pertaining to a corporate action or the estimate has not been updated to reflect a corporate action after the effective date.
• Quarterly estimates revised without a corresponding adjustment to the annual estimate (all other period estimates for the same year are filtered).
• Annual estimate revised without a corresponding adjustment to the quarterly estimates (all quarterly estimates for the same year are filtered).
• A Thomson Reuters Market Specialist has requested data verification and no response was received for more than 48 hours.
• Estimate is under review by the contributing analyst. • Estimate has not been updated (confirmed or revised) for 105 days or more. • After an actual is reported, an estimate is excluded from the mean if it is not or confirmed within 10 business days
of a prior-period reported actual. • Estimate is updated for post-Rights Issue prior to the ex-date.
Deletion - Estimate is removed from the database and history. The previous estimate becomes the current estimate.
• Incorrect estimate was entered into the database (only if verified by published research).
TAX RATES A quarterly estimate is only considered to be on a different basis with respect to taxes if some analysts are taxing the estimates and others are not. For example, if an analyst is not taxing their estimates and the other analyst is using a tax rate of 30%, those two estimates are on a different basis and one of them needs to be excluded from the mean calculation. On the other hand, if one analyst is using a tax rate of 20% and the other is using a tax rate of 33%, and there are no other basis issues, those estimates are on the same basis and should both be included in the mean.
31
Copyright 10/2009 Thomson Reuters. All rights reserved.
This holds true for an annual estimate as long as the analyst is using the same tax rate for the actuals that we are using. If the analyst is using a different tax rate for a reported period (different actual), then the annual estimate should be filtered. Any future quarters should remain unfiltered if they do not violate the quarterly rule above.
TREATMENT OF SMALL ESTIMATES REVISIONS Thomson Reuters accepts data from contributors to varying degrees of precision. Most contributors provide estimates to 2 or 3 decimal places. The following are scenarios under which small estimates revisions would be treated: Second Decimal Place
• An estimate revision that is less than 0.01, which does not result in a new value after rounding to the second decimal place, is treated as a confirmation of the existing estimate (i.e., it is not recorded in the Thomson Reuters I/B/E/S collection database as a revision and is not fed to products as a revision).
• An estimate revision that is less than 0.01 which does result in a new value after rounding to the second decimal place is treated as a revision and is fed to products as a revision.
Third Decimal Place (in effect since June 15, 2009)
• All estimates revisions that impact the third decimal place after rounding will now be recorded and fed to products as a revision, for select currencies, in order to provide additional estimates granularity for markets that are regularly impacted by very small revisions:
o Australian Dollar (AUD) o Japanese Yen (JPY) o Malaysian Ringgit (MYR) o New Zealand Dollar (NZD) o Singapore Dollar (SGD) o South African Rand (ZAR) o South Korean Won (KRW)
Scenario 1: New estimate differs from the current estimate by less than 0.01, but does not impact the second decimal place after rounding.
Example 1 – Not Impacting Second Decimal Place
In Example 1, the new estimate is treated as a confirmation on all products since the change does not impact the second decimal place after rounding. No subsequent revision dates change, but confirmation date is updated.
ANALYST’S ESTIMATE
3+ DECIMAL PLACE PRODUCTS (I/B/E/S QFS, I/B/E/S HISTORY,
REUTERS KNOWLEDGE, 3000 XTRA)
2 DECIMAL PLACE PRODUCTS (THOMSON ONE, FIRST CALL DATALINK)
New 0.244 03-Jun-2009 0.241 05-May-2009 03-Jun-2009 0.24 05-May-2009 03-Jun-2009
32
Copyright 10/2009 Thomson Reuters. All rights reserved.
Example 2 – Impacting Third Decimal Place - Select Currencies
In Example 2, the new estimate is treated as a revision on products displaying 3 decimal places since it is for one of the select currencies and it impacts the third decimal place after rounding. On products with 2 decimal places it appears as the same value since the second decimal place is not impacted, however the revision and confirmation dates are updated.
Scenario 2: new estimate differs from the current estimate by less than 0.01, but does impact the second decimal place after rounding.
Example 3 – Impacting Second Decimal Place
In Example 3, the new estimate is treated as a revision on all products since it impacts the second decimal place after rounding.
GLOSSARY OF ESTIMATES DATA MEASURES Product-Level Measures
Pharmaceutical Sales Pharmaceutical Sales represents the revenue associated with individual pharmaceutical drug unit products.
• Thomson Reuters collects reported company results and forecasted sales estimates on a quarterly and annual basis for pharmaceutical companies globally.
• Estimates data available on both a detail analyst as well as summary mean level.
ANALYST’S ESTIMATE
3+ DECIMAL PLACE PRODUCTS (I/B/E/S QFS, I/B/E/S HISTORY,
REUTERS KNOWLEDGE, 3000 XTRA)
2 DECIMAL PLACE PRODUCTS (THOMSON ONE, FIRST CALL DATALINK)
Pharmaceutical Sales Drug Manufacturers SAL PS Same Store Sales Retailers, Restaurants, Lodging SSS SS
33
Copyright 10/2009 Thomson Reuters. All rights reserved.
• Thomson Reuters links these drugs on multiple levels depending on the business relationship, chemical ingredients and purpose associated with each - allowing not only specific forecast data for each separate drug but also aggregate sales of generic ingredients and instances where global revenues are shared as a joint venture between companies.
Same Store Sales Same Store Sales represents a percentage sales growth for retail stores and restaurants that have been open for more than one year. Same Store Sales allows investors to decipher what portion of sales growth is due to true retail growth and what portion is due to new store openings.
• Thomson Reuters collects reported company results and sales growth forecasts on a monthly, quarterly and annual basis for North American companies.
• Estimates available on a store line as well as consolidated basis, where available. • Estimates data available on both a detail analyst as well as summary mean level. • Companies followed include discount retailers, department stores, specialty retailers, casual dining, quick serve
restaurants and more. Company-Level Measures
Data Measure Description
Primary Consolidated Code
Secondary Consolidated Code
Primary Parent Code
Secondary Parent Code
Book Value Per Share BPS SBP BPSPAR SBPPAR Capital Expenditure CPX SPX CPXPAR SPXPAR Cash Flow Per Share CPS SCP CPSPAR SCPPAR Dividend Per Share DPS Earnings Before Interest & Taxes (EBIT) EBI SBI EBIPAR SBIPAR Earnings Before Interest, Taxes, Depreciation & Amortization (EBITDA) EBT SBT EBTPAR SBTPAR Earnings Per Share EPS SEP EPSPAR SEPPAR Earnings per Share - Alternate EPX Earnings per Share - Before Goodwill EBG SBG EBGPAR SBGPAR Earnings per Share - Cash CSH SCS CSHPAR SCSPAR Earnings per Share - Fully Reported / GAAP GPS SGP GPSPAR SGPPAR EBITDA Per Share EBS SEB EBSPAR SEBPAR Enterprise Value ENT SNT ENTPAR SNTPAR Funds From Operations Per Share FFO SFO FFOPAR SFOPAR Gross Profit Margin GRM SGM GRMPAR SGMPAR Long Term Growth Rate (%) LTG Net Asset Value NAV SAV NAVPAR SAVPAR Net Debt NDT SND NDTPAR SNDPAR Net Income NET SNI NETPAR SNIPAR Operating Profit OPR SOP OPRPAR SOPPAR Pre-tax Profit PRE SPR PREPAR SPRPAR Price Target PTG Recommendation REC Return on Assets (%) ROA SOA ROAPAR SOAPAR Return on Equity (%) ROE SOE ROEPAR SOEPAR Revenue SAL SSA SALPAR SSAPAR *While EPS, Revenue, Price Target and Recommendations are the most popular measures contributed, analysts are free to contribute forecasts for any or all of the collected data metrics specified above. Thomson Reuters doesn’t require any minimums in terms of collected data measures, and is willing to accept all metrics a broker provides. *For companies followed on both a parent and consolidated basis (see the Parent/Consolidated Indicator section), both Primary and Secondary data measures are available. The markets where two-basis measures are usually available include India, Japan, South Korea, Taiwan, and Thailand.
34
Copyright 10/2009 Thomson Reuters. All rights reserved.
Book Value per Share (BPS) A company's common stock equity as it appears on a balance sheet equal to total assets minus liabilities, preferred stock, and intangible assets such as goodwill, divided by the weighted average number of total shares outstanding for the year. This is how much the company would have left over in assets per share after all debts are paid, if it went out of business immediately. Thomson Reuters provides both expected and actual BPS data (where available). Capital Expenditure (CPX) Funds used by a company to acquire or upgrade physical assets such as property, industrial buildings, or equipment or the amount used during a particular period to acquire or improve long term assets such as property, plant, or equipment. Thomson Reuters provides both expected and actual CPX data (where available). Cash Flow per Share (CPS) Cash Flow per Share is a corporation’s cash flow from operations, before investing and financing activities, divided by the weighted average number of common shares outstanding for the year. Investing includes the sale or purchase of land, factories, buildings etc.
• Financing includes dividend payments, loan proceeds and sale of stock. Thomson Reuters provides both expected and actual CPS data (where available).
• Interest payments are an operating activity. • Thomson Reuters CPS is a company’s Operating Cash Flow. The basic formula is Operating Cash flow less
maintenance capital = Distributable Cash flow per unit. • CPS is generally calculated after-tax. • Thomson Reuters does not have DCFPU (Distributable Cash Flow per Unit) as a measure. This is something to
consider as an industry specific measure as well as payout ratio. If the company does not provide operating cash flow, Thomson Reuters will collect the DCFPU estimate and place it in the CPS filtered with "A" for accounting difference.
Dividend per Share (DPS) DPS are a corporation’s common stock dividends on an annualized basis, divided by the weighted average number of common shares outstanding for the year. In the US dividend per share is calculated before withholding taxes (though for some non-US companies DPS is calculated after withholding taxes). Thomson Reuters provides both expected and actual DPS data (where available).
• Thomson Reuters DPS is equivalent to Cash Distribution (not the same as Distributable Cash Flow per Unit.) • For DPS estimates a “0” is a valid estimate, indicating no expected dividend payment for a company. The
absence of any estimate or a “stopped” estimate indicates that a contributor does not have any DPS estimate. Earnings per Share (EPS) Valuation earnings per share, defined as the EPS that the contributing analyst considers to be that with which to value a security. This figure may include or exclude certain items depending on the contributing analyst’s specific model. Estimates that are not on the majority basis for a given security are displayed on certain Thomson Reuters products but filtered from the mean calculation. Thomson Reuters provides both expected and actual EPS data where available. Earnings per Share - Alternate (EPX) Alternate EPS is a corporation’s net income from continuing operations, divided by the weighted average number of shares outstanding. This measure tracks the estimates of contributing analysts who wish to forecast EPS on the non-majority basis. This alternate basis is not included in the mean calculation; it is filtered from the main EPS data measure. This data measure therefore, will not have corresponding Summary-Level (mean), nor actuals data. Earnings per Share - Before Goodwill (EBG) EBG measures a company’s per share earnings before the amortization of goodwill. In some countries (France, for example) goodwill is treated as a part of ordinary income for companies and the amortized component of goodwill is added back to yield earnings before goodwill amortization. EBG is a corporation’s net income from continuing operations before goodwill amortization divided by the weighted average number of shares outstanding. Thomson Reuters provides both expected and actual EBG data (where available).
35
Copyright 10/2009 Thomson Reuters. All rights reserved.
• Due to the implementation of International Financial Reporting Standards (IFRS) in various European countries, goodwill will no longer be amortized but instead written off as an impairment charge and will be treated as an exceptional item. This change eliminates the necessity for a separate EBG measure for companies residing in those countries. In such markets, Thomson Reuters will only collect and display EPS and GPS (valuation EPS and fully-reported EPS).
Earnings per Share - Cash (CSH) Cash Earnings Per Share is a company’s net income, plus depreciation, amortization of goodwill, intangibles, and prepaid assets (non-cash items); divided by weighted average number of shares outstanding. Thomson Reuters provides both expected and actual CSH data (where available). Earnings per Share – Fully Reported / GAAP (GPS) Statutory or reported earnings per share, defined as net profit (on continuous activities) divided by the weighted average number of shares outstanding during the period. Where a company carries exceptional items or goodwill amortization, this measure is post-exceptional, post-goodwill. Thomson Reuters provides both expected and actual GPS data (where available). In North America this figure is referred to as GAAP Earnings per Share and is calculated according to Generally Accepted Accounting Principles (GAAP), which is reported in SEC filings. The mean estimate for the GPS data measure will only reflect the strict adaptation of GAAP basis estimates. Estimates from contributors on an adjusted GAAP basis will be displayed but footnoted and filtered from the mean, even if the adjusted basis is the majority. A-type footnotes will include as much information as possible regarding the difference in accounting basis from the strict GAAP basis. This policy may result in the majority of estimates being filtered under GPS if the majority basis is an adjusted GAAP basis. In countries that have adopted International Financial Reporting Standards (IFRS) this figure will include all items according to IFRS rules. EBIT / Earnings Before Interest & Taxes (EBI) EBIT represents the earnings of a company before interest expense and income taxes paid. As such, EBIT is a gauge of corporate earnings before any debt servicing to creditors (including bondholders) and the payment of corporate taxes. It is calculated in general form by taking the pretax corporate income of a company, adding back interest expense on debt, and subtracting any interest capitalized. Thomson Reuters provides both expected and actual EBIT data (where available).
• Displayed in whole number terms (millions). • In certain European and Asian markets, EBIT is calculated as total sales and subtracting total costs and
operating expenses. In these cases EBIT will be similar to Operating Profit. EBITDA / Earnings Before Interest, Taxes, Depreciation & Amortization (EBT) EBITDA gauges the raw earnings power of a company before debt servicing, corporate taxes, and any allowances made for depreciation and amortization costs the company faces. It is calculated in general form by taking the pretax corporate income of a company, adding back any depreciation and amortization costs charged, plus any interest expense on debt (subtracting any capitalized interest). Thomson Reuters provides both expected and actual EBITDA data (where available).
• Displayed in whole number terms (millions). • In the United Kingdom, the general market standard is to include royalties as part of gross revenue, net of royalty
tax. This tax portion would be included as part of the royalties, and would therefore be deducted before EBITDA, rather than as part of the income taxes lower down the income statement.
EBITDA per Share (EBS) EBITDA per share represents EBITDA divided by the weighted average number of shares outstanding. Thomson Reuters provides both expected and actual EBS data (where available). Enterprise Value (ENT) Enterprise Value is calculated as market capitalization plus debt, minority interest and preferred shares, minus total cash and cash equivalents. Cash equivalents are defined as an item on the balance sheet that reports the value of a
36
Copyright 10/2009 Thomson Reuters. All rights reserved.
company's assets that can be converted into cash immediately. Examples of cash and equivalents are bank accounts, marketable securities and Treasury bills. An Enterprise Value actual is calculated using the closing price at the end of the fiscal period. Thomson Reuters provides both expected and actual ENT data (where available). Funds from Operations per Share (FFO) A measure used by real estate and other investment trusts to define the cash flow from trust operations. It is earnings with depreciation and amortization added back. A similar term increasingly used is Funds Available for Distribution (FAD), which is FFO less capital investments in trust property and the amortization of mortgages. Thomson Reuters provides both expected and actual FFO data (where available). Gross Margin (Gross Profit Margin) (GRM) A company's total sales revenue minus cost of goods sold, divided by the total sales revenue, expressed as a percentage. Thomson Reuters provides both expected and actual GRM data (where available). Long Term Growth Rate (%) (LTG) The long term growth rate represents an expected annual increase in operating earnings over the company’s next full business cycle. These forecasts refer to a period of between three and five years, and are expressed as a percentage. Long term growth rate forecasts are received directly from contributing analysts; they are not calculated by Thomson Reuters. While different analysts apply different methodologies, the Long Term Growth Forecast generally represents an expected annual increase in operating earnings over the company’s next full business cycle. In general, these forecasts refer to a period of between three to five years. Due to the variance in methodologies for Long Term Growth calculations, Thomson Reuters recommends (and uses as its default display) the median value for Long Term Growth Forecast as opposed to the mean value. The median value (defined as the middle value in a defined set of values) is less affected by outlier forecasts. Net Asset Value (NAV) Net Asset Value is the total book value of a company’s securities. It is calculated in general form by taking the total assets of a company and subtracting the value of the company’s intangible assets (goodwill, patents, etc.) minus current and long-term liabilities. NAV is helpful in determining under-priced equities by indicating the ultimate value of a company’s securities in the event of their liquidation. Thomson Reuters provides both expected and actual NAV data (where available).
• Displayed in whole number terms (millions). • As NAV is not a measure companies generally report in filings or press releases, Thomson Reuters calculates
NAV actual data as total shareholders equity including minority share or total assets minus total liabilities. Net Debt (NDT) Net Debt is calculated as short and long term interest bearing debt minus cash (and equivalents). Thomson Reuters provides both expected and actual NDT data (where available). Please note the examples below: Rule: If debt is greater than cash, the value collected will be a positive number in the database. From the balance sheet. Cash and Equivalents $175 Short and Long Term Debt $400 Net Debt = $400 – 175 NDT = $225 Rule: If debt is less than cash then the value collected will be a negative number in the database. From the balance sheet. Cash and Equivalents $300 Short and Long Term Debt $250 Net Debt = $250 – 300 NDT = ($50)
37
Copyright 10/2009 Thomson Reuters. All rights reserved.
Net Income (NET) Net income is defined as a corporation’s after-tax income. This item varies significantly from market to market as regards the inclusion or exclusion of non-recurring items. In most markets, non-recurring items are backed out of net income and this measure is restricted to income from continuing operations only (also referred to as normalized income). Some markets (Japan, for example) apply reported net income, including any and all extraordinary items. Recent accounting changes in still other markets (particularly Southeast Asia) have resulted in a reclassification of extraordinary versus exceptional items, bringing many formerly extraneous items above the net income line. Thomson Reuters provides both expected and actual NET data (where available). Operating Profit (OPR) Operating Profit is the difference between a company’s revenues and its costs and expenditures arising directly out of a company’s regular operations. Operating Profit is calculated before any deductions in income owing to non-operating activities (generally such items as interest expense, corporate tax payments, material gains or losses arising from changes in accounting policy, and the like) and excludes any income derived from outside the firm’s regular activities. Thomson Reuters provides both expected and actual OPR data (where available).
• Displayed in whole number terms (millions). • In certain European and Asian markets, EBIT is calculated as total sales and subtracting total costs and
operating expenses. In these cases EBIT will be similar to Operating Profit. Pre-Tax Profit (PRE) Pre-tax profit is a company’s net income before tax expense. Where applicable, extraordinary items and non-recurring charges are subtracted from net income. Thomson Reuters provides both expected and actual PRE data (where available).
• In Japan, companies compliant with Japan Accounting Standards use Recurring Profit. Price Target (PTG) Price target is the projected price level forecasted by the analyst within a specific time horizon. Note that while detail-level data can be collected for various time horizons, Thomson Reuters summary-level mean data is only calculated for targets with 12-month time horizons. Recommendation (REC) The recommendation value reflects the contributing analyst’s rating for a particular company. Return on Assets (ROA) Return on Assets is a profitability ratio and as such gauges the return on investment of a company. Specifically, ROA measures a company’s operating efficiency regardless of its financial structure (in particular, without regard to the degree of leverage a company uses) and is calculated by dividing a company’s net income prior to financing costs by total assets. Thomson Reuters provides both expected and actual ROA data (where available). • Displayed as a percentage. Return on Assets is calculated as follows:
sTotalAssetAverageIncomeNet
Assets)on (Return ROA =
Return on Equity (ROE) Return on Equity is another profitability ratio, which gauges return on investment by measuring how effectually the company is employing stockholder money. ROE is calculated by dividing a company’s net income by total equity of common shares. Unlike ROA, ROE does consider the degree to which a company uses leveraging, as interest expense paid to creditors is generally deducted from earnings to arrive at Net Income. Thomson Reuters provides both expected and actual ROE data (where available).
38
Copyright 10/2009 Thomson Reuters. All rights reserved.
• Displayed as a percentage. Return on Equity is calculated as follows: