47
Methods and tools for assessing poverty reduction benefits The Center for Climate Strategies and Grantham Research Institute LEDS GP October 14, 2015
| Date post: | 13-Dec-2015 |
| Category: |
Documents |
| Upload: | ethelbert-hunt |
| View: | 215 times |
| Download: | 0 times |

Methods and tools for assessing poverty reduction benefits
The Center for Climate Strategies and Grantham Research Institute
LEDS GPOctober 14, 2015
1. INTRODUCTION AND APPROACHContext, goals, techniques

Session Overview
CONTEXTCONCEPTS• TABLE
DISCUSSIONS
TECHNIQUES• TABLE
DISCUSSIONS
COUNTRY EXAMPLE

ContextEconomic hardship
Local and global recession
Divisions within government, lack of national vision
Distraction with other priorities
Limitations on capacity and knowledge
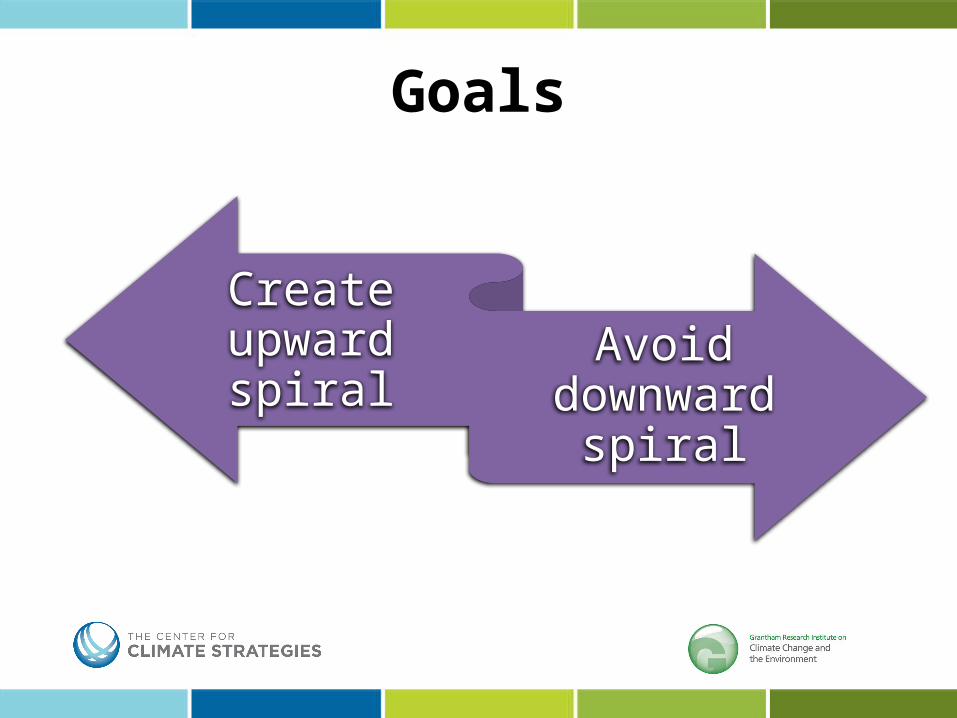
Goals
Create upward spiral Avoid
downward spiral

Ingredients
Reduce Poverty
Target distribution
Improve employment
Improve income

Upward SpiralSustainable growth, income, jobs
Controllable costs, prices
Evolution from primary to secondary, tertiary production
Imports to exports
Reduced secondary or hidden costs
Creation of value and influx of currency
Targeted, reliable reinvestment
Fewer divisions of wealth, better middle class

ConceptsEconomic, energy, environment, equity (E4) are linked
Policy actions and jobs/income are linked
Policies can be chosen and designed to improve economic conditions
Policies can be tested quantifiably
Not all policy actions or designs perform well
Distribution of costs/benefits is a driver

Macroeconomic StrategiesCost effective
approaches increase economic efficiency
and expansion
Energy savings cut energy costs,
stimulate labor investment
Shifts to indigenous vs. imported
resources cut job outflows
Actions supported by local supply chains cut job
outflows
New investment from outside sources stimulates labor
investment at home
Labor intensive activities create more jobs, even if at higher
cost (up to a point)
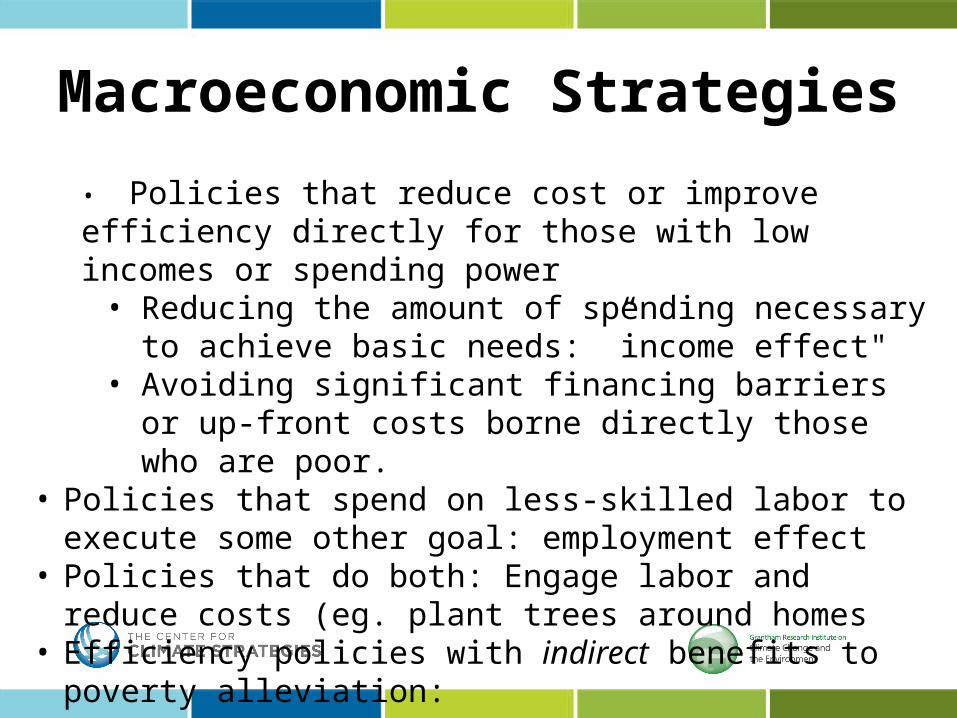
Macroeconomic Strategies
• Policies that reduce cost or improve efficiency directly for those with low incomes or spending power
• Reducing the amount of spending necessary to achieve basic needs: ”income effect"
• Avoiding significant financing barriers or up-front costs borne directly those who are poor.
• Policies that spend on less-skilled labor to execute some other goal: employment effect
• Policies that do both: Engage labor and reduce costs (eg. plant trees around homes
• Efficiency policies with indirect benefits to poverty alleviation:
Evidence of Success• Country examples…

USA State, by Sectors/Options
Jobs, Agriculture Income, Energy Efficiency
Opportunities for Labor Markets• ‘Green jobs’ • Switch to more labour-intensive technologies
and processes• More aggregate demand• More innovation• Co-benefits, especially better health: good for
welfare, labour supply, cognitive development• Reduced labor taxes
Key Issues for Labor Market Analysis• ‘Green jobs’ difficult to define• Much scope for gross job creation in the transition to
green growth• But policy-makers seeking co-benefits should focus on
net job creation• Studies for high-income countries not necessarily a
good guide for developing countries• Economy-wide macro responses (e.g. impact on
general level of wages) need to be understood
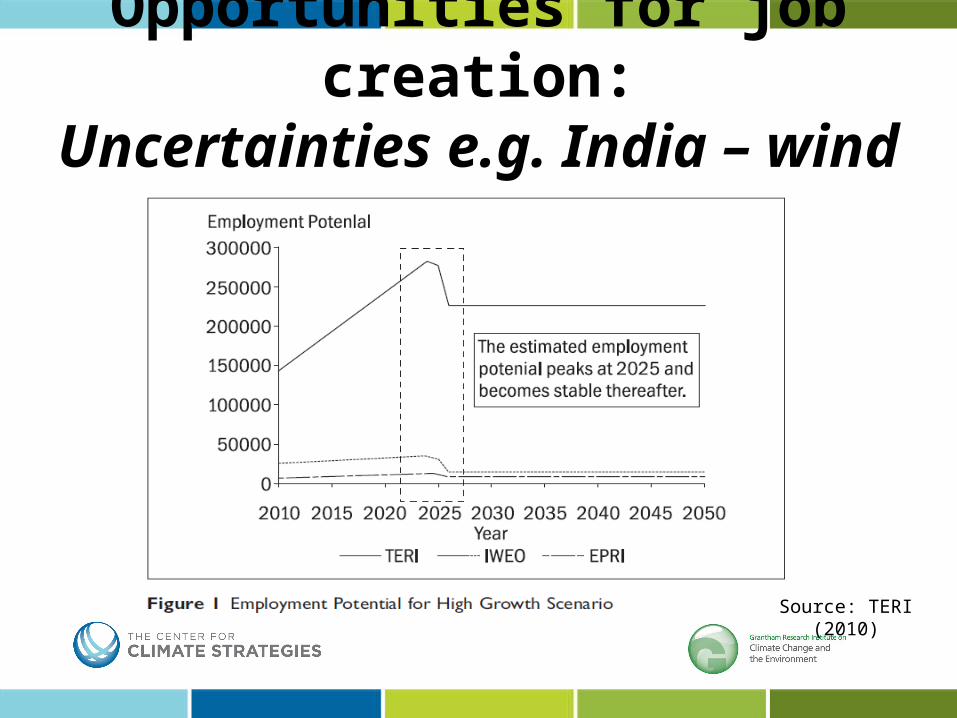
Opportunities for job creation:Uncertainties e.g. India – wind energy
Source: TERI (2010)

Opportunities for Job Creation:Net vs. Gross e.g. South Africa
Source: Rutovitz (2011)
Challenges for Labor Markets
17
• ‘Brown jobs’• Higher production costs• Lower real wages?• Skill bottlenecks• Need for good government and well-designed,
credible policies for the environment, skill development, innovation and fairness
• Active labor market policies
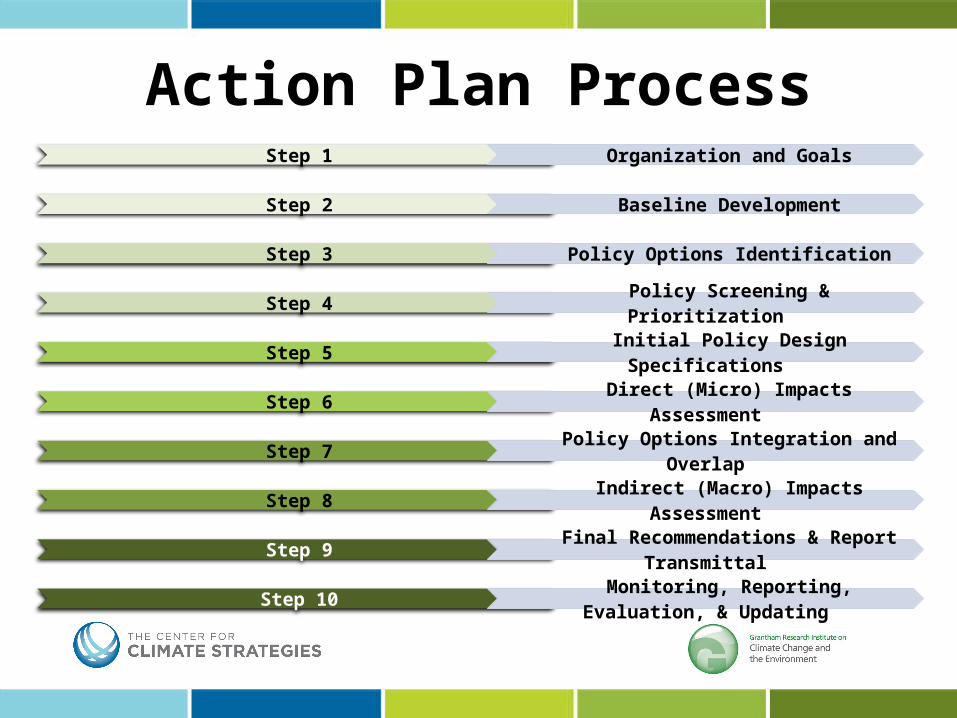
Action Plan ProcessStep 1 Organization and Goals
Step 2 Baseline Development
Step 3 Policy Options Identification
Step 4 Policy Screening & Prioritization
Step 5Initial Policy Design
Specifications
Step 6Direct (Micro) Impacts Assessment
Step 7Policy Options Integration and
Overlap
Step 8Indirect (Macro) Impacts Assessment
Step 9Final Recommendations & Report
Transmittal
Step 10Monitoring, Reporting,
Evaluation, & Updating
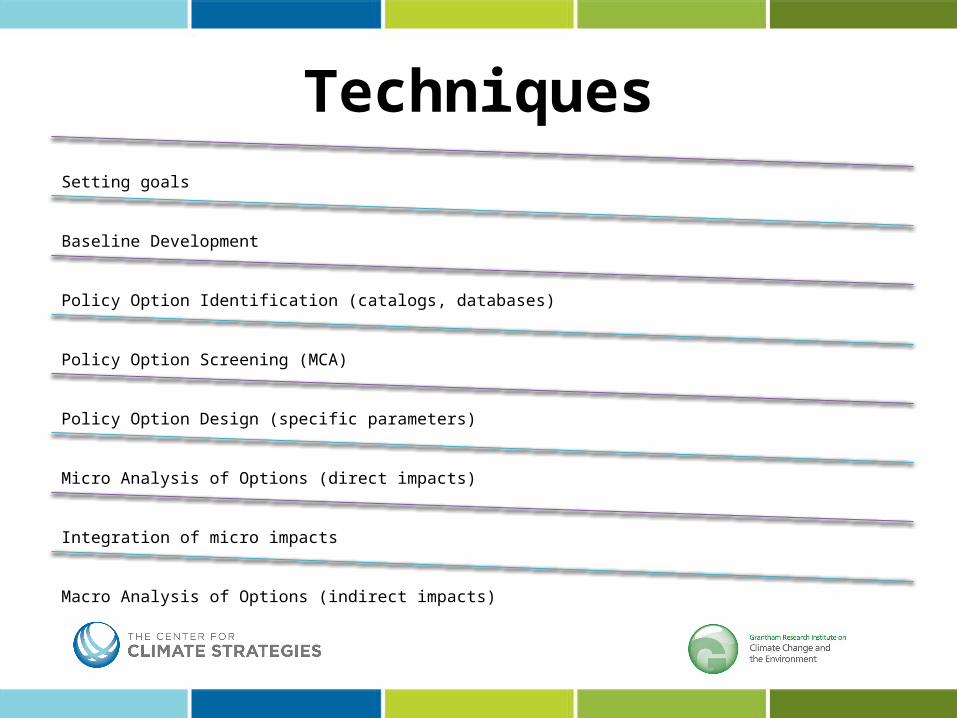
TechniquesSetting goals
Baseline Development
Policy Option Identification (catalogs, databases)
Policy Option Screening (MCA)
Policy Option Design (specific parameters)
Micro Analysis of Options (direct impacts)
Integration of micro impacts
Macro Analysis of Options (indirect impacts)
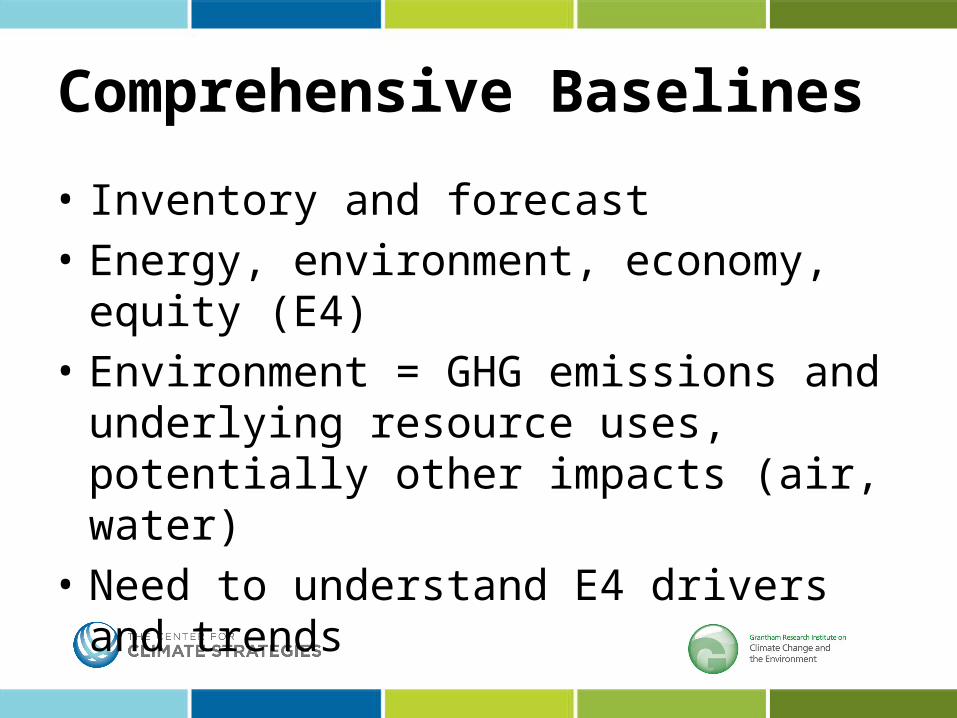
Comprehensive Baselines
• Inventory and forecast • Energy, environment, economy, equity (E4)• Environment = GHG emissions and underlying
resource uses, potentially other impacts (air, water)
• Need to understand E4 drivers and trends

Poverty Metrics• Macroeconomic
– Per capita income– Employment – Economic growth– Prices
• Equity– Breakdowns by income, age, gender, social strata,
location, vocation, business size/class, etc.– Distribution

Policy Options
• Full range of potential policies and measures within and across sectors
• Relevant to goals, policy action, and place• Examples from existing programs• Enhancements and innovations• Inside and outside jurisdiction • Winning strategies for poverty reduction

Table Discussion/Exercise 1How would poverty reduction be incorporated into each of these initial steps for LEDS in your country?
– National vision?– Agency priorities?– Leadership commitments in agencies and above?– Interagency planning mechanisms?– Baselines?– Existing building block policies related to LEDS?– Scoping of new LEDS options?– Stakeholder awareness of LEDS/green growth actions? – Tools for micro and macroeconomic analysis and planning?
2. OPTION SCREENING AND DESIGNMulti Criteria Analysis, Macroeconomic Design of Options
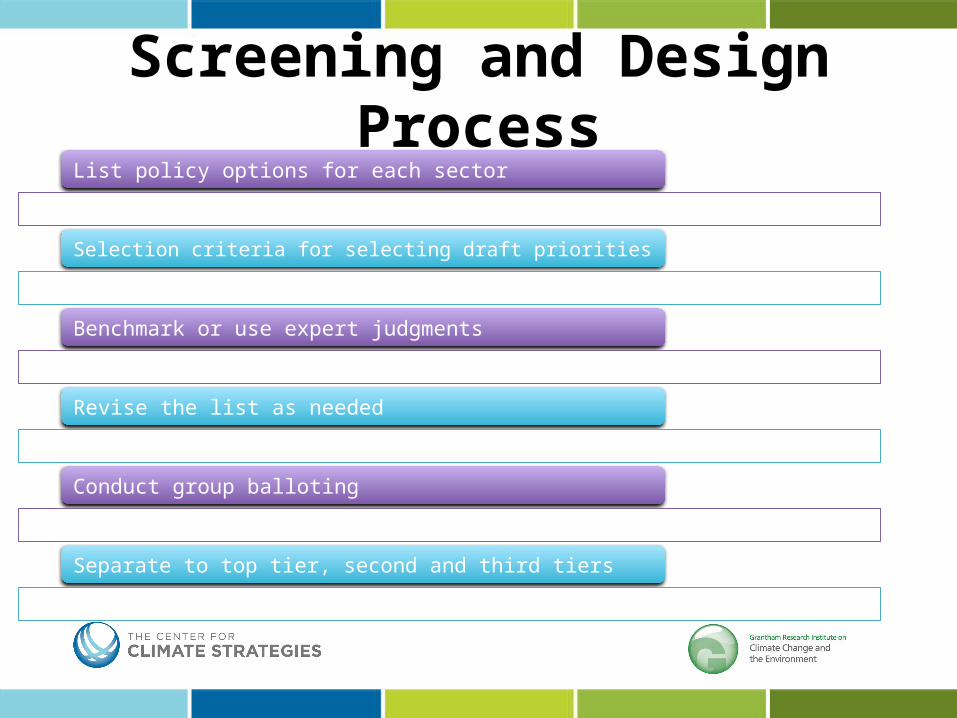
Screening and Design ProcessList policy options for each sector
Selection criteria for selecting draft priorities
Benchmark or use expert judgments
Revise the list as needed
Conduct group balloting
Separate to top tier, second and third tiers
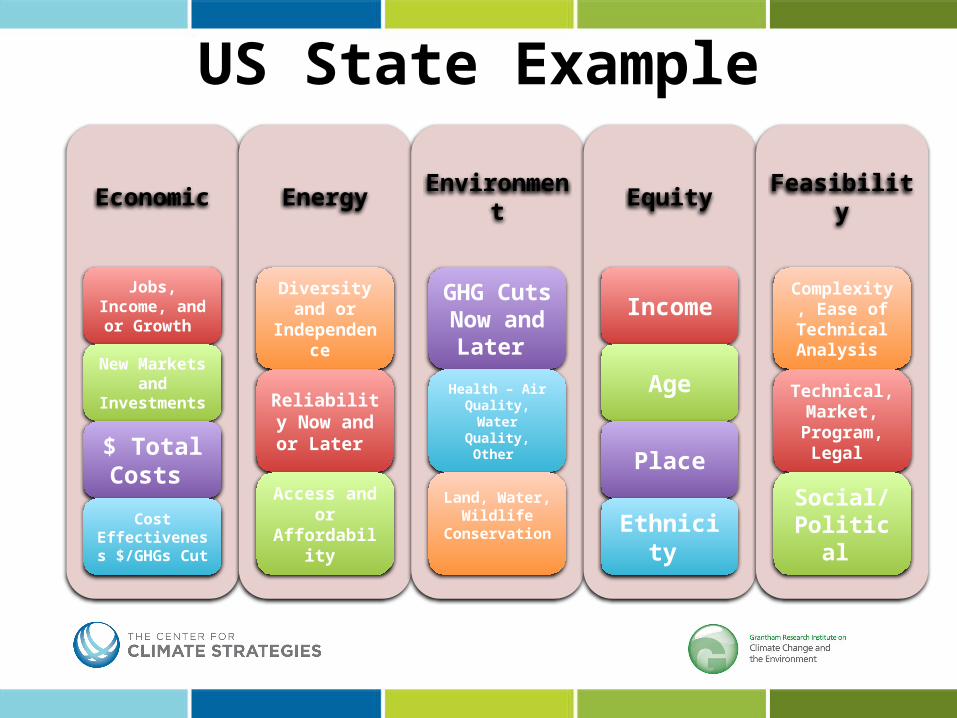
US State Example
Economic
Jobs, Income, and or Growth
New Markets and
Investments
$ Total Costs
Cost Effectiveness $/GHGs Cut
Energy
Diversity and or
Independence
Reliability Now and or Later
Access and or
Affordability
Environment
GHG Cuts Now and Later
Health – Air Quality, Water
Quality, Other
Land, Water, Wildlife
Conservation
Equity
Income
Age
Place
Ethnicity
Feasibility
Complexity, Ease of
Technical Analysis
Technical, Market,
Program, Legal
Social/Political
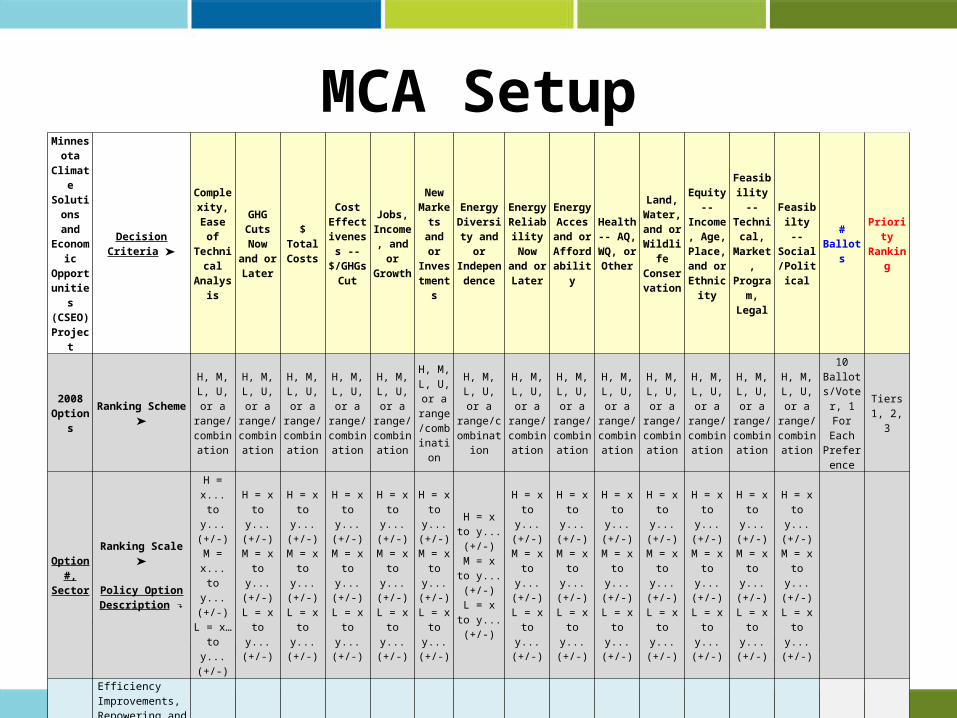
MCA SetupMinnesota Climate Solutions
and Economic Opportun
ities (CSEO) Project
Decision Criteria ➤
Complexity, Ease
of Technical Analysis
GHG Cuts Now and or Later
$ Total Costs
Cost Effectiven
ess -- $/GHGs
Cut
Jobs, Income, and or
Growth
New Markets and or
Investments
Energy Diversity
and or Independe
nce
Energy Reliability Now and or Later
Energy Acces and or
Affordability
Health -- AQ, WQ, or Other
Land, Water, and or
Wildlife Conservat
ion
Equity -- Income,
Age, Place, and or
Ethnicity
Feasibility --
Technical, Market,
Program, Legal
Feasibilty --
Social/Political
# Ballots Priority Ranking
2008 Options Ranking Scheme ➤
H, M, L, U, or a
range/combinatio
n
H, M, L, U, or a
range/combinatio
n
H, M, L, U, or a
range/combinatio
n
H, M, L, U, or a
range/combinatio
n
H, M, L, U, or a
range/combinatio
n
H, M, L, U, or arange/combinat
ion
H, M, L, U, or a
range/combination
H, M, L, U, or a
range/combinatio
n
H, M, L, U, or a
range/combinatio
n
H, M, L, U, or a
range/combinatio
n
H, M, L, U, or a
range/combinatio
n
H, M, L, U, or a
range/combinatio
n
H, M, L, U, or a
range/combinatio
n
H, M, L, U, or a
range/combinatio
n
10 Ballots/V
oter, 1 For Each Preferenc
e
Tiers 1, 2, 3
Option #, Sector
Ranking Scale ➤
Policy Option Description ↴
H = x... to y... (+/-)
M = x... to y... (+/-)L = x… to y... (+/-)
H = x to y... (+/-)M = x to y... (+/-)L = x to y... (+/-)
H = x to y... (+/-)M = x to y... (+/-)L = x to y... (+/-)
H = x to y... (+/-)M = x to y... (+/-)L = x to y... (+/-)
H = x to y... (+/-)M = x to y... (+/-)L = x to y... (+/-)
H = x to y... (+/-)M = x to y... (+/-)L = x to y... (+/-)
H = x to y... (+/-)
M = x to y... (+/-)
L = x to y... (+/-)
H = x to y... (+/-)M = x to y... (+/-)L = x to y... (+/-)
H = x to y... (+/-)M = x to y... (+/-)L = x to y... (+/-)
H = x to y... (+/-)M = x to y... (+/-)L = x to y... (+/-)
H = x to y... (+/-)M = x to y... (+/-)L = x to y... (+/-)
H = x to y... (+/-)M = x to y... (+/-)L = x to y... (+/-)
H = x to y... (+/-)M = x to y... (+/-)L = x to y... (+/-)
H = x to y... (+/-)M = x to y... (+/-)L = x to y... (+/-)
ES 3
Efficiency Improvements, Repowering and Up Grades to Existing Plants
ES Increase RES
ES Increase Solar Standard
ES/RCII111(d) Scenario (Including Price and Non-Price Mechanisms)
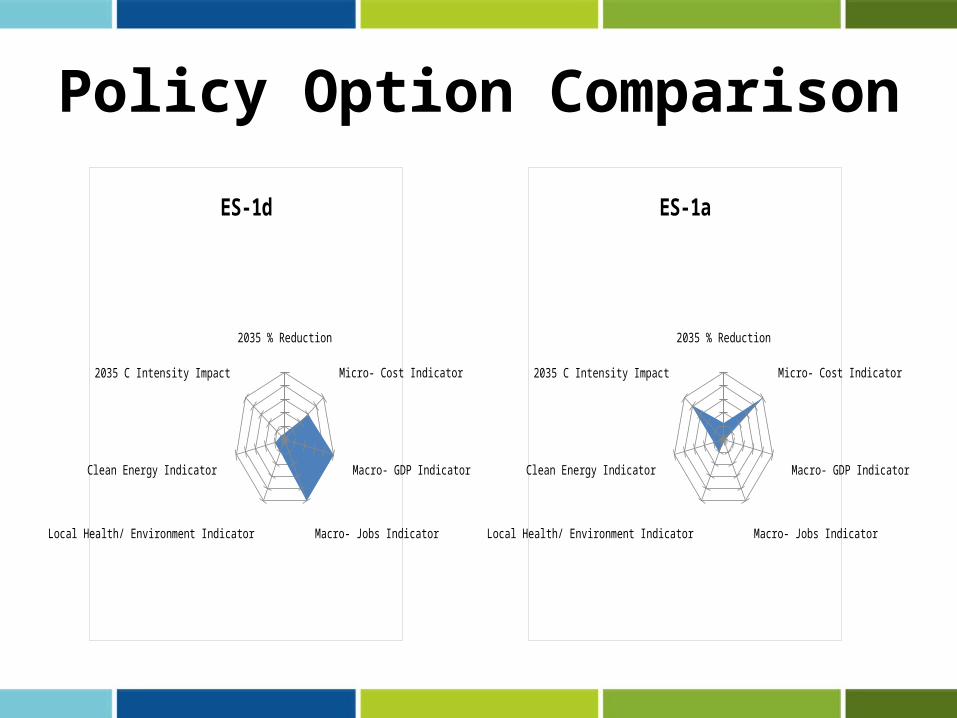
Policy Option Comparison
2035 % Reduction
Micro- Cost Indicator
Macro- GDP Indicator
Macro- Jobs IndicatorLocal Health/ Environment Indicator
Clean Energy Indicator
2035 C Intensity Impact
ES-1d
2035 % Reduction
Micro- Cost Indicator
Macro- GDP Indicator
Macro- Jobs IndicatorLocal Health/ Environment Indicator
Clean Energy Indicator
2035 C Intensity Impact
ES-1a

MCA Results, US StateUpper Limit (%) of 2035
BAU GHG
Potential Impacts on
2035 Carbon Intensity Screening
Potential Impacts on
5,139 Tg CO2e
BAU GHG
Gross State
Product
Employ-ment
Local Health and
Environment
239 g CO2e/¥2010
Clean Energy Goals
AFF-1aExpanded Use of Biomass Feedstocks for Electrici ty, Heat, and Steam Production
0.19% 0.06% 100 - to + + to ++ U 0.15 +
AFF-1b
Provincia l Liquid/Gaseous Biofuels Production for Stationary and Mobi le Appl ications
0.015% 0.005% 100 - to + + to ++ U 0.012 +
AFF-1cImproved Commercia l i zation of Biomass Convers ion Technologies
0.19% 0.02% 500 U U U 0.045 +
AFF-1dIntegrated Bioenergy Research and Commercia l i zation
0.09% 0.01% U U U U 0.02 +
AFF-1e Manure Digesters/Other Waste Energy Util ization
0.05% 0.04% 100 + + + 0.1 +
Group 1: AGRICULTURE & FORESTRY—PRODUCTION OF FUELS AND ELECTRICITY
Action Number
Low Carbon Development Action
Micro- economic
Costs/Savings Indicator
Potential Macroeconomic Impact by 2035 Related Implemented or Planned
Actions
Realistic Screening Potential
(%) of 2035 BAU GHG
Agriculture, Forestry & Fisheries Actions Catalog

Table Discussion/Exercise 2
Apply Poverty Reduction to MCA Screening– Which Poverty reduction decision criteria
would you use?– Which Benchmark sources?– Which Expert ranking/rating?

Policy Option Design
• Timing • Level of effort• Coverage of parties• Eligibility and definitions• Type of mechanism(s)• Sources and uses of funds

ExampleMaking Green Agricultural Policies Effective in Reducing Poverty
Source: Lovo et al. (2015): Green agricultural policies and poverty reduction,GRI Policy Brief, London: LSE
3. ANALYSIS OF POLICY OPTIONSMicro, Integrative, Macro
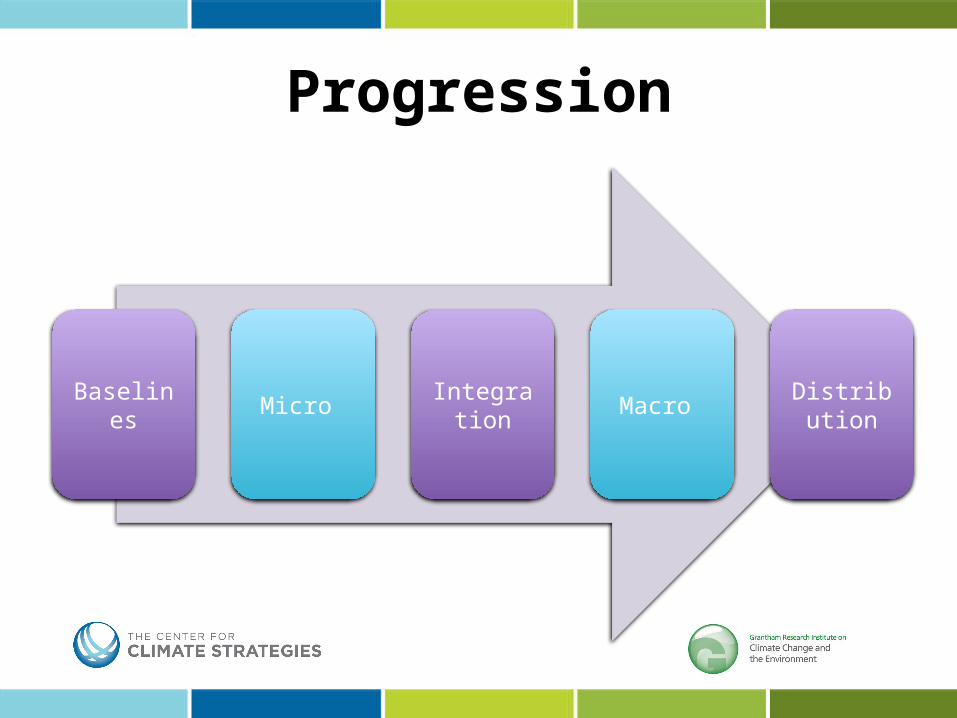
Progression
Baselines Micro Integratio
nMacro
Distribution

Micro Analysis Set Up• Principles and guidelines• Common assumptions for all sectors and each sector• End user needs• Capacity constraints• Templates and tools
– Linked system (Baselines, options, micro, integration, macro)
– Customized policy option analysis – Methods, Data Sources, Assumptions
– Toolkit
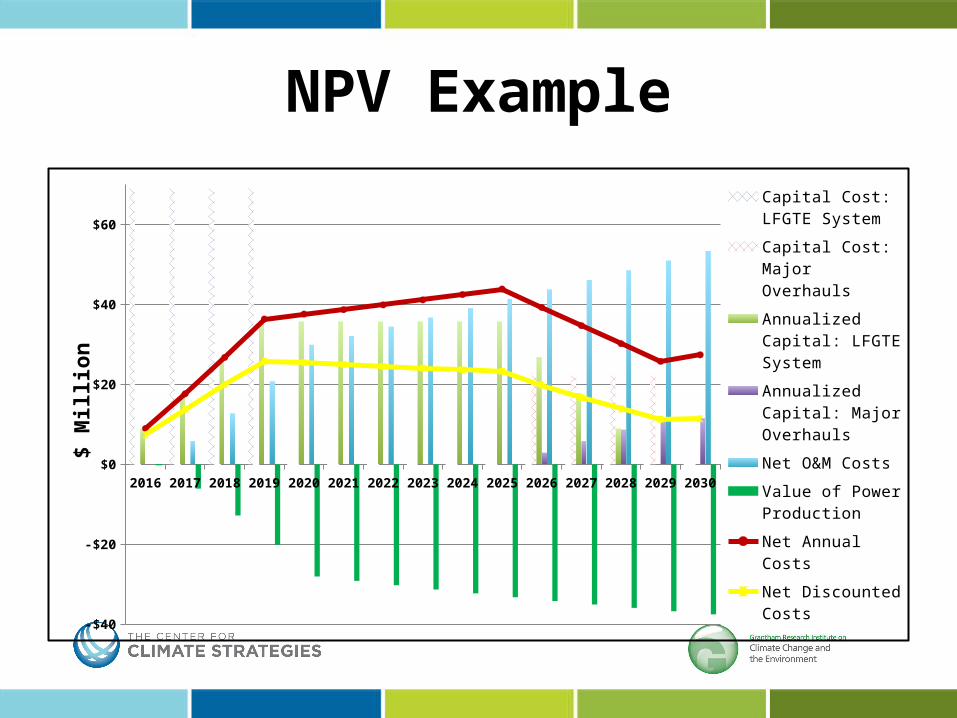
NPV Example
2016 2017 2018 2019 2020 2021 2022 2023 2024 2025 2026 2027 2028 2029 2030
-$40
-$20
$0
$20
$40
$60Capital Cost: LFGTE System
Capital Cost: Major Overhauls
Annualized Capital: LFGTE System
Annualized Capital: Major Overhauls
Net O&M Costs
Value of Power Production
Net Annual Costs
Net Discounted Costs
$ M
illio
n

Integration• Initial micro-economic analysis of each
policy is done on a “stand-alone” basis. • This assumes policy implementation all by
itself with results calculated against business as usual (BAU) conditions.
• There are both intra-sector and inter-sector overlaps/ interactions to address
• Reduce the possibility of “double-counting”

Macro Overview How will people, business, government respond to direct costs and savings?
• Key Questions:– Change in spending: How is other spending affected?
(Reallocation)– Change in spending: A change in demand, or a change in price? – Change in taxes: How will government spend that tax money?– Identities: Who is spending money? Who is saving? Who is
selling more? Who is selling less? – Where is money for infrastructure coming from? Is it displacing
other investment? – Import/Export: Are goods/services/investment entering or
leaving?

Macro Metrics • Macroeconomic
– Growth, income, employment – Prices, productivity
• Fiscal– Spending, savings, allocations, levels– Sources and uses of funds, budgets
• Equity– Distribution across special populations

Macro Models• Software that models flows of money around the
economy, changes to productivity, output, inflation, incomes, employment
• Models of different types (REMI, CGE, I-O)• Data must reflect a specific economy with specific:
– Labor productivity– Intermediate demand for each sector– Elasticities of demand– Costs for goods and services– Levels of activity in different sectors– And Many Other Unique Characteristics!

Equity/Poverty Impacts • Comparative levels• Absolute levels • Person and household: age, gender, location, health,
wealth, role, social status, special factors• Community: location, cultural factors, social status,
sustainability, wealth, role, special factors • Business: size, role, location, age, sustainability,
special factors
Final Results
• Transmittal to leadership• Next steps
Country ExampleDemocratic Republic of Congo
Trinto Mugangu, PhDDRC Coordinator for Low Emission Development Strategies &
Climate Change Negotiator for GHG MitigationDRC Ministry of the Environment & Sustainable Development
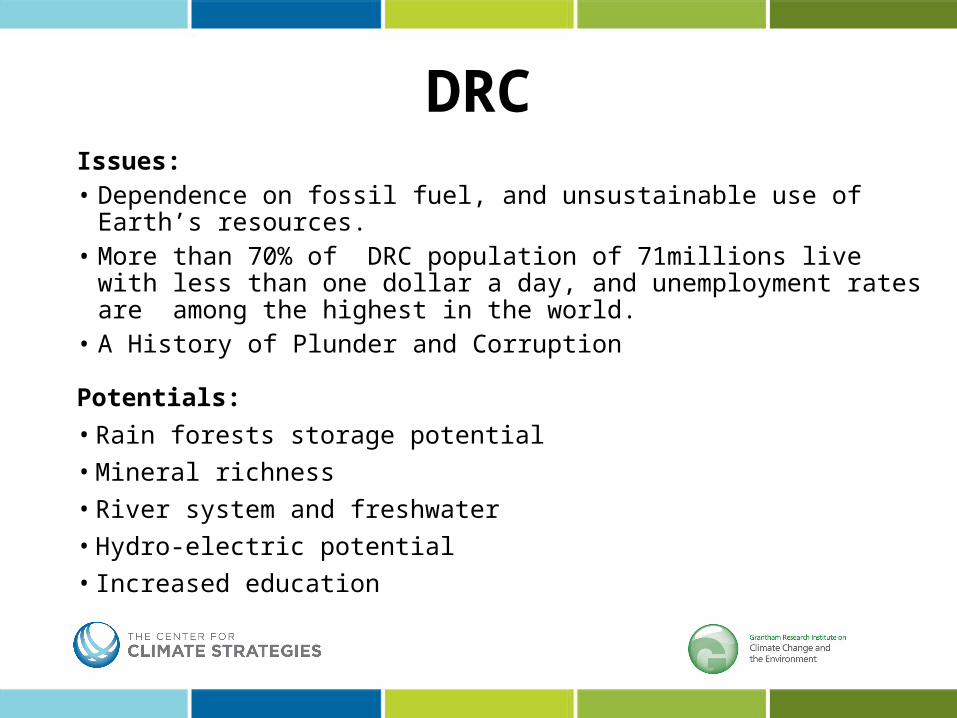
DRCIssues:• Dependence on fossil fuel, and unsustainable use of Earth’s resources. • More than 70% of DRC population of 71millions live with less than one
dollar a day, and unemployment rates are among the highest in the world.
• A History of Plunder and Corruption
Potentials:• Rain forests storage potential• Mineral richness • River system and freshwater• Hydro-electric potential• Increased education
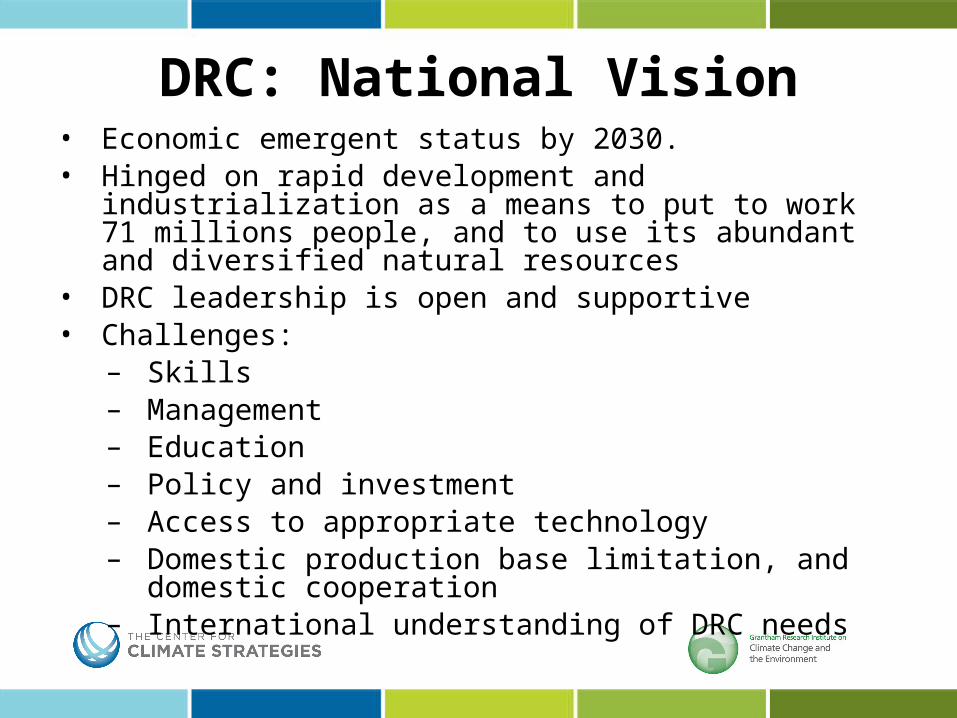
DRC: National Vision• Economic emergent status by 2030. • Hinged on rapid development and industrialization as a means to
put to work 71 millions people, and to use its abundant and diversified natural resources
• DRC leadership is open and supportive• Challenges:
– Skills – Management – Education – Policy and investment– Access to appropriate technology– Domestic production base limitation, and domestic
cooperation– International understanding of DRC needs

DRC: National VisionKey objectives:1. Create a labor pool of intelligence and know how2. Create a middle class of entrepreneurs 3. Make DRC an agricultural success 4. Transform DRC to an energetic and environmental power with
sustainable multiple use management of forests5. Make DRC an economic and industrial pool 6. Make DRC a land of peace, stability and prosperity, and a land of
wellness with clean air and good health7. Make DRC a regional environmental & economic power to
catalyze Africa’s development
‹#› | 2/20/2015 www.climatestrategies.us
Thank you for your time and attention!
QUESTIONS ?
Center for Climate Strategies
1800 K Street NW, Suite 714Washington, DC 20006
www.climatestrategies.us
Thomas D. Peterson


