METHODS FOR ASSESSING THE POLISHING CHARACTERISTICS OF COARSE AGGREGATES FOR USE IN PAVEMENT SURFACE LAYERS FINAL CONTRACT REPORT VTRC 10-CR7 http://www.virginiadot.org/vtrc/main/online_reports/pdf/10-cr7.pdf LINBING WANG, Ph.D., P.E. Director Center for Smart Infrastructure Virginia Tech Transportation Institute CRISTIAN DRUTA, Senior Research Assistant, Ph.D. Center for Smart Infrastructure Virginia Tech Transportation Institute D. STEPHEN LANE Associate Principal Research Scientist Virginia Transportation Research Council
Center for Smart InfrastructureVirginia Tech Transportation Institute
CRISTIAN DRUTA,Senior Research Assistant,
Ph.D.
Center for Smart InfrastructureVirginia Tech Transportation Institute
D. STEPHEN LANEAssociate Principal Research Scientist
Virginia Transportation Research Council
Standard Title Page—Report on Federally Funded Project 1. Report No.: 2. Government Accession No.: 3. Recipient’s Catalog No.: FHWA/VTRC 10-CR7 4. Title and Subtitle: 5. Report Date:
June 2010 6. Performing Organization Code:
Methods for Assessing the Polishing Characteristics of Coarse Aggregates for Use in Pavement Surface Layers
7. Author(s): Linbing Wang, Cristian Druta, and D. Stephen Lane
8. Performing Organization Report No.: VTRC 10-CR7 10. Work Unit No. (TRAIS): 11. Contract or Grant No.:
9. Performing Organization and Address: Virginia Transportation Research Council 530 Edgemont Road Charlottesville, VA 22903 91337 12. Sponsoring Agencies’ Name and Address: 13. Type of Report and Period Covered:
Final Contract 14. Sponsoring Agency Code:
Virginia Department of Transportation 1401 E. Broad Street Richmond, VA 23219
Federal Highway Administration 400 North 8th Street, Room 750 Richmond, VA 23219-4825
15. Supplementary Notes: 16. Abstract: The predominant aggregate resources located in the western parts of Virginia are carbonate rocks. The mineral components of these rocks tend to be relatively soft and subject to abrasive wear under traffic that leads to a fairly rapid smoothing of the aggregate surface and the surface of pavements containing them. This smoothing or polishing leads to a loss of surface friction and thus skid resistance of the pavement, creating potential safety issues. As a consequence, surface courses of pavements are constructed with nonpolishing aggregates, which in the western districts can mean lengthy transport of materials. With rising economic and environmental costs associated with transportation, increasing the use of locally available materials through improved methods to discern subtle differences in polishing tendencies or blending of polishing with nonpolishing aggregates could translate into significant cost savings. In this study, a suite of carbonate aggregates suspected to show a range of polishing characteristics based on previous studies was selected for evaluation along with several sources currently used as nonpolishing aggregates. The aggregates were examined petrographically, and the carbonate sources were tested for insoluble residue and subjected to a dilute acid etch to form the basis for a tentative classification of polishing susceptibility. The aggregates were tested in the Micro-Deval apparatus using both the standard procedure for coarse aggregates and a cyclical A/P procedure with silica sand devised for this study to examine how the various aggregate types responded when subjected to various degrees of wearing under similar conditions. Following abrasion cycles, 2-D digital aggregate images were obtained and analyzed using specialized software to assess their morphological properties with emphasis on angularity and surface texture. These properties were assessed before and after abrasion to determine the degree and rate of change in surface texture as well as the texture distribution within an aggregate sample. In addition, pictures were taken of the exposed surfaces of three experimental pavement sections in the Virginia Department of Transportation’s Bristol District containing carbonate rock as the fine aggregate blended with nonpolishing coarse aggregate to visually assess the effect of traffic in the last 3 years. The carbonate rocks evaluated could be grouped according to polishing and wear tendency based on petrographic characteristics and mass loss in the Micro-Deval tests. Although visual distinctions could be discerned, these differences were not identified statistically by the image analysis program, but factors affecting the program were identified. A second phase of work is proposed that focuses on developing an accelerated pavement wearing protocol for assessing polishing tendencies and evaluating various mixtures of carbonate and nonpolishing aggregates. 17 Key Words: 18. Distribution Statement: Aggregates, polishing, skid resistance, pavements No restrictions. This document is available to the public
through NTIS, Springfield, VA 22161. 19. Security Classif. (of this report): 20. Security Classif. (of this page): 21. No. of Pages: 22. Price: Unclassified Unclassified 45
Form DOT F 1700.7 (8-72) Reproduction of completed page authorized
FINAL CONTRACT REPORT
METHODS FOR ASSESSING THE POLISHING CHARACTERISTICS OF COARSE AGGREGATES FOR USE IN PAVEMENT SURFACE LAYERS
Linbing Wang, Ph.D., P.E. Director
Center for Smart Infrastructure Virginia Tech Transportation Institute
Cristian Druta, Ph.D.
Senior Research Associate Center for Smart Infrastructure
Virginia Tech Transportation Institute
D. Stephen Lane Associate Principal Research Scientist
Virginia Transportation Research Council
Project Manager D. Stephen Lane, Virginia Transportation Research Council
Contract Research Sponsored by the Virginia Transportation Research Council
(A partnership of the Virginia Department of Transportation and the University of Virginia since 1948)
In Cooperation with the U.S. Department of Transportation
Federal Highway Administration
Charlottesville, Virginia
June 2010 VTRC 10-CR7
ii
DISCLAIMER
The project that is the subject of this report was done under contract for the Virginia Department of Transportation, Virginia Transportation Research Council. The contents of this report reflect the views of the authors, who are responsible for the facts and the accuracy of the data presented herein. The contents do not necessarily reflect the official views or policies of the Virginia Department of Transportation, the Commonwealth Transportation Board, or the Federal Highway Administration. This report does not constitute a standard, specification, or regulation. Any inclusion of manufacturer names, trade names, or trademarks is for identification purposes only and is not to be considered an endorsement.
Each contract report is peer reviewed and accepted for publication by Research Council staff with expertise in related technical areas. Final editing and proofreading of the report are performed by the contractor.
Copyright 2010 by the Commonwealth of Virginia. All rights reserved.
iii
ABSTRACT
The predominant aggregate resources located in the western parts of Virginia are carbonate rocks. The mineral components of these rocks tend to be relatively soft and subject to abrasive wear under traffic that leads to a fairly rapid smoothing of the aggregate surface and the surface of pavements containing them. This smoothing or polishing leads to a loss of surface friction and thus skid resistance of the pavement, creating potential safety issues. As a consequence, surface courses of pavements are constructed with nonpolishing aggregates, which in the western districts can mean lengthy transport of materials. With rising economic and environmental costs associated with transportation, increasing the use of locally available materials through improved methods to discern subtle differences in polishing tendencies or blending of polishing with nonpolishing aggregates could translate into significant cost savings. In this study, a suite of carbonate aggregates suspected to show a range of polishing characteristics based on previous studies was selected for evaluation along with several sources currently used as nonpolishing aggregates. The aggregates were examined petrographically, and the carbonate sources were tested for insoluble residue and subjected to a dilute acid etch to form the basis for a tentative classification of polishing susceptibility. The aggregates were tested in the Micro-Deval apparatus using both the standard procedure for coarse aggregates and a cyclical A/P procedure with silica sand devised for this study to examine how the various aggregate types responded when subjected to various degrees of wearing under similar conditions. Following abrasion cycles, 2-D digital aggregate images were obtained and analyzed using specialized software to assess their morphological properties with emphasis on angularity and surface texture. These properties were assessed before and after abrasion to determine the degree and rate of change in surface texture as well as the texture distribution within an aggregate sample. In addition, pictures were taken of the exposed surfaces of three experimental pavement sections in the Virginia Department of Transportation’s Bristol District containing carbonate rock as the fine aggregate blended with nonpolishing coarse aggregate to visually assess the effect of traffic in the last 3 years. The carbonate rocks evaluated could be grouped according to polishing and wear tendency based on petrographic characteristics and mass loss in the Micro-Deval tests. Although visual distinctions could be discerned, these differences were not identified statistically by the image analysis program, but factors affecting the program were identified. A second phase of work is proposed that focuses on developing an accelerated pavement wearing protocol for assessing polishing tendencies and evaluating various mixtures of carbonate and nonpolishing aggregates.
FINAL CONTRACT REPORT
METHODS FOR ASSESSING THE POLISHING CHARACTERISTICS OF COARSE AGGREGATES FOR USE IN PAVEMENT SURFACE LAYERS
Linbing Wang, Ph.D., P.E.
Director Center for Smart Infrastructure
Virginia Tech Transportation Institute
Cristian Druta, Ph.D. Senior Research Associate
Center for Smart Infrastructure Virginia Tech Transportation Institute
D. Stephen Lane
Associate Principal Research Scientist Virginia Transportation Research Council
INTRODUCTION
Aggregates used in surface pavement layers need to be rough-surface-textured to provide skid resistance as well as resistant to polishing under wear by vehicle tires (Mahone and Sherwood, 1995; Webb, 1970). In order to maintain a high level of pavement surface friction (skid resistance), aggregates should wear non-uniformly; that is, they should not become rounded or polished smooth under traffic. Because the rate of aggregate polishing is closely related to the types of minerals they contain, a high percentage of hard mineral grains must be present in the aggregates. Virginia Department of Transportation (VDOT) specifications call for nonpolishing aggregate for use in most surface layers. However, VDOT materials engineers have few methods or tools with which to assess the polishing characteristics of aggregates to distinguish between polishing and nonpolishing aggregates. This is primarily a problem in the western part of Virginia where the predominant source materials for aggregates are carbonate rocks composed of relatively soft minerals; they are thus considered to be polishing aggregates. Currently, VDOT draws a distinction between polishing or polish-susceptible aggregates and nonpolishing aggregates used in pavement surface layers, as indicated by this statement in Section 200.04 of VDOT’s Road and Bridge Specifications:
The term nonpolishing aggregate shall mean aggregate that the Department has determined will result in a surface of acceptable skid resistance when it is used and exposed as part of a wearing surface. The Department reserves the right to evaluate and determine the acceptability of polishing characteristics of aggregate proposed for use in pavement surfaces (Virginia Department of Transportation, 2007).
2
In practice, the distinction is drawn between carbonate and non-carbonate rocks using an acid-insoluble residue test as a delineator. Few additional tools are readily available to VDOT materials engineers to assess the polishing characteristics of aggregates. In the western part of Virginia, the predominance of carbonate rocks often necessitates lengthy transport of “nonpolishing aggregate” for use in surface layer construction at a time when transportation costs, both in economic and environmental terms, have skyrocketed.
PURPOSE AND SCOPE The purpose of this study was to develop objective and practical methods to assess the polishing/abrasion characteristics of carbonate and non-carbonate coarse aggregates that have previously been used in pavement surface layers. This would provide VDOT district materials engineers with needed tools to exercise sound engineering judgment in the selection of aggregates for use in surface courses that would permit cost savings where appropriate and provide justification for the use of higher-cost aggregate when necessary. Although at this point dollar amounts cannot be estimated, it is clear that opportunities exist for savings if the use of local aggregates in place of more costly materials from distant sources can be increased. Samples of coarse aggregate from 10 sources across VDOT’s western districts were evaluated using laboratory techniques to assess their polishing tendencies. The techniques included petrographic examination, acid-insoluble residue of the carbonate rocks, and two procedures using the Micro-Deval (MD) apparatus to subject the particles to abrasive wear. An image analysis system was employed to evaluate the changes in particle morphology resulting from the abrasion testing. In addition, site visits were made to three experimental pavement sections produced using carbonate rock as the fine aggregate to obtain digital images of the current surface texture for comparison with the surface texture shortly after placement.
PREVIOUS RESEARCH The MD abrasion test, which is similar in principle to the Los Angeles abrasion test, was initially developed in France more than 40 years ago but has just recently been adopted to evaluate aggregates for construction (Barksdale 1991; Atkins 2003; Alexander and Mindess 2005). The test was developed as an alternative to the Los Angeles abrasion test, which has been criticized (Senior and Rogers 1991) for its inability to render accurate results regarding aggregate degradation during production, mixing, and placement (Cooley and James 2003; Hossain et al. 2007). For this reason, researchers have looked to develop similar tests that would be more appropriate for toughness/abrasion evaluation of aggregates. In this respect, extensive research has been conducted by various state, federal, private, and local governmental agencies worldwide. As a result, the MD apparatus was found to assess the abrasion and durability of fine and coarse aggregate better (Wu et al. 1998; Gatchalian et al. 2006) and has been adopted by the Canadian Standards Association and the American Association of State Highway and Transportation Officials (AASHTO) for use in evaluating aggregates. Hossain et al. (2007)
3
presented a detailed literature review and test results on this topic. They concluded that the MD test can accurately differentiate between good- and poor-performing aggregates, with much lower test variability, and recommended its use for fine and coarse aggregate.
METHODS AND MATERIALS
Research Overview
In this study, the MD abrasion apparatus and an imaging technique were employed to evaluate the wear characteristics of coarse aggregates commonly used in Virginia. Abrasion/polishing (A/P) of the aggregates was performed using the MD system available at the Virginia Transportation Research Council (VTRC). The Virginia Tech Transportation Institute (VTTI) conducted a morphological analysis of the aggregates provided by VTRC before and after the MD testing. The analysis was based on methodology developed by VTTI in collaboration with VTRC.
Aggregate Selection
Coarse aggregates were selected from three VDOT districts: Bristol, Salem, and
Staunton. The respective district materials engineers were asked to suggest aggregate sources currently considered to be polishing and nonpolishing, i.e., carbonate and non-carbonate aggregates, respectively. Based on their experience and familiarity with the use and performance of the aggregates, they suggested 10 sources for inclusion in the study. The selection of the carbonate aggregates was not directly related to the actual field performance in pavements, rather, it related to geographic distribution and variation in the mineralogical composition of the rock.
The selected sources, which represent the most predominant aggregate types available in
the western part of Virginia, were divided into two groups. The first group included two non-carbonate sources, currently meeting the nonpolishing definition, representing better quality materials (Maymead and Salem; see Table 1 for the descriptions of the sources) and one for which the general quality was more questionable (Nolichucky). The second (or the polishing) group included two limestones with low or very fine insoluble residue (IR) that would be expected to polish rapidly (Strasburg, Frazier-North) and several dolostone sources that early work indicated had higher and coarser IR that may be relatively less susceptible to polishing (SM Perry, CS Mundy-Broadway, Rockydale-Roanoke, Oldcastle-Castlewood, Staunton). Table 1 provides information on the aggregate types and sources.
4
Table 1. Coarse Aggregate Sources and Sizes Aggregate Size (mm)
Rockydalec, Roanoke Dolomite x x x x x Stauntonc Lime Co. Dolomite
Carbonate
x x x x * The name in boldface type is used to reference this source in this report. Subscript c denotes carbonate, and subscript nc denotes non-carbonate.
Petrographic Analysis Geologic information and other data pertaining to each aggregate source was obtained by contacting geologists at the Virginia Division of Mineral Resources, industry sources and by searching the existing literature on Virginia geology. Samples from each source were examined using microscopic techniques including thin sections to determine the predominant rock types or minerals. The carbonate sources were evaluated for acid-insoluble residue using Virginia Test Method (VTM) 37. In addition, the particle mounts of the carbonate sources were prepared and a ground, polished surface was etched with dilute hydrochloric acid to distinguish between calcite and dolomite and the insoluble material. Brief lithologic descriptions are provided in Table 2. Based on the lithologic character of the aggregate sources they can be grouped according to their presumed susceptibility to polishing. The grouping is based on relative hardness of the minerals present with calcite being the relatively soft (3 on the Mohs hardness scale), dolomite slightly harder (3.5-4) and quartz (7); grain size and uniformity (uniformly fine grained rocks are more susceptible to polishing). Using these criteria, a tentative grouping is shown in Table 3.
5
Table 2. Lithologic Descriptions and Insoluble Residue Results Aggregate
Source
Lithologic Description Insoluble
Residue %
Insoluble Residue Maymeadnc Granite N/A N/A Salemnc Quartzite, medium to fine angular grains N/A N/A Nolichuckync Iron-cement sandstone, medium grained N/A N/A Broadwayc Dolomite -fine-grained microspar with some
coarser areas; micritic intraclasts and peloidal zones; quartz sand seams
18.0 Clay/shale lumps, quartz grains
Strasburgc Limestone organic rich micrite with microspar and bioclasts
Polishing Tendency Source Readily Strasburg, Frazier Readily to Moderate Castlewood, Perry Moderate Broadway, Rockydale, Staunton Nonpolishing Maymead, Salem, Nolichucky
Micro-Deval Testing
The abrasion resistance of the coarse aggregates was determined in accordance with AASHTO T 327-05: Resistance of Coarse Aggregate to Degradation by Abrasion in the Micro-Deval Apparatus (the standard procedure). Details of the procedure have been provided by Hossain et al. (2007) and others (Saeed et al., 2001; White et al. 2006; Lang et al., 2007). The results of these tests are shown in Table 4. The MD apparatus was also used in a procedure that attempted to simulate the A/P action of standard tests such as the British Polishing Wheel and the Aggregate Abrasion Value Machine (Rogers et al., 2002) that use an abrasive grit (the non-standard procedure). In the procedure devised, 300 g of coarse aggregate was placed in the jar mill together with 200 g of silica sand (abrasive grit), thus conforming to the ASTM C 778 (20-30) designation, and 750 g of water. The steel jar, aggregates from each source, and abrasive charge (steel balls) were revolved at 100 rpm for three successive 15, 30, and 45 min periods. After each period, the aggregate particles were removed, dried, and weighed en mass, and the loss was determined for the sample. Thus, the same aggregates were tested for 15, 45, and 90 min in total. Following each weighing, images were taken of each particle with backlighting for image analysis of the aggregate morphology. In addition, images were taken of selected particles with incident lighting for a
6
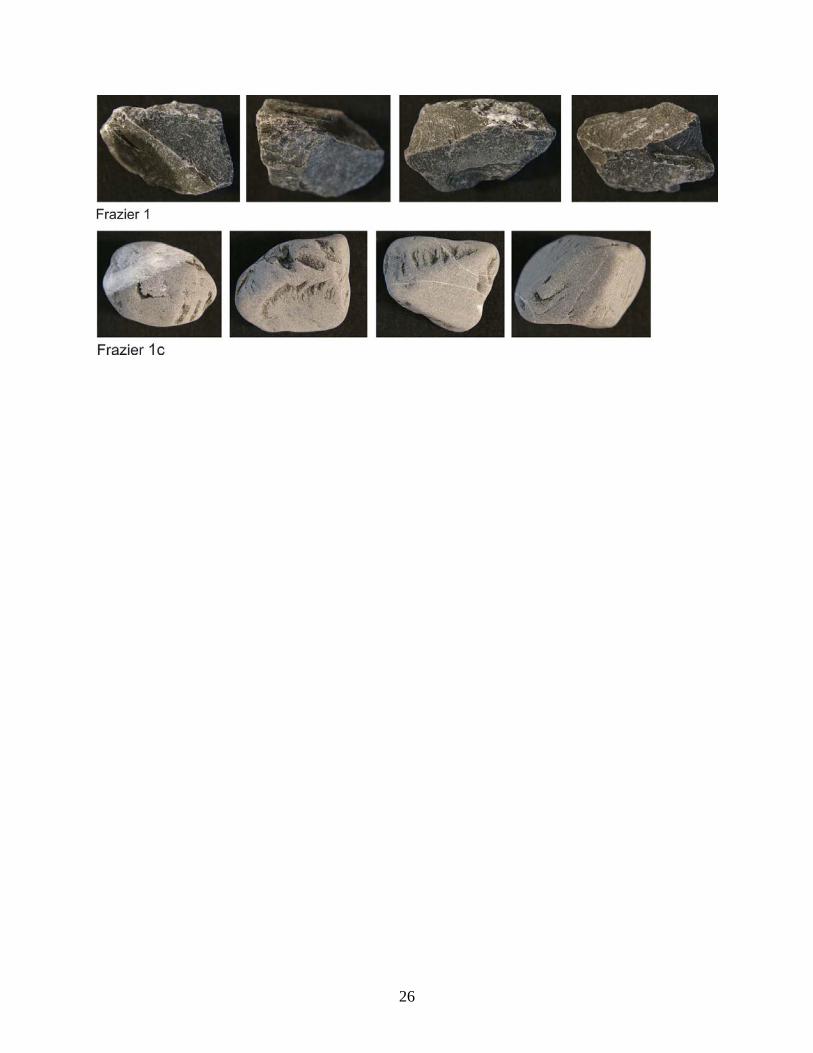
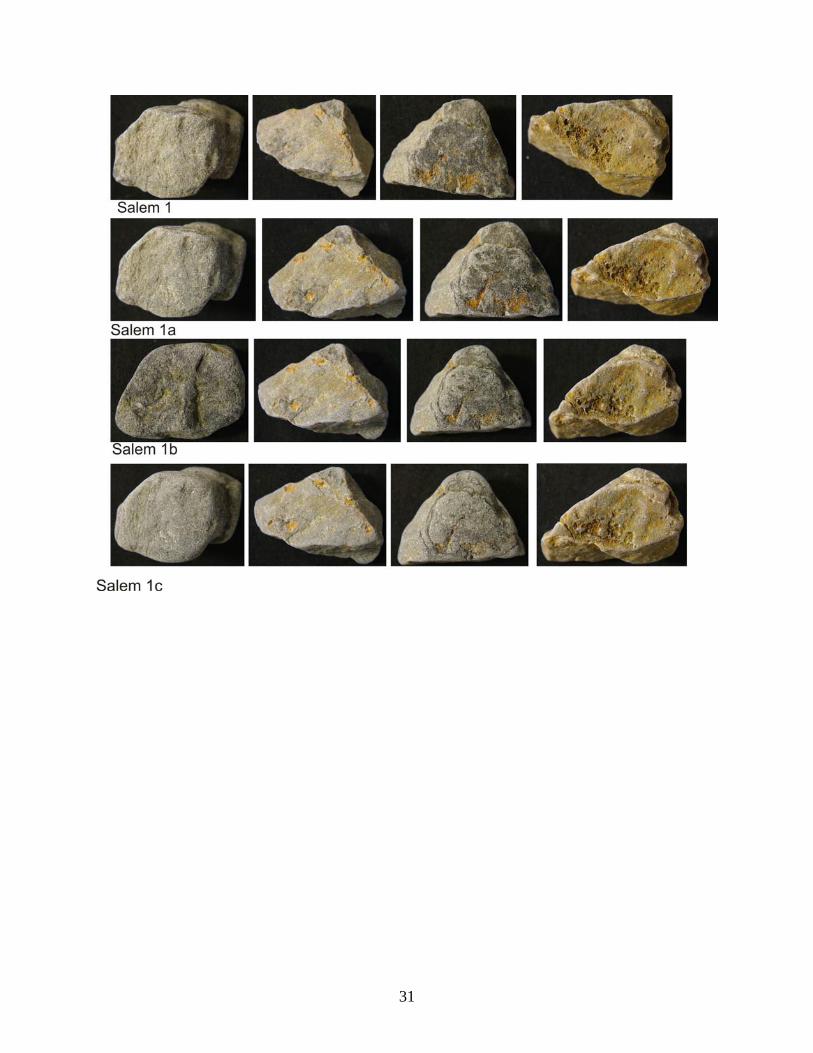
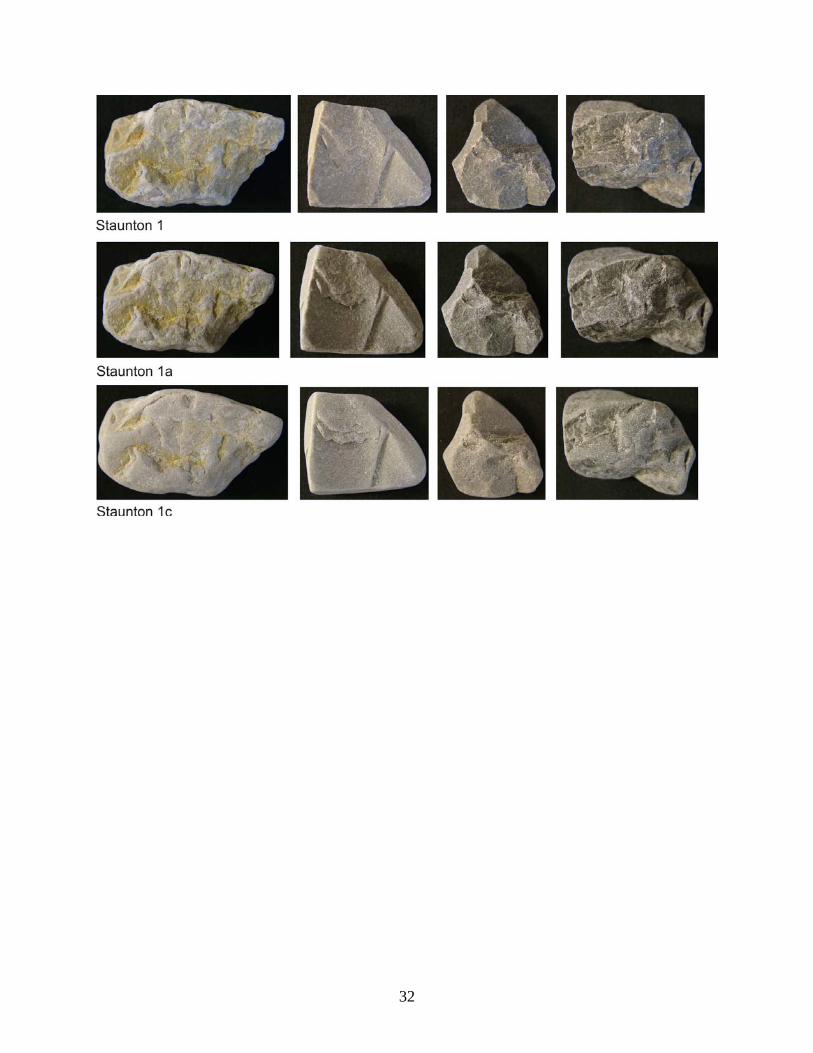
visual record of the change induced on the particle by the A/P process. These images are presented in Appendix A.
Aggregate Morphological Assessment
Image analysis and processing were performed on all the aggregate types described above to assess their morphological characteristics (i.e., shape, angularity, and surface texture). Image analysis was conducted on individual particles composing the sample, before and after abrasion testing. The individual particle results are then aggregated to produce a single tri-parametric result for the sample as a whole. For this purpose, digital pictures were acquired and analyzed for approximately 20 aggregate particles tested using the A/P MD procedure, and for 25 aggregate particles tested using AASHTO T 327 standard procedure. Particles were selected in order to cover a broad range of shapes. For the A/P MD procedure, the same particles were imaged after each cycle, but individual particle orientation during imaging was random, except for a few sets, where an effort was made to image the particles in the same orientation after each cycle. For the standard MD procedure, individual particles were oriented in several ways for imaging, but the actual particles imaged before and after abrasion were different. Morphological parameters were obtained using Matlab program code developed for processing any digital picture color format. Details with respect to image analysis and processing methodology were presented by Wang et al. (2008). Hence, a total of 1,300 digital pictures (500 for the standard procedure and 800 for the A/P procedure) were analyzed to assess the wear induced by the MD apparatus on the aggregate particles.
RESULTS AND DISCUSSION
Abrasion/Polishing Results The results of the standard MD tests and the A/P MD tests are presented in Tables 4 and 5, respectively, and plotted in Figures 2 and 3. With two exceptions (Carmeuse limestone and Nolichucky sandstone) the aggregates can be considered as “suitable” aggregates for surface courses since they exhibited loss values of less than 15% as suggested by White et al. (2006) (Figure 2). Values ranged from a low of 5.4% (Mundy) to a high of 19.9% (Nolichucky). Salem quartzite could be considered “questionable” as its loss value (13.2%) is closer to the 15% limit. Previous tests of Nolichucky and Salem (unpublished data) were conducted at the request of the district materials engineers in response to concerns about the quality of the material being supplied yielded values of 23.1% and 19.1%, respectively. In general, the Nolichucky material is somewhat friable with the component sand grains easily loosened from the cementing matrix. With the Salem material, the previous sample was obtained when field personnel suspected that the supply was being produced from a more weathered area of the deposit where the matrix had become weakened. The Salem material included in this study was of better quality than that previously tested.
7
For the carbonate rocks tested, the standard MD test results can be separated into two groups: those “less wear-resistant” (LWR) with losses in excess of 10% (i.e., Strasburg, Frazier, and Rockydale) and those “more wear-resistant” (MWR) (i.e., Broadway, Castlewood, Perry, and Staunton). Comparing these groupings with those of Table 3, the lithologic polishing tendency, it is noted that the Strasburg and Frazier were grouped together as readily polishing, with the others split between moderate-to-readily and moderate. The obvious non-conformant in these groupings is Rockydale, which was included in the moderate group in Table 3 but falls into the LWR group based on MD loss. An explanation for the apparent aberrant behavior of the Rockydale is that some particles are showed signs of weathering, resulting in localized softening and splitting along fracture or bedding planes within the particles (see Figure 1). The MD procedure has been shown to be an effective tool in identifying reduction in material quality resulting from weathering (Hossain et al., 2007). Additional samples of the material should be obtained and tested to verify this explanation and assess the implications regarding sampling, testing and acceptance of materials for specific applications. Examining the results of the A/P MD tests, the carbonate rocks separate into two groups based on loss that remain the same through the progression of wearing cycles. Using loss values of 1.0% at 15 min, 2.5% at 45 min, and 4.5% at 90 min, the carbonate aggregates can again be grouped into LWR (>x), i.e., Strasburg, Frazier, and Rockydale, and MWR (<x), i.e., Broadway, Castlewood, Perry, and Staunton.
Figure 1. Rockydale aggregate particle showing oxidation along internal boundaries caused by weathering,
which weakens the particle
For the non-carbonate rocks, both Nolichucky and Salem fell into the LWR group based on both the standard and A/P MD criteria. The Maymead falls with the MWR based on the standard test result and the LWR with the A/P results. At this juncture, it is important to draw a distinction between simple mass loss as determined in the standard and non-standard MD procedures, and polishing, where the surface of the particle is worn in a uniform manner that eventually results in a very smooth surface. The tendency of a rock to polish is a function of mineral composition, component grain size and fabric (arrangement of grains). A rock composed of a relative soft mineral such as calcite, when grain size and fabric are uniform can polish readily with minimal loss of material, whereas a rock of more heterogeneous character might exhibit a similar mass loss without polishing because differential wear of individual grains, loss of poorly bound grains, or loss grains along fracture or cleavage planes, perpetuating a relatively rough surface. These differences can be observed in images of Frazier and Maymead particles, which had similar losses in the MD tests, but whose surfaces after polishing cycles are quite different. Figure 3 presents the loss data for the same aggregate sources, but with the non-standard A/P procedure. It can be observed that the abrasion loss followed the same pattern as for the standard procedure. This indicates that the non-standard procedure did not alter the basic wear relationships between aggregates in the MD apparatus. Aggregates were grouped based on their lithologic characterization in Table 2.
9
Figure 2. Micro-Deval Test Results (AASHTO T 327)
Figure 3. Micro-Deval Test Results (Non-Standard Procedure)
Image Analysis Statistical Results In this study, statistical analysis was performed to quantify the distribution of aggregate morphologic characteristics (shape, angularity, texture) in the aggregate samples and to compare these characteristics among the samples. Although all three parameters were included in this study, texture, and to a lesser degree, angularity are expected to reflect changes induced by
10
polishing. Statistical analysis results, mean and standard deviation, are presented in Tables 6 and 7. Figures 4 and 5 illustrate the mean values for the aggregates’ characteristics before and after MD abrasion testing for the standard and A/P (non-standard) procedures respectively. Aggregate sources were grouped according to their lithologic description in Table 2.
Examining the image analysis data for the A/P procedure in Figure 5, the two aggregates with the steepest progressive loss of angularity through two cycles fell into the LWR category based on simple mass loss and were those classified as readily polishing by lithologic characteristics. The third steepest loss in angularity was shared by two sources, one of which was the third aggregate to fall into the LWR group. Similarly, the same four aggregates, Strasburg, Frazier, Rockydale, and Mundy, are four of the five showing the steepest progressive loss in texture through two cycles. Although these subtle distinctions could be perceived, Student’s t-tests were performed among all sets of aggregate parameters to determine if the aggregate mean characteristics values were statistically different. For this evaluation, a one-tail distribution and equal variances were selected, at a confidence limit of 95% (α = 0.05). Table 8 shows t-test results for the aggregates tested using the AASHTO T 327 procedure, and the t-test results from the A/P MD non-standard procedure are shown in Appendix B. They did not indicate significant differences among the same type of stone or source. Sixteen results (less than 10%) of 180 comparisons were statistically significant (t value less than α = 0.05). Most of the differences (14) were related to the shape and angularity (Carmeuse, Frazier N., Castlewood, and Rockydale), and only 2 related to the surface texture (Carmeuse and Staunton). These differences are highlighted in the tables in Appendix B. They could have arisen due to differences in orientation of the particles when imaged (shape and angularity) or due to dissimilar wearing of the aggregate structure (texture) during the abrasion process. As shown in Figure 5, the texture decreased quite uniformly or remained constant over the three testing periods as the same aggregates were pictured and analyzed in approximately the same orientations. The MD introduced some changes to the aggregates’ shape, angularity, and texture, as can be seen from Figure 4, but statistically significant differences were not observed among these parameters for the aggregates tested in accordance with the AASHTO T 327 standard procedure. In this case, the differences related to the shape and angularity could have occurred because the aggregates analyzed before and after abrasion were not the same. Although visually discernable differences could be noted in particle angularity and texture between A/P cycles, these differences were not being satisfactorily identified through the image analysis processing. However, the Fourier analysis method developed for analyzing aggregate morphology works reasonably well for differentiating among shape, angularity, and texture of different aggregate source material. When the aggregate particles are subjected to the A/P MD testing, the observed changes are mainly in texture and to a lesser degree, angularity. Changes in shape are not a major factor except for materials that are very abrasion susceptible. Consequently, an enhanced analysis method is being developed by Dr. Wang and Ashley Stanford at Virginia Tech to decouple the shape, angularity, and texture measurements.
11
Aggregate Assessment Summary The A/P MD procedure developed for this study induced subjectively discernable differences in aggregate texture and angularity (sharpness of edges) that are generally consistent with the lithologic characteristics of the aggregates. Although the image analysis program did not pick these differences up, issues with the processing program have been identified and work is underway to enhance its capability in this regard. Based on loss values, the carbonate rocks can be assigned to LWR and MWR categories, which could be used to form the basis for use in surface layers of pavements relative to annual average daily traffic (AADT) levels. As an example, the Pennsylvania Department of Transportation (PennDOT) classifies all rocks into five categories based on lithologic characteristics which then forms the basis for use, including blending of rocks from different categories in pavements, depending on traffic level (PennDOT, 2009). With a few exceptions, carbonate rocks fall into the three lowest skid resistance levels. From the work conducted in this study, the selected carbonate aggregates could be tentatively divided into three groups based on lithologic characteristics, and into two groups based on abrasion loss in the standard and A/P MD tests. Two of the sources, Strasburg and Frazier, were composed of particles with fairly uniform lithologic (grain size and mineralogy) characteristics. The others displayed a varied set of lithologies, and it is the relative percentage of the particular lithologies that influence the polishing tendency of a given sample.
12
Table 6. Mean and Standard Deviation of Aggregate Characteristics (Non-Standard Procedure) Original Aggregate 15-min Polishing 45-Min polishing 90-Min polishing
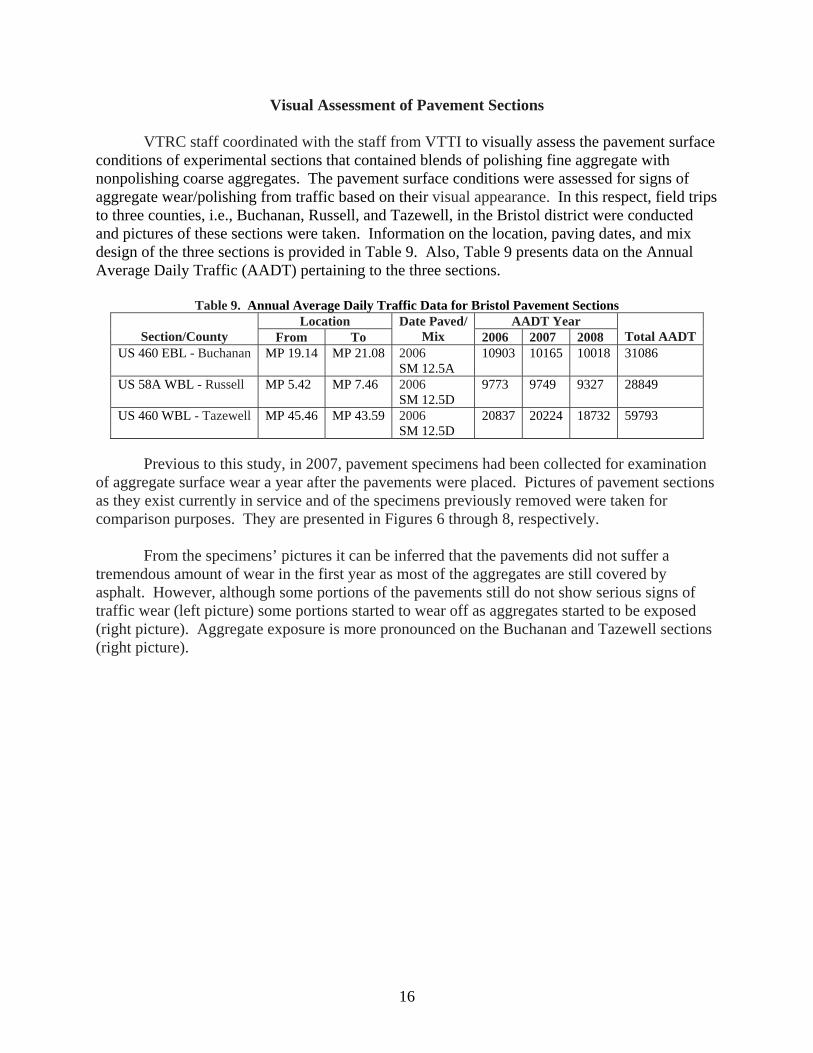
VTRC staff coordinated with the staff from VTTI to visually assess the pavement surface conditions of experimental sections that contained blends of polishing fine aggregate with nonpolishing coarse aggregates. The pavement surface conditions were assessed for signs of aggregate wear/polishing from traffic based on their visual appearance. In this respect, field trips to three counties, i.e., Buchanan, Russell, and Tazewell, in the Bristol district were conducted and pictures of these sections were taken. Information on the location, paving dates, and mix design of the three sections is provided in Table 9. Also, Table 9 presents data on the Annual Average Daily Traffic (AADT) pertaining to the three sections.
Table 9. Annual Average Daily Traffic Data for Bristol Pavement Sections
Location AADT Year Section/County From To
Date Paved/Mix 2006 2007 2008
Total AADT
US 460 EBL - Buchanan MP 19.14 MP 21.08 2006 SM 12.5A
10903 10165 10018 31086
US 58A WBL - Russell MP 5.42 MP 7.46 2006 SM 12.5D
9773 9749 9327 28849
US 460 WBL - Tazewell MP 45.46 MP 43.59 2006 SM 12.5D
20837 20224 18732 59793
Previous to this study, in 2007, pavement specimens had been collected for examination of aggregate surface wear a year after the pavements were placed. Pictures of pavement sections as they exist currently in service and of the specimens previously removed were taken for comparison purposes. They are presented in Figures 6 through 8, respectively. From the specimens’ pictures it can be inferred that the pavements did not suffer a tremendous amount of wear in the first year as most of the aggregates are still covered by asphalt. However, although some portions of the pavements still do not show serious signs of traffic wear (left picture) some portions started to wear off as aggregates started to be exposed (right picture). Aggregate exposure is more pronounced on the Buchanan and Tazewell sections (right picture).
17
Figure 6. Buchanan County Pavement Sections and Specimens
Figure 7. Russell County Pavement Sections and Specimens
18
Figure 8. Tazewell County Pavement Sections and Specimens
CONCLUSIONS • Based on petrographic examinations of the samples, the carbonate aggregates were
subjectively assigned into three categories (Readily, Readily-Moderate, and Moderate) reflecting presumed polishing tendency.
• Using 10% loss in the standard (2 hr) MD procedure as the criterion, the carbonate
aggregates were grouped into LWR and MWR categories. • In the cyclical A/P MD procedure devised for this study with successive 15-min, 30-min, and
45-min wearing cycles, the carbonate sources fell into the same LWR and MWR grouping as with the standard MD procedure using respective losses of 1.0%, 2.5%, and 4.5% for the three cycles.
• The wear-resistance groupings based on the MD procedures were consistent with the polishing tendency based on lithologic (i.e., mineralogy, grain size, and fabric) characteristics except for one aggregate which appeared to have been affected by weathering.
• The wear and polishing effects induced by the cyclical A/P MD procedure were subjectively
discernable and trends could be perceived in the image analysis data, but these differences were not statistically verified. However, potential problems that may be interfering with the ability of the image analysis program to clearly discern angularity and textural effects
19
indicative of polishing have been identified and enhancements to the program are being developed.
RECOMMENDATION 1. The findings of this study should be implemented by VDOT/VTRC by funding a second
phase of this research program. The continuing work should focus on the following:
• developing an accelerated wearing protocol for assessing the susceptibility of asphalt surface mixes to polishing
• conducting friction testing on the three experimental sections installed in the Bristol
District to evaluate their ongoing performance and the seasonal changes that may occur in relation to the pavement surface skid resistance
• establishing guidelines regarding the use of carbonate aggregates while maintaining
satisfactory wearing and skid characteristics of the pavements
• establishing the costs/benefits of increasing the use of carbonate aggregates in surface mixtures.
A proposed program of tasks for Phase II of this study is outlined in Appendix C.
BENEFITS AND IMPLEMENTATION PROSPECTS This study has shown that distinctions can be drawn between the polishing characteristics of carbonate rocks from different sources. These findings provide essential information to proceed with the next phase of work which will focus on the development of an accelerated wearing protocol for assessing the susceptibility of asphalt surface mixes to polishing and the assessment of surface mixes containing various amounts of carbonate aggregate as coarse and fine aggregate to establish guidelines regarding the use of carbonate aggregate while maintaining satisfactory wearing and skid characteristics of the pavements.
ACKNOWLEDGMENTS Research staff at VTTI, in cooperation with VTRC’s Materials Group, conducted this project. The authors acknowledge the cooperation of the VDOT district materials engineers for supplying the aggregates and sharing their experience about the field performance of the respective aggregates. The authors also acknowledge the assistance and direction from the technical review panel.
20
REFERENCES American Association of State Highway and Transportation Officials. Standard Specifications
for Transportation Materials and Methods of Sampling and Testing. Part 2A Tests, 25th Edition. Washington, D.C., AASHTO T 327-2005.
Alexander, M. and Mindess, S. Aggregate in Concrete, Taylor and Francis Group, London,
New York, 2005. Atkins, N.H. Highway Materials, Soils, and Concretes. Prentice Hall, NJ, 2003, pp. 121-142. Barksdale, R.D. The Aggregate Handbook, National Stone, Sand and Gravel Association,
Arlington, VA, 1991. Cooley, A., Jr. and James, R.S. Micro-Deval Testing of Aggregates in the Southeast. In
Transportation Research Record No. 1837. Transportation Research Board, Washington, D.C., 2003, pp. 73-79.
Gatchalian, D., Masad, E., Chowdhury, A., and Little, D. Characterization of Aggregate
Resistance to Degradation in Stone Matrix Asphalt Mixtures. In Transportation Research Record, No. 1962, Transportation Research Board, Washington, D.C., 2006, pp. 55-63.
Hossain, M.S., Lane, D.S., and Schmidt, B.N. “Use of the Micro-Deval Test for Assessing the
Durability of Virginia Aggregates” VTRC 07-R29 report, 2007. Hossain, M.S., F. Parker, and P.S. Kandhal. “Comparison and Evaluation of Tests for Coarse
Aggregate Particle Shape, Angularity, and Surface Texture” J. of Testing and Evaluation, Vol. 28, No. 2, 2000, pp. 77-87.
Lang, A.P., P. H. Range, D. W. Fowler, and J. J. Allen. Prediction of Coarse Aggregate
Performance by Micro-Deval and Other Soundness, Strength, and Intrinsic Particle Property Tests.” In Transportation Research Record No. 2026. Transportation Research Board, Washington, D.C., 2007, pp. 3-8.
Mahone, D.C. and C. Sherwood. “The Effect of Aggregate Type and Mix Design on the Wet
Skid Resistance of Bituminous Pavement: Recommendations for Virginia's Wet Accident Reduction Program” FHWA/VA-96-R10 report, 1995.
Rogers, C., Gorman, B., and Lane, B. “Skid-Resistant Aggregates in Ontario”. 10th Annual
Symposium Proceedings, International Center for Aggregates Research, 2002. Saeed, A., Hall, J.W., and Barker, W. Performance-Related Tests of Aggregates for Use in
Senior, S.A., and Rogers, C.A. "Laboratory Tests for Predicting Coarse Aggregate Performance in Ontario." In Transportation Research Record No. 1301. Transportation
Research Board, Washington, D.C., 1991. Virginia Department of Transportation. Road and Bridge Specifications. Richmond, 2007. Wang, L., D.S. Lane, Y. Lu, and C. Druta. Portable Image Analysis System For
Webb, J.W. The Wearing “Characteristics of Mineral Aggregates in Highway Pavements”. VHRC 70-R7, Virginia Highway Research Council, 1970.
White, T.D., Haddock, J.E., and Rismantojo, E. Aggregate Tests for Hot-Mix Asphalt Mixtures
Used in Pavements. NCHRP Report No. 557, Transportation Research Board, Washington, D.C., 2006. Wu, Y., F. Parker, and Kandhal, P. S. “Aggregate Toughness/Abrasion Resistance and
Durability/Soundness Tests Related to Asphalt Concrete Performance in Pavements” In Transportation Research Record No. 1638. Transportation Research Board, Washington, D.C., 1998, pp. 85-93.
22
23
APPENDIX A
IMAGES OF SELECTED PARTICLES This appendix contains images of selected particles from the sources before being subjected to the A/P MD and after various cycles. The following labeling convention is used:
• Source 1 – Before A/P MD
• Source 1a – After 1st A/P cycle (15 m)
• Source 1b – After 2nd A/P cycle (additional 30 m; 45 m total)
• Source 1c – After 3rd A/P cycle (additional 45 m; 90 m total)
24
25
26
27
28
29
30
31
32
33
34
35
APPENDIX B
AGGREGATE t-TEST STATISTICS (α = 0.05)
1 – Strasburgc
Cycles (min) Shape T Test Angularity T Test Texture T Test
0-15 0.1926 0.1286 0.47687
0-45 0.0943 0.0213 0.09721
0-90 0.0069 0.0014 0.27002
15-45 0.3655 0.2077 0.10919
15-90 0.0489 0.0286 0.25536
45-90 0.0610 0.1116 0.04318
2 – Broadwayc
Cycles (min) Shape T Test Angularity T Test Texture T Test
0-15 0.3935 0.4538 0.38458
0-45 0.3827 0.4083 0.30701
0-90 0.4940 0.4637 0.32043
15-45 0.4587 0.3176 0.10353
15-90 0.4548 0.1992 0.16789
45-90 0.1143 0.0780 0.40672
3 – Frazierc Cycles (min) Shape T Test Angularity T Test Texture T Test
0-15 0.0620 0.0076 0.10722
0-45 0.0002 0.0001 0.07903
0-90 0.0007 0.0240 0.09035
15-45 0.0384 0.0552 0.12920
15-90 0.1164 0.3034 0.25334
45-90 0.1474 0.0183 0.25851
4 – Maymeadnc Cycles (min) Shape T Test Angularity T Test Texture T Test
0-15 0.1362 0.0746 0.17937
0-45 0.2662 0.4923 0.36465
0-90 0.3944 0.1506 0.27790
15-45 0.0506 0.0703 0.27103
15-90 0.2161 0.3686 0.40318
45-90 0.1986 0.1446 0.37957
36
5 – Nolichuckync Cycles (min) Shape T Test Angularity T Test Texture T Test
0-15 0.1807 0.0578 0.49290
0-45 0.1530 0.3349 0.33336
0-90 0.1645 0.1982 0.41560
15-45 0.1657 0.1215 0.34462
15-90 0.2863 0.2498 0.42488
45-90 0.3429 0.3289 0.41679
6 - Castlewoodc Cycles (min) Shape T Test Angularity T Test Texture T Test
0-15 0.1164 0.0483 0.19417
0-45 0.4645 0.3396 0.20818
0-90 0.3061 0.2636 0.38969
15-45 0.0809 0.0111 0.32715
15-90 0.2562 0.1607 0.11817
45-90 0.2626 0.1354 0.14098
7 – Rockydalec Cycles (min) Shape T Test Angularity T Test Texture T Test
0-15 0.2576 0.3972 0.48669
0-45 0.1860 0.1436 0.06417
0-90 0.0518 0.0477 0.40766
15-45 0.4255 0.2241 0.06915
15-90 0.1803 0.0886 0.42070
45-90 0.2172 0.2630 0.10429
8 – Perryc Cycles (min) Shape T Test Angularity T Test Texture T Test
0-15 0.2798 0.4850 0.16327
0-45 0.1667 0.2915 0.26227
0-90 0.1287 0.4881 0.14165
15-45 0.3041 0.2851 0.38995
15-90 0.2420 0.5000 0.15972
45-90 0.4344 0.3180 0.15407
37
9 – Stauntonc Cycles (min) Shape T Test Angularity T Test Texture T Test
0-15 0.2367 0.4754 0.01198
0-45 0.2081 0.3509 0.17012
0-90 0.1392 0.0979 0.40656
15-45 0.4934 0.3947 0.08277
15-90 0.3925 0.1432 0.01437
45-90 0.2183 0.2419 0.14025
10 – Salemnc Cycles (min) Shape T Test Angularity T Test Texture T Test
0-15 0.3273 0.2920 0.38133
0-45 0.0945 0.0903 0.32516
0-90 0.2896 0.3997 0.21001
15-45 0.1796 0.2396 0.46116
15-90 0.4481 0.3889 0.32590
45-90 0.2255 0.1554 0.33852
38
39
APPENDIX C
AGGREGATE POLISHING-SKID RESISTANCE STUDY, PHASE II
Introduction
Phase I of this research focused on assessing the characteristics of selected carbonate and non-carbonate aggregates available in the western part of Virginia. The carbonate aggregates are normally classified as “polishing”, and thus not considered suitable for use in pavement surfaces except on roads with average daily traffic under 750 vehicles per day. The work has involved petrographic examination of the aggregates, determination of acid-insoluble residue, and an evaluation of the wearing characteristics of the aggregate in the Micro-Deval (MD) apparatus with quartz sand. Digital imaging and image analysis was used to assess the changes in particle angularity, shape, and surface texture induced by the abrasion testing as a measure of the polishing tendency of the aggregate. An interim report will be available in the beginning of 2010. Following on from the Phase I study, Phase II will focus on the development of an accelerated wearing protocol for assessing the susceptibility of asphalt surface mixes to polishing. Also, an assessment of surface mixes containing various amounts of carbonate aggregate as coarse and fine aggregate will be conducted, to establish guidelines regarding the use of carbonate aggregate while maintaining satisfactory wearing and skid characteristics of the pavements.
Phase II Outline Task 1 (4 months) Evaluate the three experimental sections in Bristol constructed with carbonate fine aggregate. These sections have been under traffic for several years now. Information on ADT and total trafficking will be obtained. Plugs taken in the summer of 2007 are available to indicate the general surface condition at that time. At least two, and preferably three to four, evaluations of the trafficked surface will be performed to cover anticipated annual variation in surface condition. The first two evaluations will be performed in early spring for maximum skid resistance, and mid-late summer to early fall of 2010 for minimum skid resistance, with repeated evaluations made during the same periods in the following year as the study funding and duration allows. The evaluations will include high resolution digital imaging, measurement of surface texture and friction (circular meter and dynamic friction tester), and skid trailer testing. Other sites, if available in Virginia, can be considered for inclusion. It may also be possible to obtain similar sets of data for relevant sites from other agencies.
40
Task 2 (2 months) Set up the Model Mobile Load Simulator 3 (MMLS3) equipment for use in performing accelerated surface wearing of pavement specimens and pavements. The MMLS3 is a scaled accelerated trafficking machine for laboratory and field testing. It applies realistic rolling wheel contact stresses at a fraction of the cost of full scale Accelerated Pavement Testing (APT). The machine is capable of applying loads to induce rutting and fatigue on HMA pavements and specimens (slabs and briquettes). For this purpose it may be necessary to incorporate some means of dispensing water and an abrasive grit such as fine silica sand as is done with other accelerated polishing machines. This task has an estimated cost of $18-20K; however, following the installation, the MMLS3 would be available for a variety of other pavement studies both in the laboratory and in the field. Task 3 (1 month) Develop an accelerated wear protocol using the MMLS3. This will be based on an existing protocol for rutting and moisture susceptibility and will involve the wandering capability of the machine to avoid specimen rutting. This will be accomplished using surface mixes produced using a known polishing aggregate with a low insoluble residue (IR) such as limestone and a nonpolishing aggregate with good service history. The protocol will be established to clearly distinguish between the wearing characteristics of the polishing and nonpolishing aggregate mixes. At stages throughout the wearing/polishing process the specimen surfaces will be evaluated for surface texture and friction using the same equipment used to perform the evaluations in Task 1 (with the exception of skid trailer testing). The wearing will be continued to the terminal polishing point. Task 4 (3 months) Select a set of two or three experimental surface mixes of interest to the technical panel to be evaluated using the MMLS3 wearing protocol. Select a suite of at least three aggregates, one each in the following categories: high polishing (HP) (low IR, limestone), moderate polishing (MP) (moderate IR dolomitic limestone or dolostone), and nonpolishing (NP) as determined in Phase I of the study. Select a suite of blending combinations of polishing and nonpolishing aggregate to use in the experimental surface mixtures. For instance, three control mixes would be produced using each aggregate as both coarse and fine fraction at 100% of the fraction. Two additional mixes would follow the Bristol District experimental design of combining a nonpolishing coarse aggregate with the HP and MP aggregates as 100% of the fine fraction. Additional blends would incorporate varying percentages of HP and MP with NP in both the coarse or fine aggregates and perhaps a set blending the HP and MP with each other. The selection of the aggregate combinations to be used in the mixes will be done in consultation with the technical panel to ensure that their interests are being met. It is anticipated that the maximum number of mixes that could be evaluated given the projected level of funding is 12. Table C-1 presents a framework for developing the experimental aggregate combinations.
41
Table C-1. Experimental aggregate combinations Aggregate type
Control Mix
HP
MP
NP
Blend 1 NP+HP+M
P
Blend 2 NP+HP+M
P
Blend 3
NP + HP+MP Mix 1 CA & FA 100%
2 Slabs
- - - - -
Mix 2 CA & FA 100%
- 2 S
- - - -
Mix 3 CA & FA 100%
- - 2 S
- - -
Mix 4 FA 100%
- - - 2 S - -
Mix 5 FA 100%
- - - - 2 S HP>MP
-
Mix 6 CA 100%
- - - - - 2 S
Task 5 (8 months) Prepare test specimens from the experimental mixes and subject to accelerated wearing with the MMLS3 using the protocol established in task 3, with the wearing continuing to the terminal polishing point. Large samples will be prepared (e.g., square-shaped slabs) in order to be tested for friction and surface texture profile. The research team will investigate options on how to prepare the HMA slabs. Surface texture and frictional properties of the surface will be measured periodically throughout the wearing process as established by the protocol. Task 6 (2 months) Analyze the data obtained in Task 5 and, in consultation with the technical panel, recommend several promising mixes for field trials. The basis for selection would be aggregate blends that provided acceptable surface texture and frictional properties through the accelerated wearing tests and offered economical benefits through the use of local materials. It is anticipated that aggregate sources not included in the experimental wearing program could also be included in field trials by comparing their polishing characteristics to the aggregates studied and accelerated wearing evaluation of the proposed mix. The current thinking is that field installations should follow the experimental work as a Phase III of the program. However, if the technical panel feels that certain trials could be constructed contemporaneously with the early tasks of the project that can be considered. This task can be coordinated with the annual paving schedules with section selection considering ADT level as considered appropriate by the panel. Task 7 (2 months) Based on the findings of the project regarding the potential increased use of carbonate aggregate in the surface course, VTRC will conduct an evaluation of the economics of this change in practice.
42
Task 8 (2 months) Prepare final report and guidance documents outlining the characterization of aggregate polishing characteristics, accelerated wear evaluation protocol, and recommendations regarding the use of polishing aggregates in surface mixes that will provide pavements with satisfactory wearing characteristics.