72
Methods for Determining Inputs to Environmental Petroleum Hydrocarbon Mobility and Recovery Models Regulatory and Scientific Affairs API PUBLICATION NUMBER 4711 JULY 2001

Methods for Determining Inputs to Environmental Petroleum Hydrocarbon Mobility and Recovery Models
Regulatory and Scientific Affairs
API PUBLICATION NUMBER 4711JULY 2001


Methods for Determining Inputs to Environmental Petroleum Hydrocarbon Mobility and Recovery Models
Regulatory and Scientific Affairs Department
API PUBLICATION NUMBER 4711JULY 2001
PREPARED UNDER CONTRACT BY:Tom Sale, Ph.D.Research ScientistDepartment of Chemical and Bioresource EngineeringColorado State University

FOREWORD
API publications necessarily address problems of a general nature. With respect to partic-ular circumstances, local, state and federal laws and regulations should be reviewed.
API is not undertaking to meet the duties of employers, manufacturers, or suppliers to warnand properly train and equip their employees, and others exposed, concerning health andsafety risks and precautions, nor undertaking their obligations under local, state, or federallaws.
Nothing contained in any API publication is to be construed as granting any right, by impli-cation or otherwise, for the manufacture, sale, or use of any method, apparatus, or productcovered by letters patent. Neither should anything contained in the publication be construed asinsuring anyone against liability for infringement of letters patent.
All rights reserved. No part of this work may be reproduced, stored in a retrieval system, ortransmitted by any means, electronic, mechanical, photocopying, recording, or otherwise,
without prior written permission from the publisher. Contact the Publisher,API Publishing Services, 1220 L Street, N.W., Washington, D.C. 20005.
Copyright © 2001 American Petroleum Institute

Table of Contents
1.0 INTRODUCTION ......................................................................................................................................... 5
2.0 NOMENCLATURE AND PARAMETERS OF INTEREST..................................................................................... 6
3.0 FLUID PROPERTIES................................................................................................................................. 133.1 Sample Collection ............................................................................................................................ 13
3.2 Density ( oρ ) .................................................................................................................................... 13
3.3 Viscosity ( oµ ).................................................................................................................................. 15
3.4 Surface Tension and Interfacial Tension ( aoσ , owσ , and awσ ).................................................... 15
4.0 POROUS MEDIA PROPERTIES – LABORATORY-SCALE............................................................................. 174.1 Sample Collection............................................................................................................................ 17
4.2 Core Preservation (Field) ................................................................................................................ 19
4.3 Core Screening and Preparation (Laboratory) ............................................................................... 20
4.4 Porosity (φ )...................................................................................................................................... 21
4.5 Permeability ( k ) .............................................................................................................................. 21
4.6 Capillary Pressure vs. Saturation ( cP vs.S ) ................................................................................. 23
4.7 Relative Permeability vs. Saturation ( rk vs. S )............................................................................ 24
4.8 Water and Product Saturation ( Sw
vs. So)..................................................................................... 26
4.9 Determination of Brooks-Corey Model Parameters (λ , dP , and wrS ) ....................................... 28
4.10 Determination of van Genuchten Parameters ( rwS , M , and α ) ............................................... 29
5.0 POROUS MEDIA PROPERTIES – FIELD-SCALE......................................................................................... 315.1 Baildown Tests................................................................................................................................. 315.2 Production Tests .............................................................................................................................. 32
Theim Solution ................................................................................................................................. 32 Decline Curve Analysis.................................................................................................................... 34
6.0 REPORTING............................................................................................................................................ 36
7.0 REFERENCES ......................................................................................................................................... 37
APPENDIX A – SHORT ABSTRACTS OF RELEVANT ASTM METHODS ............................................................. 40
APPENDIX B – DERIVATION OF METHODS FOR ESTIMATING RELATIVE PERMEABILITY, AVERAGECONDUCTIVITY TO OIL, AND TRANSMISSIVITY TO OIL FROM PRODUCTION DATA..................... 61
APPENDIX C – DERIVATION OF DECLINE CURVE METHOD............................................................................. 64
List of Figures
FIGURE 1 – GENERAL CONCEPTUAL MODEL ....................................................................................................... 7
FIGURE 2 – HYDROSTATIC PRESSURE IN AIR, PRODUCT, AND AQUEOUS PHASES (AFTER FARR ET AL. 1990) ............. 8
FIGURE 3 – CAPILLARY PRESSURE - SATURATION RELATIONSHIP FOR TWO-FLUID SYSTEM IN POROUS MEDIA............... 9
2

FIGURE 4 – TYPICAL RELATIONSHIP BETWEEN RELATIVE PERMEABILITY AND FLUID SATURATION
FOR A TWO PHASE SYSTEM UNDER DRAINAGE................................................................................. 10
FIGURE 5 – CAPILLARY RISE AS FUNCTION OF HYDRAULIC CONDUCTIVITY (AFTER MCWHORTER, 1996) .......... 19
FIGURE 6 – GRAPHIC FORMAT FOR ANALYSIS OF BROOKS-COREY PARAMETERS USING EFFECTIVE
SATURATION VERSUS CAPILLARY HEAD DATA (DATA FROM BROOKS AND COREY [1964],FINE SAND)..................................................................................................................................... 28
FIGURE 7 – GRAPHIC FORMAT FOR ANALYSIS OF BROOKS-COREY PARAMETERS USING RELATIVE
PERMEABILITY SATURATION VERSUS CAPILLARY HEAD DATA (DATA FROM BROOKS AND
COREY [1964], FINE SAND) ............................................................................................................ 29
FIGURE 8 – GRAPHIC FORMAT OF ANALYSIS FOR VAN GENUCHTEN PARAMETERS USING LOG CAPILLARY
PRESSURE VS. SATURATION DATA (DATA FROM BROOKS AND COREY [1964], FINE SAND)............... 30
FIGURE 9 – DUAL PHASE RECOVERY WELL PRODUCTION DATA ....................................................................... 33
FIGURE 10 – TRANSMISSIVITY TO PRODUCTS AS A FUNCTION OF TIME DEVELOPED USING WELL
PRODUCTION DATA FROM FIGURE 9 AND EQUATION (18) .............................................................. 34
FIGURE 11 – GRAPHICAL FORMAT FOR DECLINE CURVE ANALYSIS..................................................................... 35
List of Tables
TABLE 1 – PRODUCT DENSITY METHODS ( oρ ) ................................................................................................. 14
TABLE 2 – VISCOSITY METHODS ( oµ ).............................................................................................................. 15
TABLE 3 – SURFACE TENSION AND INTERFACIAL TENSION METHODS ( aoσ AND owσ ) ........................................ 16
TABLE 4 – POROSITY METHODS (φ )................................................................................................................. 21
TABLE 5 – PERMEABILITY METHODS ( k ) .......................................................................................................... 22
TABLE 6 – METHODS FOR CAPILLARY PRESSURE AS A FUNCTION OF SATURATION ( cP VS. S ).......................... 23
TABLE 7 – METHODS FOR RELATIVE PERMEABILITY AS A FUNCTION OF SATURATION ( rk VS. S ) ...................... 25
TABLE 8 – WATER AND PRODUCT SATURATION METHODS ( wS AND oS ) ......................................................... 27
TABLE 9 – BAILDOWN TEST METHODS FOR ESTIMATION OF PRODUCT TRANSMISSIVITY (FIELD-SCALE oT ) ......... 32
3

Acknowledgments
API STAFF CONTACTHarley Hopkins, Regulatory and Scientific Affairs Department
MEMBERS OF THE SOIL AND GROUNDWATER TECHNICAL TASK FORCE
MEMBERS OF THE GW-90 PROJECT TEAM:
Ravi Kolhatkar (Project Team Leader), BP AmocoGeorge DeVaull, Equilon Enterprises LLC
Tom Henson, ExxonMobil CorporationJim Higinbotham, ExxonMobil Corporation
Dan Irvin, ConocoVic Kremesec, BP AmocoMark Lyverse, Chevron
API acknowledges the following individuals for their contributions to this manual:
G. D. Beckett, Aqui-Ver, Inc.Randall Charbeneau, University of Texas at Austin
Art Corey, Professor Emeritus, Colorado State UniversityLarry Kunkel, PTS Laboratories, Inc.
David McWhorter, Professor Emeritus, Colorado State UniversityGary Moore, ERM
Malcolm Pitts, Surtek, Inc.
4

5
1.0 Introduction
This manual describes methods used to obtain input parameters for models that evaluate themobility and potential recovery of petroleum liquids in unconsolidated granular porous media.These models are valuable tools for improving system design because, unfortunately, thepresence of petroleum liquids in a well is not itself a reliable indicator of the feasibility of free-product recovery or the need to continue recovery operations.
The feasibility and appropriate endpoint for free-product recovery can be addressed byevaluating the mobility of product in the sediment in which it is encountered. If the mobility ofproduct is high, there is a potential for future adverse product migration. In addition, it is likelythat properly designed recovery systems can effectively deplete a significant fraction of themobile product. Conversely, if the mobility of the product is low, the risk associated with futuremigration is low, and efforts to deplete mobile product will be ineffective.
The intent of this document is to provide a reference for parties needing methods fordetermining inputs to product mobility, and volume models. The need for such data (inparticular at large sites such as refineries) has increased dramatically in recent years. In largepart this has been driven by broader use of multiphase flow models (e.g., Parker et al., 1994)and spreadsheet tools for analysis of product mobility (e.g., Charbeneau et al., 1999).Secondarily, it is recognized that for small sites the resources needed to conduct site specificmobility investigations may not be available. As such, it would be useful to generate a database of study results (obtained using consistent methods) that can be used at these sites.
Standardization of methods is the ideal; unfortunately, it may not be possible in all cases. Anumber of factors frustrate rigid standardization. First, significant differences exist betweensites. A direct consequence is that the best methods for many analyses are different fordifferent sites. Secondly, only a few specialized laboratories conduct a number of the analyses(e.g., capillary pressure vs. saturation and relative permeability vs. saturation). The equipmentand methods used by these laboratories are highly specialized and frequently different. Assuch, it may not be possible to have all sites conduct measurements using a single method.Reflecting these challenges, this document provides options as opposed to rigid standards.
The first section introduces nomenclature and parameters of concern. Individuals familiar withmultiphase flow in porous media can skip this section. The second section addressesdetermination of fluid properties. The third section describes methods for analysis of porousmedia properties at a laboratory (column) scale. The fourth section addresses measurement ofporous media properties at a field scale. Lastly, suggestions for reporting results are presented.
Throughout this document practices are described that involve the handling of potentiallyhazardous materials. This document does not address health, safety, and regulatorycompliance issues. It is the responsibility of the user of this document to establish appropriatehealth and safety practices and to comply with relevant regulations.

6
2.0 Nomenclature and Parameters of Interest
A general conceptual model for petroleum hydrocarbon in granular porous media is presented inFigure 1. In this example, a surface release of product has percolated through the unsaturatedzone. Below the capillary fringe an interval has formed in which product occurs as a continuousnon-wetting phase in the porous media. The term non-wetting reflects product occupying thelargest pore space and not directly contacting the porous media. The porous media issurrounded by a continuous water phase referred to as the wetting phase. Immediately abovethe capillary fringe, product forms a continuous intermediate wetting phase between the water(wetting phase) and the air (non-wetting phase). The critical feature to recognize is that two orthree separate fluid phases (including product) coexist in the pore space where product ispresent.
Product that forms a continuous phase within the porous media is referred to as potentiallymobile product or mobile product. The qualifier “potentially” is included because movementis contingent on the presence of a driving force. Product that is not present as a continuousphase is referred to as residual or immobile product. A significant feature of residual productis that it is typically immobile under the typical range of driving forces associated with natural orinduced groundwater flow.
The volumetric flux of product oq (L3/L2-T) at any point in the continuous product interval can be
described as:
+−=
dx
dzg
dx
dPkkq o
o
o
roo ρ
µ(1)
where:
k (L2) IntrinsicPermeability
a property of the porous media that describes itscapacity to transmit a single fluid that fullysaturates the porous media (saturation equal to 1).
rok (Dimensionless) RelativePermeability toProduct
a ratio of permeability to product at a poresaturation less than 1 to the permeability at a poresaturation of 1. This describes reducedpermeability associated with product occupyingonly a fraction of the total pore space.
oµ (M/LT) Dynamic Viscosity a measure of a fluid’s resistance to shear.
oP (F/L2) Pressure force per unit area in the product phase in theproduct or oil.
x (L) Distance in the direction of flow.
oρ (M/L3) Density mass per unit volume of oil.
g (L/T2) GravitationalConstant
acceleration imposed by gravity.
z (L) Elevation position above a given datum.
(Note: L = length, M = mass, T= time, F= force)

7
Continuous Product (Two Phase Zone)
Entry Point
Discontinuous Immobile Residual
Product (Two Phase Zone)
Continuous Product
(Three Phase Zone)
Plumes
Figure 1 — General Conceptual Model
The mobility of the product is defined as:
o
roo
kkM
µ= (2)
Unfortunately, the fraction of pore space filled with product (So), and consequently the relativepermeability to product (kro), changes with position. As such, mobility (Mo) is a function ofposition within the interval of continuous product. Variation in product saturation (So) reflectslocally varying differences in pressure between the non-wetting and wetting phase pressures.This difference is defined as capillary pressure (F/L2)
wnwc PPP −= (3)
8
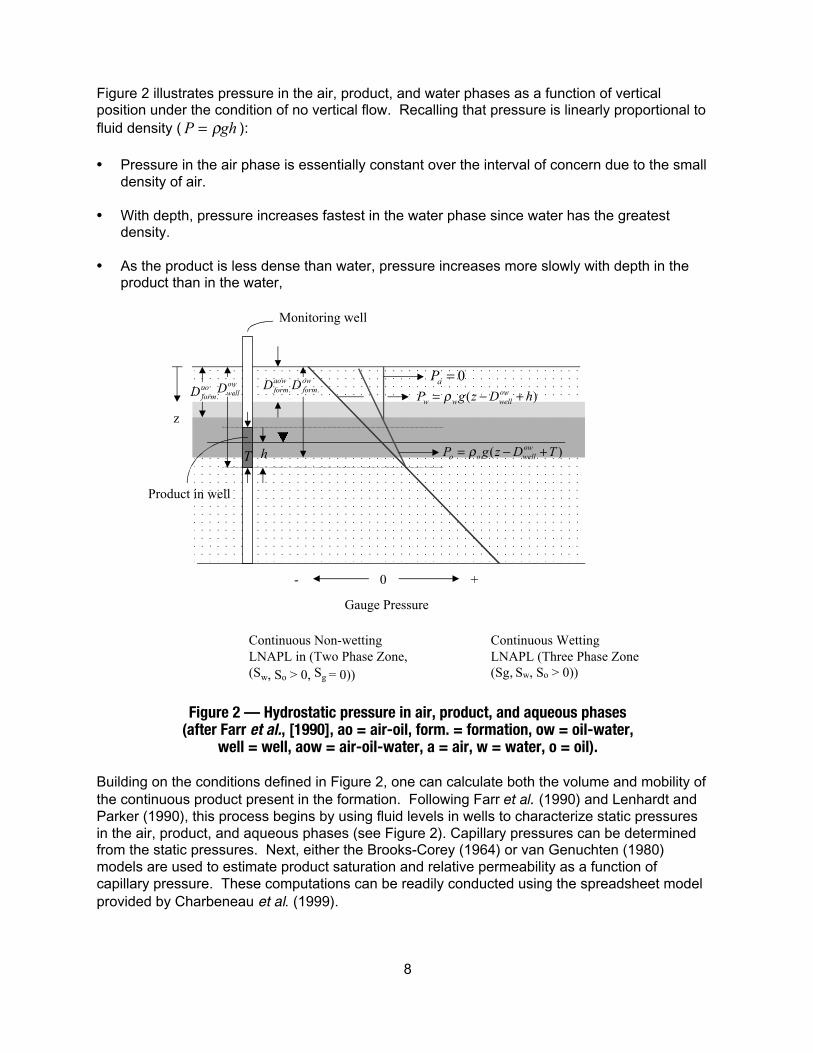
Figure 2 illustrates pressure in the air, product, and water phases as a function of verticalposition under the condition of no vertical flow. Recalling that pressure is linearly proportional tofluid density ( ghP ρ= ):
• Pressure in the air phase is essentially constant over the interval of concern due to the smalldensity of air.
• With depth, pressure increases fastest in the water phase since water has the greatestdensity.
• As the product is less dense than water, pressure increases more slowly with depth in theproduct than in the water,
Gauge Pressure
0 +-
Continuous Non-wettingLNAPL in (Two Phase Zone,(Sw, So > 0, Sg = 0))
Continuous Wetting LNAPL (Three Phase Zone(Sg, Sw, So > 0))
Figure 2 — Hydrostatic pressure in air, product, and aqueous phases(after Farr et al., [1990], ao = air-oil, form. = formation, ow = oil-water,
well = well, aow = air-oil-water, a = air, w = water, o = oil).
Building on the conditions defined in Figure 2, one can calculate both the volume and mobility ofthe continuous product present in the formation. Following Farr et al. (1990) and Lenhardt andParker (1990), this process begins by using fluid levels in wells to characterize static pressuresin the air, product, and aqueous phases (see Figure 2). Capillary pressures can be determinedfrom the static pressures. Next, either the Brooks-Corey (1964) or van Genuchten (1980)models are used to estimate product saturation and relative permeability as a function ofcapillary pressure. These computations can be readily conducted using the spreadsheet modelprovided by Charbeneau et al. (1999).
z
)( hDzgP owwellww +−= ρ
)( TDzgP owwelloo +−= ρ
0=aPowwellD
hT
Monitoring well
Product in well
aoformD .
aowformD .
owformD .
9
As an introduction to the remaining parameters of interest, the following describes the Brooks-Corey and van Genuchten models. Both of these models are algebraic equations used to fitcapillary pressure versus saturation data obtained from laboratory studies. For simplicity, thedefinition of physical parameters employed in describing both the models follows that used inBrooks and Corey (1964). Fitting parameters follow the definition presented in Brooks andCorey (1964) and van Genuchten (1980).
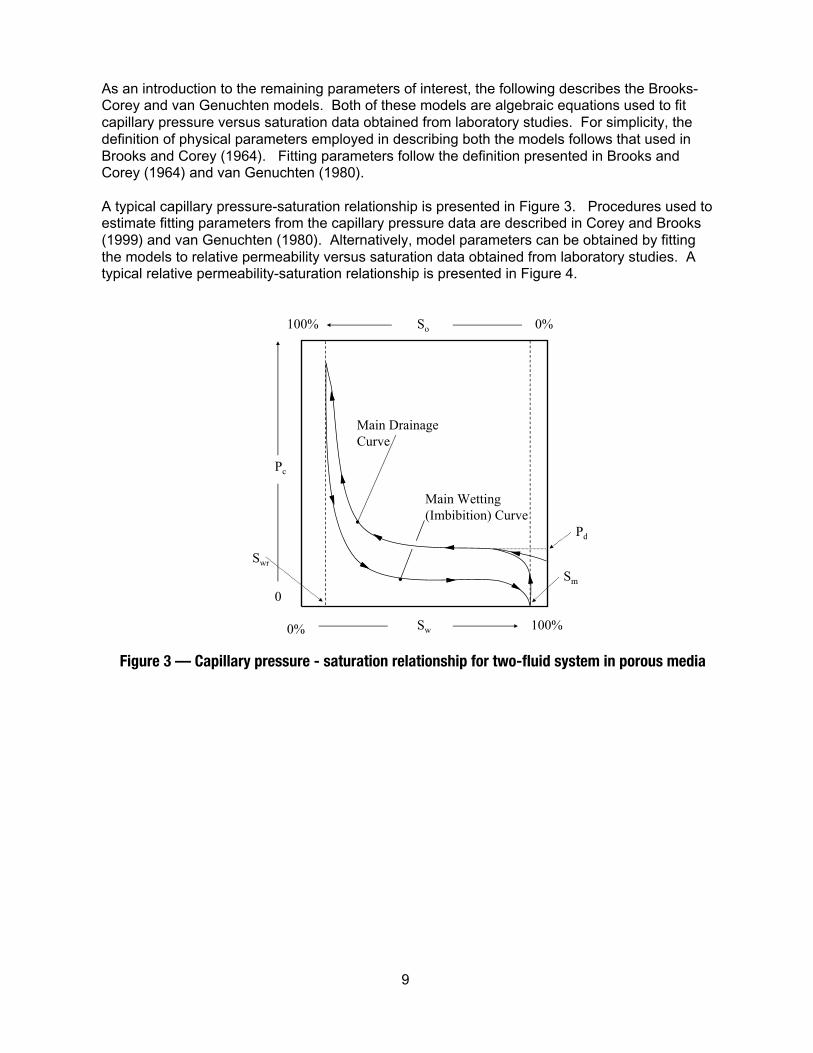
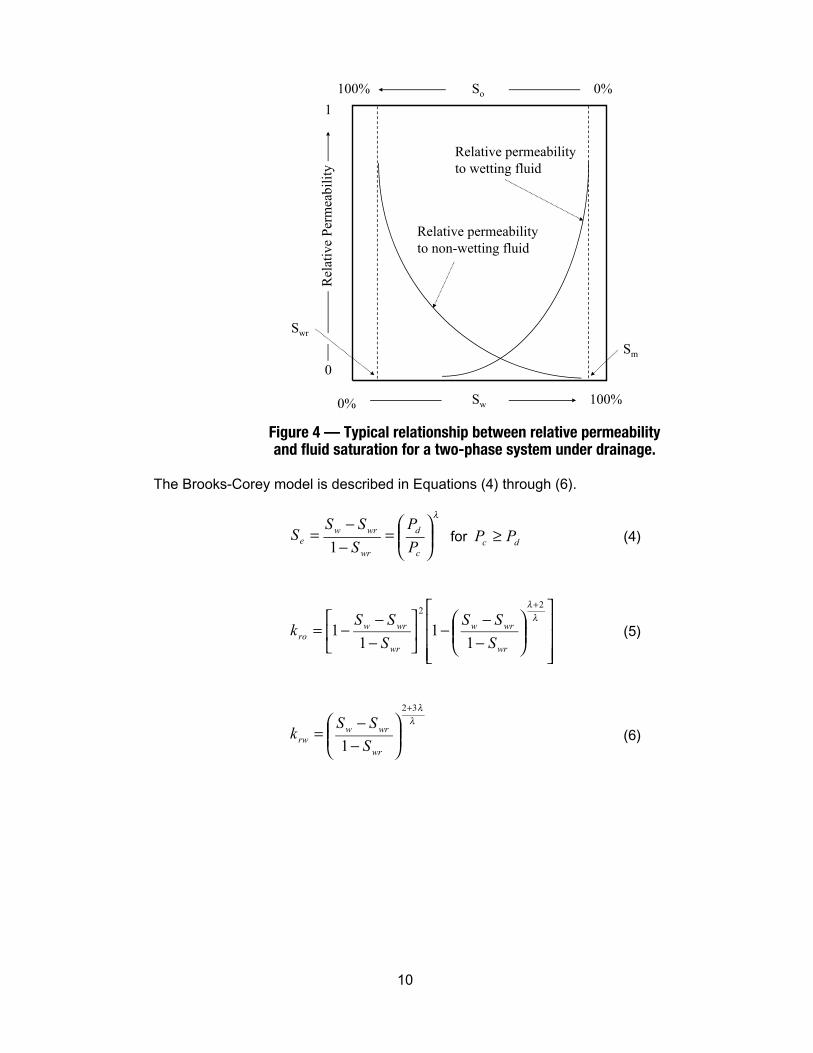
A typical capillary pressure-saturation relationship is presented in Figure 3. Procedures used toestimate fitting parameters from the capillary pressure data are described in Corey and Brooks(1999) and van Genuchten (1980). Alternatively, model parameters can be obtained by fittingthe models to relative permeability versus saturation data obtained from laboratory studies. Atypical relative permeability-saturation relationship is presented in Figure 4.
So100% 0%
100%0% Sw
Pc
0
Pd
Main Drainage Curve
Main Wetting(Imbibition) Curve
Sm
Swr
Figure 3 — Capillary pressure - saturation relationship for two-fluid system in porous media
10
100% 0%
100%0%
Rel
ativ
e Pe
rmea
bilit
y
0
1
Relative permeabilityto wetting fluid
Relative permeabilityto non-wetting fluid
So
Sw
Swr
Sm
Figure 4 — Typical relationship between relative permeabilityand fluid saturation for a two-phase system under drainage.
The Brooks-Corey model is described in Equations (4) through (6).
λ
=
−−
=c
d
wr
wrwe P
P
S
SSS
1 for dc PP ≥ (4)
−−
−
−−
−=
+λ
λ 22
11
11
wr
wrw
wr
wrwro S
SS
S
SSk (5)
λλ32
1
+
−−
=wr
wrwrw S
SSk (6)

11
where:
eS (Dimensionless) Effective WettingPhase Saturation
wetting phase saturation as defined in (4)
wS (Dimensionless) Wetting PhaseSaturation
fraction of the pore space filled with wetting phase.
wrS (Dimensionless) IrreducibleWetting PhaseSaturation
model fitting parameter. Roughly equal to theminimum wetting phase saturation at largecapillary pressure (maximum product saturation).
dP (F/L2) DisplacementPressure
model fitting parameter. Roughly equal to theminimum capillary pressure at which the non-wetting phase is present as continuous phase inthe porous media. Brooks and Corey (1964) alsorefer to this parameter as bubbling pressure.
λ (Dimensionless) Lambda model fitting parameter. Generally a function ofgrain size distribution.
rok (Dimensionless) RelativePermeability tothe non-wettingphase
a ratio of permeability to the non-wetting phase atpore saturation less than 1 to the permeability at apore saturation of 1.
rwk (Dimensionless) RelativePermeability tothe wetting phase
a ratio of permeability to wetting phase at a poresaturation less than 1 to the permeability at a poresaturation of 1.
Following Parker et al., (1987) and Charbeneau et al., (1999), the van Genuchten model isdescribed in Equations (7) through (9). Note the van Genuchten model parameter ( N ) is notincluded in Equations (7) through (9). This reflects the substitution ( )MN −= 1/1 proposed byvan Genuchten (1980) when using Mualem’s model for relative permeability (Mualem, 1976).
M
Mc
wr
wrwe
PS
SSS )
)(1
1(
11
1
−+=
−−
∫α
for 0≥cP (7)
211
2
1
11
11
1
−
−+−−
−−
−
−
=
M
M
wr
wrow
M
M
wr
wrw
wr
oro S
SSS
S
SS
S
Sk (8)
2/1
2
1
111
1
−−
−−
−−
=
MM
wr
wrw
wr
wrwrw S
SS
S
SSk (9)

12
where:
M (Dimensionless) M van Genuchten fitting parameter.a (L2/F) Alpha van Genuchten fitting parameter.
Lastly, the parameters of concern are not always measured using site water and product. Insome cases air or mercury are used in laboratory studies. To correct back to the fluids ofconcern, it is necessary to obtain estimates of air-product interfacial tension ( aos ), air-water
interfacial tension ( aws ), and product-water surface tension ( ows ). The units of interfacial and
surface tension are force per unit area (F/L).
13
3.0 Fluid Properties
3.1 Sample Collection
Analysis of product properties begins with obtaining representative product samples. Typicallythis is accomplished by bailing free product from monitoring wells or collecting samples fromactive free-product recovery systems. Samples should be collected from a sufficient number ofpoints to characterize the product present. Spatial variations in product properties commonlyoccur due to releases of different products and/or differential in situ weathering. A minimumvolume of 250 mL of product (free of water) should be collected. Samples should be stored inbrown glass containers with minimal head space and kept cool. No preservatives are required.
In all cases the in situ temperature of the product should be determined. This reflects thedependence of fluid properties on temperature. In the case of bailed product samples,temperature should be measured immediately after collection. In the case of active recoverysystems, the temperature should be measured in fluids that are ÒfreshÓ from the well (asopposed to stagnant fluids from piping or tanks). A third option is to lower a thermometer in asecure housing down a well to the water table. In all cases the thermometer should have aminimum accuracy of 1-degree Celsius.
After sources of representative product samples have been identified, additional product andwater samples should be collected for laboratory core studies. The volume of water andproduct needed to conduct core studies should be determined by asking the laboratory. Again,samples should be stored in brown glass containers with minimal head space and kept cool.
3.2 Density ( or )
Table 1 presents methods for determining the density of petroleum liquids. The order reflectscommon to uncommon use. Results can be reported in terms of density (M/L3) or as oAPIgravity. Calculations typically require results to be expressed in terms of density. Theconversion from API gravity to density is:
woo APIrr
5.131
5.141
+= (10)
In general, the density of site water should also be measured. This reflects the fact that bothdissolved organic and inorganic compounds can effect water density. The density of water issignificant in that capillary pressure is a function of the difference in density between water andproduct. Ideally, measurements should be made using liquids at their in situ temperature.Sensitivity to temperature is illustrated by considering fuel oil which varies in density by 2percent over the range of 0 to 25 degrees Celsius (Charbeneau et al., 1999).

14
Table 1 — Product density methods ( or )
Method Description CommentsASTM D1298-99 orASTM D-287
Standard Practice for Density,Relative Density (SpecificGravity), or API Gravity ofCrude Petroleum and LiquidPetroleum Products byHydrometer Method
Suitable for field determinationof density. Hydrometers canbe purchased for a small cost.Accuracy (typically 0.0035 to0.007 gm/cm3) is dependenton the range of thehydrometer used. Methodrequires ~ 200 mL sample.
ASTM D1217-93(1998)
Standard Test Method forDensity and Relative Density(Specific Gravity) of Liquids byBingham Pycnometer
Best for distillates that boilbetween 90 and 110°C.Precision is ~0.00001 gm/cm3.
ASTM D1481-93(1997)
Standard Test Method forDensity and Relative Density(Specific Gravity) of ViscousMaterials by Lipkin BicapillaryPycnometer
Oils more viscous than 15 cStat 20°C (mm /s), and ofviscous oils and melted waxesat elevated temperatures.
ASTM D1480-93(1997)
Standard Test Method forDensity and Relative Density(Specific Gravity) of ViscousMaterials by BinghamPycnometer
Less accurate than ASTMD1217-93. Precision is~0.00005 gm/cm3.
ASTM D4052-96 Standard Test Method forDensity and Relative Densityof Liquids by Digital DensityMeter
Suitable for materials that areliquids at 15-35°C. Liquidsshould be translucent.Precision is ~0.0001 gm/cm3.
ASTM D5002-99 Standard Test Method forDensity and Relative Densityof Crude Oils by DigitalDensity Analyzer
Appropriate for low vaporpressure crude oils.
ASTM D3505-96 Standard Test Method forDensity or Relative Density ofPure Liquid Chemicals
Requires accurate knowledgeof temperature expansionfunctions.
Further details regarding ASTM methods may found in Appendix A - Short Abstracts of RelevantASTM Methods.

15
3.3 Viscosity ( om )
Table 2 presents methods used to determine the viscosity of petroleum liquids. The orderreflects common to uncommon use. Measurements should be made at in situ temperatures.Illustrating sensitivity to temperature, the viscosity of kerosene varies by 54% over the range of0 to 25 degrees Celsius (Charbeneau et al., 1999). Whenever possible, measurements shouldbe made using liquids collected from the site of concern. Prolonged exposure of petroleumliquids to soil and water can have contact significant effects on the viscosity of petroleum liquids.
Table 2 — Viscosity methods ( om )
Method Description CommentsASTM D445-97 Standard Test Method for
Kinematic Viscosity ofTransparent and OpaqueLiquids (the Calculation ofDynamic Viscosity).
Common wet chemistrytechnique.
Brookfield, Pfann, orRotational Viscometer
Principle of rotational viscositymeasurement employs aspindle immersed in the fluidsample to sense torqueresistance when running atconstant speed.
Common instrumenttechnique.
ASTM D4486-91(1996)e1
Standard Test Method forKinematic Viscosity of Volatileand Reactive Liquids.
Best for volatile and reactiveliquids.
3.4 Surface Tension and Interfacial Tension ( aos , ows , and aws )
Table 3 presents methods used to measure surface and interfacial tension. Key parameters ofconcern are air-oil interfacial tension, air-water surface tension, and oil-water surface tension.The order reflects common to uncommon use. Measurements should be made at temperaturesclose to in situ conditions. As with viscosity and density, measurements should be made usingliquids from the site of concern. Prolonged interactions between water, petroleum liquids andsoil can have significant effects on fluid properties.

16
Table 3 — Surface tension and interfacial tension methods ( aos , ows , and aws )
Method Description CommentsASTM D971-99a (e.g.,DuNouy Tensiometer)
Standard Test Method forInterfacial Tension of OilAgainst Water by the RingMethod
(Gas-Liquid & Liquid-Liquid)+0.1 mN/m.
Spinning DropTensiometer
Relies on centripetal forceswhich replace gravity in othertypes of tensiometers
(Gas-Liquid & Liquid-Liquid)0.005 mN/m ~ 500 mN/m,measuring range good forcrude oil, surfactant solutions.
ASTM D3825-90(1995)
Standard Test Method forDynamic Surface Tension bythe Fast-Bubble Technique
(Gas-Liquid) Suitable forliquids with viscosity less than4 centipoise, not suitable foropaque DNAPL.
ASTM D1331-89(1995)
Standard Test Methods forSurface and InterfacialTension of Solutions ofSurface-Active Agents
(Liquid-Liquid) Suitable tosurface-active agents. Alsoapplicable to nonaqueoussolutions and mixed solventsolutions.
ASTM D2285-99(Pendant Drop)
Standard Test Method forInterfacial Tension ofElectrical Insulating Oils ofPetroleum Origin AgainstWater by the Drop-WeightMethod
Applicable to viscoussolutions.

17
4.0 Porous Media Properties – Laboratory-Scale
The following outlines procedures for determining physical properties of porous media thatrelate to product mobility. In general, the methods described reflect decades of research in thefields of petroleum, soil science, and groundwater hydrology.
4.1 Sample Collection
Sediments - Analysis of soil properties at a laboratory scale begins with obtainingrepresentative soil samples. Ideally, soil samples should be undisturbed. This reflects the factthat parameters of interest are dependent on the geometry of pore bodies and throats.Preservation of these features or reproducing these features represents a significant challenge.
At one extreme, soil samples can be recovered using hollow stem auger and split spoonsampling equipment [see ASTM D1586-99 or ASTM D1452-80(1995)e1]. After extraction ofproduct, samples can be dried and sieved to remove larger materials (e.g., gravel) that wouldblock flow in a standard core holder (diameters of a few centimeters). Lastly, samples can beplaced in coreholders with confining pressure similar to the in situ overburden pressure. Theassumption associated with this approach is that the procedure will result in pore bodies andthroats representative of the in situ conditions. In general, this approach should be avoidedwhen possible due to potential biases associated with disturbing the architecture of thesediments.
Alternatively, soil samples can be collected in liners. This can be accomplished using hollowstem auger drilling systems equipped with continuous sampling systems or using direct pushdrilling systems (see ASTM D6282-98) or thin-walled sampling tubes (see ASTM D1587-94).The liners serve as core preservation systems. Immediately after recovery the core should befrozen on site. This has been accomplished using liquid nitrogen or dry ice. Assuming the porespace is fully saturated with water (worst case), this will effect an approximate 5 percentexpansion of the pore space. This may fracture the plastic sleeve. Even if this occurs, it ishoped that the general geometry of the particles will be preserved. Note: further complication isadded by the fact that petroleum liquids shrink at reduced temperatures. The primaryassumption with this approach is that compaction during sample collection and freeze-thaw donot impose significant biases.
Beyond the above, options are limited. Within the crude oil production industry, a number ofspecial coring systems have been developed, including pressure retaining cores, sponge-linedcoring systems, full-closure coring systems, rubber sleeve core barrels, and side wall coringsystems [see API (1998)]. Unfortunately, these systems are generally not available for collectionof shallow unconsolidated soils. Notable exceptions are described by:
· Durnford et al., (1991) Ð A prototype sampler is described that cools soil at the bottom endof a sampler to near freezing. Cooling is achieved by allowing compressed carbon dioxideto expand to atmospheric pressure in situ at the bottom end of the sampler. The principlebenefit is retention of liquids in the soil core. Samples are frozen upon retrieval to thesurface.
· McElwee et al., (1991) Ð A prototype sampler that closes in situ is described. Nitrogen gasis used to inflate a bladder located in the drive shoe of the sampler. The primary advantagenoted is improved recovery of sands and gravels.
18
· Murdoch et al., (2000). Ð A sampling tool is described that collects horizontal sidewall soilcore up to 15 centimeters in length and 4 cm in diameter. A hydraulic pushing mechanismadvances and retracts a sidewall sample tube. Promising aspects include direct collectionof horizontal soil cores (potentially less disturbed) and collection of short samples which areless prone to drainage of interstitial liquids. A difficulty is that direct observation of thesample may not be possible prior to testing due to the sample tube.
The user should determine the commercial availability of the above three techniques.
Residual Liquids – Often it is desirable to obtain measurements of product and watersaturation from cores. In such instances it is necessary to address the issue of whether theresidual fluids present in samples after collection are representative of liquid saturations presentin situ. Using conventional split spoon or direct push techniques, significant biases can beintroduced, including:
· Driving sampling equipment through sediments may compress the samples and displacefluids.
· Fluids that accumulate in sampling devices above the sample (e.g., water in portions of thesampler above the sample) will drain through the sample as it is brought to the surface. Asthis occurs, water and product saturations within the sample may be altered significantly.
· As the sample is brought to the surface, air can invade the pore space. If this occurs,product and/or water will drain out.
The severity of the above problems will increase with the hydraulic conductivity of the sedimentsand the length of the sample collected.
Methods outlined by Durnford et al., (1991) or Murdoch et al., (2000) hold promise to overcomethe noted biases. Unfortunately, their availability and effectiveness is not well documented.Alternatively, using conventional equipment, samples should not be collected from below thewater table as this limits fluid flushing through the sample. In addition, core lengths should beless than the height of capillary rise in the soil of interest. This will limit drainage of liquids fromthe samples as they are collected. McWhorter (1996) describes an empirical approach toestimating air-water displacement pressure. Using this method and the assumption that onlywater liquid is present in the pore space, estimates of capillary rise (maximum sample height) asa function of sediment hydraulic conductivity can be obtained (See Figure 5).

19
10-4.0 10-3.0 10-2.0 10-1.0 100.01 2 3 5 6 2 3 4 5 6 2 3 4 5 6 2 3 4 5 5
Hydraulic Conductivity (cm/sec)
0
10
20
30
40
50
60
70
80
Figure 5 — Capillary rise as function of hydraulic conductivity (After McWhorter, 1996)
4.2 Core Preservation (Field)
Objectives of core preservation are to:
· Accurately document the sample location and depth· Preserve the mechanical integrity of the sample· Retain liquids present in the cores
Disturbed samples should be placed in labeled glass jars and kept cool. Plastic containersshould not be used in instances where the plastic may be degraded by the hydrocarbons in soil.Soil samples in sleeves should be:
1. Capped and taped at both ends to limit expansion within the sleeve2. Sealed using aluminum foil or a dip coating to limit losses of volatile compounds and liquids3. Labeled as to location, interval, date, and orientation (top-bottom)4. Placed in a horizontal position and frozen immediately to stabilize sediments and prevent
loss of liquids. Again, freezing of the core could result in fracturing of a plastic liner sleeve.Even if this does occur, pore geometry will be kept as close to a native state as possible.
Approaches used to freeze samples include dry ice or liquid nitrogen at the drilling site. Oncethe samples are frozen they should be shipped (in a frozen state) to the laboratory conductingthe core analyses. Ideally this should be done using an overnight courier so that samplesremain frozen during shipping. At the laboratory, samples should continue to be kept frozenuntil used in specified tests. Additional details regarding preservation of unconsolidatedsamples can be found in Recommended Practices for Core Analysis, API (1998).

20
4.3 Core Screening and Preparation (Laboratory)
Steps involved in laboratory screening and preparation of soil samples include:
1. Logging the cores2. Selecting intervals of interest3. Collecting subcores (horizontal or vertical orientation)4. Mounting subcores in holders for hydraulic testing5. Extracting residual liquid (water and product) from the core
Steps one through three are typically a joint activity conducted by the site geologist andlaboratory staff. In steps two and three, representative subcores (vertical or horizontalorientation) are identified and cut from the frozen field core in a laboratory. The diameter ofsubcores is typically a few centimeters, conforming to the size of standard core holders.Subcores should be cut and sleeved frozen for laboratory manipulation. Step four typicallyinvolves placing the core in a sleeve and applying a representative overburden pressure.Overburden pressure is useful in reproducing in situ conditions and in controlling short-circuitflow of liquids at the boundary between the sample and core holder. Care should be taken notto apply excess overburden pressure as this will collapse the pore space and alter the porousmedia properties of interest. Step five is required for determining permeability, capillarypressure as a function of saturations, and relative permeability as a function of saturation.Steps four and five are not required for samples that will be used for determining residual liquidsaturations.
Some hydraulic tests result in destruction of the sample (e.g., residual liquids determination andcapillary pressure tests using mercury). Therefore, it is often necessary to obtain multiple coresamples from intervals of interest. Comprehensive discussion of core screening andpreparation (including attention to frozen unconsolidated samples) is presented inRecommended Practices for Core Analysis, API (1998).
21
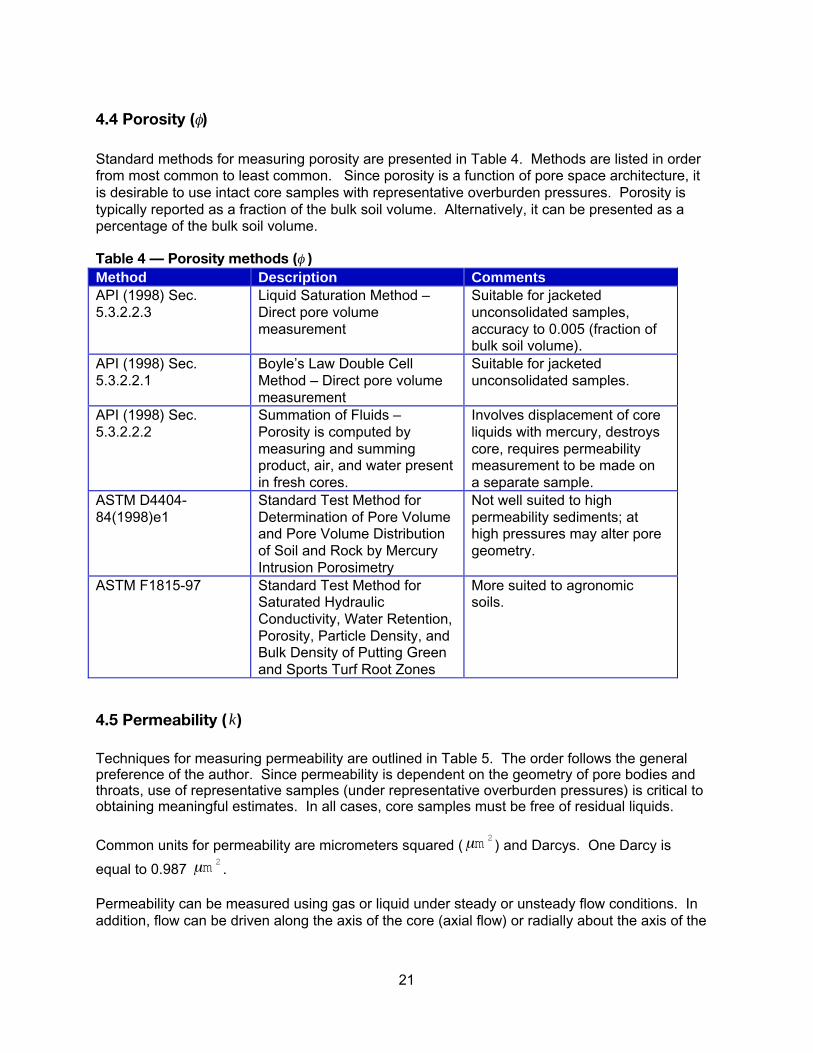
4.4 Porosity (f)
Standard methods for measuring porosity are presented in Table 4. Methods are listed in orderfrom most common to least common. Since porosity is a function of pore space architecture, itis desirable to use intact core samples with representative overburden pressures. Porosity istypically reported as a fraction of the bulk soil volume. Alternatively, it can be presented as apercentage of the bulk soil volume.
Table 4 — Porosity methods (f )Method Description CommentsAPI (1998) Sec.5.3.2.2.3
Liquid Saturation Method ÐDirect pore volumemeasurement
Suitable for jacketedunconsolidated samples,accuracy to 0.005 (fraction ofbulk soil volume).
API (1998) Sec.5.3.2.2.1
BoyleÕs Law Double CellMethod Ð Direct pore volumemeasurement
Suitable for jacketedunconsolidated samples.
API (1998) Sec.5.3.2.2.2
Summation of Fluids ÐPorosity is computed bymeasuring and summingproduct, air, and water presentin fresh cores.
Involves displacement of coreliquids with mercury, destroyscore, requires permeabilitymeasurement to be made ona separate sample.
ASTM D4404-84(1998)e1
Standard Test Method forDetermination of Pore Volumeand Pore Volume Distributionof Soil and Rock by MercuryIntrusion Porosimetry
Not well suited to highpermeability sediments; athigh pressures may alter poregeometry.
ASTM F1815-97 Standard Test Method forSaturated HydraulicConductivity, Water Retention,Porosity, Particle Density, andBulk Density of Putting Greenand Sports Turf Root Zones
More suited to agronomicsoils.
4.5 Permeability ( k)
Techniques for measuring permeability are outlined in Table 5. The order follows the generalpreference of the author. Since permeability is dependent on the geometry of pore bodies andthroats, use of representative samples (under representative overburden pressures) is critical toobtaining meaningful estimates. In all cases, core samples must be free of residual liquids.
Common units for permeability are micrometers squared (2mm ) and Darcys. One Darcy is
equal to 0.987 2mm .
Permeability can be measured using gas or liquid under steady or unsteady flow conditions. Inaddition, flow can be driven along the axis of the core (axial flow) or radially about the axis of the

22
core (radial flow). As such, there are twelve possible approaches that can be used. Each ofthese approaches has advantages and disadvantages. The techniques listed in Table 5 reflect:
· Obtaining an effective seal at the edge of unconsolidated samples is more difficult when thetest fluid is a gas. Furthermore, gas measurements are prone to significant high velocityinertial resistance in high permeability sediments. As such, preference is given to liquidmeasurement techniques (see order).
· In general, constant head techniques are simpler and more reliable. Typically, use ofunsteady measurement techniques is driven by a need to measure extremely lowpermeability. Unsteady methods are not included in Table 5.
· The noted ASTM methods are focused on geotechnical and agronomic applications and,therefore, are less applicable and listed last.
Note: Whenever possible, site water should be used for liquid permeability determinations. Useof different water may cause non-representative reactions with the matrix materials, such asswelling or shrinking of clays.
Table 5 — Permeability methods ( k)Method Description CommentsAPI (1998) Sec.6.3.2.2 or 6.3.2.1Liquid Axial FlowSteady State
Gravity flow of liquids throughhigh permeability cylindricalcores; sensor may bemanometers or electricpressure transducers
Simple, low cost, difficult toensure zero gas in core,0.0001-100 Darcy.
API (1998) Sec.6.3.1.4 Liquid RadialFlow Steady State
Radial flow of liquid in a largesample.
Larger sample size yields anaveraged value, more difficultto prepare samples,0.000002-0.25 Darcy.
API (1998) Sec.6.3.1.1. Gas AxialFlow Steady State
Axial flow of gas throughcylindrical cores; sensor maybe manometers or electricpressure transducers.
Historically a commonapproach, relatively simple,labor intensive, 0.0001-10Darcy.
API (1998) Sec.6.3.1.4 Gas RadialFlow Steady State
Radial flow of gas in a largesample.
Large sample yield anaveraged value; difficult toprepare samples, 0.00001-0.25 Darcy.
ASTM D5856-95 Standard Test Method forMeasurement of HydraulicConductivity of PorousMaterial Using a Rigid-Wall,Compaction-MoldPermeameter.
Appropriate for samples thatare compacted in thelaboratory.
ASTM D5084-90(1997)
Standard Test Method forMeasurement of HydraulicConductivity of SaturatedPorous Materials Using aFlexible Wall Permeameter.
Suitable for undisturbedsamples.
D2434-68(1994)e1 Standard Test Method forPermeability of Granular Soils(Constant Head).
Suitable for disturbedunconsolidated coarsesediment.

23
4.6 Capillary Pressure vs. Saturation ( cP vs.S )
Typically, input parameters to either the Brooks-Corey model (Equations 4-6) and vanGenuchten model (Equations 7-9) are obtained using capillary pressure vs. saturation data (SeeFigure 3). Methods for measuring capillary pressure as a function of saturation are listed ingeneral order of preference in Table 6. All methods require that the samples be sleeved orplaced in a confining apparatus.
Both the Brooks-Corey and van Genuchten models can be fit to drainage or wetting (imbibition)curves. Where the additional cost is not prohibitive, it is useful to obtain both drainage andwetting data. Since water table fluctuations cause drainage and wetting, both conditions areplausible under field conditions. Use of both data sets allows estimation of bounding conditions.Due to higher product saturation, for any given capillary pressure, wetting data will providehigher (more conservative) estimates of product mobility than drainage data. Note: the abovestatement is predicated on the assumption that water is the wetting phase.
Table 6 — Methods for capillary pressure as a function of saturation ( cP vs. S )
Method Description CommentsPorousDiaphragmWelge et al.,(1947)
Samples are placed on a diaphragmthat only transmits the wetting fluid.Wetting phase saturation is determinedas a function of pressure applied in thenon-wetting phase.
Suitable for both drainage andwetting (imbibition) curves,superior in that actual wettingand non-wetting liquids can beused, slow procedure (days tomonths).
CentrifugeMethodSlobod etal., (1951)
Samples are rotated at a range ofconstant speeds. Wetting phasesaturation is determined as a functionof applied force and resultant capillarypressure.
Suitable for both drainage andwetting (imbibition) curves,superior in that actual wettingand non-wetting liquids can beused, procedure is fast (hours),agreement with diaphragmmethod is good, applied forcemay cause adverse samplecompaction.
DynamicMethodBrown(1951)
Simultaneous steady-state flow of twoliquids is established. Capillarypressure is measured as the differencebetween the pressure in the twoliquids. Saturation is controlled by flowrates.
Suitable for both drainage andwetting (imbibition) curves,superior in that actual wettingand non-wetting liquids can beused, procedure morecomplicated than the above.
MercuryInjectionPurcell(1949)
The volume of mercury in a sample isdetermined as a function of thepressure used to displace air from thesample
Analyses can be conductedquickly, disadvantages includedifference in wetting propertiesand loss of the cores.
24
4.7 Relative Permeability vs. Saturation ( rk vs.S )
Table 7 lists methods for measuring relative permeability as a function of saturation. Twogeneral categories of methods are steady-state and unsteady state. Significant debate hasbeen given to which of these approaches is best (e.g., Honarpour et al., (1986) and Rose(1987)). While it can be argued that steady-state methods are more rigorous, it is the authorÕsopinion that the potential for better results is not significant when one considers the magnitudeof uncertainty introduced by the heterogeneity of the subsurface environment. As such, Table 7gives preference (order follows preference) to unsteady state methods due to their advantage oflower cost. It is noted that several of the reviewers of this document stated a preference forsteady-state methods due to greater accuracy. In light of the lack of clear consensus, the bestapproach should be evaluated within the context of the objectives of individual projects.
The rationale for determining permeability as a function of saturation includes:
· The data can be used to identify whether the Brooks-Corey model (as presented inEquations 4-6) or the van Genuchten model (as presented in Equations 7-9) provides thebest results.
· Insight can be gained into the wetting properties of the matrix.
· Relative permeability data can be used to directly obtain inputs to relative permeabilitymodels.

25
Table 7 — Methods for relative permeability as a function of saturation ( rk vs.S )Method Description CommentsUnsteady-State ÐJones and Rosselle(May 1978)
Water is injected into core saturatedwith both oil and water. The oilsaturation decrease and change inpressure is monitored.
Method allows for easierdata interpretation bycalculating the saturationsand pressures at the coreoutlet.
Unsteady-State-JBNMethod, Johnson etal., (1959)
Water is injected into core saturatedwith both oil and water. The oilsaturation decrease and change inpressure is monitored.
Method is quick andinexpensive, datainterpretation is notstraight forward.
Unsteady-State ÐKerig and Watson(1987)
Water is injected into core saturatedwith both oil and water. The oilsaturation decrease and change inpressure is monitored.
Uses cubic splinefunctional representationinstead of exponentialfunctionalities to developdata. Not as widely usedas the Jones and Rozellemodel.
Steady-State ÐPenn-State Method(Honarpour et al.,(1986))
Two fluids are simultaneouslypumped through a core at a rangeof flow rates, saturations aredetermined at steady-stateconditions by weight, end effects areovercome by mounting the samplebetween two similar samples.
Historically a popularapproach; a day or moremay be required toachieve steady-stateconditions for a givensaturation; costly due toslow time to steady state.
Steady-State ÐSingle SampleDynamic Method(Honarpour et al.,(1986))
Two fluids are simultaneouslypumped through a core at a rangeof flow rates, saturations aredetermined for steady-stateconditions by weight, end effects areovercome using high flow rates.
Problems may occur athigh flow rates due tononlaminar flow; costlydue to slow time to steadystate.
Steady-State ÐStationary FluidMethod (Corey et al.1956)
Permeability to the non-wettingphase (e.g., air) is measured at afixed wetting phase saturations.
Fast, typically done withair-water; requirescorrection for water-product systems.
Steady-StateHassler Method(Honarpour et al.,(1986)) OriginalPatent is US2,345,9.535 (April,1944)
Two fluids are simultaneouslypumped through a core at a rangeof flow rates, saturations aredetermined for steady-stateconditions by weight, end effects areovercome using semi-permeablemembranes that keep liquidsseparate at the inlet and outlet.
Potential for best results;generally difficult and timeconsuming to apply.

26
4.8 Water and Product Saturation ( wS and oS )
In the case of representative field samples, product saturation values can be used to verifyproduct saturations measured in laboratory studies and predictions developed using models. Inthe case of cores used in laboratory studies, saturation measurements provide directdeterminations of irreducible water ( wrS ) and irreducible product ( orS ). Table 8 presents
methods for determining product and water saturations in sediments. The order reflects theauthor’s general preference.
Table 8 methods provide product concentration on a weight basis (e.g., mass of product permass of dry weight soil). Following Feenstra et al., (1991) and Brost and DeVaull (2000) weightbasis soil concentrations, soilC (M/M), can be transformed to product saturation using
( )o
awmatrixococwwwmatrixsoilo
SHCfKCSCCS
φρφρφφρφ −−−−−
=)1(1
(11)
where:
matrixρ (M/L3) - density of the minerals comprising the solid phase of the samples
wC (M/L3) - dissolved concentration of product components in the aqueous phase
wS (dimensionless) - water saturation
ocK (L3/M) - organic carbon - water partition coefficient for product
ocf (dimensionless) - mass fraction of organic carbon in soilH (dimensionless) - Henry’s law coefficient for product
aS (dimensionless) - air saturation
φ (dimensionless) – porosity – volume of the soil void space divided by the bulk soil volume
Unfortunately, products consist of a complex mixture of hydrocarbons. As such, estimates of
ocK and H are difficult to obtain. Ignoring mass stored in the aqueous, sorbed, and air phases,
oil saturation can be estimated as
( )
−=
o
matrixsoilo CS
φρρφ1
(12)
Assuming a product containing 10% benzene and 90% insoluable hydrocarbons, Equation 12overestimates saturation by 7 and 0.7 percent, at product saturations of 1 and 10 percent,respectively. Note: use of Equation 12 requires an estimate of the density of the mineralscomprising the solid phase and the product density. Where the solid matrix is dominated byquartz, it is reasonable to use the density of quartz for the matrix density ( matrixρ = 2.65 gm/cm3).
Otherwise, the bulk density of the soil bρ can be measured directly (ASTM D4564-93) and

27
converted to matrixr by dividing by ( f-1 ). Values for product density ( )or can be obtained
from site product samples or tables of typical values for known products (e.g., Mercer andCohen [1990] and Charbeneau [1999]).
Table 8 — Water and Product Saturation Methods ( wS and oS )
Method Description CommentsDean-Stark, API(1998) Sec. 4.3
Distillation extraction method(reflux) using toluene; water isdistilled from the sample;water content is measured byvolume or weight of watercondensate; hydrocarbonfraction is extracted;hydrocarbon content isdetermined by gravimetricdifference. Hydrocarboncontent can be determined byspectroscopy for somehydrocarbon types such ascrude oil or creosote.
Yields accurate water content;relatively simple; applicable toa wide range of petroleumhydrocarbons; hydrocarbonvolume may be inaccuratedue to loss of solids or waterof hydration.
EPA 418.1(USEPA1986) or SW846-9071(USEPA 1983) TotalPetroleumHydrocarbon
Extraction of hydrocarbonsusing Freon (CFC 113).
Inexpensive; accuracy shouldbe sufficient for highconcentrations associatedwith residual hydrocarbon(>1000 mg/kg), limited to C10-C50, less desirable for lighthydrocarbons with significantfractions less than C10 (e.g.,gasoline).
SW846-8015M(USEPA 1986)Gasoline RangeOrganics
Purge and Trap GC-FIDprocedure.
Only suitable if the productÕshydrocarbons are in thegasoline range C6-C12.
SW846-8015M(USEPA, 1986) DieselRange Organics
Solvent extraction followed byGC-FID procedure.
Only suitable if the productÕshydrocarbons are in the dieselrange C10-C25.
Retort MethodHansel, W.M. Jr(1974)
Retort method that distillsproduct and water from soil.Distilled fluids are collected ina graduated receiving tube ina two stage distillation.
Lithologies with minerals richin water are difficult todifferentiate between water ofhydration and crystalizedwater. Inexpensive but can bedestructive.

28
4.9 Determination of Brooks-Corey Model Parameters (λ , dP , and wrS )
Brooks-Corey model parameters λ , dP , and wrS are obtained by plotting either effective
saturation (as defined in Equation 4) or relative permeability as a function of capillary pressureor capillary head. Capillary head is defined as
g
Ph c
cwρ
= (13)
This procedure is illustrated in Figures 6 and 7. The irreducible wetting phase saturation wrS is
obtained by iteratively testing different values of wrS until the data forms a best fit to a straight
line. According to Corey and Brooks (1999), “values of wrS that are too small cause the curve to
bend upward, and values that are too large cause the curve to bend downward”. The remainingparameters are obtained graphically as shown in Figures 6 and 7. An advantage to theapproach shown in Figure 7 is that the model is fit directly to relative permeability data, theparameter of interest. Reflecting on this, the value of λ developed in Figure 7 will provide abetter estimate of relative permeability than the λ value generated in Figure 6. Other usefulreferences regarding the Brooks-Corey model are Brooks and Corey (1964), Brooks and Corey(1966), Corey (1986), and Corey and Brooks (1999).
1.10 1.20 1.30 1.40 1.50 1.60 1.70 1.80 1.90 2.00 2.10 2.20
log (hc)
-2.2
-2.0
-1.8
-1.6
-1.4
-1.2
-1.0
-0.8
-0.6
-0.4
-0.2
-0.0
log (Se
)
Slope = -3.7 =-λλ = 3.7
Best fit to straightline achieved with
Srw = 0.167
Log Pd = 1.62Pd = 41.6 cm H2O
Log
(Se)
Figure 6 — Graphic format for analysis of Brooks-Corey parameters using effectivesaturation versus capillary head data (data from Brooks and Corey [1964], fine sand)
29
1.10 1.20 1.30 1.40 1.50 1.60 1.70 1.80 1.90 2.00 2.10 2.20
log (hc)
-2.2
-2.0
-1.8
-1.6
-1.4
-1.2
-1.0
-0.8
-0.6
-0.4
-0.2
-0.0
log (Se
)
Slope = -3.7 =-λλ = 3.7
Best fit to straightline achieved with
Srw = 0.167
Log Pd = 1.62Pd = 41.6 cm H2O
Log
(Se)
Figure 7 — Graphic format for analysis of Brooks-Corey parameters using relative permeabilitysaturation versus capillary head data (data from Brooks and Corey [1964], fine sand)
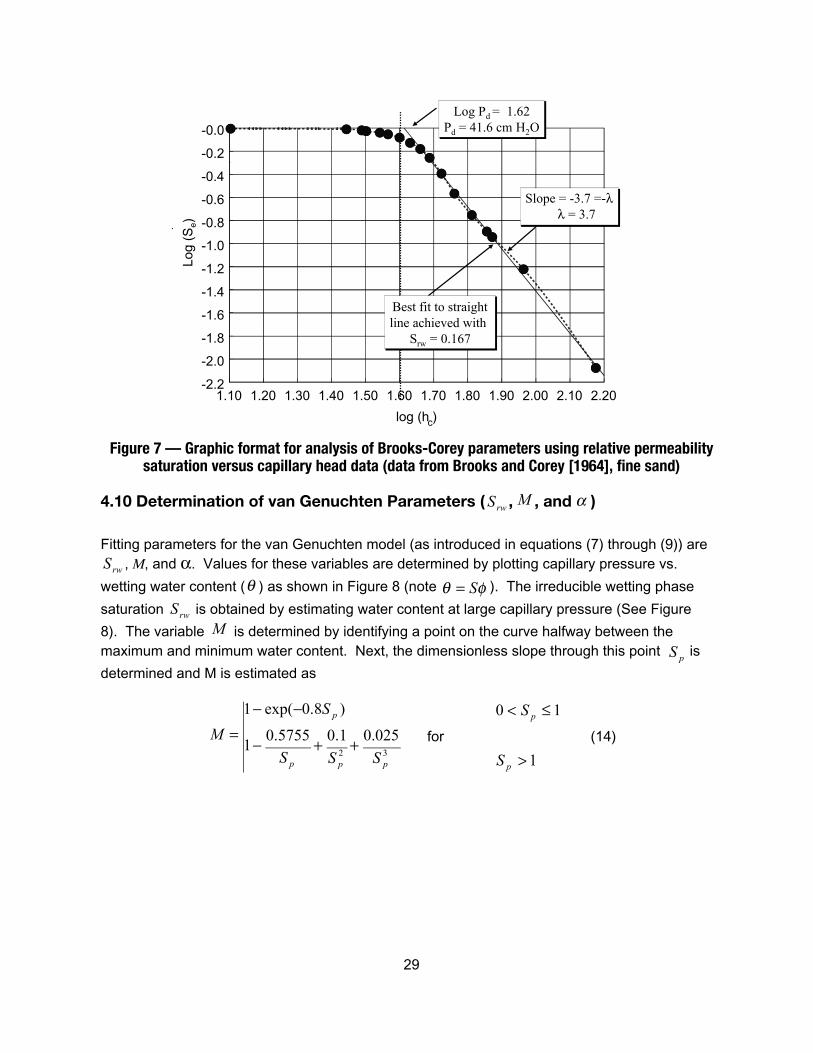
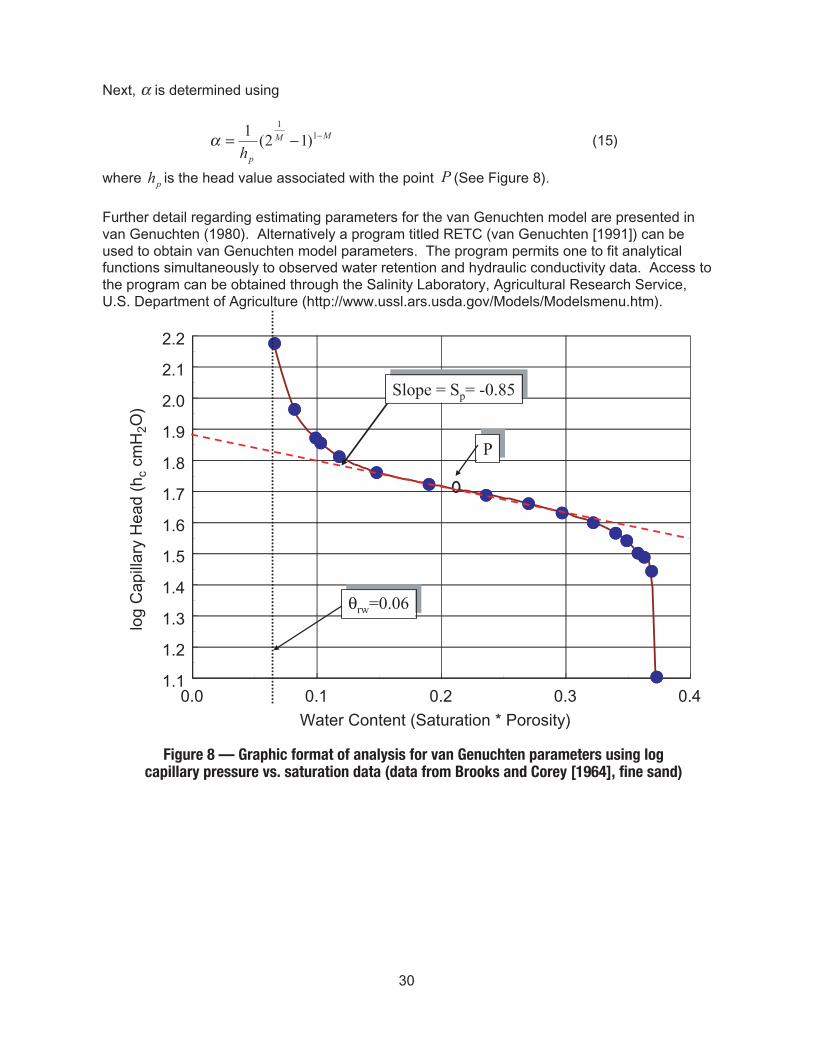
4.10 Determination of van Genuchten Parameters ( rwS , M , and α )
Fitting parameters for the van Genuchten model (as introduced in equations (7) through (9)) are
rwS , M, and α. Values for these variables are determined by plotting capillary pressure vs.
wetting water content (θ ) as shown in Figure 8 (note φθ S= ). The irreducible wetting phase
saturation rwS is obtained by estimating water content at large capillary pressure (See Figure
8). The variable M is determined by identifying a point on the curve halfway between themaximum and minimum water content. Next, the dimensionless slope through this point
pS is
determined and M is estimated as
32
025.01.05755.01
)8.0exp(1
ppp
p
SSS
S
M++−
−−= for
1
10
>
≤<
p
p
S
S
(14)
30
Next, α is determined using
MM
ph−−= 1
1
)12(1α (15)
where ph is the head value associated with the point P (See Figure 8).
Further detail regarding estimating parameters for the van Genuchten model are presented invan Genuchten (1980). Alternatively a program titled RETC (van Genuchten [1991]) can beused to obtain van Genuchten model parameters. The program permits one to fit analyticalfunctions simultaneously to observed water retention and hydraulic conductivity data. Access tothe program can be obtained through the Salinity Laboratory, Agricultural Research Service,U.S. Department of Agriculture (http://www.ussl.ars.usda.gov/Models/Modelsmenu.htm).
0.0 0.1 0.2 0.3 0.4
Water Content (Saturation * Porosity)
1.1
1.2
1.3
1.4
1.5
1.6
1.7
1.8
1.9
2.0
2.1
2.2
PP
Slope = Sp= -0.85Slope = Sp= -0.85
rw=0.06θrw=0.06
log
Cap
illar
y H
ead
(hc
cmH
2O)
Figure 8 — Graphic format of analysis for van Genuchten parameters using logcapillary pressure vs. saturation data (data from Brooks and Corey [1964], fine sand)
31
5.0 Porous Media Properties – Field-Scale
Discussions in the previous sections address determination of porous media properties at ascale of a few centimeters. Using centimeter-scale values to address field-scale problems, it isnecessary to assume that centimeter-scale properties are representative of field-scaleproperties. Reflecting on the heterogeneous nature of geologic materials, extrapolation ofcentimeter-scale properties to field-scale may not always be appropriate. To overcome thislimitation, porous media properties can be measured at a field scale. This is analogous tomeasuring hydraulic conductivity in a laboratory core test versus measuring hydraulicconductivity through an aquifer test. The core study provides a point value. The aquifer testprovides a volume-averaged result for the portion of the aquifer stressed by the test. Whilefield-scale determinations are appealing, their development for analysis of product mobility hasbeen limited. The following describes use of baildown tests and hydrocarbon production data toaddress product mobility.
5.1 Baildown Tests
Baildown tests involve instantaneously removing product from a conventional monitoring wellthat is screened across the water table. Responses of the air-product and product-waterinterfaces are measured through time. The procedure is roughly analogous to a slug test.
Baildown tests have been used to obtain qualitative evidence of the potential for free-productrecovery (e.g., Testa and Winegardner [1991]) and estimates of specific product volume (e.g.,Lundy and Zimmerman [1996] and Lundy et al., [1998]). It has also been proposed thatbaildown tests can be used to determine formation transmissivity to product (e.g., Lundy andZimmerman [1996] and Huntley [2000]). Techniques for estimating product transmissivity usingbaildown tests are outlined in Table 9.

32
Table 9 — Baildown test methods for estimation of product transmissivity(field-scale oT )Method Description CommentsHuntley (2000) –Modified Bouwer RiceSlug Test
Air-product and product-waterinterfaces are measuredthrough time after rapiddepletion of product. Data isanalyzed using a modifiedBouwer-Rice Slug Testprocedure.
Appropriate for conditionswhere the correctedpotentiometric surfaceremains near constant throughthe test; computationallysimple.
Huntley (2000) –Based on Cooper-Jacob equation
Air-product and product-waterinterfaces are measuredthrough time after rapiddepletion of product. Threecomputational approaches areoutlined; greater accuracy isachieved with more complexcomputational procedures.
Appropriate for conditionswhere the correctedpotentiometric surface doesnot remain constant throughthe test; computationally moredemanding.
Lundy andZimmerman (1996) –Modified Bouwer andRice Slug Test
Changes in LNAPL thickness,in a well from which a slug ofLNAPL has been withdrawn,are analyzed with standardslug test methods to obtainvertically averaged LNAPLconductivity
Best for condition where thewater table is not significantlydepressed by removal of theLNAPL slug, computationalmethods are relatively simple.
5.2 Production Tests
Theim Solution
Where free-product recovery systems are employed, it is common to track production as afunction of time. Typically this is accomplished using product flow meters or by tracking volumein product storage tanks. Following the derivation presented in Appendix B, production rates( oQ ) can be used to estimate vertically averaged relative permeability to product
rok (dimensionless), vertically averaged product conductivity to product oK (L/T), and
transmissivity to oil oT (L2/T)
( )12
1
2
2
ln
hhgkb
r
rQ
koo
oo
ro −
=ρπ
µ(16)
)(2
ln
12
1
2
hhb
r
rQ
gkkK
o
o
o
oroo −
==πµ
ρ(17)
33
( )12
1
2
2
ln
hh
r
rQ
bKTo
ooo −
==π
(18)
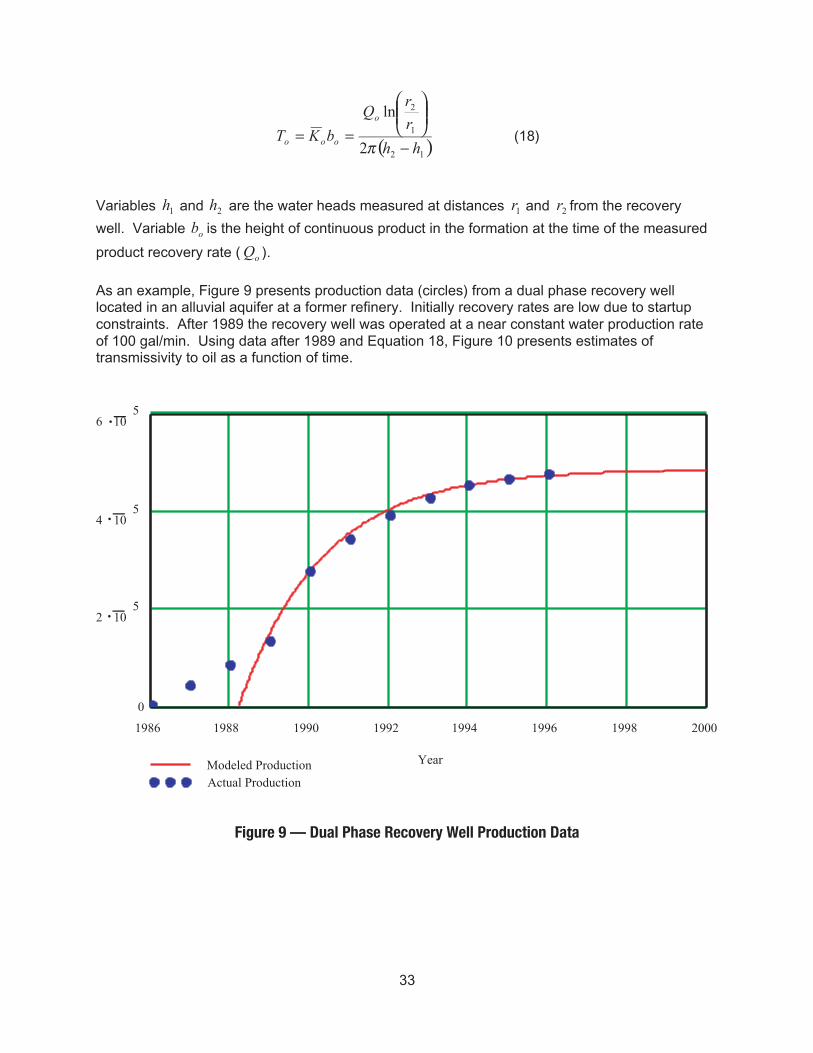
Variables 1h and 2h are the water heads measured at distances 1r and 2r from the recovery
well. Variable ob is the height of continuous product in the formation at the time of the measured
product recovery rate ( oQ ).
As an example, Figure 9 presents production data (circles) from a dual phase recovery welllocated in an alluvial aquifer at a former refinery. Initially recovery rates are low due to startupconstraints. After 1989 the recovery well was operated at a near constant water production rateof 100 gal/min. Using data after 1989 and Equation 18, Figure 10 presents estimates oftransmissivity to oil as a function of time.
1986 1988 1990 1992 1994 1996 1998 2000
0
2 105
4 105
6 .−105
Modeled ProductionActual Production
Year
.−
.−
Figure 9 — Dual Phase Recovery Well Production Data

34
1990 1991 1992 1993 1994 1995 1996 1997
Time (Year)
T0
(m2 /d
ay)
0.0
0.1
0.2
0.3
0.4
Figure 10 — Transmissivity to products as a function of timedeveloped using well production data from Figure 9 and Equation (18)
Decline Curve Analysis
Building on petroleum industry methods, production data can be used to estimate futureproduction [e.g., Frick and Taylor (1962)]. A decline curve analysis technique (building on theassumption of first order decay) is presented in Equations (19) through (21)
tmo eVtQ αα −=)( (19)
)1()( tmp eVtV α−−= (20)
α693.0
2/1 =t (21)

35
where:
)(tQo (L3/T) Production Rate volumetric recovery rate at time t.
α (1/T) Alpha a fitting parameter.
mV (L3) MaximumPotential Volume
maximum or ultimate volume of product that canbe recovered.
)(tVp (L3) Volume Produced cumulative volume recovered at time t .
2/1t (T) Half Life time required to deplete half of the remainingmobile product.
A derivation for Equations (19) through (21) is presented in Appendix C.
Figure 11 illustrates a graphic approach for estimating α and mV . As shown, production rate is
plotted as a function of cumulative production. Typically, late data will fit a straight line. Theprimary condition here is that the system is operated in a near consistent mode (near constantrate of total fluid production). The slope of the straight line is α . The x intercept of the line is
mV . The modeled results presented in Figure 9 (see solid line) illustrate that the technique
provides a reasonable match to cumulative production data. Sale and Applegate (1997)describe use of decline curve analysis to estimate the maximum recoverable volume andoperation of free product recovery systems to an endpoint of 95% of the maximum recoverablevolume.
0 100000 200000 300000 400000 500000
Cumulative Production (Gallons)
0
100
200
300
400
500
600
α= - slope of the line
Y intercept= maximum recoverable
Rec
over
y R
ate
(Gal
lons
/Day
)
Figure 11 — Graphical format for decline curve analysis

36
6.0 Reporting
The requirements of individual projects vary. As such, it is inappropriate to proscribe a fixedformat for reports. Nevertheless, in the interest of generating catalogues of results, it would beuseful if reports included as many of the following elements as possible:
1. An introduction to the hydrologic setting and nature of the hydrocarbon released.2. Documentation of procedures used in collecting liquids.3. A description of methods used to drill and collect sediment samples.4. Presentation of site core preservation, laboratory screening, and laboratory core preparation
techniques.5. For liquids measurements, a description of methods, the temperature at which
measurements were made, and the in situ temperature of liquids.6. A lithologic description of the core materials following ASTM D5434-97.7. For porous media laboratory measurements, a description of methods and notation as to the
temperature at which the measurements were made.8. Tabulation of Brooks-Corey and/or van Genuchten model parameters.9. For field measurements, a description of methods, data analyses procedures, and tabulation
of results.10. Comments as to the efficacy of the methods employed.11. Conclusions reached through the analyses.

37
7.0 References
American Petroleum Institute (1998), Recommended Practices for Core Analysis,Recommended Practices 40, Second Edition, February.
Brooks, R. H. and A.T. Corey (1966), "Properties of Porous Media Affecting Fluid Flow," Journalof the Irrigation and Drainage Division of the American Society of Civil Engineers, 4855 IR 2,June, pp. 61-88.
Brooks, R. H. and A.T. Corey (1964), Hydraulic Properties of Porous Media, Hydrology PaperNumber 3, Civil Engineering Department, Colorado State University, Fort Collins, Colorado.
Brost, J.B. and G.E. DeVaull, (2000), Non-Aqueous Phase Liquid (NAPL) Mobility Limits in SoilÐ Soils and Groundwater Research Bulletin, American Petroleum Institute, No.9. June.
Bass, D.M. (1987), Chapter 26 - Properties of Reservoir Rocks, In Petroleum EngineeringHandbook, Edited by Bradley, B.B., Society of Petroleum Engineers, Richardson, Texas, ThirdPrinting, page 26-1 through page 26-33
Brown, H.W. (1951), ÒCapillary Pressure InvestigationsÓ, Trans AIME, Vol. 192, pp. 39-48.
Charbeneau, R.J., R. T. Johns, L.W. Lake, and M.J. McAdams (1999), Free Product Recoveryof Petroleum Hydrocarbon Liquids, American Petroleum Institute, API Publication Number 4682,June.
Corey, A.T. and R.H. Brooks, (1999), The Brooks-Corey Relationship, In Characterization andMeasurement of the Hydraulic Properties of Unsaturated Porous Media, M.Th. van Genuchten,F.J. Leji, and L. Wu, Editors, University of California, Riverside, California, pp. 13-18.
Corey, A.T. (1986), Mechanics of Immicible Fluids in Porous Media, Water ResourcesPublications, Littleton, Colorado.
Corey, A.T., C.H. Rathjens, J.H. Hemderson, and M.R.J. Wyllie (1956), "Three-Phase RelativePermeability," Journal of Petroleum Technology, Petroleum Transactions, AIME, November, pp.349-351.
Durnford, D., J. Brookman, J. Billica, and J. Milligan (1991), "LNAPL Distribution in aCohesionless Soil: A Field Investigation and Cryogenic Sampler," Groundwater Monitoring andRemediation, Vol. 11, No. 3, summer, pp. 115-122.
Farr, A.M., R.J. Houghtilan, and D.B. McWhorter (1990), "Volume Estimation of LightNonaqueous Phase Liquids in Porous Media," Groundwater, Vol. 28, No.1, January-February,pp. 48-56.
Feenstra, S., D.M. MacKay, and J.A. Cherry (1991), "A Method for Assessing Residual NAPLbased on Organic Chemical Concentrations in Soil Samples," Ground Water Monitoring andReview, Vol 11, No. 2, pp. 128-136.
Frick,T.C. and R.W. Taylor (1962), Petroleum Production Handbook, Society of PetroleumEngineers of the AIME, Millet the Printer, Dallas, Texas.
38
Hansel, W.M. Jr.,(1974), ÒCore Analysis for Optimization Exploration,Ó SPE 4928, presented atthe Rocky Mountain Regional Meeting, Billings, MT, May 15-16.
Honarpour,M., L. Koederitz, and A.H. Harvey (1986), Relative Permeability of PetroleumReservoirs, CRC Press, Boca Raton, Florida.
Huntley, D. (2000), "Analytical Determination of Hydrocarbon Transmissivity from BaildownTests, Ground Water, Vol. 38, No. 1, January-February, pp. 46-52.
Johnson, E.F., Bossler, D.P., and Nauman, V.O. (1959), ÒCalculation of Relative Permeabilityfrom Displacement ExperimentsÓ, Trans AIME, Vol. 216, pp. 370-72.
Jones, S.C. and Rozelle, W.O. (1978), "Graphical Techniques for Determining RelativePermeability from Displacement ExperimentsÓ, J. Pet. Tech., pp. 807-817.
Kerig, P.D. and Watson, A.T. (1987), "A New Algorithm for Estimating Relative Permeabilityfrom Displacement Experiments," SPE Res. Eng., (Feb), pp. 103-112.
Lenhard, R.J. and J.C. Parker (1990), "Estimation of Free Hydrocarbon Volume from FluidLevels in Monitoring Wells, Ground Water," Vol. 28, No. 1, January-February, pp. 57-67.
Lundy, D.A., and L.M. Zimmerman, (1996). Assessing the Recoverability of LNAPL Plumes forRecovery System Conceptual Design. Proceedings of the 10th NGWA National Outdoor ActionConference/Exposition, May.
Lundy, D.A., P.M. Potter, T.K White, B. Ferrell (1998), Defining Practical Limits of Free LNAPLRecovery by Skimming and High ÐVacuum Extraction Techniques Ð A Case Study from thePiedmont of Georgia, Proceedings of the NGWA Conference on Petroleum Hydrocarbons andChemicals in Groundwater.
McElwee, C.C., J.J. Bultler Jr., and J.M. Healy (1991), "A New Sampling System for ObtainingRelatively Undisturbed Samples of Unconsolidated Coarse Sand and Gravel," Ground WaterMonitoring and Remediation, Volume 11. Number 3. Summer. pp. 182-191.
McWhorter, D.B. (1996), Processes Affecting Soil and Groundwater Contamination by DNAPLin Low Permeability Media, Presented in In situ Remediation of DNAPL Compounds in LowPermeability Media Fate/Transport, In situ Control Technologies, and Risk Reduction, OakRidge National Laboratory, ORNL/TM-13305.
Mercer, J.W. and R.M. Cohen (1990), "A Review of Immicible Fluids in the Subsurface:Properties, Models, Characterization and Remediation," Journal of Contaminant Hydrology, Vol.6 pp. 107-163.
Murdoch, L.C., W.W. Slack, W. Harrar, and R.L. Seigrist (2000), "Embedded Sidewall Samplersand Sensors to Monitor the Subsurface," Journal of Ground Water, Vol. 38, No. 5, September-October, pp. 657-664.
Mualem, Y.(1976), "A New Model for Predicting the Hydraulic Conductivity of UnsaturatedPorous Media," Water Resources Research, Vol. 12, pp. 513-522.

39
Parker, J.C., J.L. Zhu, T. G. Johnson, and E.L. Hockman (1994), "Modeling Of Free ProductMigration and Recovery at Hydrocarbon Spill Sites," Groundwater, Vol. 32, No. 1, January-February, pp. 119-128.
Parker, J.C., R.J. Lenhard, and T. Kuppusamy (1987), "A Parametric Model of ConstitutiveProperties Governing Multiphase Flow in Porous Media," Water Resource Research, Vol. 23,No. 4 pp. 618-624.
Purcell, W.R.(1949), "Capillary Pressure Ð Their Measurement Using Mercury and theCalculation of Permeability Therefrom," Trans AIME, Vol. 186, pp. 39-48.
Rose, W. (1987), Chapter 28 Ð Relative Permeability, In Petroleum Engineering Handbook,Edited by Bradley, B.B., Society of Petroleum Engineers, Richardson, TX, USA, Third Printing.pp. 27-1 through 27-16.
Sale, T. and D. Applegate, (1997). "Mobile NAPL Recovery: Conceptual, Field, andMathematical Considerations." Ground Water, Vol. 35, No. 3 May-June, pp. 418-426.
Slobod, R.L., Chambers, A., and Prehn, W.L. Jr., (1951), "Use of Centrifuge for DeterminingConnate Water, Residual Oil Saturation, and Capillary Pressure of Small Core Samples," TransAIME, Vol. 192, pp. 127-134.
Testa, S.M. and D.L. Winegargner (1991), Restoration of Petroleum Contaminated Aquifers,Chelsa, MI, Lewis Publishers, Inc.
Theim, A. (1906), Hydrologishe Methoden, Leipzig, Gephardt, pp.56.
USEPA, (1986), Test Methods for Evaluating Solid Waste, SW846, 3rd Edition, As AmendedNovember 1986.
USEPA, (1983), Methods for Chemical Analyses of Water and Wastes, EPA 600/4-79/020, AsAmended March 1983.
van Genuchten, M. Th. (1980), "A Closed-form Equation for Predicting the HydraulicConductivity of Unsaturated Soils." Soil Science Society of America, No. 44, pp. 892-898.
van Genuchten, M. Th., F. J. Leij, and S. R. Yates. (1991), The RETC Code for Quantifying theHydraulic Functions of Unsaturated Soils, Version 1.0. EPA Report 600/2-91/065, U.S. SalinityLaboratory, USDA, ARS, Riverside, CA.
Welge, H.J. and Bruce, W.A., (1947), The Restored State Method of Determination of Oil inPlace and Connate Water, Drill and Production Proceedings, API, Dallas, TX, pp.166-74.
40
Appendix A - Short Abstracts of Relevant ASTM Methods
LIQUID DENSITY............................................................................................................................................................ 42
D3505-96 STANDARD TEST METHOD FOR DENSITY OR RELATIVE DENSITY OF PURE LIQUID CHEMICALS..... 42
D1298-99 STANDARD PRACTICE FOR DENSITY, RELATIVE DENSITY (SPECIFIC GRAVITY), OR API GRAVITY
OF CRUDE PETROLEUM AND LIQUID PETROLEUM PRODUCTS BY HYDROMETER METHOD....... 42
D1481-93(1997) STANDARD TEST METHOD FOR DENSITY AND RELATIVE DENSITY (SPECIFIC GRAVITY) OF
VISCOUS MATERIALS BY LIPKIN BICAPILLARY PYCNOMETER .................................................. 43
D1217-93(1998) STANDARD TEST METHOD FOR DENSITY AND RELATIVE DENSITY (SPECIFIC GRAVITY) OF
LIQUIDS BY BINGHAM PYCNOMETER ...................................................................................... 44
D1480-93(1997) STANDARD TEST METHOD FOR DENSITY AND RELATIVE DENSITY (SPECIFIC GRAVITY) OF
VISCOUS MATERIALS BY BINGHAM PYCNOMETER .................................................................. 44
D4052-96 STANDARD TEST METHOD FOR DENSITY AND RELATIVE DENSITY OF LIQUIDS BY DIGITAL DENSITY
METER .................................................................................................................................. 45
D5002-99 STANDARD TEST METHOD FOR DENSITY AND RELATIVE DENSITY OF CRUDE OILS BY DIGITAL
DENSITY ANALYZER............................................................................................................... 45
VISCOSITY ....................................................................................................................................................................... 46
D445-97 STANDARD TEST METHOD FOR KINEMATIC VISCOSITY OF TRANSPARENT AND OPAQUE LIQUIDS
(THE CALCULATION OF DYNAMIC VISCOSITY)......................................................................... 46
D4486-91(1996)E1 STANDARD TEST METHOD FOR KINEMATIC VISCOSITY OF VOLATILE AND REACTIVE
LIQUIDS................................................................................................................................. 46
SURFACE AND INTERFACIAL TENSION................................................................................................................ 47
D971-99A STANDARD TEST METHOD FOR INTERFACIAL TENSION OF OIL AGAINST WATER BY THE RING
METHOD................................................................................................................................ 47
D3825-90(1995) STANDARD TEST METHOD FOR DYNAMIC SURFACE TENSION BY THE FAST-BUBBLE
TECHNIQUE ........................................................................................................................... 47
D1331-89(1995) STANDARD TEST METHODS FOR SURFACE AND INTERFACIAL TENSION OF SOLUTIONS
OF SURFACE-ACTIVE AGENTS ............................................................................................... 48
D2285-99 STANDARD TEST METHOD FOR INTERFACIAL TENSION OF ELECTRICAL INSULATING OILS OF
PETROLEUM ORIGIN AGAINST WATER BY THE DROP-WEIGHT METHOD ................................. 48
POROSITY AND PORE VOLUME DISTRIBUTION................................................................................................ 49
D4404-84(1998)E1 STANDARD TEST METHOD FOR DETERMINATION OF PORE VOLUME AND PORE VOLUME
DISTRIBUTION OF SOIL AND ROCK BY MERCURY INTRUSION POROSIMETRY........................... 49
F1815-97 STANDARD TEST METHOD FOR SATURATED HYDRAULIC CONDUCITIVITY, WATER RETENTION,POROSITY, PARTICLE DENSITY, AND BULK DENSITY OF PUTTING GREEN AND SPORTS TURF
ROOT ZONES ........................................................................................................................ 50
PERMEABILITY............................................................................................................................................................... 50
D2434-68(1994)E1 STANDARD TEST METHOD FOR PERMEABILITY OF GRANULAR SOILS (CONSTANT HEAD)50
D5856-95 STANDARD TEST METHOD FOR MEASUREMENT OF HYDRAULIC CONDUCTIVITY OF POROUS
MATERIAL USING A RIGID-WALL, COMPACTION-MOLD PERMEAMETER .................................. 51

41
D5084-90(1997) STANDARD TEST METHOD FOR MEASUREMENT OF HYDRAULIC CONDUCTIVITY OF
SATURATED POROUS MATERIALS USING A FLEXIBLE WALL PERMEAMETER........................... 51
CAPILLARY PRESSURE .............................................................................................................................................. 52
D3152-72(1994)E1 STANDARD TEST METHOD FOR CAPILLARY-MOISTURE RELATIONSHIPS FOR FINE-TEXTURED SOILS BY PRESSURE-MEMBRANE APPARATUS ..................................................... 52
D2325-68(1994)E1 STANDARD TEST METHOD FOR CAPILLARY-MOISTURE RELATIONSHIPS FOR
COARSE- AND MEDIUM-TEXTURED SOILS BY POROUS-PLATE APPARATUS............................ 52
D425-88(1994) STANDARD TEST METHOD FOR CENTRIFUGE MOISTURE EQUIVALENT OF SOILS ................. 53
SAMPLING ....................................................................................................................................................................... 53
D4696-92E1 STANDARD GUIDE FOR PORE-LIQUID SAMPLING FROM THE VADOSE ZONE.............................. 53
BULK DENSITY OF SOIL ............................................................................................................................................. 54
D4564-93 STANDARD TEST METHOD FOR DENSITY OF SOIL IN PLACE BY THE SLEEVE METHOD .................. 54
D2937-94 STANDARD TEST METHOD FOR DENSITY OF SOIL IN PLACE BY THE DRIVE-CYLINDER METHOD.... 55
SOIL SAMPLING............................................................................................................................................................. 56
D6282-98 STANDARD GUIDE FOR DIRECT PUSH SOIL SAMPLING FOR ENVIRONMENTAL SITE
CHARACTERIZATIONS ............................................................................................................ 56
D6169-98 STANDARD GUIDE FOR SELECTION OF SOIL AND ROCK SAMPLING DEVICES USED WITHDRILL RIGS FOR ENVIRONMENTAL INVESTIGATIONS ............................................................... 57
D1452-80(1995)E1 STANDARD PRACTICE FOR SOIL INVESTIGATION AND SAMPLING BY AUGER BORINGS ... 58
D1587-94 STANDARD PRACTICE FOR THIN-WALLED TUBE GEOTECHNICAL SAMPLING OF SOILS.................. 58
D1586-99 STANDARD TEST METHOD FOR PENETRATION TEST AND SPLIT-BARREL SAMPLING OF SOILS...... 58
NAPL SATURATION ...................................................................................................................................................... 59
D5369-93(1998) STANDARD PRACTICE FOR EXTRACTION OF SOLID WASTE SAMPLES FOR CHEMICAL
ANALYSIS USING SOXHLET EXTRACTION ............................................................................... 59
D5368-93 STANDARD TEST METHODS FOR GRAVIMETRIC DETERMINATION OF TOTAL SOLVENT
EXTRACTABLE CONTENT (TSEC) OF SOLID WASTE SAMPLES............................................... 60

42
Liquid Density
D3505-96 Standard Test Method for Density or Relative Density of Pure Liquid Chemicals
1. Scope
1.1 This test method describes a simplified procedure for the measurement of density or relativedensity of pure liquid chemicals for which accurate temperature expansion functions are known.It is restricted to liquids having vapor pressures not exceeding 600 mm Hg (0.8 atm) at theequilibration temperature, and having viscosities not exceeding 15 cSt at 20°C (60°F).
1.2 Means are provided for reporting results in the following units: Density g/cm at 20°C Densityg/ml at 20°C Relative density 20°C/4°C Relative density 60°F/60°F (15.56°C/15.56°C)Commercial density, lb (in air)/U.S. gal at 60°F Commercial density, lb (in air)/U.K. gal at 60°F.
Note 1-This test method is based on the old definition of 1 L = 1.000028 dm (1 mL = 1.000028cm ). In 1964 the General Conference on Weights and Measures withdrew this definition of thelitre and declared that the word "litre" was a special name for the cubic decimetre, thus making1 mL = 1 cm exactly. Note 2-An alternative method for determining relative density of pure liquidchemicals is Test Method D4052.
1.3 The following applies to all specified limits in this test method: for purposes of determiningconformance with this test method, an observed value or a calculated value shall be rounded off"to the nearest unit" in the last right-hand digit used in expressing the specification limit, inaccordance with the rounding-off method of Practice E29.
1.4 This standard does not purport to address all of the safety concerns, if any, associated withits use. It is the responsibility of the user of this standard to establish appropriate safety andhealth practices and determine the applicability of regulatory limitations prior to use. Specifichazard statements are given in 7.1.
1.5 Reprinted with permission, from the annual Book of ASTM Standards, copyright AmericanSociety for Testing and Materials, 100 Barr Harbor Drive, West Conshohocken, PA 19248. Acopy of the complete standard may be purchased from ASTM, phone: 610-832-9585, fax:610-832-9555, e-mail: [email protected], website: www.astm.org.
D1298-99 Standard Practice for Density, Relative Density (Specific Gravity), or APIGravity of Crude Petroleum and Liquid Petroleum Products by Hydrometer Method
1. Scope
1.1 This practice covers the laboratory determination, using a glass hydrometer, of the density,relative density (specific gravity), or API gravity of crude petroleum, petroleum products, ormixtures of petroleum and nonpetroleum products normally handled as liquids, and having aReid vapor pressure (Test Method D323, or IP 69) of (179 kPa) 26 lb or less. Values aremeasured on a hydrometer at convenient temperatures, readings of density being reduced to15°C, and readings of relative density (specific gravity) and API gravity to 60°F, by means ofinternational standard tables. By means of these same tables, values determined in any one ofthe three systems of measurement are convertible to equivalent values in either of the other twoso that measurements may be made in the units of local convenience.

43
1.2 This standard may involve hazardous materials, operations, and equipment. This standarddoes not purport to address all of the safety problems associated with its use. It is theresponsibility of whoever uses this standard to consult and establish appropriate safety andhealth practices and determine the applicability of regulatory limitations prior to use. Forspecific hazard statements, see 9.1.
1.3 Reprinted with permission, from the annual Book of ASTM Standards, copyright AmericanSociety for Testing and Materials, 100 Barr Harbor Drive, West Conshohocken, PA 19248. Acopy of the complete standard may be purchased from ASTM, phone: 610-832-9585, fax: 610-832-9555, e-mail: [email protected], website: www.astm.org.
D1481-93(1997) Standard Test Method for Density and Relative Density (Specific Gravity)of Viscous Materials by Lipkin Bicapillary Pycnometer
1. Scope
1.1 This test method covers the determination of the density of oils more viscous than 15 cSt at20°C (mm/s), and of viscous oils and melted waxes at elevated temperatures, but not attemperatures at which the sample would have a vapor pressure of 100 mm Hg (13 kPa) orabove.
Note 1-To determine the densities of less viscous liquids at 20 or 25°C use Test Method D941,or Test Method D1217.
1.2 This test method provides a calculation procedure for converting density to relative density(specific gravity).
1.3 The values stated in acceptable SI units are to be regarded as the standard.
1.4 This standard does not purport to address all of the safety problems, if any, associated withits use. It is the responsibility of the user of this standard to establish appropriate safety andhealth practices and determine the applicability of regulatory limitations prior to use.
1.5 Reprinted with permission, from the annual Book of ASTM Standards, copyright AmericanSociety for Testing and Materials, 100 Barr Harbor Drive, West Conshohocken, PA 19248. Acopy of the complete standard may be purchased from ASTM, phone: 610-832-9585, fax: 610-832-9555, e-mail: [email protected], website: www.astm.org.

44
D1217-93(1998) Standard Test Method for Density and Relative Density (Specific Gravity)of Liquids by Bingham Pycnometer
1. Scope
1.1 This test method covers the measurement of the density of pure hydrocarbons or petroleumdistillates boiling between 90 and 110°C that can be handled in a normal fashion as a liquid atthe specified test temperatures of 20 and 25°C.
1.2 This test method provides a calculation procedure for conversion of density to relativedensity (specific gravity).
1.3 The values stated in SI units are to be regarded as the standard.
1.4 This standard does not purport to address all of the safety problems, if any, associated withits use. It is the responsibility of the user of this standard to establish appropriate safety andhealth practices and determine the applicability of regulatory limitations prior to use. Specificprecautionary statements are given in Notes 1, 2, and 3.
1.5 Reprinted with permission, from the annual Book of ASTM Standards, copyright AmericanSociety for Testing and Materials, 100 Barr Harbor Drive, West Conshohocken, PA 19248. Acopy of the complete standard may be purchased from ASTM, phone: 610-832-9585, fax: 610-832-9555, e-mail: [email protected], website: www.astm.org.
D1480-93(1997) Standard Test Method for Density and Relative Density (Specific Gravity)of Viscous Materials by Bingham Pycnometer
1. Scope
1.1 This test method describes two procedures for the measurement of the density of materialswhich are fluid at the desired test temperature. Its application is restricted to liquids of vaporpressures below 600 mm Hg (80 kPa) and viscosities below 40,000 cSt (mm /s) at the testtemperature. The method is designed for use at any temperature between 20 and 100°C. It canbe used at higher temperatures; however, in this case the precision section does not apply.
Note 1-For the determination of density of materials which are fluid at normal temperatures, seeTest Method D941 or where greater precision is desired see Test Method D1217.
1.2 This test method provides a calculation procedure for converting density to specific gravity.
1.3 The values stated in acceptable SI units are to be regarded as the standard.
1.4 This standard does not purport to address all of the safety concerns, if any, associated withits use. It is the responsibility of the user of this standard to establish appropriate safety andhealth practices and determine the applicability of regulatory limitations prior to use. For specificprecautionary statements see Notes 1, 2, and 3.
1.5 Reprinted with permission, from the annual Book of ASTM Standards, copyright AmericanSociety for Testing and Materials, 100 Barr Harbor Drive, West Conshohocken, PA 19248. A

45
copy of the complete standard may be purchased from ASTM, phone: 610-832-9585, fax: 610-832-9555, e-mail: [email protected], website: www.astm.org.
D4052-96 Standard Test Method for Density and Relative Density of Liquids by DigitalDensity Meter
1. Scope
1.1 This test method covers the determination of the density or relative density of petroleumdistillates and viscous oils that can be handled in a normal fashion as liquids at testtemperatures between 15 and 35°C. Its application is restricted to liquids with vapor pressuresbelow 600 mm Hg (80 kPa) and viscosities below about 15 000 cSt (mm /s) at the temperatureof test.
1.2 This test method should not be applied to samples so dark in color that the absence of airbubbles in the sample cell cannot be established with certainty. For the determination of densityin crude oil samples use Test Method D5002.
1.3 The accepted units of measure for density are grams per millilitre or kilograms per cubicmetre.
1.4 This standard does not purport to address all of the safety concerns, if any, associated withits use. It is the responsibility of the user of this standard to establish appropriate safety andhealth practices and determine the applicability of regulatory limitations prior to use. For specifichazard statements, see Notes 1 and 2.
1.5 Reprinted with permission, from the annual Book of ASTM Standards, copyright AmericanSociety for Testing and Materials, 100 Barr Harbor Drive, West Conshohocken, PA 19248. Acopy of the complete standard may be purchased from ASTM, phone: 610-832-9585, fax: 610-832-9555, e-mail: [email protected], website: www.astm.org.
D5002-99 Standard Test Method for Density and Relative Density of Crude Oils by DigitalDensity Analyzer
1. Scope
1.1 This test method covers the determination of the density or relative density of crude oils thatcan be handled in a normal fashion as liquids at test temperatures between 15 and 35°C. Thistest method applies to crude oils with high vapor pressures provided appropriate precautionsare taken to prevent vapor loss during transfer of the sample to the density analyzer.
1.2 This test method was evaluated in round robin testing using crude oils in the 0.75 to 0.95g/mL range. Lighter crude oil can require special handling to prevent vapor losses. Heaviercrudes can require measurements at higher temperatures to eliminate air bubbles in thesample.
1.3 The accepted units of measurement of density are grams per millilitre and kilograms percubic metre.
1.4 This standard does not purport to address all of the safety concerns, if any, associated withits use. It is the responsibility of the user of this standard to establish appropriate safety and

46
health practices and determine the applicability of regulatory limitations prior to use. Specifichazard statements are given in Notes 1, 2, and 3.
1.5 Reprinted with permission, from the annual Book of ASTM Standards, copyright AmericanSociety for Testing and Materials, 100 Barr Harbor Drive, West Conshohocken, PA 19248. Acopy of the complete standard may be purchased from ASTM, phone: 610-832-9585, fax: 610-832-9555, e-mail: [email protected], website: www.astm.org.
Viscosity
D445-97 Standard Test Method for Kinematic Viscosity of Transparent and OpaqueLiquids (the Calculation of Dynamic Viscosity)
1. Scope
1.1 This test method specifies a procedure for the determination of the kinematic viscosity, [nu],of liquid petroleum products, both transparent and opaque, by measuring the time for a volumeof liquid to flow under gravity through a calibrated glass capillary viscometer. The dynamicviscosity, [eta], can be obtained by multiplying the measured kinematic viscosity by the density,[rho], of the liquid.
Note 1-For the measurement of the kinematic viscosity and viscosity of bitumens, see also TestMethods D2170 and D2171.
1.2 The result obtained from this test method is dependent upon the behavior of the sample andis intended for application to liquids for which primarily the shear stress and shear rates areproportional (Newtonian flow behavior). If, however, the viscosity varies significantly with therate of shear, different results may be obtained from viscometers of different capillary diameters.The procedure and precision values for residual fuel oils, which under some conditions exhibitnon-Newtonian behavior, have been included.
1.3 The values stated in SI units are to be regarded as the standard.
1.4 This standard does not purport to address all of the safety concerns, if any, associated withits use. It is the responsibility of the user of this standard to establish appropriate safety andhealth practices and determine the applicability of regulatory limitations prior to use.
1.5 Reprinted with permission, from the annual Book of ASTM Standards, copyright AmericanSociety for Testing and Materials, 100 Barr Harbor Drive, West Conshohocken, PA 19248. Acopy of the complete standard may be purchased from ASTM, phone: 610-832-9585, fax: 610-832-9555, e-mail: [email protected], website: www.astm.org.
D4486-91(1996)e1 Standard Test Method for Kinematic Viscosity of Volatile and ReactiveLiquids
1. Scope
1.1 This test method covers the measurement of kinematic viscosity of transparent, Newtonianliquids which because of their reactivity, instability, or volatility cannot be used in conventionalcapillary kinematic viscometers. This test method is applicable up to 2 X 10 N/m (2 atm)pressure and temperature range from -53 to +135°C (-65 to +275° F).

47
1.1.1 For the measurement of the kinematic viscosity of other liquids, see Test Method D445.
1.2 This standard does not purport to address all of the safety concerns, if any, associated withits use. It is the responsibility of the user of this standard to establish appropriate safety andhealth practices and determine the applicability of regulatory limitations prior to use. For specificprecautionary statements, see 6.2, 6.3, and 6.4.
1.3 Reprinted with permission, from the annual Book of ASTM Standards, copyright AmericanSociety for Testing and Materials, 100 Barr Harbor Drive, West Conshohocken, PA 19248. Acopy of the complete standard may be purchased from ASTM, phone: 610-832-9585, fax: 610-832-9555, e-mail: [email protected], website: www.astm.org.
Surface and Interfacial Tension
D971-99a Standard Test Method for Interfacial Tension of Oil Against Water by the RingMethod
1. Scope
1.1 This test method covers the measurement of, under nonequilibrium conditions, theinterfacial tension of mineral oils against water.
1.2 This standard does not purport to address all of the safety problems, if any, associated withits use. It is the responsibility of the user of this standard to establish appropriate safety andhealth practices and determine the applicability of regulatory limitations prior to use.
1.3 Reprinted with permission, from the annual Book of ASTM Standards, copyright AmericanSociety for Testing and Materials, 100 Barr Harbor Drive, West Conshohocken, PA 19248. Acopy of the complete standard may be purchased from ASTM, phone: 610-832-9585, fax: 610-832-9555, e-mail: [email protected], website: www.astm.org.
D3825-90(1995) Standard Test Method for Dynamic Surface Tension by the Fast-BubbleTechnique
1. Scope
1.1 This test method covers the determination of the specific free energy of a liquid-gas surfacea short time after formation of the surface.
1.2 It is applicable to liquids with vapor pressures up to 30.0 kPa (225 torr) and kinematicviscosities up to 4.0 mm /s (4.0 cSt) at the test temperature. Higher viscosities have not yetbeen investigated.
1.3 The values stated in SI units are to be regarded as the standard. The values given inparentheses are for information only.
1.4 This standard does not purport to address all of the safety problems associated with its use.It is the responsibility of the user of this standard to consult and establish appropriate safety andhealth practices and determine the applicability of regulatory limitations prior to use. For specificprecautionary statements, see 7.3, 7.4, and 7.5.

48
1.5 Reprinted with permission, from the annual Book of ASTM Standards, copyright AmericanSociety for Testing and Materials, 100 Barr Harbor Drive, West Conshohocken, PA 19248. Acopy of the complete standard may be purchased from ASTM, phone: 610-832-9585, fax: 610-832-9555, e-mail: [email protected], website: www.astm.org.
D1331-89(1995) Standard Test Methods for Surface and Interfacial Tension of Solutionsof Surface-Active Agents
1. Scope
1.1 These test methods cover the determination of surface tension and interfacial tension ofsolutions of surface-active agents, as defined in Definitions D459. Two methods are covered asfollows: Method A-Surface Tension. Method B-Interfacial Tension.
1.2 Method A is written primarily to cover aqueous solutions of surface-active agents, but is alsoapplicable to nonaqueous solutions and mixed solvent solutions.
1.3 Method B is applicable to two-phase solutions. More than one solute component may bepresent, including solute components that are not in themselves surface-active.
1.4 This standard may involve hazardous materials, operations, and equipment. This standarddoes not purport to address all of the safety problems associated with its use. It is theresponsibility of the user of this standard to establish appropriate safety and health practicesand determine the applicability of regulatory limitations prior to use. Material Safety Data Sheetsare available for reagents and materials. Review them for hazards prior to usage.
1.5 Reprinted with permission, from the annual Book of ASTM Standards, copyright AmericanSociety for Testing and Materials, 100 Barr Harbor Drive, West Conshohocken, PA 19248. Acopy of the complete standard may be purchased from ASTM, phone: 610-832-9585, fax: 610-832-9555, e-mail: [email protected], website: www.astm.org.
D2285-99 Standard Test Method for Interfacial Tension of Electrical Insulating Oils ofPetroleum Origin Against Water by the Drop-Weight Method
1. Scope
1.1 This test method covers a comparatively rapid procedure particularly applicable for field usefor measuring, under nonequilibrium conditions, the interfacial tensions of electrical insulatingoils of petroleum origin against water. This test method has been shown by experience to give areliable indication of the presence of hydrophilic compounds. This test method may not beapplicable for highly viscous insulating fluids.
1.2 This standard does not purport to address all of the safety concerns, if any, associated withits use. It is the responsibility of the user of this standard to establish appropriate safety andhealth practices and determine the applicability of regulatory limitations prior to use.
1.3 Reprinted with permission, from the annual Book of ASTM Standards, copyright AmericanSociety for Testing and Materials, 100 Barr Harbor Drive, West Conshohocken, PA 19248. Acopy of the complete standard may be purchased from ASTM, phone: 610-832-9585, fax: 610-832-9555, e-mail: [email protected], website: www.astm.org.

49
Porosity and Pore Volume Distribution
D4404-84(1998)e1 Standard Test Method for Determination of Pore Volume and PoreVolume Distribution of Soil and Rock by Mercury Intrusion Porosimetry
1. Scope
1.1 This test method covers the determination of the pore volume and the pore volumedistributions of soil and rock by the mercury intrusion porosimetry method. The range ofapparent diameters of pores for which this test method is applicable is fixed by the operantpressure range of the testing instrument. This range is typically between apparent pore entrancediameters of about 100 [mu]m and 2.5 nm (0.0025 [mu]m). Larger pores must be measured byanother method.
1.2 Mercury intrusion porosimetry is useful only for measuring pores open to the outside of asoil or rock fragment; mercury intrusion porosimetry will not give the volume of any porescompletely enclosed by surrounding solids. This test method will give only the volume ofintrudable pores that have an apparent diameter corresponding to a pressure within thepressurizing range of the testing instrument.
1.3 The intrusion process proceeds from the outside of a fragment toward its center.Comparatively large interior pores can exist that have smaller pores as the only means ofaccess. Mercury intrusion porosimetry will incorrectly register the entire volume of these "ink-bottle" pores as having the apparent diameter of the smaller access pores. In a test sample,inter-fragment pores can exist in addition to intra-fragment pores (see Section 3 for definitions).The inter-fragment pores will vary in size and volume depending on the size and shape of thesoil or rock fragments and on the manner in which the fragments are packed together. It ispossible that some inter-fragment pores can have the same apparent diameter as some intra-fragment pores. When this occurs this test method cannot distinguish between them. Thus,the test method yields an intruded pore volume distribution that is in part dependent upon thepacking of multifragment samples. However, most soils and rocks have intra-fragment poresmuch smaller than the inter-fragment pores. This situation leads to a bi-modal pore sizedistribution and the distinction between the two classes of pores can then be made (seeFigs. 1 and 2).
1.4 Mercury intrusion may involve the application of high pressures to the sample. This mayresult in a temporary, or permanent, or temporary and permanent alteration in the poregeometry. Generally, soils and rocks are composed of comparatively strong solids and are lesssubject to these alterations than certain other materials. However, the possibility remains thatthe use of this test method may alter the natural pore volume distribution that is beingmeasured.
1.5 This standard does not purport to address all of the safety problems, if any, associated withits use. It is the responsibility of the user of this standard to consult and establish appropriatesafety and health practices and determine the applicability of regulatory limitations prior to use.For specific precaution statements, see Section 8.
1.6 Reprinted with permission, from the annual Book of ASTM Standards, copyright AmericanSociety for Testing and Materials, 100 Barr Harbor Drive, West Conshohocken, PA 19248. Acopy of the complete standard may be purchased from ASTM, phone: 610-832-9585, fax: 610-832-9555, e-mail: [email protected], website: www.astm.org.

50
F1815-97 Standard Test Method for Saturated Hydraulic Conducitivity, Water Retention,Porosity, Particle Density, and Bulk Density of Putting Green and Sports Turf Root Zones
1. Scope
1.1 These test methods cover the measurements of saturated hydraulic conductivity, waterretention, porosity (including distribution of capillary and air-filled porosity at a known matrixpotential), and particle and bulk densities on root zone mixes to be used for construction and topdressing of golf course putting greens including United States Golf Association (USGA)recommended greens or other highly trafficked turfgrass areas.
1.2 Water retention is not a required measurement for USGA Recommended greens. Itsinclusion in these test methods is for the benefit of those who wish to continue to obtain suchdata. Likewise, bulk density is no longer a physical parameter required in the evaluation ofUSGA root zone mixes, but is must be determined for calculation of total and capillary porosity.
1.3 The values stated in SI units are to be regarded as the standard. The inch-pound units givenin parentheses are for information only.
1.4 This standard does not purport to address all of the safety concerns, if any, associated withits use. It is the responsibility of the user of this standard to establish appropriate safety andhealth practices and determine the applicability of regulatory limitations prior to use.
1.5 Reprinted with permission, from the annual Book of ASTM Standards, copyright AmericanSociety for Testing and Materials, 100 Barr Harbor Drive, West Conshohocken, PA 19248. Acopy of the complete standard may be purchased from ASTM, phone: 610-832-9585, fax: 610-832-9555, e-mail: [email protected], website: www.astm.org.
Permeability
D2434-68(1994)e1 Standard Test Method for Permeability of Granular Soils(Constant Head)
1. Scope
1.1 This test method covers the determination of the coefficient of permeability by a constant-head method for the laminar flow of water through granular soils. The procedure is to establishrepresentative values of the coefficient of permeability of granular soils that may occur in naturaldeposits as placed in embankments, or when used as base courses under pavements. In orderto limit consolidation influences during testing, this procedure is limited to disturbed granularsoils containing not more than 10% soil passing the 75-[mu]m (No. 200) sieve.
1.2 This standard does not purport to address all of the safety problems, if any, associated withits use. It is the responsibility of the user of this standard to establish appropriate safety andhealth practices and determine the applicability of regulatory limitations prior to use.
1.3 Reprinted with permission, from the annual Book of ASTM Standards, copyright AmericanSociety for Testing and Materials, 100 Barr Harbor Drive, West Conshohocken, PA 19248. Acopy of the complete standard may be purchased from ASTM, phone: 610-832-9585, fax: 610-832-9555, e-mail: [email protected], website: www.astm.org.

51
D5856-95 Standard Test Method for Measurement of Hydraulic Conductivity of PorousMaterial Using a Rigid-Wall, Compaction-Mold Permeameter
1. Scope
1.1 This test method covers laboratory measurement of the hydraulic conductivity (also referredto as coefficient of permeability ) of laboratory-compacted materials with a rigid-wall,compaction-mold permeameter.
1.2 This test method may be used with laboratory-compacted specimens that have a hydraulicconductivity less than or equal to 1 X 10 -5 m/s. The hydraulic conductivity of compactedmaterials that have hydraulic conductivities greater than 1 X 10 -5 m/s may be determined byTest Method D2434.
1.3 The values stated in SI units are to be regarded as the standard, unless other units arespecifically given. By tradition in U.S. practice, hydraulic conductivity is reported in centimetresper second, although the common SI units for hydraulic conductivity are metres per second.
1.4 Reprinted with permission, from the annual Book of ASTM Standards, copyright AmericanSociety for Testing and Materials, 100 Barr Harbor Drive, West Conshohocken, PA 19248. Acopy of the complete standard may be purchased from ASTM, phone: 610-832-9585, fax: 610-832-9555, e-mail: [email protected], website: www.astm.org.
D5084-90(1997) Standard Test Method for Measurement of Hydraulic Conductivity ofSaturated Porous Materials Using a Flexible Wall Permeameter
1. Scope
1.1 This test method covers laboratory measurement of the hydraulic conductivity (also referredto as coefficient of permeability ) of water-saturated porous materials with a flexible wallpermeameter.
1.2 This test method may be utilized with undisturbed or compacted specimens that have ahydraulic conductivity less than or equal to 1 X 10⁻⁵ m/s (1 X 10⁻³ cm/s).
1.3 The hydraulic conductivity of materials with hydraulic conductivities greater than 1 X 10⁻⁵m/s may be determined by Test Method D2434.
1.4 The values stated in SI units are to be regarded as the standard, unless other units arespecifically given. By tradition in U.S. practice, hydraulic conductivity is reported in centimetresper second, although the common SI units for hydraulic conductivity are metres per second.
1.5 This standard does not purport to address the safety problems associated with its use. It isthe responsibility of the user of this standard to establish appropriate safety and health practicesand determine the applicability of regulatory limitations prior to use.
1.6 This standard does not purport to address all of the safety concerns, if any, associated withits use. It is the responsibility of the user of this standard to establish appropriate safety andhealth practices and determine the applicability of regulatory limitations prior to use.

52
1.7 Reprinted with permission, from the annual Book of ASTM Standards, copyright AmericanSociety for Testing and Materials, 100 Barr Harbor Drive, West Conshohocken, PA 19248. Acopy of the complete standard may be purchased from ASTM, phone: 610-832-9585, fax:610-832-9555, e-mail: [email protected], website: www.astm.org.
Capillary Pressure
D3152-72(1994)e1 Standard Test Method for Capillary-Moisture Relationships for Fine-Textured Soils by Pressure-Membrane Apparatus
1. Scope
1.1 This test method covers the determination of capillary-moisture properties of fine-texturedsoils as indicated by the moisture content - moisture tension relationships determined bypressure-membrane apparatus using tensions between 1 and 15 atm (101 and 1520 kPa).Moisture tension (matrix suction) is defined as the equivalent negative gage pressure, orsuction, in soil moisture. The test result is a moisture content which is a measure of the waterretained in the soil subjected to a given soil - water tension (or at an approximately equivalentheight above the water table).
Note 1-For determination of capillary-moisture relationships of coarse- and medium-texturedsoils, refer to Test Method D2325.
1.2 This standard does not purport to address all of the safety problems, if any, associated withits use. It is the responsibility of the user of this standard to establish appropriate safety andhealth practices and determine the applicability of regulatory limitations prior to use.
1.3 Reprinted with permission, from the annual Book of ASTM Standards, copyright AmericanSociety for Testing and Materials, 100 Barr Harbor Drive, West Conshohocken, PA 19248. Acopy of the complete standard may be purchased from ASTM, phone: 610-832-9585, fax: 610-832-9555, e-mail: [email protected], website: www.astm.org.
D2325-68(1994)e1 Standard Test Method for Capillary-Moisture Relationships forCoarse- and Medium-Textured Soils by Porous-Plate Apparatus
1. Scope
1.1 This test method covers the determination of capillary-moisture relationships for coarse- andmedium-textured soils as indicated by the soil-moisture tension relations for tensions between10 and 101 kPa (0.1 and 1 atm). Under equilibrium conditions, moisture tension is defined asthe equivalent negative gage pressure, or suction, corresponding to a soil moisture content.This test method determines the equilibrium moisture content retained in a soil subjected to agiven soil-water tension. This test method is not suitable for very fine-textured soils.
Note 1-For determination of capillary-moisture relationships for fine-textured soils, refer to TestMethod D3152.
1.2 Reprinted with permission, from the annual Book of ASTM Standards, copyright AmericanSociety for Testing and Materials, 100 Barr Harbor Drive, West Conshohocken, PA 19248. Acopy of the complete standard may be purchased from ASTM, phone: 610-832-9585, fax: 610-832-9555, e-mail: [email protected], website: www.astm.org.
53
D425-88(1994) Standard Test Method for Centrifuge Moisture Equivalent of Soils
1. Scope
1.1 This test method covers the determination of the moisture equivalent of soil in the laboratoryby means of a centrifuge technique.
1.2 This test method is limited to disturbed specimens of coarse-grained soils having fines oflow plasticity such as SP, SW, SC-SM, or SM soils. The test is limited to soils passing the 2.00-mm sieve or that fraction of a soil passing a 2.00-mm sieve.
Note 1-Test Method D3152 or Test Method D2325 should be used to evaluate the capillary-moisture relations of fine-grained soils and coarse-grained soils having fines of medium to highplasticity, undisturbed soils, and soils at specific desired units weights.
1.3 The test method is temperature-dependent, and consistent comparable results can beobtained only if the tests are performed under a constant-temperature condition.
1.4 The values stated in SI units are to be regarded as the standard.
1.5 This standard may involve hazardous materials, operations, and equipment. This standarddoes not purport to address all of the safety problems associated with its use. It is theresponsibility of the user of this standard to establish appropriate safety and health practicesand determine the applicability of regulatory limitations prior to use.
1.6 Reprinted with permission, from the annual Book of ASTM Standards, copyright AmericanSociety for Testing and Materials, 100 Barr Harbor Drive, West Conshohocken, PA 19248. Acopy of the complete standard may be purchased from ASTM, phone: 610-832-9585, fax: 610-832-9555, e-mail: [email protected], website: www.astm.org.
Sampling
D4696-92e1 Standard Guide for Pore-Liquid Sampling from the Vadose Zone
1. Scope
1.1 This guide discusses equipment and procedures used for sampling pore-liquid from thevadose zone (unsaturated zone). The guide is limited to in-situ techniques and does not includesoil core collection and extraction methods for obtaining samples.
1.2 The term "pore-liquid" is applicable to any liquid from aqueous pore-liquid to oil. However, allof the samplers described in this guide were designed, and are used to sample aqueous pore-liquids only. The abilities of these samplers to collect other pore-liquids may be quite differentthan those described.
1.3 Some of the samplers described in this guide are not currently commercially available.These samplers are presented because they may have been available in the past, and may beencountered at sites with established vadose zone monitoring programs. In addition, some ofthese designs are particularly suited to specific situations. If needed, these samplers could befabricated.

54
1.4 The values stated in SI units are to be regarded as the standard.
1.5 This standard does not purport to address all of the safety problems, if any, associated withits use. It is the responsibility of the user of this standard to establish appropriate safety andhealth practices and determine the applicability of regulatory limitations prior to use.
1.6 Reprinted with permission, from the annual Book of ASTM Standards, copyright AmericanSociety for Testing and Materials, 100 Barr Harbor Drive, West Conshohocken, PA 19248. Acopy of the complete standard may be purchased from ASTM, phone: 610-832-9585, fax: 610-832-9555, e-mail: [email protected], website: www.astm.org.
Bulk Density of Soil
D4564-93 Standard Test Method for Density of Soil in Place by the Sleeve Method
1. Scope
1.1 This test method covers the determination of the density of soil in place by the sleevemethod.
1.2 The sleeve method of determining the density of soil in place is used for cohesionless,granular soils for which other methods of determining the density (sand cone, test pit, and thelike) may not be practical. Typically, the sleeve method is applicable for soils that arepredominantly fine gravel size, with a maximum of 5% fines, and a maximum particle size of 3/4in. (19.0 mm).
Note 1-There have been other methods developed for testing cohesionless soils. Compared toother methods, this procedure is convenient for field construction control testing becausesmaller and lighter equipment is used and the test can be performed in a smaller area.
1.3 A calibration equation is necessary in the application of this test method to obtain a reliablevalue of the in-place density of the soil (see Annex A1). The calibration equation is used tocalculate the density of the soil in place from the mass of dry soil per inch of test hole measuredby the sleeve method.
1.3.1 The calibration equation is predetermined for a particular soil type that is to be tested.When the soil changes significantly in either gradation or particle angularity, the calibrationequation may have to be adjusted or redefined before the sleeve method can be used.
1.3.2 There may be certain soils meeting the general description in 1.2 for which a calibrationequation may not be appropriate due to unsatisfactory correlation of the data. The sleevemethod would not be applicable for these soils.
1.3.3 There may be certain soils meeting the description in 1.2 for which the calibration equationmay be applicable only for a certain range of densities. The sleeve method will give reliablevalues of the density in place only within that range of densities.
1.4 It is common practice in the engineering profession to concurrently use pounds to representboth a unit of mass (lbm) and a unit of force (lbf). This implicitly combines two separate systemsof units; that is, the absolute system and the gravitational system. It is scientifically undesirable
55
to combine the use of two separate sets of inch-pound units within a single standard. Thisstandard has been written using the gravitational system of units when dealing with the inch-pound system. In this system the pound (lbf) represents a unit of force (weight). However, theuse of balances or scales recording pounds of mass (lbm), or the recording of density inlbm/ft should not be regarded as nonconformance with this test method.
1.5 This standard does not purport to address all of the safety problems, if any, associated withits use. It is the responsibility of the user of this standard to establish appropriate safety andhealth practices and determine the applicability of regulatory limitations prior to use.
1.6 Reprinted with permission, from the annual Book of ASTM Standards, copyright AmericanSociety for Testing and Materials, 100 Barr Harbor Drive, West Conshohocken, PA 19248. Acopy of the complete standard may be purchased from ASTM, phone: 610-832-9585, fax: 610-832-9555, e-mail: [email protected], website: www.astm.org.
D2937-94 Standard Test Method for Density of Soil in Place by the Drive-Cylinder Method
1. Scope
1.1 This test method covers the determination of in-place density of soil by the drive-cylindermethod. The test method involves obtaining a relatively undisturbed soil sample by driving athin-walled cylinder and the subsequent activities for the determination of in-place density.When sampling or in-place density is required at depth, Test Method D1587 should be used.
1.2 This test method is not appropriate for sampling organic soils which can compress uponsampling, very hard natural soils and heavily compacted soils which cannot be easily penetratedby the drive sampler, soils of low plasticity which will not be readily retained in the cylinder, orsoils which contain appreciable amounts of gravel (particles coarser than 4.75 mm). Thepresence of particles coarser than 4.75 mm may introduce significant errors in densitymeasurements by causing voids along the wall of the cylinder during driving, and when coarsematerials have to be dislodged by the trimming of the sample obtained by the cylinder.
1.3 This test method is limited to the procedures necessary for obtaining specimens suitable fordetermining the in-place density and water content of certain soils. The procedures andprecautions necessary for selecting locations and obtaining undisturbed samples suitable forlaboratory testing or otherwise determining engineering properties is beyond the scope of thistest method.
1.4 It is common practice in the engineering profession to concurrently use pounds to representboth a unit of mass (lbm) and a unit of force (lbf). This implicitly combines two separate systemsof units, that is, the absolute system and the gravitational system. It is scientifically undesirableto combine the use of two separate sets of inch-pound units within a single standard. This testmethod has been written using the gravitational system of units when dealing with the inch-pound system. In this system the pound (lbf) represents a unit of force (weight). However, theuse of balances or scales recording pounds of mass (lbm), or the recording of density inlbm/ft should not be regarded as nonconformance with this test method.
1.5 This standard does not purport to address all of the safety concerns, if any, associated withits use. It is the responsibility of the user of this standard to establish appropriate safety andhealth practices and determine the applicability of regulatory limitations prior to use.

56
1.6 Reprinted with permission, from the annual Book of ASTM Standards, copyright AmericanSociety for Testing and Materials, 100 Barr Harbor Drive, West Conshohocken, PA 19248. Acopy of the complete standard may be purchased from ASTM, phone: 610-832-9585, fax: 610-832-9555, e-mail: [email protected], website: www.astm.org.
Soil Sampling
D6282-98 Standard Guide for Direct Push Soil Sampling for Environmental SiteCharacterizations
1. Scope
1.1 This guide addresses direct push soil samplers, which also may be driven into the groundfrom the surface or through pre-bored holes. The samplers can be continuous or discreteinterval units. Samplers are advanced by a combination of static push, or impacts fromhammers, or vibratory methods, or a combination thereof, to the depth of interest. The guidedoes not cover open chambered samplers operated by hand such as augers, agriculturalsamplers operated at shallow depths, or side wall samplers. This guide does not address singlesampling events in the immediate base of the drill hole using rotary drilling equipment withincremental drill hole excavation. Other sampling standards, such as Test Methods D 1586 andD 1587 and Practice D 3550 apply to rotary drilling activities. This guide does not addressadvancement of sampler barrel systems with methods that employ cuttings removal as thesampler is advanced. Other drilling and sampling methods may apply for samples needed forengineering and construction applications.
1.2 Guidance on preservation and transport of samples, as given in Guide D 4220, may or maynot apply. Samples for chemical analysis often must be subsampled and reserved for chemicalanalysis using special techniques. Practice D 3694 provides information on some of the specialtechniques required. Additional information on environmental sample preservation andtransportation is available in other references (1, 2). Samples for classification may bepreserved using procedures similar to Class A. In most cases, a direct push sample isconsidered as Class B in Practice D 4220 but is protected, representative, and suitable forchemical analysis. The samples taken with this practice do not usually produce Class C and D(with exception of thin wall samples of standard size) samples for testing for engineeringproperties, such as shear strength and compressibility. Guide D 4700 has some information onmechanical soil sampling devices similar to direct push techniques, however, it does notaddress most direct push sampling methods. If sampling is for chemical evaluation in theVadose Zone, consult Guide D 4700 for any special considerations.
1.3 Field methods described in this guide, include the use of discreet and continuous samplingtools, split and solid barrel samplers and thin walled tubes with or without fixed piston styleapparatus.
1.4 Insertion methods described include static push, impact, percussion, other vibratory/sonicdriving, and combinations of these methods using direct push equipment adapted to drilling rigs,cone penetrometer units, and specially designed percussion/direct push combination machines.Hammers providing the force for insertion include drop style, hydraulically activated, airactivated and mechanical lift devices.
1.5 Direct push soil sampling is limited to soils and unconsolidated materials that can bepenetrated with the available equipment. The ability to penetrate strata is based on hammer

57
energy, carrying vehicle weight, compactness of soil, and consistency of soil. Penetration maybe limited or damage to samplers and conveying devices can occur in certain subsurfaceconditions, some of which are discussed in 5.5. Successful sample recovery also may be limitedby the ability to retrieve tools from the borehole. Sufficient retract force must be available whenattempting difficult or deep investigations.
1.6 This guide does not address the installation of any temporary or permanent soil, groundwater, vapor monitoring, or remediation devices.
1.7 The practicing of direct push techniques may be controlled by local regulations governingsubsurface penetration. Certification, or licensing requirements, or both, may need to beconsidered in establishing criteria for field activities.
1.8 The values stated in SI units are to be regarded as standard; however, dimensions used inthe drilling industry are given in inch-pound units by convention. Inch-pound units are usedwhere necessary in this guide.
1.9 This standard does not purport to address all of the safety concerns, if any, associated withits use. It is the responsibility of the user of this standard to establish appropriate safety andhealth practices and determine the applicability of regulatory limitations prior to use.
1.10 This guide offers an organized collection of information or a series of options and does notrecommend a specific course of action. This document cannot replace education or experienceand should be used in conjunction with professional judgment. Not all aspects of this guide maybe applicable in all circumstances. This ASTM standard is not intended to represent or replacethe standard of care by which the adequacy of a given professional service must be judged, norshould this document be applied without consideration of a project's many unique aspects. Theword "Standard" in the title of this document means only that the document has been approvedthrough the ASTM consensus process.
1.11 Reprinted with permission, from the annual Book of ASTM Standards, copyright AmericanSociety for Testing and Materials, 100 Barr Harbor Drive, West Conshohocken, PA 19248. Acopy of the complete standard may be purchased from ASTM, phone: 610-832-9585, fax: 610-832-9555, e-mail: [email protected], website: www.astm.org.
D6169-98 Standard Guide for Selection of Soil and Rock Sampling Devices Used WithDrill Rigs for Environmental Investigations
1. Scope
1.1 This guide covers guidance for the selection of soil and rock sampling devices used withdrill rigs for the purpose of characterizing in situ physical and hydraulic properties, chemicalcharacteristics, subsurface lithology, statigraphy, and structure, and hydrogeologic units inenvironmental investigations.
1.2 Reprinted with permission, from the annual Book of ASTM Standards, copyright AmericanSociety for Testing and Materials, 100 Barr Harbor Drive, West Conshohocken, PA 19248. Acopy of the complete standard may be purchased from ASTM, phone: 610-832-9585, fax: 610-832-9555, e-mail: [email protected], website: www.astm.org.

58
D1452-80(1995)e1 Standard Practice for Soil Investigation and Sampling by AugerBorings
1. Scope
1.1 This practice covers equipment and procedures for the use of earth augers in shallowgeotechnical exploration. This practice does not apply to sectional continuous flight augers.
1.2 This standard does not purport to address the safety problems associated with its use. It isthe responsibility of the user of this standard to establish appropriate safety and health practicesand determine the applicability of regulatory limitations prior to use.
1.3 Reprinted with permission, from the annual Book of ASTM Standards, copyright AmericanSociety for Testing and Materials, 100 Barr Harbor Drive, West Conshohocken, PA 19248. Acopy of the complete standard may be purchased from ASTM, phone: 610-832-9585, fax: 610-832-9555, e-mail: [email protected], website: www.astm.org.
D1587-94 Standard Practice for Thin-Walled Tube Geotechnical Sampling of Soils
1. Scope
1.1 This practice covers a procedure for using a thin-walled metal tube to recover relativelyundisturbed soil samples suitable for laboratory tests of structural properties. Thin-walled tubesused in piston, plug, or rotary-type samplers, such as the Denison or Pitcher, must comply withthe portions of this practice which describe the thin-walled tubes (5.3).
Note 1-This practice does not apply to liners used within the above samplers.
1.2 The values stated in both inch-pound and SI units are to be regarded as the standard.
1.3 This standard does not purport to address all of the safety concerns, if any, associated withits use. It is the responsibility of the user of this standard to establish appropriate safety andhealth practices and determine the applicability of regulatory limitations prior to use.
1.4 Reprinted with permission, from the annual Book of ASTM Standards, copyright AmericanSociety for Testing and Materials, 100 Barr Harbor Drive, West Conshohocken, PA 19248. Acopy of the complete standard may be purchased from ASTM, phone: 610-832-9585, fax: 610-832-9555, e-mail: [email protected], website: www.astm.org.
D1586-99 Standard Test Method for Penetration Test and Split-Barrel Sampling of Soils
1. Scope
1.1 This test method describes the procedure, generally known as the Standard PenetrationTest (SPT), for driving a split-barrel sampler to obtain a representative soil sample and ameasure of the resistance of the soil to penetration of the sampler.
1.2 This standard does not purport to address all of the safety problems, if any, associated withits use. It is the responsibility of the user of this standard to establish appropriate safety andhealth practices and determine the applicability of regulatory limitations prior to use. For a
59
specific precautionary statement, see 5.4.1. The values stated in inch-pound units are to beregarded as the standard.
1.3 Reprinted with permission, from the annual Book of ASTM Standards, copyright AmericanSociety for Testing and Materials, 100 Barr Harbor Drive, West Conshohocken, PA 19248. Acopy of the complete standard may be purchased from ASTM, phone: 610-832-9585, fax: 610-832-9555, e-mail: [email protected], website: www.astm.org.
NAPL Saturation
D5369-93(1998) Standard Practice for Extraction of Solid Waste Samples for ChemicalAnalysis Using Soxhlet Extraction
1. Scope
1.1 This practice describes standard procedures for extracting nonvolatile and semivolatileorganic compounds from solids such as soils, sediments, sludges, and granular wastes usingSoxhlet extraction.
1.1.1 The sample must be suitable for being mixed with the sample drying agent, sodium sulfateor magnesium sulfate, to provide drying of all sample surfaces.
1.2 This practice, when used in conjunction with Test Method D5368 is applicable to thedetermination of the total solvent extractable content (TSEC) of a soil, sediment, sludge, orgranular solid waste and depends upon the solvent chosen for extraction.
1.3 This practice is limited to solvents having boiling points below the boiling point of water atambient pressure.
1.4 The solvent extract obtained by this practice may be analyzed for total or specific nonvolatileand semivolatile organic compounds, but may require sample clean-up procedures prior tospecific compound analysis.
1.4.1 This practice provides sample extracts suitable for analysis by various techniques such asgas chromatography with flame ionization detection (GC/FID) or gas chromatography with massspectrometric detection (GC/MS).
1.5 This practice is recommended only for solid samples that can pass through a 10-mesh sieve(approximately 2-mm openings), or are less than 2 mm in thickness.
1.6 This standard does not purport to address all of the safety problems, if any, associated withits use. It is the responsibility of the user of this standard to establish appropriate safety andhealth practices and determine the applicability of regulatory limitations prior to use. For specificprecautions see Section 9.
1.7 Reprinted with permission, from the annual Book of ASTM Standards, copyright AmericanSociety for Testing and Materials, 100 Barr Harbor Drive, West Conshohocken, PA 19248. Acopy of the complete standard may be purchased from ASTM, phone: 610-832-9585, fax: 610-832-9555, e-mail: [email protected], website: www.astm.org.

60
D5368-93 Standard Test Methods for Gravimetric Determination of Total SolventExtractable Content (TSEC) of Solid Waste Samples
1. Scope
1.1 These test methods describe standard procedures for gravimetrically determining the totalnonvolatile and semi-volatile organic content of solvent extracts from soils or solid wastes. Thefollowing methods are included:
Section Method A---Micro-Determination of TSEC 11-13 Method B---Evaporating DishProcedure 14-16 Method C---Boiling Flask Procedure 17-19
1.2 These methods are used after a solvent extract is obtained from a soil or solid waste. Forthese methods to be applicable, the extraction solvent must have a boiling point less than that ofwater at ambient pressure.
1.3 The total solvent extractable content (TSEC) of a soil, sediment, sludge, or solid wastedepends upon the solvent and method used for the extraction procedure.
1.4 Reprinted with permission, from the annual Book of ASTM Standards, copyright AmericanSociety for Testing and Materials, 100 Barr Harbor Drive, West Conshohocken, PA 19248. Acopy of the complete standard may be purchased from ASTM, phone: 610-832-9585, fax: 610-832-9555, e-mail: [email protected], website: www.astm.org.

61
Appendix B — Derivation of Methods for Estimating Relative Permeability,Average Conductivity to Oil, and Transmissivity to Oil from Production Data
r2
r1
h1
h2
Qo
bo
Figure B-1 — Basis for derivation of production equations*
Darcy’s equation for flow
+−=
drdz
gdr
dPkkq o
o
o
roo ρ
µ(B-1)
From the definition of capillary pressure wco PPP += , by substitution
++−=
drdz
gdr
dP
dr
dPkkq o
wc
o
roo ρ
µ(B-2)
From the definition of hydraulic head gzghP wwww ρρ −= , by substitution
+−+−=
drdz
gdrdz
gdr
dhg
dr
dPkkq ow
ww
c
o
roo ρρρ
µ(B-3)
Recognizing drdz
dr
dhw = at the water table and dr
dPc to be small
dr
dhgkkq w
o
oroo µ
ρ−= (B-4)
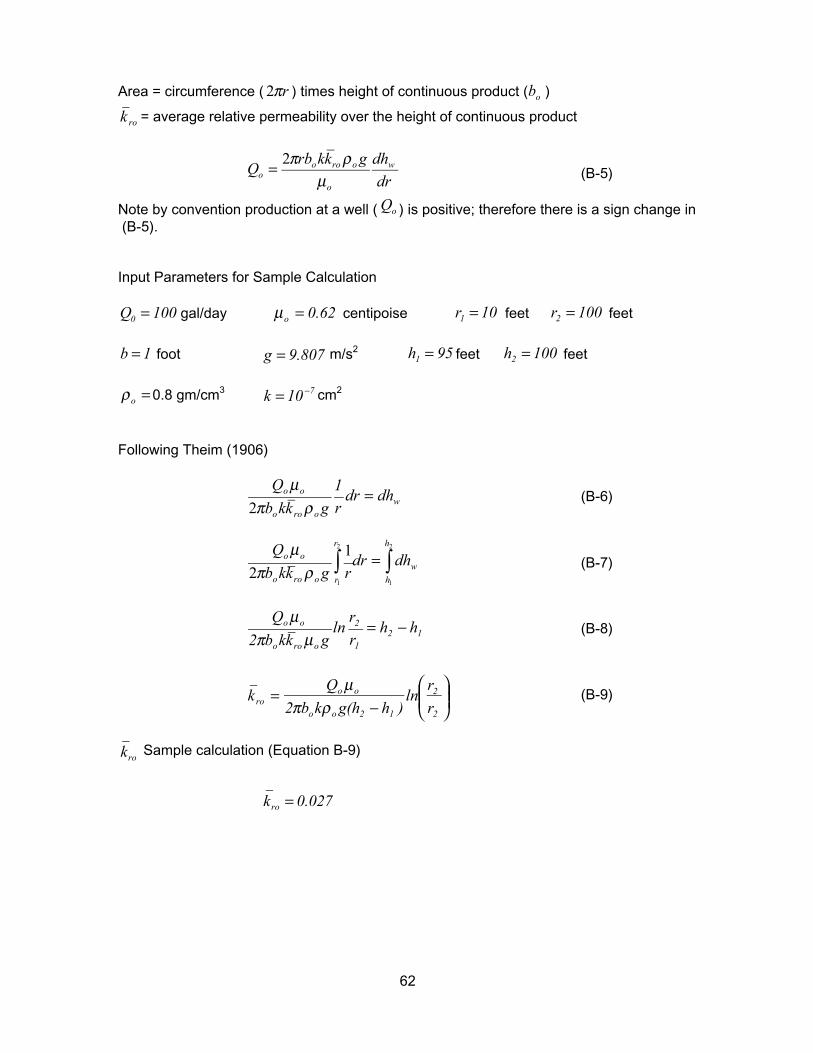
62
Area = circumference ( rπ2 ) times height of continuous product ( ob )
rok = average relative permeability over the height of continuous product
dr
dhgkkrbQ w
o
orooo µ
ρπ2= (B-5)
Note by convention production at a well ( oQ ) is positive; therefore there is a sign change in (B-5).
Input Parameters for Sample Calculation
100Q0 = gal/day 0.62o =µ centipoise 10r1 = feet 100r2 = feet
1b = foot 9.807g = m/s2 95h1 = feet 100h2 = feet
=oρ 0.8 gm/cm3 710k −= cm2
Following Theim (1906)
woroo
oo dhdrr
1
gkkb
Q=
ρπµ
2(B-6)
∫∫ =2
1
2
1
1
2
h
h
w
r
roroo
oo dhdrrgkkb
Q
ρπµ
(B-7)
121
2
oroo
oo hhr
rln
gkkb2
Q−=
µπµ
(B-8)
−
=2
2
12oo
ooro r
rln
)hg(hkb2
Qk
ρπµ
(B-9)
rok Sample calculation (Equation B-9)
0.027kro =

63
The average oil conductivity is
( )12o
1
2o
o
oroo hhb2
r
rlnQ
gkkK
−
==πµ
ρ(B-10)
oK Sample calculation (Equation B-10)
seccm
3.5x10K 4o
−=
The Transmissivity to oil is
( )21
2
1o
ooo hh2
rr
lnQ
bKT−
== (B-11)
oT Sample Calculation (Equation B-11)
day
m0.091T
2
o =
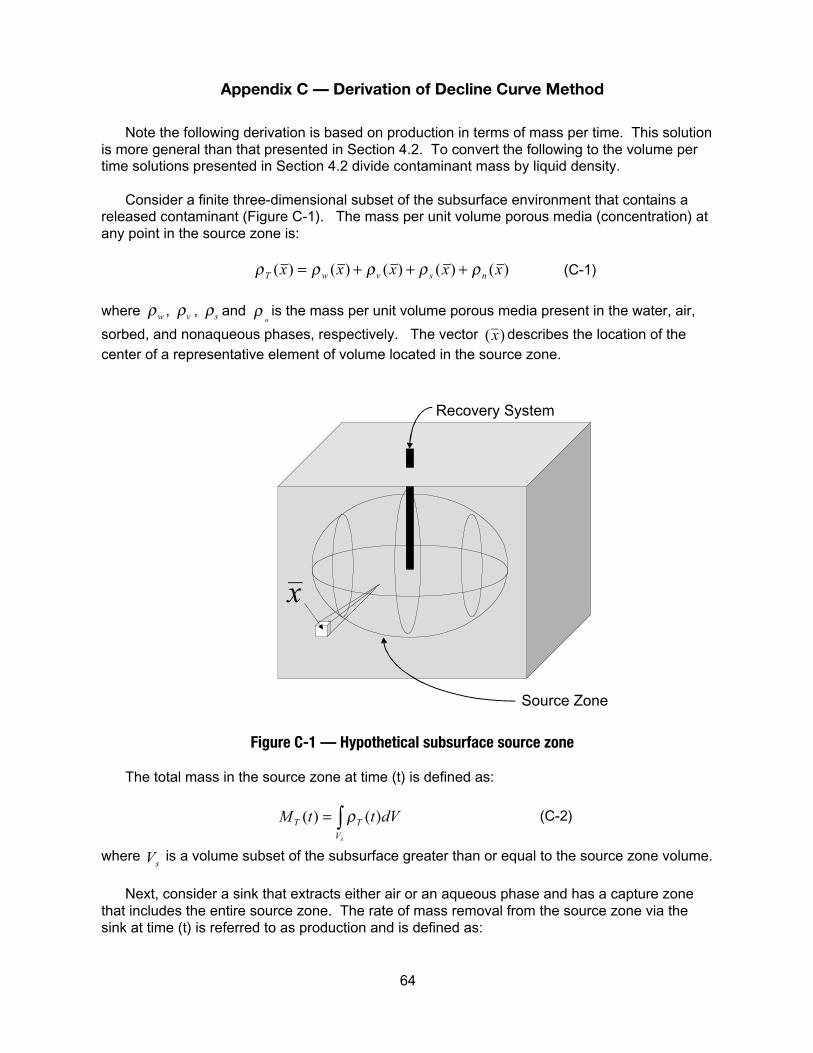
64
Appendix C — Derivation of Decline Curve Method
Note the following derivation is based on production in terms of mass per time. This solutionis more general than that presented in Section 4.2. To convert the following to the volume pertime solutions presented in Section 4.2 divide contaminant mass by liquid density.
Consider a finite three-dimensional subset of the subsurface environment that contains areleased contaminant (Figure C-1). The mass per unit volume porous media (concentration) atany point in the source zone is:
)()()()()( xxxxx nsvwT ρρρρρ +++= (C-1)
where wρ , vρ , sρ and n
ρ is the mass per unit volume porous media present in the water, air,
sorbed, and nonaqueous phases, respectively. The vector )(x describes the location of thecenter of a representative element of volume located in the source zone.
x
Recovery System
Source Zone
Figure C-1 — Hypothetical subsurface source zone
The total mass in the source zone at time (t) is defined as:
∫=sV
TT dVttM )()( ρ (C-2)
where sV is a volume subset of the subsurface greater than or equal to the source zone volume.
Next, consider a sink that extracts either air or an aqueous phase and has a capture zonethat includes the entire source zone. The rate of mass removal from the source zone via thesink at time (t) is referred to as production and is defined as:
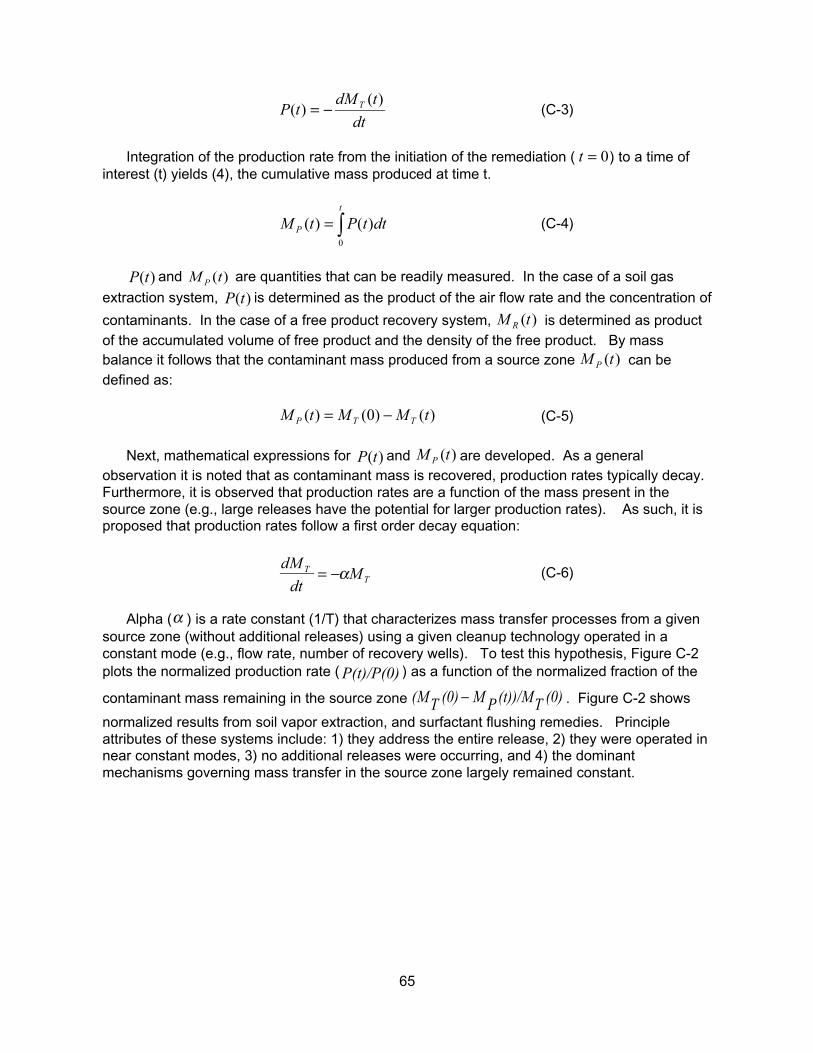
65
dt
tdMtP T )()( −= (C-3)
Integration of the production rate from the initiation of the remediation ( 0=t ) to a time ofinterest (t) yields (4), the cumulative mass produced at time t.
∫=t
P dttPtM0
)()( (C-4)
)(tP and )(tM P are quantities that can be readily measured. In the case of a soil gas
extraction system, )(tP is determined as the product of the air flow rate and the concentration of
contaminants. In the case of a free product recovery system, )(tM R is determined as productof the accumulated volume of free product and the density of the free product. By massbalance it follows that the contaminant mass produced from a source zone )(tM P can bedefined as:
)()0()( tMMtM TTP −= (C-5)
Next, mathematical expressions for )(tP and )(tM P are developed. As a generalobservation it is noted that as contaminant mass is recovered, production rates typically decay.Furthermore, it is observed that production rates are a function of the mass present in thesource zone (e.g., large releases have the potential for larger production rates). As such, it isproposed that production rates follow a first order decay equation:
TT M
dt
dM α−= (C-6)
Alpha (α ) is a rate constant (1/T) that characterizes mass transfer processes from a givensource zone (without additional releases) using a given cleanup technology operated in aconstant mode (e.g., flow rate, number of recovery wells). To test this hypothesis, Figure C-2plots the normalized production rate ( P(t)/P(0) ) as a function of the normalized fraction of the
contaminant mass remaining in the source zone (0)T(t))/MPM(0)T(M − . Figure C-2 shows
normalized results from soil vapor extraction, and surfactant flushing remedies. Principleattributes of these systems include: 1) they address the entire release, 2) they were operated innear constant modes, 3) no additional releases were occurring, and 4) the dominantmechanisms governing mass transfer in the source zone largely remained constant.
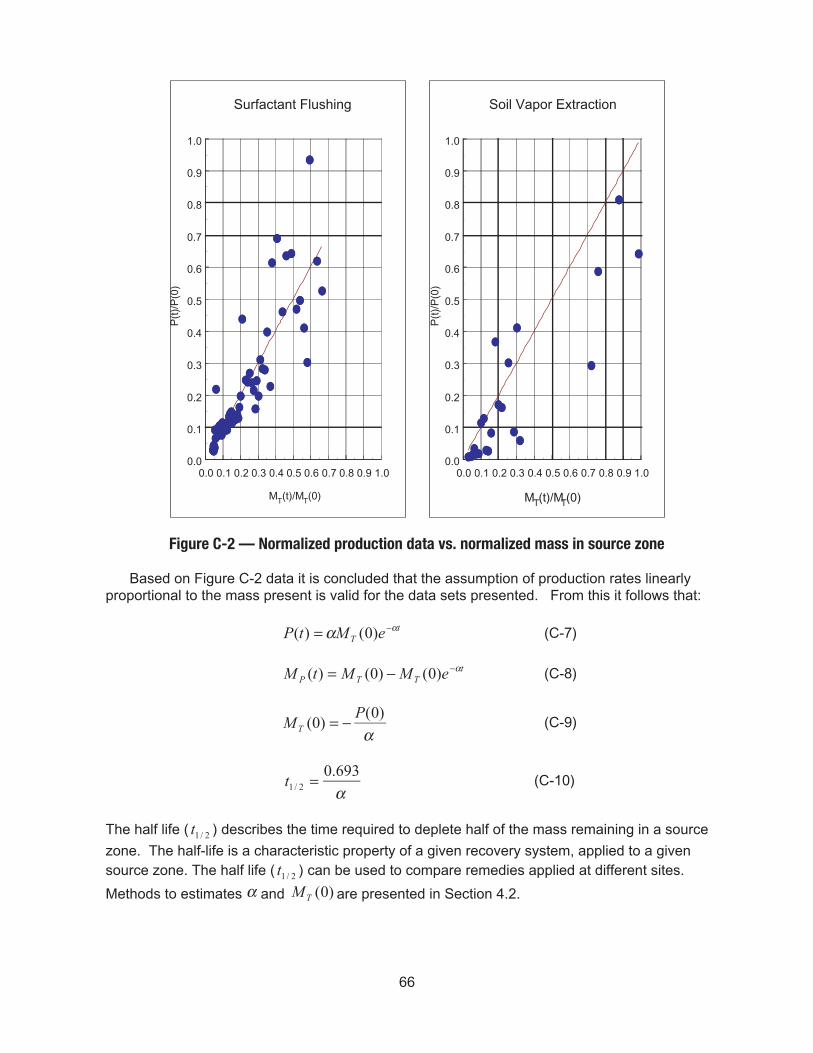
66
0.0 0.1 0.2 0.3 0.4 0.5 0.6 0.7 0.8 0.9 1.0
MT(t)/MT(0)
0.0
0.1
0.2
0.3
0.4
0.5
0.6
0.7
0.8
0.9
1.0
Surfactant Flushing
0.0 0.1 0.2 0.3 0.4 0.5 0.6 0.7 0.8 0.9 1.0
MT(t)/MT(0)
0.0
0.1
0.2
0.3
0.4
0.5
0.6
0.7
0.8
0.9
1.0
Soil Vapor Extraction
P(t
)/P
(0)
P(t
)/P
(0)
Figure C-2 — Normalized production data vs. normalized mass in source zone
Based on Figure C-2 data it is concluded that the assumption of production rates linearlyproportional to the mass present is valid for the data sets presented. From this it follows that:
tT eMtP αα −= )0()( (C-7)
tTTP eMMtM α−−= )0()0()( (C-8)
α)0(
)0(P
M T −= (C-9)
α0.693
2/1 =t (C-10)
The half life ( 2/1t ) describes the time required to deplete half of the mass remaining in a source
zone. The half-life is a characteristic property of a given recovery system, applied to a givensource zone. The half life ( 2/1t ) can be used to compare remedies applied at different sites.
Methods to estimates α and )0(TM are presented in Section 4.2.

07/01

Additional copies are available through Global EngineeringDocuments at (800) 854-7179 or (303) 397-7956
Information about API Publications, Programs and Services isavailable on the World Wide Web at: http://www.api.org
Product No. I471100


