Page 1
London South Bank University
Department of Engineering Systems
MSc in Environmental and Architectural Acoustics
METHODS OF ASSESSMENT OF AIRCRAFT NOISE
N J S Burton
2004
A project in partial fulfilment of the requirements of the degree of Master of
Science in Environmental and Architectural Acoustics
Page 2
ABSTRACT
This project examines various methods used for the assessment of aircraft
noise adopted both historically and internationally. The project is divided into
two parts.
The first part of the project examines a number of the most common methods
for the assessment of aircraft noise adopted in the past and at present as
well as identifying new methods proposed for future use. The philosophy
behind these methods is considered and their respective advantages and
disadvantages in gauging the problems caused by aircraft noise examined.
The second part of the project involves the computer modelling of aircraft
noise resulting from operations at a theoretical airport using a number of the
different noise descriptors examined in the first part of the project. The
results of the noise modelling, and the planning criteria adopted in their
respective country or region of origin, are been compared to identify which
methods produce the worst case and best case scenarios.
The results of the modelling exercise indicate that the Australian system
operates the most stringent controls with regards to aircraft noise and
residential planning whilst the systems adopted in the USA are the least
strict.
Page 3
ACKNOWLEDGEMENTS
I would like to acknowledge and thank the following for their kind assistance
and support during the preparation of this thesis:
• Professor Bridget Shield of London South Bank University for her
assistance in refining the scope of this project and her guidance on
sources of previous research material.
• Dr Stephen Dance of London South Bank University for his
encouragement, supervision and for reading through the numerous
drafts.
• Bickerdike Allen Partners for providing the tools and the time for me to
complete this project and, in particular, Mr Jeff Charles for reading
several drafts and imparting his knowledge and offering his
constructive criticism.
• Mr Tom Lowrey of Transport Canada for providing information on the
methods of assessment of aircraft noise in Canada.
• Mr Jonathan Firth, Mr Nick Fisher and Ms Donna Perera of the
Department of Transport and Regional Services in Australia for
providing information on the methods of assessment of aircraft noise
in Australia.
• My parents, Mr John and Mrs Evelyn Burton, and my fiancée,
Miss Lesley Kemp, for their unconditional love, unfailing support and
for attempting to understand what this is all about.
Page 4
ABSTRACT ACKNOWLEDGEMENTS
CONTENTS 1.0 SECTION 1 – BACKGROUND AND INTRODUCTION...................... 6
2.0 SECTION 2 – LITERATURE REVIEW AND RESEARCH.................. 8
2.1. Aircraft Noise in the United Kingdom.............................................. 8
2.1.1. The Wilson Committee Report......................................................... 8
2.1.2. Second Survey of Aircraft Noise Annoyance Around London
(Heathrow) Airport........................................................................................ 16
2.1.3. The Noise and Number Index System........................................... 17
2.1.4. Changes to the Daytime Index for Aircraft Noise........................... 17
2.1.5. Planning Policy Guidance Note 24: Planning and Noise ............... 20
2.1.6. White Paper – The Future of Air Transport.................................... 22
2.1.7. Brief History of the Development of Heathrow Airport ................... 24
2.2. Aircraft Noise in the United States of America and Canada........ 25
2.2.1. The United States of America........................................................ 25
2.2.2. Canada .......................................................................................... 26
2.3. Aircraft Noise in Australia .............................................................. 27
2.4. Aircraft Noise in the European Union............................................ 35
2.4.1. An Inventory of Current European Methodologies and Procedures
for Environmental Noise Management......................................................... 35
2.4.2. Directive 2002/49/EC..................................................................... 44
2.5. Aircraft Noise Modelling ................................................................. 45
2.5.1. USA FAA Integrated Noise Model (INM) ....................................... 45
2.5.2. UK CAA ANCON ........................................................................... 45
2.5.3. Australian Transparent Noise Information Package ...................... 46
2.6. Summary of Aircraft Noise Assessment Methods ....................... 46
2.6.1. Canada: Noise Exposure Forecast (NEF) ..................................... 47
2.6.2. Australia: Australian Noise Exposure Forecast (ANEF)................. 48
2.6.3. USA: Day-Night Average Sound Level (DNL)................................ 49
2.6.4. USA: Community Noise Equivalent Level (CNEL)......................... 50
2.6.5. European Union Lden and Lnight....................................................... 52
Page 5
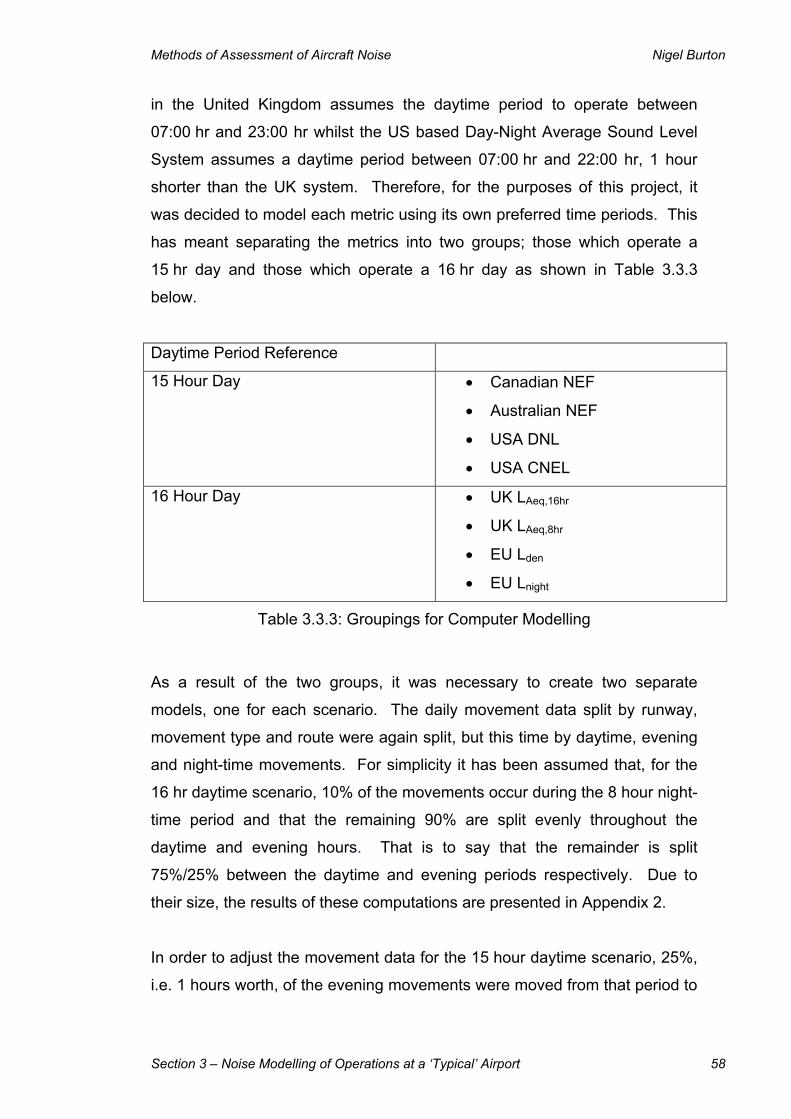
2.6.6. United Kingdom LAeq,16hr and LAeq,8hr .............................................. 53
3.0 SECTION 3 – NOISE MODELLING OF AIRCRAFT OPERATIONS AT A ‘TYPICAL’ AIRPORT ......................................................................... 54
3.1. Introduction ..................................................................................... 54
3.2. The Noise Metrics to be Further Investigated............................... 54
3.3. The Hypothetical Airport and its Operations ................................ 54
3.4. Overview of Utilisation of the Integrated Noise Model................. 59
3.5. Results of the Computer Modelling............................................... 61
3.5.1. Canada: Noise Exposure Forecast (NEF) ..................................... 61
3.5.2. Australia: Australian Noise Exposure Forecast (ANEF)................. 62
3.5.3. USA: Day-Night Average Sound Level (DNL)................................ 63
3.5.4. USA: Community Noise Equivalent Level (CNEL)......................... 64
3.5.5. European Union: Lden..................................................................... 65
3.5.6. European Union: Lnight.................................................................... 66
3.5.7. United Kingdom: LAeq,16hr ............................................................... 67
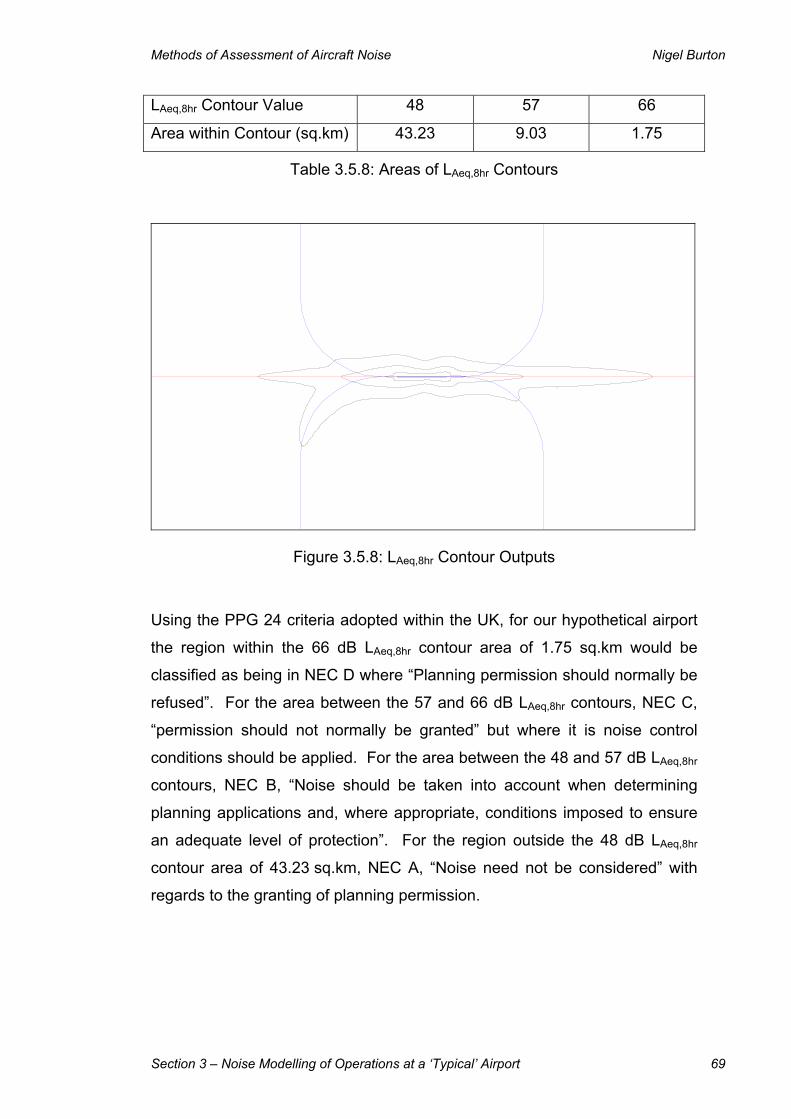
3.5.8. United Kingdom: LAeq,8hr................................................................. 68
3.5.9. Comparison of Residential Planning Criteria in Different Regions. 70
3.6. Discussion of Results..................................................................... 74
4.0 SECTION 4 – SUMMARY, CONCLUSIONS AND AREAS FOR FURTHER WORK ....................................................................................... 76
5.0 SECTION 5 – REFERENCES........................................................... 78
APPENDICES
Appendix 1: Photographs of Examples of Aircraft Used for Noise Models
Appendix 2: 16 Hour Day Scenario INM Input Data
Appendix 3: 15 Hour Day Scenario INM Input Data
Appendix 4: Utilisation of Integrated Noise Model Software
Appendix 5: Resultant Noise Contours from Modelling Exercise
Page 6
Methods of Assessment of Aircraft Noise Nigel Burton
1.0 SECTION 1 – BACKGROUND AND INTRODUCTION
Since their development, the modern world has rapidly learnt to rely heavily
on motorised vehicles. Coupled with their obvious benefits in terms of
transportation of goods and people come a number of consequential
disadvantages. Environmental issues, such as noise, continue to gain
exposure in the media as the growing population affected by them demand a
response from those polluting the atmosphere in which they live.
With the emphasis being placed upon the polluters to be accountable for their
actions, and authorities such as the European Union requiring all member
countries to develop maps of environmental noise in populated areas,
methods for the measurement, prediction and assessment of environmental
noise issues are coming under increasing scrutiny. The use of specific
methods will therefore require justification and their reliability to be
demonstrated and proven.
Both historically and internationally a variety of methods have been adopted
for the assessment of aircraft noise. The first objective of this project is to
examine a number of the most common methods adopted in the past and at
present as well as identifying new methods proposed for future use. The
philosophy behind these methods will be considered and their respective
advantages and disadvantages in gauging the problems caused by aircraft
noise examined.
The second part of the project will involve the use of aircraft operations data
at a theoretical airport in order to examine the different results that can be
presented by the use of different noise descriptors. The Integrated Noise
Model (INM) software produced by the Federal Aviation Authority (FAA) in
the United States will be used for this purpose. The results of this modelling
exercise will be analysed to determine which methods produce the worst
case and best case scenarios.
Section 1 – Background and Introduction 6
Page 7
Methods of Assessment of Aircraft Noise Nigel Burton
In order to restrict the scope of this project, the investigation will concentrate
on conventional fixed wing civilian aircraft and as such will not focus on the
effects of helicopters, military or supersonic aircraft.
Section 1 – Background and Introduction 7
Page 8
Methods of Assessment of Aircraft Noise Nigel Burton
2.0 SECTION 2 – LITERATURE REVIEW AND RESEARCH
2.1. Aircraft Noise in the United Kingdom 2.1.1. The Wilson Committee Report
Over forty years ago, in July 1963, the British Parliament was presented with
the findings of the Committee for the Problem of Noise in their final report.1
The Committee, often referred to as the Wilson Committee after its chairman
Sir Alan Wilson, were appointed in April 1960 “to examine the nature,
sources and effects of the problem of noise and to advise what further
measures can be taken to mitigate it”. The Committee’s fourteen chapter
report covers a variety of noise and noise related issues and includes a
chapter dedicated to the topic of aircraft noise. This is often cited as the first
major published work on the subject particularly within the United Kingdom.
The report identified that the first major introduction of aircraft operations in
the UK was that of military aircraft during the Second World War. After the
war, the civil aviation industry began to grow from a small base of a handful
of airfields/airports. In the beginning, piston-engined aircraft dominated the
skies but as time went on these were replaced by turbo-propeller (turbo-prop)
aircraft. Although complaints did occur in the early days, noise appeared
only to be a problem in the close vicinity around airports. This was to change
with the introduction of turbo-jet aircraft in 1958. These aircraft were much
larger in size than had previously been experienced, thus requiring more
power to get them off the ground. The jet engines also produced a
characteristic noise signature which was unfamiliar to those experienced in
the past. Both of these factors are cited as reasons for the steep rise in
noise related complaints.
Even at this early date the report recognised that “there is ample evidence
that aircraft noise causes much annoyance. Government Departments,
Members of Parliament, local authorities and airfield authorities receive
numerous complaints”. Since the issue of aircraft noise was in its infancy,
Section 2 – Literature Review and Research 8
Page 9
Methods of Assessment of Aircraft Noise Nigel Burton
the committee held a number of its meetings at Heathrow Airport in order to
experience the problem first hand. The committee also requested that two
investigations be undertaken; first, “an experiment on the acceptability of
aircraft noise” and second, “a social survey in the vicinity of London
(Heathrow) Airport”. These are discussed later in this section.
In order to understand the situation in the civil aviation industry at the time,
the committee focussed its attention on Heathrow Airport as this was seen to
be “the busiest international airport in Great Britain and provides one of the
most difficult aircraft noise problems in the world”. The committee reported
that studies regarding the airport had discovered that most complaints related
to take off and landing noise, that complaints were greatest near the airport
and close to take off and landing routes and that, per 100 movements, heavy
jet-engined aircraft produced the most complaints. Whilst most complaints
were from individuals, public figures and bodies such as Members of
Parliament and Local Authorities also voiced their concerns. Despite the
obvious problem of aircraft noise, it was noted that there was still a high
demand for housing in the areas close to the airport. This was principally
attributed to the opportunities of employment at the airport. As well as
affecting people in their homes, the report recognised that aircraft noise could
impinge on the communications of those working or studying in the area and
could have detrimental affects on patients and staff in hospitals. The Ministry
of Health recognised the problems in hospitals and ordered that new
buildings in badly affected areas would be designed to reduce the noise
experienced internally with the use of upgraded glazing and mechanical
ventilation, etc. One of Her Majesty’s Inspectors of Schools noted that on a
visit to a school in the Heathrow area a half hour assembly was interrupted
by aircraft noise a total of ten times on the first day of their visit and that on
the second day was abandoned. It is reported that experiments were being
undertaken to improve the sound insulation and that new schools in areas
where aircraft noise may “seriously affect school activities” should be located
in quiet areas and arranged and built to provide reasonable protection
against noise.
Section 2 – Literature Review and Research 9
Page 10
Methods of Assessment of Aircraft Noise Nigel Burton
In relation to the legal position of those affected by aircraft noise, it is
reported that “Sections 40 and 41 of the Civil Aviation Act, 1949, broadly
prohibit actions for nuisance arising from civil aircraft in flight or on
aerodromes”. Due to the restriction on legal action the Minister for Aviation
at the time considered “himself under an obligation to take steps to minimise
the nuisance” caused by aircraft noise.
A number of methods of reducing the noise problem are discussed including
the reduction of noise at source, take-off, landing and ground running
procedures as well as methods of monitoring the noise. Increasing work in
research and development was being carried out to address the problem of
aircraft noise. It was reported that most jet aircraft that used Heathrow were
fitted with suppressors which whilst reducing the noise level increased
running costs “since they reduce take off thrust, and increase fuel
consumption, drag and weight”. At the time, most new jets that were coming
into service employed bypass or ducted fan jet engines. These were found
to be 10-12 dB quieter than the conventional jet engines but that little
additional attenuation could be achieved with the use of suppressors in these
cases. Continuing work into reducing the whine of compressors, the principal
cause of annoyance when aircraft came into land, was also carried out.
The committee reported that the maximum permissible take off noise levels
of jet-engined aircraft should be no higher than for larger piston-engined
aircraft. This statement proved problematic since piston-engined aircraft
varied in noise level and it was felt to be unfair to use the noisiest of these
aircraft as a benchmark. It was also recognised that the characteristic noise
produced by jet-engined aircraft should be taken into account. These
problems were examined by the Port of New York Authority and research
“based upon human judgements of a number of piston-engined and jet-
engined aircraft” culminated in the creation of a new noise metric, the
Perceived Noise Level which was rated in PNdB. The Port of New York
Authority adopted a limit of 112 PNdB (roughly comparable with 98 dBA), a
figure which was exceeded by 25 per cent of larger piston engined aircraft
still in operation. Heathrow adopted a slightly lower figure of 110 PNdB
Section 2 – Literature Review and Research 10
Page 11
Methods of Assessment of Aircraft Noise Nigel Burton
(equivalent to about 96 dBA). Following the implementation of the limit,
aircraft operators were not permitted to introduce scheduled services at
Heathrow without indicating that they could ensure that their aircraft would
not exceed the limit at predefined “first built-up areas” after take off. Initially
no scheduled operations were permitted during the night-time period, taken
as 23:00-07:00 hr, but delayed aircraft would be permitted to take off only if
they proved “high compliance” with the 110 PNdB limit. Any aircraft wishing
to depart after midnight would need to prove a much lower limit, generally
102 PNdB (around 88 dBA). However, from 1 April 1960 a number of
scheduled services were permitted to operate during the night-time period
providing that compliance with the 102 PNdB limit was proven. The
Committee reported that airlines could achieve the new limits in a number of
ways, most choosing to use full power to achieve a steep climb before
reducing power before reaching the “first main built-up area”. To achieve
this, many operators found that they needed to reduce their take off load,
often requiring them to carry less fuel and therefore requiring an additional
refuelling stop elsewhere.
The Committee’s report details the methods adopted by Heathrow Airport to
monitor the noise produced by its aircraft operations. Manual monitoring at
an area immediately before first main built-up area captured around 90% of
all take offs by jet-engined aircraft whilst a proposed automatic system was
capable of recording 100% of take offs. The results of the monitoring were
analysed and explanations sought for “serious or persistent non-compliance”
with the adopted limits. Instead of banning operators or pilots, the Airport
promoted cooperation with offenders to conform to the limits in future. This
methodology clearly worked with only 2% of all measured jet aircraft
exceeding the limits between January and August 1962. This result was
seen as commendable due to the high level of skill required by pilots in order
to conform to the limits. In August 1961, the Airport adopted a number of
new take off routes in an attempt to avoid densely populated areas. The
Committee noted that these efforts would not assist those living close to the
Airport or before the first main built-up areas, and that the limits did not apply
Section 2 – Literature Review and Research 11
Page 12
Methods of Assessment of Aircraft Noise Nigel Burton
to propeller-engined aircraft many of which made more noise than
jet-engined aircraft.
As methods to improve the noise performance of departing aircraft were
implemented, the Airport received increasing numbers of complaints relating
to jet-engined aircraft on approach. Improvements in this area were seen as
complex since requiring aircraft to approach at a steeper angle could
jeopardise safety. It was noted that the 3° minimum approach angle was
rarely breeched.
An important issue that was addressed was the fact that aircraft in flight did
not pose the only noise problem at and around airports. It was reported that
Heathrow was a major maintenance base where essential ground running
operations, coupled with their consequential noise, were required to take
place. A number of methods of reducing this ground running noise were
discussed including keeping ground running to a minimum (particularly during
the night-time period), the construction of noise screens and earth bunds and
the use of mufflers to attenuate the noise of jet engines. It was noted that at
Heathrow Airport most of these methods had been implemented by the
Airport at significant cost but that only a small number of complaints were
then received relating to ground running, some of which were understood to
relate to aircraft taxiing. In order to achieve further reductions in complaints it
was suggested that aircraft could be towed around the apron instead of
taxiing under their own power. This suggestion was rejected since it was felt
that the reduction in noise “would not counterbalance” the problems caused
to the Airport and the operators by such procedures. A valuable point raised
was that jet-engined aircraft did not require running up in order to reach
operating temperature before take off, where as piston-engined aircraft did.
The Committee asked the Ministry of Aviation to poll the opinions of other
international airports on the issues of noise. The findings were that most
considered noise as a “grave problem” and that the majority of complaints
related to jet-engined aircraft, particularly on take off, and that night flights
Section 2 – Literature Review and Research 12
Page 13
Methods of Assessment of Aircraft Noise Nigel Burton
produced a “proportionately greater amount of disturbance than day flights”.
A variety of different methods were employed by other airports to alleviate
the problems of noise, all of which were already in use at Heathrow. The
Committee reported that “it proved impossible to make detailed comparisons
between the problems at Heathrow and other airports” due to the differences
in circumstances at each airport. It was noted that, although aircraft noise
was unpopular, if too strict a line were imposed upon operators at Heathrow
such that their profitability dropped significantly, they might move their
operations to other European airports. The Committee remarked that “a
substantial reduction in air services to Heathrow, which serves London and,
indeed, the whole country, would have a grave deleterious effect on the
country’s economy”.
The Committee goes on to discuss the problems with noise that could occur
in the future. It recognised that the medium and long range jet-engined
aircraft that operated at the time from Heathrow accounted for a minority of
aircraft movements but that with the advent of smaller, short range jet
engined aircraft to replace short range propeller engined aircraft would see a
substantial increase in jet-engined aircraft movements. It was forecast that
the average of 60 jet-engined aircraft movements per day in 1960 would
increase to 260 per day by 1965 and 440 per day by 1970. These increases
were likely to lead to increases in annoyance and disturbance around
Heathrow Airport but that similar problems were likely to occur at other
airports such as Ringway (Manchester) and Prestwick in Scotland. With
regard to night-time operations in the future it was reported that pressure
from airlines to allow jet-engined aircraft operations at night in order to
maximise aircraft usage, thus increasing profitability as well as easing
congestion at Heathrow during the daytime, was influencing decisions on
Airport policy. Due to factors such as safety, improvements in landing noise
would necessitate reductions in the noise produced by the aircraft and their
engines. As described earlier in the report, through engine development
noise reductions of the order of 10-12 dB were being achieved. However,
the Committee warned that if operators decided to use extra power whilst
remaining within airport limits, the net reduction experienced on the ground
Section 2 – Literature Review and Research 13
Page 14
Methods of Assessment of Aircraft Noise Nigel Burton
may be minimal. In addition it was noted that it might take several years for
these new breed of quieter aircraft to completely replace the older, noisier
aircraft so the benefits may take some time to come into fruition.
In order to allow them to gain a greater insight into the problems associated
with aircraft noise, the Committee asked for two investigations to be carried
out. The first was to establish the acceptability of aircraft noise by a “jury”
and the second was a survey of the population in the locality of Heathrow
Airport. Initially an additional experiment to investigate the health effects of
noise on local residents was also requested. Upon advice from both the
Medical Research Council and local doctors that it would be difficult to
produce meaningful results and that no significant effects had been
observed, the request for this investigation was withdrawn.
The “experiment on the level of noise which is acceptable” was carried out by
the National Physical Laboratory at Farnborough in 1961. The Committee’s
report states that “60 people were asked, under different conditions on each
of three days, to make subjective judgements of noises of a number of
different types of aircraft, including jet and propeller-driven machines and
helicopters”. The main conclusions that were drawn were that judgement of
noisiness related to previous experience of the responder to the source and
that a scale of “intrusiveness” could be formed.
The objectives of the social survey around Heathrow Airport were:
• “to ascertain the effects of the noise on the activities of people living
within a 10 mile radius of the airport”
• to assess “the amount of disturbance and annoyance caused to these
people”
• to discover “whether they considered that any advantage accrued to
them from the presence of the airport”
• and “to provide information from which an assessment could be made
of the tolerability of the noise to people living in the area”.
Section 2 – Literature Review and Research 14
Page 15
Methods of Assessment of Aircraft Noise Nigel Burton
Noise measurements were also carried out in the areas inhabited by the
respondents in order to draw comparisons with the survey results. Several
conclusions were drawn from the results of this experiment. It was found that
there was good correlation between historical complaints and the “degree of
annoyance” recorded by the survey. Large variations in responses to aircraft
noise meant that significant changes would be required in the level and/or
character in order to provoke a significant change in response. Importantly it
was discovered that there was a link between annoyance and increases in
either noise level or aircraft or the number of aircraft movements. This
conclusion led to the creation of the Noise and Number Index, the underlying
principle of which was that annoyance could be kept constant if aircraft noise
levels increased so long as the number of movements decreased, and vice
versa.
In addition to these experiments, the Building Research Station, now known
as the Building Research Establishment, carried out an investigation into the
possibilities of improving sound insulation of houses. The results of the
investigation were that the introduction of double windows and suitably
attenuated mechanical ventilation to conventionally single glazed properties
could produce an improvement in the reduction of aircraft noise from 20 to
40 dB.
The Committee reported that between 20,000 and 40,000 people in the area
around Heathrow were subjected to more noise than they could reasonably
be expected to tolerate and that the problem would not get better, and could
get significantly worse, unless action was taken. Two methods to improve or
at least maintain the current situation were suggested; the reduction of noise
produced by aircraft types or the provision of improved sound insulation to
local homes. The consequences of each of these suggestions was
discussed in some detail and, with regard to the latter, considerations on
grant qualification, sources of finance for improvement works and
implications for new dwelling were presented.
Section 2 – Literature Review and Research 15
Page 16
Methods of Assessment of Aircraft Noise Nigel Burton
On reflection of the obvious problems that already existed at Heathrow, the
Committee recommended that lessons learnt at this airport should be used at
other airports. It was noted that since there were no sparsely populated
areas in the UK, serious consideration would be required for the location of
new airports or the expansion of existing sites.
2.1.2. Second Survey of Aircraft Noise Annoyance Around London
(Heathrow) Airport
In 1967, the Board of Trade commissioned a “Second Survey of Aircraft
Noise Annoyance Around London (Heathrow) Airport”2. The brief for this
follow-up work was “to re-examine and to extend the findings of the 1961
survey in order to provide information which would help ministers to make
decisions regarding noise control around airports”. The report of the new
survey noted that, in general, middle class people were more annoyed by
aircraft noise than those of working class and that middle aged and elderly
people were more annoyed than younger people. It was concluded that the
results of the new survey indicated “no increase in annoyance due to aircraft
noise”. Two explanations were presented for this result; 1) that people had
become more familiar with aircraft operations and their resulting noise and 2)
that although there had been a significant increase in the number of aircraft
operations taking place, there had only been a slight increase in aircraft
loudness. The latter was consolidated by a finding that whilst the degree of
annoyance in relation to loudness had stayed the same as that recorded in
1961, there was a marked drop in the level of annoyance in relation to the
number of aircraft. From this finding it was reported that “This throws
considerable doubt on the trade off, in annoyance terms, between noise and
number as inferred from the ‘Noise & Number Index’”.
Similar analysis to that carried out in 1961 was undertaken with the results of
the new survey and similar results were found. More respondents said that
they had become used to the noise of aircraft than said they had become
more sensitive despite the fact that noise levels had increased. The survey
also found that people who had lived in the area and experienced the
Section 2 – Literature Review and Research 16
Page 17
Methods of Assessment of Aircraft Noise Nigel Burton
increase in noise level were more critical than people who had recently
moved into the area.
2.1.3. The Noise and Number Index System
As discussed earlier, the Noise and Number Index metric was developed as
a result of the survey work carried out for the Wilson Committee into the
community reaction to Aircraft Noise. It is calculated using 3: Equation 2.1.1
Equation 2.1.1
80Nlog15LNNI 10PNmax −+=
where
LPnmax = Logarithmic average of the highest levels of all
overflights
N = number of aircraft flights
The subtraction of 80 within the formula relates to the findings of the social
survey carried out for the Committee which indicated that the annoyance
factor was zero at 80 PNdB.
NNI contour values of 35, 45 and 55 represented low, moderate and high
community annoyance respectively. It is understood that NNI was assessed
with regards to operations between mid June and mid October during the
hours of 06:00 and 18:00 hrs only.
2.1.4. Changes to the Daytime Index for Aircraft Noise
Little changed with regards to the assessment of aircraft noise in the United
Kingdom until the early 1980s when the Noise and Number Index was
coming under increasing criticism. The criticisms included the fact that NNI
was out of date, was not easily comparable with other national systems, was
only valid for Heathrow for which it was formulated and as such was
Section 2 – Literature Review and Research 17
Page 18
Methods of Assessment of Aircraft Noise Nigel Burton
unsuitable for new airports, that it ignored any events under 80 PNdB, and
that it made no allowance for the duration of individual events. As a result of
these and other criticisms, the Department of Transport commissioned the
Civil Aviation Authority’s (CAA) Directorate of Research and Analysis
(DORA) to “Substantiate the NNI or, if necessary, to devise some better
index for Aircraft Noise”. As such, DORA carried out the “United Kingdom
Aircraft Noise Index Study (ANIS)” and published their results in January
19854. As with the earlier Wilson study, the ANIS carried out both noise
measurements and a social survey; although in contrast to the work in the
1960s, the ANIS examined the effects at a total of five airports (Heathrow,
Gatwick, Luton, Manchester and Aberdeen) instead of the effects at
Heathrow Airport alone. “Common Noise Exposure Areas” commonly of
around 1 square km were chosen with noise measurements being carried out
at a central site within the area and approximately “80 randomly chosen
residents” being surveyed using a questionnaire based on those originally
devised in the 1960s. A total of 26 such areas were examined with a total of
2097 questionnaire responses. The main findings of the ANIS were as
follows:
• The Study was successful in “disentangling the effects of aircraft noise
level and number”
• The “Guttman Annoyance Scale” was found to be a good measure of
disturbance and agreed “well with other scales used in the questionnaire”.
• The “Trade-Off” factor of 15 used in the NNI expression was found to
place too much weight on the number of aircraft. It was suggested that “a
value of 9 or 10” would be better.
• It was concluded that noise events below the 80 PNdB “cut-off” should be
included as should evening and night-time movements, although without
weighting as used in other countries.
• 24 hour LAeq was found to provide a good fit to disturbance responses.
• The issue of people having a professional involvement with an airport (i.e.
“people who work at or who have business with the airport”) was
estimated to lower the percentage of response of aircraft noise being “not
acceptable” by 25%.
Section 2 – Literature Review and Research 18
Page 19
Methods of Assessment of Aircraft Noise Nigel Burton
• There were found to be no significant “airport dependent” responses
based on the results from the five airports under examination.
• Whilst the historical use of NNI was unlikely to have “led to major
distortions in the environmental picture” its continued use would lead to
problems, for example with increasing numbers of modern aircraft being
ignored due to their noise level being below the 80 PN dB “cut-off”.
• It was suggested that 55 and 70 dB LAeq,24hr could be used to represent
the “onset of community annoyance” and the “point of high disturbance”
respectively.
The proposed change from NNI to LAeq,24hr was then put out to public
consultation, the results of which indicated that whilst the majority (80%) of
the respondents agreed with the use of an Leq based system, many felt the
24 hour averaging time suggested by DORA was inappropriate for the
assessment of daytime noise. Following the completion of the consultation
process, in September 1990, the Department of Transport announced that
they were to replace the Noise and Number Index (NNI) method adopted in
the mid-sixties with Leq,16hr5. Whilst NNI contours had been produced for
major airports for some years, in the future these would be replaced by
LAeq,16hr contours. In order to promote greater understanding of the new
system, both NNI and LAeq,16hr contours were produced in tandem for two
years worth of data. It was found that contour levels for each system
corresponded as shown in Table 2.1.1 below:
LAeq,16hr (dB) NNI (PNdB)
57 35
60 40
63 45
66 50
69 55
72 60
Table 2.1.1: LAeq,16hr and NNI Comparison
Section 2 – Literature Review and Research 19
Page 20
Methods of Assessment of Aircraft Noise Nigel Burton
Also in September 1990, the DORA produced a report entitled “The Use of
Leq as an Aircraft Noise Index”6. This report included an analysis of the
issues raised in the ANIS consultation as well as detailing how the new Leq
index would be implemented.
2.1.5. Planning Policy Guidance Note 24: Planning and Noise
In September 1994, the then Department of Environment published PPG 24,
a Planning Policy Guidance Note related to Planning and Noise7. The note
states the following:
“Planning policy guidance notes set out the Government’s policies on
different aspects of planning. Local authorities must take their content into
account in preparing their development plans. They may be material to
decisions on individual planning applications and appeals.”
PPG 24 introduced the concept of Noise Exposure Categories (NEC’s)
ranging from A-D to help local authorities in their consideration of
applications for residential development near to transport and industrial
related noise sources. The different categories are as defined in Table 2.1.2
below.
Section 2 – Literature Review and Research 20
Page 21
Methods of Assessment of Aircraft Noise Nigel Burton
NEC
A Noise need not be considered as a determining factor in granting
planning permission, although the noise level at the high end of the
category should not be regarded as desirable
B Noise should be taken into account when determining planning
applications and, where appropriate, conditions imposed to ensure an
adequate level of protection against noise.
C Planning permission should not normally be granted. Where it is
considered that permission should be given, for example because there
are not alternative quieter sites available, conditions should be imposed
to ensure a commensurate level of protection against noise.
D Planning permission should normally be refused.
Table 2.1.2: Definitions of PPG 24 Noise Exposure Categories
PPG 24 provides recommended noise exposure categories for new dwellings
near existing noise sources. The noise levels with regards to aircraft noise
are reproduced in Table 2.1.3 below.
NOISE LEVELS CORRESPONDING TO THE NOISE EXPOSURE
CATEGORIES FOR NEW DWELLINGS LAeq,T dB
NOISE EXPOSURE CATEGORY
Noise Source A B C D
Air Traffic
07.00 – 23.00
23.00 – 07.00
<57
<48
57-66
48-57
66-72
57-66
>72
>66
Table 2.1.3: PPG 24 Recommended NECs w.r.t. Air Traffic
Additional guidance is also provided with regards to night-time noise events
as follows:
“Night-time noise levels (23.00-07.00): sites where individual noise events
regularly exceed 82 dB LAmax (S time weighting) several times in any hour
Section 2 – Literature Review and Research 21
Page 22
Methods of Assessment of Aircraft Noise Nigel Burton
should be treated as being in NEC C, regardless of the LAeq,8h (except where
the LAeq,8h already puts the site in NEC D).”
2.1.6. White Paper – The Future of Air Transport
In December 2003, the Department of Transport published a white paper
entitled “The Future of Air Transport”8. The white paper states the
Government’s position with regards to “the development of airport capacity in
the United Kingdom over the next 30 years”. Prior to the publication of the
white paper, seven regional consultation documents were published from
which 500,000 responses were received. Just as air travel from and within
the UK has increased to 500% of what it was 30 years ago, it is widely
accepted that air travel is likely to increase in the future. Although aircraft
today are significantly quieter than the early jets in the 1960’s, the predicted
future growth in air traffic could easily exceed the noise reduction techniques
introduced thus leading to an increase in noise levels. Whilst the
Government encourages the obvious economic benefits such as employment
and exportation that air travel brings, it recognises that these should be
balanced with the consequential environmental impacts that result. With
regards to noise, the Government have set out an aim “to limit and, where
possible, reduce the number of people significantly affected by aircraft noise”.
One of the practical suggestions offered to assist in achieving this aim is to
place “limits on the size of the area around major airports affected by
significant noise level”.
The Government also intends implementing EU Directive 2002/49/EC. This
directive “requires periodic noise mapping at many airports from 2007 to
identify day and night noise problems and, from 2008, action plans to deal
with them”. This directive is discussed in more detail in Section 2.4.2.
As well as the noise section, the white paper also contains a section on
“Noise mitigation and compensation”. Within this section, the Government
sets out its three tiered approach to noise impacts;
Section 2 – Literature Review and Research 22
Page 23
Methods of Assessment of Aircraft Noise Nigel Burton
1. to control the scale of impacts
2. to mitigate remaining impacts
3. to compensate for those impacts which cannot be mitigated
It is suggested that a percentage of the “large economic benefits provided by
airport development” should go towards the mitigation of the development’s
impact in the local area. Whilst voluntary schemes, such as acoustic
insulation grant schemes, are encouraged the Government has drawn up a
“benchmark for mitigating aircraft noise” which should be adopted by the
larger UK airports (defined as those operating in excess of 50,000
movements a year).
With “immediate effect”, the Government expects such airports to offer
households exposed to high aircraft noise levels (defined as “69 dBA Leq or
more”) financial assistance with regards to relocation. It also expects the
offer of acoustic insulation in areas of medium to high aircraft noise levels
(defined as “63 dBA Leq or more”) not only to residential properties but also to
other noise sensitive buildings, for example schools and hospitals. In order
to determine where such measures will be required, airports where noise
contouring programmes are not currently used are encouraged to do so in an
effort to verify the “current noise levels”. In instances where acoustic
insulation “cannot provide an appropriate or cost-effective solution”, airports
are expected to provide alternative assistance. Examples of such
alternatives include provision of quiet rooms for reading or music,
environmental grants and funding for school trips away from the noisy
environment.
The document also states what is expected of these larger airports following
future airport growth. In areas exposed to in excess of 69 dBA Leq which
have also been subject a “large increase in noise” (defined as 3 dBA Leq or
more), airports should offer to purchase properties. Acoustic insulation
should be offered in areas exposed to 63 dBA Leq or above which have also
suffered a large increase in noise, as defined above.
Section 2 – Literature Review and Research 23
Page 24
Methods of Assessment of Aircraft Noise Nigel Burton
The white paper indicates the use of 2002 noise contours as the base year
for the assessment of impact of future growth at these larger airports and that
further contours should be produced at a minimum of five yearly intervals.
Airports which are not currently considered “large” should use the year when
the first operate in excess of 50,000 movements as their base year, with
further contours being produced at a minimum of five yearly intervals.
2.1.7. Brief History of the Development of Heathrow Airport
Various sources present similar accounts of the origins of Heathrow
Airport9,10,11,12,13. It is reported that the airport was originally known as the
Great Western Aerodrome and was owned by the Fairey Company. The
aerodrome was mainly used for test flights with the vast majority of
commercial flights operating from the nearby Heston and Hanworth Airfields.
It is reported that the aerodrome was requisitioned by the Air Ministry for use
by the RAF in 1944 but that no military activities ever took place before it was
transferred to the Ministry of Civil Aviation on 1 January 1946. Heathrow
Airport was formally opened on 31 May 1946 with an army surplus tent
operating as a terminal, a short distance from the single runway. By 1947,
three runways were complete but it was not until some eight years later that
the first terminal building, now known as Terminal 2, was finished. This was
followed by the construction of “Oceanic” terminal (Now Terminal 3) and
Terminal 1, opened in 1968. The popularity of the Airport led to the opening
of a further terminal, Terminal 4, in 1986.
The modern day Heathrow Airport is a far cry from its modest beginnings. In
1946, the new airport operated a mere 9,000 flights to just 18 destinations.
In the year 2000-2001, Heathrow operated 450,000 flights, 50 times more
than in 1946, to 170 destinations with services being provided by 90 airlines
to 64,000,000 passengers.
Amidst much controversy and fervent objection on 20 November 2001, after
a public enquiry lasting 3 years 10 months, the government granted
permission for the construction of a fifth terminal at Heathrow Airport.
Section 2 – Literature Review and Research 24
Page 25
Methods of Assessment of Aircraft Noise Nigel Burton
Terminal 5 has been designed to cope with a further 30,000,000 passengers
using the Airport each year.
2.2. Aircraft Noise in the United States of America and Canada
2.2.1. The United States of America
Due to the state government system operated within the United States of
America there are a number of different noise assessment systems and
criteria that have been adopted across the country. This said, the body
ultimately responsible for the control and management of aircraft and airports
throughout the USA is the Federal Aviation Administration (FAA). Part 150 of
the Federation Aviation Regulations (FAR) “Airport Noise Compatibility
Planning” sets out standards by which airports must report the noise
exposure produced by their operations and methods by which to “minimise
noise-related land use incompatibilities”14. Research by this Author indicates
that there are two major noise metrics accepted under the current
regulations; the Day-Night Average Sound Level and the Community Noise
Equivalent Level.
The Day-Night Average Sound Level (DNL), often referred to as LDN, is, in
essence, the average noise level for a 24 hour period with the events
occurring during the night-time period of 22:00 to 07:00 hrs being given an
increased weighting. The imposed night-time weighting is justified by the
“added intrusiveness of night-time noise events attributable to the fact that
community background noise levels typically decrease at night”14. The
majority of federal agencies dealing with noise have formally adopted DNL as
a metric for assessing noise exposure with the Federal Interagency
Committee on Noise (FICON) stating in 1992 that “There are no new
descriptors or metrics of sufficient scientific standing to substitute for the
present DNL cumulative noise exposure metric”15. Although DNL can be
measured the procedure is time consuming. As such, the majority of airport
noise studies rely heavily on computer modelled DNL contours. Part 150
requires that the DNL contour values of 65, 70 and 75 dB be produced.
Section 2 – Literature Review and Research 25
Page 26
Methods of Assessment of Aircraft Noise Nigel Burton
The Community Noise Equivalent Level (CNEL), often referred to as LDEN,
follows a similar rationale to the DNL but also includes an increased
weighting for events occurring during the evening period of 19:00 to 22:00 hr.
The CNEL was developed in the State of California and has been adopted,
with the consent of the FAA, as the standard for the assessment of
cumulative noise exposure within the region. The contour levels to be
produced for CNEL are understood to be similar to those required by the
DNL since the two metrics are considered to be interchangeable.
Results from 18 surveys carried out worldwide indicated that DNL/CNEL
levels as low as 55 related to around 5 percent of people becoming highly
annoyed16. It was noted that the percentage of highly annoyed people rose
sharply above around DNL/CNEL 65.
It is understood that other metrics such as the Noise Exposure Forecast
system and the Composite Noise Rating system have also been used for the
assessment of aircraft noise within the United States but that their use is now
generally redundant.
2.2.2. Canada
In order to obtain information relating to the assessment of aircraft noise in
Canada, this Author contacted Mr Tom Lowrey of Transport Canada17.
According to Mr Lowrey the Noise Exposure Forecast (NEF) system has
been used in Canada since the early 1970s. The relevant publication in this
case is TP 1247E – Land Use in the Vicinity of Airports, Part IV of which is
entitled “Aircraft Noise”18. The NEF system, originally developed in the
United States of America, is based on the Effective Perceived Noise Level
metric (EPNL). This metric, along with its corresponding criteria as adopted
in Canada, is described in more detail in Section 2.6.1.
Section 2 – Literature Review and Research 26
Page 27
Methods of Assessment of Aircraft Noise Nigel Burton
Mr Lowrey also explained that Transport Canada operate their own aircraft
noise modelling software which, under review, “compared favourably, within
approximately 5% or better, with major systems in use throughout the world”.
2.3. Aircraft Noise in Australia
Since 1982, the Australian government has used the Australian Noise
Exposure Forecast (ANEF) system as their metric of choice for the
assessment of aircraft noise. The ANEF system, which is based on the
Noise Exposure Forecast (NEF) system developed in the United States of
America in the late 1960’s, was developed following an investigation of the
impact of aircraft noise on residential communities in Australia carried out by
the National Acoustic Laboratories (NAL) in 197919. The ANEF system is
discussed in more detail in Section 2.6.2.
In 1994, Sydney Kingsford-Smith Airport opened its third runway. Following
the opening, residents in areas predicted not to be affected during the
planning stage found themselves being disturbed by aircraft noise. Due to
the great magnitude of publicity that surrounded the case a Senate Select
Committee was formed to examine the issue of aircraft noise in Sydney. In
relation to the Third Runway project, the Select Committee’s report criticised
the way in which the future aircraft noise had been depicted in the
Environmental Impact Statement (EIS)20. Whilst the EIS had used the
conventional tool of the time for the region, the Australian Noise Exposure
Forecast (ANEF), many people felt that they had not been provided with a
fair representation of what, how, and to what extent, the aircraft noise was to
affect them.
As a result of the Committee’s findings, the Australian Department of
Transport and Regional Services undertook an investigation of different
methods of aircraft noise assessment. In March 2000, the Department
published a discussion paper entitled “Expanding Ways to Describe and
Assess Aircraft Noise”21. The document was produced to “promote debate
on the development and use of more transparent approaches to describing
Section 2 – Literature Review and Research 27
Page 28
Methods of Assessment of Aircraft Noise Nigel Burton
and assessing aircraft noise around Australian airports”. The paper makes
the suggestion that in order to allow aircraft noise to be better understood by
the layperson, it should be described in terminology that relates to the most
common questions asked by the layperson in connection with aircraft noise.
It suggested that members of the public were often interested in answers to
the following questions:
• “Where will the flight paths be?”
• “How many aircraft will use the flight paths?”
• “At what time will I get the noise – during the day, early morning,
evenings or weekends?”
• “What will it be like on the ‘bad’ days?
• “Will I get more noise in the summer?”
• “Will the largest and noisiest aircraft fly over my area?”
• “Will I get take-offs or landings over my houses?”
• “When will I get a break from the noise?”
Whilst the questions may be simple, the conventional use of providing ANEF
contours on their own does not give explicit answers to any of them. The
paper was careful not to reject or dismiss the use of ANEF system but
instead proposed that supplementing its use with other metrics should
improve understanding of the impacts surrounding the introduction of or
proposed changes to aircraft operations.
Four main methods of presenting the level of aircraft noise are described.
These are as follows:
1. Flight Paths and Movement Numbers
2. Respite
3. The N70
4. The Person-Events Index and The Average Individual Exposure
Section 2 – Literature Review and Research 28
Page 29
Methods of Assessment of Aircraft Noise Nigel Burton
Flight Paths and Movement Numbers
When looking at buying homes near airports people often examine flight path
data in order to assist them with their task. It is assumed that if a property is
under a flight path it will be noisy, and if not it will be quiet. Whilst this is an
oversimplification of the situation the basic principle is correct. The level of
air traffic utilising the different flight paths is also a major factor that will affect
the level of noise received on the ground. To answer questions such as
“where do the aircraft fly” and “how many overflights are there”, the use of
flight path movement charts has been developed.
Unlike traditional flight path plans which show individual thin lines for each
path, those shown on the new charts get wider as they get further away from
the airport. This displays the natural dispersion of aircraft in flight and
dispelling the myth of aircraft flying along “railway tracks in the sky”. In
addition, the charts include: data for each path on the average number of
daily movements; the number of jet aircraft utilising the route as a percentage
of the total number of jet aircraft movements; the daily range (i.e. min and
max) of aircraft movements along the route; and the percentage of days with
no movements.
The discussion paper states that these types of charts have been used at
Sydney Airport since 1998 and have been well received. However,
limitations of this method have been identified. These include the fact that
there is no dissemination between small and large aircraft (all are taken to be
similar) and that the wider paths, showing more dispersion, are often wrongly
interpreted as noisier in comparison with narrower paths where flights are
concentrated over a smaller area.
Respite
A significant problem with the use of the LAeq metric or similar system is that
they assume that annoyance levels will remain the same if the number of
aircraft operations are doubled so long as the individual aircraft noise levels
Section 2 – Literature Review and Research 29
Page 30
Methods of Assessment of Aircraft Noise Nigel Burton
are reduced by 3 dB. Whilst a reduction of 3 dB for an individual aircraft
event may only just be noticeable, a doubling of movements is likely to have
a far greater effect.
With this in mind, and as the number of aircraft movements increases, as
they have in recent years and are predicted to in the future, the layperson is
interested to know when they will have a break from the noise, hence the
idea of specifying respite. In Australia, “extensive debate” took place over
the most effective way to define respite. Examination was made of the
threshold noise level and the time period over which no aircraft events occur.
Due to difficulties with definitions and computation the use of a specific
threshold noise level was not feasible. Instead, flight path usage was utilised
for the purposes of respite description. This still left the issue of what time
period should be used. The approach adopted by Sydney Kingsford-Smith
Airport for their monthly monitoring report was to calculate the number of
whole clock hours when no movements occurred on a given flight path. This
figure is then presented as a percentage of the total number of clock hours in
the period under examination. The example offered is that “if there were no
movements on a particular flight path during 50 clock hours in a 100 hour
clock period then it would be reported as ‘Respite Hours 50%’”. A clock hour
is, for example, between 07:00 and 08:00 or 10:00 and 11:00, etc.
The respite hours are calculated for the following four periods:
a) Morning Respite: 06:00-07:00 hrs (Weekdays)
b) Evening Respite: 20:00-23:00 hrs (Weekdays)
c) Weekend Respite: 06:00-23:00 hrs (Saturday or Sunday)
d) Daytime Respite: 07:00-20:00 hrs (Weekdays)
Periods a), b) and c) have been identified as sensitive times. The night-time
period is not a prominent issue at Sydney Airport due to it’s strictly enforced
curfew hence the lack of information relating to 23:00-06:00 hrs.
Consideration has been given to producing a single figure for respite at a
particular location by weighting and then combining the results for the various
Section 2 – Literature Review and Research 30
Page 31
Methods of Assessment of Aircraft Noise Nigel Burton
time periods. To date, this has been avoided since, it is felt, it would reduce
the clarity of the information.
Respite charts have not been as well received as the flight path and
movement charts described earlier. One criticism of the technique and its
use in Sydney has been that certain areas may be close to more than one
flight path. This would mean that whilst no aircraft might be operating on the
nearest route to a particular location, it might still be affected by noise from
activity on other routes. This problem is likely to be particularly prevalent at
locations close to an airport. No obvious solution has been found for this
problem though it is noted that “for most parts of Sydney the charts give a
very good indication of the extent to which respite is being achieved”.
Another problem with the system in its current form is that the use of clock
hours can lead to an underestimation of respite. The example given is that “if
there were one movement at 12:05pm and one movement at 1:55pm no
respite would be recorded for that two hour period. This would be despite the
fact that for virtually all that period (110 minutes) there were no movements”.
Based on the predicted increase in aircraft movements in the future, the
issue of respite from aircraft is one that will not go away and therefore
requires further investigation and research.
The N70
Due to some of the apparent shortcomings of the ANEF system, discussions
took place in Sydney between the airport and the various local communities
to find the best way to provide an easily comprehensible method to describe
actual aircraft noise levels. After trialling the use of SEL footprints for
individual aircraft it was found that to provide such information for all aircraft
types, on all routes, and including information on the number of movements
was unworkable. Instead, ‘Number Above’ contours were proposed.
The N70 indicates the number of aircraft movements that exceed 70 dB(A)
SEL at a given location. Locations with similar numbers of aircraft
Section 2 – Literature Review and Research 31
Page 32
Methods of Assessment of Aircraft Noise Nigel Burton
movements that exceed 70 dB(A) SEL, i.e. locations with similar N70 results,
are joined together to provide the various N70 contours. The N70 is by no
means a new concept but has been around for over 20 years and was
examined in a study carried out by the National Acoustic Laboratory in
Australia in 198222.
The Australian Standard AS202123 specifies the single event level of 60
dB(A) as “the indoor design sound level for normal domestic areas in
dwellings” since this is the level at which “a noise event is likely to interfere
with conversation or with listening to the radio or the television”. Given that a
house with partially open windows provides around 10 dB(A) attenuation of
external noise sources leads us to the rationale behind the choice of 70
dB(A) SEL for as the noise threshold, and hence the N70.
The discussion paper states that the N70 contours can and have been
produced with the aid of the United States Federal Aviation Administration’s
Integrated Noise Model (INM). Since the INM package does not offer the
calculation of N70 contours as a standard output metric, additional
computation is required. The Department of Transport and Regional
Services in Australia has now produced software for the creation of N70 and
other noise contours. This software is discussed in more detail in a later
section.
In order to deal with ‘sensitive times’, as described earlier, it is seen
appropriate to produce N70 contours for these specific time periods. It is
important to understand that ‘number above’ contours for different noise
levels can also be produced. An example of their use is the N60 contour of
which a number were produced for the 22:00 to 06:00 hrs period in the
Environmental Impact Statement for the second Sydney airport. The level of
60 dB(A) SEL chosen in that case corresponds to “the sleep disturbance
level of 50 dB(A) specified in AS2021” again allowing for 10 dB attenuation
by the fabric of the building.
Section 2 – Literature Review and Research 32
Page 33
Methods of Assessment of Aircraft Noise Nigel Burton
The discussion paper reports various methods of producing combined N70
contours such as by applying different weightings to events, which take place
during sensitive times.
In practice, N70 contours have been produced to as low as “10 events per
day exceeding 70 dB(A) level”. It is noted, however, that whilst this covers a
significantly larger area than would be cover for a similar 20 ANEF contour,
contours produced at such a low level using the INM raise “significant
questions about the accuracy of the information”.
Due to its arithmetic nature, the N70 is easier for the layperson to understand
than other, logarithmic indicators. The example given is that “all other things
being equal, if the number of movements over an area doubles the N70
doubles”. The N70 can also be used to present the results of actual
measured noise data in addition to its use with computer model results,
which are often viewed with scepticism by the public.
One criticism of the use of N70 noted in the discussion paper is that it does
not differentiate between aircraft events of 70 dB(A) and those of higher
levels such as, for example, 90 dB(A). It is suggested that this could be
overcome by producing higher level ‘noise above’ contours e.g. N80, N90,
etc, but that this may lead to more confusion rather than improving clarity.
The Person-Events Index and The Average Individual Exposure
A useful way to assess the impact of aircraft noise is to determine the
number of people that will be affected by it. At many airports noise
preferential routing is used to divert aircraft away from greatly populated
areas. Whilst assessing the total number of people affected is important,
decisions sometimes have to be made as to whether it is worse for a small
number of people to be exposed to high noise levels or if it is worse for a
large number of people to be exposed to lower noise levels. This question
creates a problem for decision makers, many of whom will not be experts
Section 2 – Literature Review and Research 33
Page 34
Methods of Assessment of Aircraft Noise Nigel Burton
with regards to noise, since they may not understand the differences
between the two scenarios sufficiently to make considered judgements.
To assist non-experts with interpretation of this type of information, the
Department of Transport and Regional Services in Australia has devised the
Person-Events Index (PEI). The discussion paper states that “the index is
not intended to replace existing noise indicators but to supplement them”.
The PEI is calculated using below: Equation 2.3.1
Equation 2.3.1
( ) NPxPEI N∑=
“where x = The single event threshold noise level expressed in dB(A)
PN = The number on persons exposed to N events > x dB(A)
The PEI is summed over the range between Nmin (a defined cut-off level) and
Nmax (the highest number of noise events louder than x dB(A) persons are
exposed to during the period of interest)”.
An example given in the discussion paper is that if a single departure by one
aircraft exposes 20,000 people to a single event level of 70 dB(A) or greater,
the PEI(70) would be 20,000 for that event. If an additional departure took
place, similar to the first event, then the total PEI(70) for both events
combined would be 40,000. A more detailed example of the use of PEI is
presented in the discussion paper examining different operating scenarios at
Sydney Airport.
The information provided by the PEI is not comprehensive and requires
further computation to make it so. It is very well knowing that the PEI(70) is,
for example, 1,000,000, but this could mean that one person is exposed to a
million events of 70 dB(A) or more, or it could mean that a million people are
exposed to one event of 70 dB(A) or more, or any other situation between
Section 2 – Literature Review and Research 34
Page 35
Methods of Assessment of Aircraft Noise Nigel Burton
these two extremes. This requirement for further clarification has led to the
creation of average individual exposure (AIE) which is calculated using
below: Equation 2.3.2
Equation 2.3.2
Population Exposed TotalPEIAIE =
As with the PEI, the AIE is based on a defined minimum cut-off level of x
number of events per day.
Like the N70 described earlier, the PEI and AIE are both arithmetic and
therefore show “differences between scenarios much more starkly than
logarithmic indices which dampen any difference”.
The discussion paper notes that the PEI is useful “for computing partial noise
loads” and can produce meaningful results even one or a small number of
movements. It can also be used to compare results at different airports. It is
advised that the AIE should not generally be used for this purpose but that it
is useful “when comparing different operating scenarios at a particular
airport”.
2.4. Aircraft Noise in the European Union
Different countries in the European Union rate aircraft noise indices
differently, below are the methods currently adopted in a number of countries
or regions.
2.4.1. An Inventory of Current European Methodologies and Procedures for
Environmental Noise Management
In preparation for the European Commission’s Directive on the Assessment
and Management of Environmental Noise, and in particular the requirement
Section 2 – Literature Review and Research 35
Page 36
Methods of Assessment of Aircraft Noise Nigel Burton
for Noise Mapping, the European Environment Agency commissioned Ian H
Flindell and Andrew R McKenzie to produce “An Inventory of Current
European Methodologies and Procedures for Environmental Noise”24. Their
findings, which were published in June 2000 included methods of
assessment of aircraft noise in 17 member states. These methods,
excluding those adopted in the UK as discussed earlier, are summarised
below:
Austria
Daytime (06:00-22:00) LAeq,16hr Contours 60, 65 and 70 dB.
Night-time (22:00-06:00) LAeq,8hr Contours 50, 55 and 60 dB.
Noise Limits based on LDN (maximum of day and night values, with 10 dB
added to the night-time values).
Planning guidance as indicated in Table 2.4.1 below:
LDN/LAmax New Buildings Existing Buildings
>75/105
Agricultural, military and airport
buildings only. No new
residential zones.
>65/-
Residential buildings in existing
zone and commercial buildings to
have required sound insulation.
No new residential zones.
Residential and noise sensitive
buildings (schools, hospitals,
nursing homes) to have required
sound insulation.
>60/- Residential buildings in existing
zone. No new residential zones.
>55/-
Noise sensitive buildings only in
case of overriding need with
required sound insulation
Noise sensitive buildings
(schools, hospitals, nursing
homes) to have required sound
insulation.
Table 2.4.1: Austrian Planning Guidance relating to Aircraft Noise
It was noted that a revised version of the reference, due for editing in 2000,
would include Lden as a “specified indicator”.
Section 2 – Literature Review and Research 36
Page 37
Methods of Assessment of Aircraft Noise Nigel Burton
Belgium – Flanders
LDN with a 10 dB weighting for night-time period (22:00-07:00). “Zones are
established corresponding to LDN values of 55-60, 60-65, 65-70, 70-75 with
the percentages of highly annoyed people in each zone calculated from
%HA=0.0684*(LDN-42)”.
Belgium – Wallonie
Ldn - similar to LAeq with 10 dB night-time weighting (22:00-07:00). Noise
levels divided into planning zones:
“Zone A – Ldn>70
Reserved only for activities linked with the functioning of the airport. The
administration will propose to owners of dwellings in this zone to buy their
house. No new construction is admitted. No financial aid is given for
acoustic insulation.
Zone B – Ldn 65-70
In this zone, a financial aid will be proposed for the acoustic insulation of
existing dwellings. No new dwellings should be allowed in this zone.
Economic activities are admitted.
Zone C – Ldn 60-65
Financial aid will be proposed for acoustic insulation of existing dwellings.
New dwellings could be allowed, but in a very restricted way, with specific
acoustic conditions.
Zone D – Ldn 55-60
Financial aids will occur, but not for offices, sport centres and shops.
New dwellings construction will also be restricted.”
Belgium – Brussels
Levt – “Sound Exposure Level (SEL) for any individual aircraft event
LSp avion – “LAeq from all aircraft events, corrected for the effects of other
background noise sources”
Divided into zones as indicated in Table 2.4.2 below:
Section 2 – Literature Review and Research 37
Page 38
Methods of Assessment of Aircraft Noise Nigel Burton
Zones Levt LSp avion
Daytime
(07:00-23:00)
Night-time
(23:00-07:00)
Daytime
(07:00-23:00)
Night-time
(23:00-07:00)
0 80 70 55 45
1 90 80 60 50
2 100 90 65 55
Table 2.4.2: Brussels Planning Guidance relating to Aircraft Noise
Denmark
Lden – peak three months, 5 dB weighting for evening, 10 dB weighting for
night-time. The guideline planning limits are presented in below: Table 2.4.3
Table 2.4.3: Danish Planning Guidance relating to Aircraft Noise
Area Smaller Airfield Airport or Military Airfield
Summer Residential,
Camping 45 50
Hospital, School 45-50 55
Residential 45-50 55
Hotel, Office 60 60
Rural 50 60
LAmax night-time limit: 70 dB(A) and 80 dB(A) for smaller airfields and airports
and military airfields respectively. State subsidised sound insulation for
dwellings exposed to above 65 dB LAeq.
Finland
All sources treated similarly. LAeq,d Daytime (07:00-22:00) and LAeq,n Night-
time (22:00-07:00) guidelines are presented in as follows: Table 2.4.4
Section 2 – Literature Review and Research 38
Page 39
Methods of Assessment of Aircraft Noise Nigel Burton
Description LAeq,d LAeq,n
Residential Areas 55 50
Recreation Areas in Conglomerations and Areas in their
Proximity 55 50
Areas Serving Nursing or Educational Institutions 55 50
New Residential and Recreation Areas and Areas Serving
Nursing or Educational Institutions 55 45
Holiday Settlements (camping site etc). 45 40
Table 2.4.4: Finnish Planning Guidance relating to Aircraft Noise
France
Assessed using presented below: Equation 2.4.1
Equation 2.4.1
∑ −= 32)10log(10 1.0 iLip gI
where
Li = Noise from each operation in PNdBmax
gi = 1 for operations 06:00-22:00 and 10 for operations 22:00-06:00
Zones, and their respective maximum permitted levels are presented in
below:
Table
2.4.5
Section 2 – Literature Review and Research 39
Page 40
Methods of Assessment of Aircraft Noise Nigel Burton
Zone Ip Permitted Development
A >=96 Residences and buildings required for aeronautical activities
and public amenities vital for existing populations
B 89-96 Residences required for individual, commercial and
agricultural activities
C 84-89
Individual non-estate housing located in already developed
sectors, refurbishing operations for districts and existing
homes provided population of noise exposed population not
signification increased
D <84 Unrestricted
Table 2.4.5: French Planning Guidance Relating to Aircraft Noise
Germany
Assessed using a modified version of LAeq entitled LAeq(4) which is calculated
using Equation 2.4.2 below:
= ∑ 3.13
101log3.13)4(i
iiAeqLtg
TL
Equation 2.4.2
where:
Li = noise level in dB(A)Smax
T = 180*86400 seconds
ti = 10 dB down time
gi = 1 (for 06:00-22:00) or 5 (for 22:00-06:00)
Zones, and their maximum permitted levels as shown in Table 2.4.6 below:
Section 2 – Literature Review and Research 40
Page 41
Methods of Assessment of Aircraft Noise Nigel Burton
Zone LAeq(4) Permitted Development
1 >75 No new dwellings, support of insulation at existing dwellings.
No convalescent or retirement homes or schools.
2 67-75 New dwellings only with improved insulation. No
convalescent or retirement homes or schools.
3 <62 No restrictions in some federal states.
Table 2.4.6: German Planning Guidance relating to Aircraft Noise
Greece
Assessed “using Noise Exposure Forecast (NEF) based on EPNdB where,
for a particular class of aircraft i, on flight path j, producing EPNLij”. The
contribution to the NEF is calculated using Equation 2.4.3 below:
[ ] 887.16log10 10 −++= NijDijEPNiij nnLNEF
Equation 2.4.3
where:
nDij = the number of day time flights (0700-2200)
nNij = the number of night time flights (2200-0700).
The total NEF is then calculated using Equation 2.4.4 below:
= ∑∑ 10/
10 10log10 NEFij
i jNEF
Equation 2.4.4
It is reported that three zones are specified corresponding to NEF>40, NEF
30-40 and NEF <30, but that no information was provided as to what
restrictions, if any, are implemented within these zones.
Section 2 – Literature Review and Research 41
Page 42
Methods of Assessment of Aircraft Noise Nigel Burton
Ireland
It is reported that aircraft noise is assessed in this state using the Noise and
Number Index (NNI) but that no limits were specified. NNI is calculated using
below: Equation 2.4.5
Equation 2.4.5
80log15)( −+= NLNNI avpn
Where:
Lpn(av) = average noise level in PndBmax of all operations exceeding
80 PndBmax
N = number of operations during period 0600-2200
Italy
“Lva which is a 21 day, 24 hour LAeq, with a 10 dB night-time (2300-0600)
weighting, averaged over the busiest weeks from each of the three period 1st
October to 31st January, 1st February to 31st May, and 1st June to 30th
September.
The limits for land use planning are presented in Table 2.4.7 below:
Zone Lva Permitted Development
A <=65 No restriction
B 65-75 Prohibited for Residential Use
C >=75 Only Airport Activities Allowed”
Table 2.4.7: Italian Planning Guidance relating to Aircraft Noise
Luxembourg
Assessment method believed to be similar to that in Germany i.e. LAeq(4).
Section 2 – Literature Review and Research 42
Page 43
Methods of Assessment of Aircraft Noise Nigel Burton
The Netherlands
Aircraft noise assessed using Kosten-units which are calculated using
below: Equation 2.4.6
Equation 2.4.6
( ) 15710log20 15/ −= ∑ iLigKe
where:
Li = Max A-weighted sound level for each operation”
gi = 1 (08:00-18:00), 2 (18:00-19:00), 3 (19:00-20:00), 4 (20:00-21:00),
6 (21:00-22:00), 8 (22:00-23:00), 10 (23:00-06:00), 8 (06:00-07:00) or
4 (07:00-08:00)
“Noise limits which must not be exceeded by existing airports are” presented
in below:
Noise Level Planning Restriction
<=35 No Restrictions
>35 Generally No New Residential Areas
Allowed
>40 Generally No New Dwellings Allowed
40-50 Insulation of Existing Dwellings to NLR
30-35
50-55 Insulation of Existing Dwellings to NLR
35-40
Table 2.4.8: Dutch Planning Guidance relating to Aircraft Noise
Section 2 – Literature Review and Research 43
Page 44
Methods of Assessment of Aircraft Noise Nigel Burton
“In addition, for smaller airport with air traffic consisting of aircraft with MTOW
< 6,000 kg, an index called BKL is used with planning restrictions above 50
BKL.”
Portugal
No specific method for assessing aircraft noise stated.
Spain
There are many regional variations in approach to aircraft noise. Reference
is made to grants being applicable for sound insulation improvements to
residential properties built prior to April 1996 where levels of aircraft noise are
above 65 dB LAeq,(0700-2300) and/or 55 dB LAeq,(2300-0700).
Sweden
Aircraft noise is assessed using Lden which is based upon LAeq with
weightings of 5 dB and 10 dB for evening (19:00-22:00) and night-time
(22:00-07:00) respectively. At aircraft noise levels of below 55 dB Lden, no
planning restrictions apply.
2.4.2. Directive 2002/49/EC
On the 25 June 2002, the European Parliament published Directive
2002/49/EC “relating to the assessment and management of environmental
noise”25. The aim of the directive is “to define a common approach … to
avoid, prevent or reduce on a prioritised basis the harmful effects, including
annoyance, due to exposure to environmental noise”. As well as making the
requirement that member states begin the production of strategic
environmental noise maps by no later than 2007, the directive also attempts
to standardise the way in which noise is reported throughout the European
Union. In an earlier green paper published by the European Parliament in
1997 it was noted that there was a “lack of reliable, comparable data
Section 2 – Literature Review and Research 44
Page 45
Methods of Assessment of Aircraft Noise Nigel Burton
regarding the situation of various noise sources”. The directive emphasises
that in order to promote common understanding of noise issues, “data about
environmental noise levels should … be collected, collated and reported in
accordance with comparable criteria”. To this end, the directive dictates that
all member states adopt the Lden and Lnight metrics for the purpose of
reporting environmental noise levels. It is also suggested that in certain
cases it would be appropriate to also use Lday and Lnight. These metrics are
discussed in more detail in Section 2.6.5.
2.5. Aircraft Noise Modelling
It should be noted that the packages described in this section are merely a
sample of those available and that the list is by no means exhaustive.
2.5.1. USA FAA Integrated Noise Model (INM)
The United States of America Federal Aviation Authority’s Integrated Noise
Model (INM) has been used for the prediction of aircraft noise impact in the
proximity of airports since the late 1970s26. The software is available for
purchase from the FAA and, now in its sixth full version, is arguably the most
widely used software for aircraft noise modelling. Since this software is to be
used for the modelling section of this project, it will be examined in more
detail later.
2.5.2. UK CAA ANCON
The ANCON modelling software is not available for purchase but is instead
owned and operated by the CAA. This is unfortunate since, it is argued by
this Author, it means that any UK residents or organisations who wish to
model aircraft noise are forced to use another modelling package, such as
the INM, or retain the services of the CAA to use their ANCON model. In
many cases the latter is likely to be prohibitively expensive. This said, the
ANCON system is used by the government to produce regular noise contours
for the main BAA airports in the south-east of Heathrow, Stanstead and
Section 2 – Literature Review and Research 45
Page 46
Methods of Assessment of Aircraft Noise Nigel Burton
Gatwick. Other airports such as Manchester also employ the ANCON
system to produce noise contours for the benefit of local authorities in their
area.
2.5.3. Australian Transparent Noise Information Package
In response to the publication of their discussion paper on “Expanding Ways
to Describe and Assess Aircraft Noise”21, the Australian Department of
Transport and Regional Services produced a package of computer software
applications which made it possible for “non-expert users to generate the
descriptors shown in the Discussion Paper”27 such as Flight Path Movement
Charts, Respite Charts and N70 Contours. The software can also
incorporate data produced within the INM software.
In an attempt to encourage people to use the software it has been available
as freeware and can be obtained from the department. Like other modelling
packages the software can be used to carry out ‘what if’ assessments
therefore allowing any user to analyse the effects of possible operational
changes at their local airport.
This Author has attempted to obtain a copy of this software package but alas,
to date, has not received it. It is, however, satisfying to see a major authority
undertaking to improve communication of aircraft noise issues to
non-experts. This kind of approach is likely to reduce the feelings of
resentment often felt towards conventional methods of presenting aircraft
noise due to their complicated nature and subsequent inaccessibility to the
layperson.
2.6. Summary of Aircraft Noise Assessment Methods
The following noise metrics, and their associated criteria levels, have been
selected for use in the next section of this project. The criteria specified
relate to those adopted for land use compatibility for residential dwellings in
the particular country or region stated.
Section 2 – Literature Review and Research 46
Page 47
Methods of Assessment of Aircraft Noise Nigel Burton
2.6.1. Canada: Noise Exposure Forecast (NEF)
The Noise Exposure Forecast system was originally developed by the U.S.
Federal Aviation Agency for the assessment of community annoyance
caused by aircraft noise and is calculated using Equation 2.6.1 below28.
( ) (dB) 88N7.16Nlog10EPNLNEF ND10 −++=
Equation 2.6.1
where
EPNL = energy mean value of the EPNL
ND = number of daytime flights (07:00-22:00)
NN = number of night-time flights (22:00-07:00) – the factor of 16.7 relates
to a 10-1 weighting of night flights as opposed to day flights
In Canada the land use criteria with regards to residential development is as
shown in below: Table 2.6.1
Table 2.6.1: From Table 3 of TP 1247E – Part IV
Noise Exposure Forecast Values >40 40-35 35-30 <30
Exposure Areas 1 2 3 4
Residential
Detached, Semi-Detached No1 No1 No2 A
Town House, Garden Homes No1 No1 No2 A
Apartments No1 No1 No2 A
Where
No1 “Indicates that new construction or development of this nature should not
be undertaken”, No2 “Indicates that new construction or development of this
nature should not be undertaken (See Explanatory Note B)” and A indicates
that “This particular land use may be acceptable in accordance with the
Section 2 – Literature Review and Research 47
Page 48
Methods of Assessment of Aircraft Noise Nigel Burton
appropriate note and subject to the limitations indicated therein”. Explanatory
Note B states that Transport Canada’s recommendation is that “New
residential construction or development should not be undertaken” in areas
subject to between NEF 30 and 35, but offers guidance for those authorities
that nevertheless wish to proceed.
Transport Canada state that “Annoyance caused by aircraft noise may begin
as low as NEF 25”. In essence, residential development will generally be
accepted in areas up to NEF 30 but may require improved acoustic insulation
of the building envelope in some cases. For the purposes of this project,
NEF 30 has been selected as the level up to which residential development
is acceptable.
2.6.2. Australia: Australian Noise Exposure Forecast (ANEF)
The Australian Noise Exposure Forecast was first introduced in Australia in
198219. This system of assessment was based on the aircraft Noise
Exposure Forecast but with refinements made based on the results of a
survey into the reaction of communities to aircraft noise in Australia. ANEF is
calculated using below: Equation 2.6.2
Equation 2.6.2
( ) (dB) 88N4Nlog10EPNLANEF ND10 −++=
where
EPNL = energy mean value of the EPNL
ND = number of daytime flights (07:00-19:00)
NN = number of night-time flights (19:00-07:00)
In Australia the land use criteria with regards to residential development is as
shown in below23: Table 2.6.2
Section 2 – Literature Review and Research 48
Page 49
Methods of Assessment of Aircraft Noise Nigel Burton
Building Type ANEF zone of site
Acceptable Conditional Unacceptable
House, home unit,
flat, caravan park
Less than 20
ANEF (Note 1)
20 to 25 ANEF
(Note 2)
Greater than 25
ANEF
Table 2.6.2: Extract from Australian Standard AS 2021-1994
Note 1 points out that the location of the 20 ANEF contour is difficult to
accurately define “because of variations in aircraft flight paths” and as such
additional procedures may be followed for “building sites outside but near to
the 20 ANEF contour”. In relation to areas within the 20 to 25 ANEF band,
note 2 states that “some people may find that the land is not compatible with
residential or educational uses” and as such noise control features may be
appropriate. For the purposes of this project, both the 20 and 25 ANEF
contours will be evaluated.
2.6.3. USA: Day-Night Average Sound Level (DNL)
The Day-Night Average Sound Level, denoted as DNL or Ldn, is an Leq based
system which is used to rate the noise present over a 24 hour period. The
noise levels occurring during the night-time period, which in the United States
of America is the nine hour period between 22:00 hr and 07:00 hr, are given
a 10 dB weighting penalty such that the calculation of the DNL is as shown in
below29: Equation 2.6.3
Equation 2.6.3
+
=
+10
10Ln10Ld
1091015241log10DNL
where Ld = daytime (07:00 hr – 22:00 hr) LAeq,15hr
Ln = night-time (22:00 hr – 07:00 hr) LAeq,9hr
Section 2 – Literature Review and Research 49
Page 50
Methods of Assessment of Aircraft Noise Nigel Burton
As noted earlier Part 150 of the Federal Aviation Regulations requires that
the DNL contours of 65, 70 and 75 by produced. Table 1 of Appendix A of
Part 150 describes compatible land use as a function of YDNL, Yearly Day-
Night Average Noise Level. YDNL is defined as the average of daily DNL
values throughout the year. The land use criteria with regards to residential
development is as shown below in Table 2.6.3:
Yearly Day-Night Average Sound Level
Land Use – Residential Use <65 65-
70
70-
75
75-
80
80-
85
>85
Residential other than mobile
homes and transient lodgings
Y N(1) N(1) N N N
Mobile home park Y N N N N N
Transient lodgings Y N(1) N(1) N(1) N N
Table 2.6.3: Land Use Compatibility Guidelines from FAR Part 150
Where Y means that “Land use and related structures are compatible without
restrictions” and N means that “Land use and related structures are not
compatible and should be prohibited”. Note (1) states that “Where the
community determines that residential or school uses must be allowed,
measures to achieve outdoor to indoor Noise Level Reduction (NLR) of at
least 25 dB and 30 dB should be incorporated into building codes and be
considered in individual approvals. Normal residential construction can be
expected to provide a NLR of 20 dB, thus, the reduction requirements are
often stated as 5, 10 or 15 dB over the standard construction and normally
assume mechanical ventilation and closed windows year round. However,
the use of NLR criteria will not eliminate outdoor noise problems”.
2.6.4. USA: Community Noise Equivalent Level (CNEL)
The Community Noise Equivalent Level (CNEL), sometimes referred to as
Lden, was introduced in the State of California in the Early 1970’s as a
“simplified alternative to the NEF system”30. CNEL is similar to DNL but as
Section 2 – Literature Review and Research 50
Page 51
Methods of Assessment of Aircraft Noise Nigel Burton
well as the a 10 dB weighting being placed on all night-time movements, an
additional weighting of multiplying all movements taking place during the
evening period (19:00 hr to 22:00) by a factor of three. One method of
calculating CNEL is as presented in Equation 2.6.4 below:
( ) (dB) 4.49N10N3Nlog10SENELCNEL NED10 −+++=
Equation 2.6.4
where ND = Number of flights during the daytime (07:00-19:00 hrs)
NE = Number of flights during the evening (19:00-22:00 hrs)
NN = Number of flights during the night-time (22:00-07:00 hrs)
SENEL = The energy mean value of the single event noise exposure
as calculated using Equation 2.6.5 below:
ea10max tlog10NLSENEL +=
Equation 2.6.5
where NLmax = The maximum noise level in dB(A)
tea = The effective time duration (in seconds) of the noise level. It is
approximately equal to half of the time during which the event noise
level is within 10 dB of the maximum.
SENEL is similar to SEL but measured for the time interval whilst noise from
an aircraft exceeds a predetermined threshold level14. In general, the
SENEL result will be similar to that of the SEL.
Another method of calculating CNEL is the altered version of the DNL
formula as presented in Equation 2.6.6 below:
Section 2 – Literature Review and Research 51
Page 52
Methods of Assessment of Aircraft Noise Nigel Burton
+
+
=
++10
10Ln10
5Le10Ld
1091031012241log10CNEL
Equation 2.6.6
where Ld = daytime (07:00 hr – 19:00 hr) LAeq,12hr
Le = evening (19:00 hr – 22:00 hr) LAeq,3hr
Ln = night-time (22:00 hr – 07:00 hr) LAeq,9hr
The FAA accepts CNEL in place of DNL for studies conducted within
California since the region has adopted CNEL as its standard for the
assessment of cumulative community noise exposures. As such, DNL and
CNEL are interchangeable and the land use criteria for residential
development described in FAR Part 150 and reproduced in Table 2.6.3 are
compatible for both metrics.
2.6.5. European Union Lden and Lnight
Directive 2002/49/EC states that the calculation of Lden is as presented in
below25: Equation 2.6.7
Equation 2.6.7
×+×+×=
++
1010L
105L
10L
den
nighteveningday
1081041012241lg10L
where Lday = “the A-weighted long-term sound level … determined
over all the day periods of a year”
Levening = “the A-weighted long-term sound level … determined
over all the evening periods of a year”
Lnight = “the A-weighted long-term sound level … determined
over all the night periods of a year”
Section 2 – Literature Review and Research 52
Page 53
Methods of Assessment of Aircraft Noise Nigel Burton
The unit is effectively the same as CNEL but differs due to the different
durations of the day, evening and night-time periods. The European Union
allows for individual member states to “shorten the evening period be one or
two hours and lengthen the day and/or the night period accordingly”. Since
the UK currently adopts a 16 hour day and 8 hour night it is likely that the
standard form presented above will be used in this country. The Lnight is to be
taken as defined above.
The European Union requires the use of these metrics for the purposes of
assessment and noise mapping but has not set out any specific criteria for
acceptable or unacceptable levels for planning use. This said, contours of
55, 60, 65, 70 and 75 dB Lden are required for the assessment of “the
estimated number of people” exposed to such noise levels. For the same
purpose, the contours of 50, 55, 60, 65 and 70 dB Lnight are required for the
night-time period.
2.6.6. United Kingdom LAeq,16hr and LAeq,8hr
As described in Section 2.1.5, Planning Policy Guidance Note 24 states the
Government’s policy on planning with regards to noise7. The planning
criteria are detailed in that section.
Section 2 – Literature Review and Research 53
Page 54
Methods of Assessment of Aircraft Noise Nigel Burton
3.0 SECTION 3 – NOISE MODELLING OF AIRCRAFT OPERATIONS AT A ‘TYPICAL’ AIRPORT
3.1. Introduction
For this section of the project, the noise assessment methods discussed in
Section 2.6 have been identified for further examination. The examination
will involve modelling the different metrics for the operations at a
hypothetical, yet realistic, airport. Following the modelling process the results
for each metric will be compared with each other and with their respective
criteria to determine which of them operate the most stringent and least strict
standards.
3.2. The Noise Metrics to be Further Investigated
A total of 8 noise metrics have been selected for further investigation. They,
along with their respective country or region of use in brackets, are as
follows:
• Noise Exposure Forecast, NEF (Canada)
• Australian Noise Exposure Forecast, ANEF (Australia)
• Day-Night Average Sound Level, DNL (USA)
• Community Noise Equivalent Level, CNEL (USA)
• Lden (European Union)
• Lnight (European Union)
• LAeq,16hr (United Kingdom)
• LAeq,8hr (United Kingdom)
3.3. The Hypothetical Airport and its Operations
The hypothetical airport operates a single runway which is 3050m in length.
The aircraft operations at this airport are based closely on movement data
from an existing European regional airport though the data has been
Section 3 – Noise Modelling of Operations at a ‘Typical’ Airport 54
Page 55
Methods of Assessment of Aircraft Noise Nigel Burton
somewhat simplified for the purposes of this assessment. The runway
designations at the airport are 09 and 27, due east and due west
respectively. Each of the two runway designations has two departure flight
paths, or routes, and one arrival path. One departure route on each runway
designation turns towards the north, whilst the other turns towards the south.
The arrival paths on each runway designation are straight in and therefore
follow the extended centreline of the runway. Figure 3.3.1 below shows the
basic layout of the runway at the airport and its departure and arrival routes.
09A 27A
27N
27S
09N
09S
Figure 3.3.1: Basic Layout of Runway and Departure and Arrival Routes
Movement data for a total of eleven different aircraft types has been
produced. The total daily movements for each aircraft type are shown in
below: Table 3.3.1
Section 3 – Noise Modelling of Operations at a ‘Typical’ Airport 55
Page 56
Methods of Assessment of Aircraft Noise Nigel Burton
Aircraft Type Class Sector Length Total Movements
Embraer 145 1 1 66
Dash 8 1 1 66
Airbus A319 2 2 109
Airbus A320 2 3 109
Boeing 737-700 2 3 109
Boeing 737-800 2 2 109
Airbus A310 3 4 11.2
Boeing 757 3 4 22.4
Boeing 767 3 6 22.4
Airbus A300 4 5 48
Airbus A330 4 6 48
Total Number of Movements by All Aircraft 720
Table 3.3.1: Total Number of Daily Movements by Aircraft Type
The reason that some aircraft types in the table have either an odd number
or non-whole number of movements is that these figures relate to data for an
average day. Some aircraft will not fly everyday and hence the apparently
unusual input data. The class of the aircraft type relates to its size, weight
and capacity with the Airbus A300 and Airbus A330 being the largest aircraft
types to be included in this assessment. The sector length relates to the
distance that the aircraft type is going to fly. In this case, the sector lengths
relate to the profile stage number utilised by the INM, where 1 is 0 to 500
nautical miles (nmi), 2 is 500 to 1000 nmi, 3 is 1000 to 1500 nmi and 4 is
1500 to 2500 nmi. Photographs of examples of all of the aircraft types are
shown in Appendix 1.
The data in Table 3.3.1 was then divided in departures and arrivals by aircraft
type using a simple 50%/50% split, since all aircraft arriving must depart.
The departure and arrivals for each aircraft type were then split by runway
designation. In common with many UK airport, a split of 70%/30% in favour
of the western (27) routes was used. Finally, the departures on each runway
designation and for each aircraft type were split into those going north and
Section 3 – Noise Modelling of Operations at a ‘Typical’ Airport 56
Page 57
Methods of Assessment of Aircraft Noise Nigel Burton
those going south. For the purposes of this assessment it has been
assumed that 80% of all departures turn towards the south whilst the
remaining 20% turn towards the north. These routings are not dissimilar from
those used at several UK airports due to large proportion of traffic heading
south towards mainland Europe. The results of these computations are
shown in below: Table 3.3.2
Table 3.3.2: Daily Movements split by Runway, Movement Type and Route
Aircraft Type Runway 09 (Due East) Runway 27 (Due West)
Arrival Departure Arrival Departure
09A 09N 09S 27A 27N 27S
Embraer 145 9.9000 1.9800 7.9200 23.1000 4.6200 18.4800
Dash 8 9.9000 1.9800 7.9200 23.1000 4.6200 18.4800
Airbus A319 16.3500 3.2700 13.0800 38.1500 7.6300 30.5200
Airbus A320 16.3500 3.2700 13.0800 38.1500 7.6300 30.5200
Boeing 737-700 16.3500 3.2700 13.0800 38.1500 7.6300 30.5200
Boeing 737-800 16.3500 3.2700 13.0800 38.1500 7.6300 30.5200
Airbus A310 1.6800 0.3360 1.3440 3.9200 0.7840 3.1360
Boeing 757 3.3600 0.6720 2.6880 7.8400 1.5680 6.2720
Boeing 767 3.3600 0.6720 2.6880 7.8400 1.5680 6.2720
Airbus A300 7.2000 1.4400 5.7600 16.8000 3.3600 13.4400
Airbus A330 7.2000 1.4400 5.7600 16.8000 3.3600 13.4400
Sub-total: routes 108.0 21.6 86.4 252.0 50.4 201.6
Sub-total: runway 216 504
TOTAL 720
Note: The reason for the large number of decimal places in the movement
data is that the INM works to four decimal places for its input data.
Due to the nature of many of the noise metrics to be examined, the total
number of daily movements needed to be split into the daytime, evening and
night-time periods. This creates a problem since not all of the metrics use
similar durations for these periods. For example, the LAeq,16hr system adopted
Section 3 – Noise Modelling of Operations at a ‘Typical’ Airport 57
Page 58
Methods of Assessment of Aircraft Noise Nigel Burton
in the United Kingdom assumes the daytime period to operate between
07:00 hr and 23:00 hr whilst the US based Day-Night Average Sound Level
System assumes a daytime period between 07:00 hr and 22:00 hr, 1 hour
shorter than the UK system. Therefore, for the purposes of this project, it
was decided to model each metric using its own preferred time periods. This
has meant separating the metrics into two groups; those which operate a
15 hr day and those which operate a 16 hr day as shown in
below.
Table 3.3.3
Table 3.3.3: Groupings for Computer Modelling
Daytime Period Reference
15 Hour Day • Canadian NEF
• Australian NEF
• USA DNL
• USA CNEL
16 Hour Day • UK LAeq,16hr
• UK LAeq,8hr
• EU Lden
• EU Lnight
As a result of the two groups, it was necessary to create two separate
models, one for each scenario. The daily movement data split by runway,
movement type and route were again split, but this time by daytime, evening
and night-time movements. For simplicity it has been assumed that, for the
16 hr daytime scenario, 10% of the movements occur during the 8 hour night-
time period and that the remaining 90% are split evenly throughout the
daytime and evening hours. That is to say that the remainder is split
75%/25% between the daytime and evening periods respectively. Due to
their size, the results of these computations are presented in Appendix 2.
In order to adjust the movement data for the 15 hour daytime scenario, 25%,
i.e. 1 hours worth, of the evening movements were moved from that period to
Section 3 – Noise Modelling of Operations at a ‘Typical’ Airport 58
Page 59
Methods of Assessment of Aircraft Noise Nigel Burton
the night-time period. The results of these computations are presented in
. Appendix 3
3.4. Overview of Utilisation of the Integrated Noise Model
A detailed explanation of the modelling practices used for this investigation is
presented in Appendix 4 whilst a summary of the most salient points is
provided below.
The Integrated Noise Model Version 6.0c has been utilised for the production
of the noise contours for this project. The software works under the Microsoft
Windows environment and can be used to calculate simple Lmax calculations
at specified locations or for more complex noise modelling processes such as
the calculation of noise contours around airports with multiple runway and
route configurations. The in-built database contains noise data for around
250 different aircraft types or variants. The software also contains layout
data for around 820 airports within the USA. For the purposes of this project,
an original study has been set up.
Table 3.4.1 below shows the information used to calculate both the
preinstalled and custom edited metrics used in this case:
Section 3 – Noise Modelling of Operations at a ‘Typical’ Airport 59
Page 60
Methods of Assessment of Aircraft Noise Nigel Burton
Noise
Metric
Noise
Family
Metric
Type
Flight Multiplier Averaging Time
Day Eve Night (hr) (10LogT)
NEF Perceived Exposure 1 1 16.7 24 88*
ANEF Perceived Exposure 1 4 4 24 88*
DNL A-Weighted Exposure 1 1 10 24 49.37
CNEL A-Weighted Exposure 1 3 10 24 49.37
LDEN A-Weighted Exposure 1 3 10 24 49.37
LNIGHT A-Weighted Exposure 0 0 1 8 44.59
LAEQ16 A-Weighted Exposure 1 1 0 16 47.60
LAEQ8 A-Weighted Exposure 0 0 1 8 44.59
Table 3.4.1: INM Noise Metric Data
* The 10LogT term in the cases of NEF and ANEF is incorrect. The
figure of 88 relates to the -88 in the calculation for each of these metrics.
The INM package calculates the aircraft noise levels over a predefined area,
the grid area, and joins points of equal level in order to produce a noise
contour for that value. If the user defines a smaller grid, the low value
contours may continue outside the grid boundary. This said, if the grid is too
large, the computation time can be excessive. For the purposes of this
investigation, the standard grid size has been used and increased only when
the model has been run and it has been found that the grid size is too small.
The detail and accuracy of the contours produced is dependent upon the
“refinement” and “tolerance” settings in the “Run Options” menu. For this
investigation these were set to 9 and 0.01 respectively. These values are
different to the default values but allow for greater precision in the calculation
of the contour values, if increasing the run time slightly. Similarly, the “Low
Cutoff” and “High Cutoff” values were set to the minimum and maximum
contour values required for each metric. This allows the model to only
compute values within the required range, reducing the run time of the
model.
Section 3 – Noise Modelling of Operations at a ‘Typical’ Airport 60
Page 61
Methods of Assessment of Aircraft Noise Nigel Burton
For the contours produced for this project, the average run time was around
2 to 3 minutes per metric. The model was run on a laptop with an AMD-K6 III
processor with around 96 MB of RAM.
Once the contours have been produced, they can be printed, to scale if
required, or can be exported as .DXF files for use in design packages such
as AutoCAD for overlaying onto geographical base maps.
3.5. Results of the Computer Modelling
The graphical results of the contours produced for each metric are presented
in Appendix 5. The results for each metric are reviewed below individually
and then compared against each other.
3.5.1. Canada: Noise Exposure Forecast (NEF)
The total areas covered by the NEF contours produced are presented in
Table 3.5.1 with the contours themselves being presented in : Figure 3.5.1
NEF Contour Value 25 30 35 40
Area within Contour (sq. km) 25.07 11.78 5.30 2.27
Table 3.5.1: Areas of NEF Contours
Section 3 – Noise Modelling of Operations at a ‘Typical’ Airport 61
Page 62
Methods of Assessment of Aircraft Noise Nigel Burton
Figure 3.5.1: NEF Contour Outputs
Assessing our hypothetical airport using the criteria adopted in Canada,
5.30 sq.km, the area inside the 35 NEF contour, should not be used for new
residential development. The area between the 30 and 35 NEF contours
should also not be used for new residential development but Transport
Canada would offer guidance for those authorities that nevertheless wish to
proceed. The area outside the 30 ANEF contour area of 11.78 sq.km “may
be acceptable” for new residential development and is likely to be accepted
with the application of conditions, such as improved acoustic insulation, in
some cases. It is noted that “Annoyance caused by aircraft noise may begin
as low as 25 NEF”.
3.5.2. Australia: Australian Noise Exposure Forecast (ANEF)
The total areas covered by the ANEF contours produced are presented in
with the contours themselves being presented in : Table 3.5.2
Table 3.5.2: Areas of ANEF Contours
Figure 3.5.2
ANEF Contour Value 20 25
Area within Contour (sq.km) 38.56 17.22
Section 3 – Noise Modelling of Operations at a ‘Typical’ Airport 62
Page 63
Methods of Assessment of Aircraft Noise Nigel Burton
Figure 3.5.2: ANEF Contour Outputs
Using the Australian criteria, new residential development would be deemed
unacceptable within the ANEF 25 contour area of 17.22 sq.km. Use of the
area between the 20 and 25 ANEF contours for new residential development
may be permitted but with conditions applied, such as noise control. Land
outside the ANEF 20 contour area of 38.56 sq.km would be permitted.
3.5.3. USA: Day-Night Average Sound Level (DNL)
The total areas covered by the DNL contours produced are presented in
with the contours themselves being presented in : Table 3.5.3
Table 3.5.3: Areas of DNL Contours
Figure 3.5.3
DNL Contour Value 65 70 75
Area within Contour (sq.km) 10.78 4.40 1.76
Section 3 – Noise Modelling of Operations at a ‘Typical’ Airport 63
Page 64
Methods of Assessment of Aircraft Noise Nigel Burton
Figure 3.5.3: DNL Contour Outputs
Using the United States’ criteria, new conventional residential development
will not be permitted within the DNL 75 contour area of 1.76 sq.km.
Permission should also be refused for new residences within the DNL 70
contour but in cases where permission is deemed appropriate, conditions
relating to improved sound insulation should apply. For the area outside the
DNL 65 contour area of 10.78 sq.km new residential developments would be
permitted “without restrictions”.
3.5.4. USA: Community Noise Equivalent Level (CNEL)
The total areas covered by the CNEL contours produced are presented in
with the contours themselves being presented in : Table 3.5.4
Table 3.5.4: Areas of CNEL Contours
Figure 3.5.4
CNEL Contour Value 65 70 75
Area within Contour (sq.km) 11.86 4.90 1.94
Section 3 – Noise Modelling of Operations at a ‘Typical’ Airport 64
Page 65
Methods of Assessment of Aircraft Noise Nigel Burton
Figure 3.5.4: CNEL Contour Outputs
Using the State of California’s criteria, new conventional residential
development will not be permitted within the DNL 75 contour area of
1.94 sq.km. Permission should also be refused for new residences within the
DNL 70 contour but in cases where permission is deemed appropriate,
conditions relating to improved sound insulation should apply. For the area
outside the DNL 65 contour area of 11.86 sq.km new residential
developments would be permitted “without restrictions”.
3.5.5. European Union: Lden
The total areas covered by the Lden contours produced are presented in
with the contours themselves being presented in : Table 3.5.5
Table 3.5.5: Areas of Lden Contours
Figure 3.5.5
Lden Contour Value 55 60 65 70 75
Area within Contour
(sq.km)
62.75 24.44 10.59 4.31 1.73
Section 3 – Noise Modelling of Operations at a ‘Typical’ Airport 65
Page 66
Methods of Assessment of Aircraft Noise Nigel Burton
Figure 3.5.5: Lden Contour Outputs
As stated earlier, the European Union has not set out any specific criteria in
relation to these contour values. The Lden contour results will however be
compared with the criteria established in the UK later.
3.5.6. European Union: Lnight
The total areas covered by the Lnight contours produced are presented in
with the contours themselves being presented in : Table 3.5.6
Table 3.5.6: Areas of Lnight Contours
Figure 3.5.6
Lnight Contour Value 50 55 60 65 70
Area within Contour
(sq.km)
29.67 12.67 5.28 2.07 0.96
Section 3 – Noise Modelling of Operations at a ‘Typical’ Airport 66
Page 67
Methods of Assessment of Aircraft Noise Nigel Burton
Figure 3.5.6: Lnight Contour Outputs
As stated earlier, the European Union has not set out any specific criteria in
relation to these contour values. The Lnight contour results will however be
compared with the criteria established in the UK later.
3.5.7. United Kingdom: LAeq,16hr
The total areas covered by the LAeq,16hr contours produced are presented in
with the contours themselves being presented in : Table 3.5.7
Table 3.5.7: Areas of LAeq,16hr Contours
Figure 3.5.7
LAeq,16hr Contour Value 57 66 72
Area within Contour (sq.km) 27.25 5.82 1.91
Section 3 – Noise Modelling of Operations at a ‘Typical’ Airport 67
Page 68
Methods of Assessment of Aircraft Noise Nigel Burton
Figure 3.5.7: LAeq,16hr Contour Outputs
Using the PPG 24 criteria adopted within the UK, for our hypothetical airport
the region within the 72 dB LAeq,16hr contour area of 1.91 sq.km would be
classified as being in Noise Exposure Category (NEC) D where “Planning
permission should normally be refused”. For the area between the 66 and
72 dB LAeq,16hr contours, NEC C, “permission should not normally be granted”
but where it is noise control conditions should be applied. For the area
between the 57 and 66 dB LAeq,16hr contours, NEC B, “Noise should be taken
into account when determining planning applications and, where appropriate,
conditions imposed to ensure an adequate level of protection”. For the
region outside the 57 dB LAeq,16hr contour area of 27.25 sq.km, NEC A, “Noise
need not be considered” with regards to awarding of planning permission.
3.5.8. United Kingdom: LAeq,8hr
The total areas covered by the LAeq,8hr contours produced are presented in
with the contours themselves being presented in : Table 3.5.8 Figure 3.5.8
Section 3 – Noise Modelling of Operations at a ‘Typical’ Airport 68
Page 69
Methods of Assessment of Aircraft Noise Nigel Burton
LAeq,8hr Contour Value 48 57 66
Area within Contour (sq.km) 43.23 9.03 1.75
Table 3.5.8: Areas of LAeq,8hr Contours
Figure 3.5.8: LAeq,8hr Contour Outputs
Using the PPG 24 criteria adopted within the UK, for our hypothetical airport
the region within the 66 dB LAeq,8hr contour area of 1.75 sq.km would be
classified as being in NEC D where “Planning permission should normally be
refused”. For the area between the 57 and 66 dB LAeq,8hr contours, NEC C,
“permission should not normally be granted” but where it is noise control
conditions should be applied. For the area between the 48 and 57 dB LAeq,8hr
contours, NEC B, “Noise should be taken into account when determining
planning applications and, where appropriate, conditions imposed to ensure
an adequate level of protection”. For the region outside the 48 dB LAeq,8hr
contour area of 43.23 sq.km, NEC A, “Noise need not be considered” with
regards to the granting of planning permission.
Section 3 – Noise Modelling of Operations at a ‘Typical’ Airport 69
Page 70
Methods of Assessment of Aircraft Noise Nigel Burton
3.5.9. Comparison of Residential Planning Criteria in Different Regions
All of the regions, with the exception of the European Union, have residential
planning criteria with regards to aircraft noise which can be crudely simplified
into three categories:
1. Planning Permission Should Be Granted
2. Planning Permission Could Be Granted (With Conditions)
3. Planning Permission Should Be Refused
Table 3.5.9
Table 3.5.9: Areas for which Planning Permission Should Be Granted
compares the areas outside which planning permission should be
granted for each of the metrics. The colour of the text in the first column of
the table relates to the corresponding contour presented in Figure 3.5.9.
Noise Metric Criteria Area
Canada: NEF < 30 NEF Outside 11.78 sq.km
Australia: ANEF < 20 ANEF Outside 38.56 sq.km
USA: DNL < 65 DNL Outside 10.78 sq.km
USA: CNEL < 65 CNEL Outside 11.86 sq.km
UK: LAeq,16hr < 57 dB LAeq,16hr Outside 27.25 sq.km
UK: LAeq,8hr < 48 dB LAeq,8hr Outside 43.23 sq.km
Section 3 – Noise Modelling of Operations at a ‘Typical’ Airport 70
Page 71
Methods of Assessment of Aircraft Noise Nigel Burton
Figure 3.5.9: Areas Outside Which Planning Permission Should Be Granted
Table 3.5.10
Table 3.5.10: Areas for which Planning Permission Could Be Granted (With
Conditions)
compares the region in which planning permission could be
granted with conditions for each of the metrics.
Noise Metric Criteria Area
Canada: NEF 30-35 NEF 11.78-5.30 sq.km
Australia: ANEF 20-25 ANEF 38.56-17.22 sq.km
USA: DNL 65-75 DNL 10.78-1.76 sq.km
USA: CNEL 65-75 CNEL 11.86-1.94 sq.km
UK: LAeq,16hr 57-72 dB LAeq,16hr 27.25-1.91 sq.km
UK: LAeq,8hr 48-66 dB LAeq,8hr 43.23-1.75 sq.km
Table 3.5.11 compares the areas for which planning permission should be
refused for each of the metrics. The colour of the text in the first column of
the table relates to the corresponding contour presented in Figure 3.5.10.
Section 3 – Noise Modelling of Operations at a ‘Typical’ Airport 71
Page 72
Methods of Assessment of Aircraft Noise Nigel Burton
Noise Metric Criteria Area
Canada: NEF > 35 NEF Inside 5.30 sq.km
Australia: ANEF > 25 ANEF Inside 17.22 sq.km
USA: DNL > 75 DNL Inside 1.76 sq.km
USA: CNEL > 75 CNEL Inside 1.94 sq.km
UK: LAeq,16hr > 72 dB LAeq,16hr Inside 1.91 sq.km
UK: LAeq,8hr > 66 dB LAeq,8hr Inside 1.75 sq.km
Table 3.5.11: Areas for which Planning Permission Should Be Refused
Figure 3.5.10: Areas inside which Planning Permission Should Be Refused
Finally, a comparison of the residential planning criteria in the different
regions examined is presented below in the form of a cumulative bar chart in
. Figure 3.5.11
Section 3 – Noise Modelling of Operations at a ‘Typical’ Airport 72
Page 73
Methods of Assessment of Aircraft Noise Nigel Burton
0
5
10
15
20
25
30
35
40
45
50
Canada: NEF Australia: ANEF USA: DNL USA: CNEL UK: LAeq,16hr UK: LAeq,8hr
Metric
Are
a (s
q.km
)
Permission Should Be Refused Permission Could Be Granted (With Conditions) Permission Should Be Granted
Figure 3.5.11: Comparison of Residential Planning Criteria in Different Regions
Section 3 – Noise Modelling of Operations at a ‘Typical’ Airport 73
Page 74
Methods of Assessment of Aircraft Noise Nigel Burton
3.6. Discussion of Results
The results of the modelling exercise indicate large variations in the planning
criteria adopted in the different regions examined. The criteria adopted in
Australia appears to the be the most stringent having a comparatively large
area, 17.22 sq. km, within which residential development should be refused
on noise grounds.
Conversely, the least stringent region with regards to aircraft noise appears
to be the USA. The total areas for which development should be refused and
could be granted with conditions within this country, using either the DNL or
the CNEL system, would fit within the area for which planning permission
should be refused assuming the Australian criteria.
With regards to the UK systems, the areas within which residential
development should be refused are similar to those predicted under the USA
systems, at around 1.7 to 2.0 sq.km. This said, the UK criteria is more
stringent than the USA criteria by having a far larger area in which conditions
would be applied before residential development would be permitted without
condition.
The contour area for the 57 dB LAeq,16hr, the area outside which residential
development should be permitted within the UK, is similar to the area
encompassed by the 60 dB Lden contour under the EU system. The contour
area for the 72 dB LAeq,16hr, the area inside which residential development
should be refused within the UK, is similar to the area encompassed by the
75 dB Lden contour under the EU system. It is important to remember,
however, that this relationship is only true for this scenario since the UK
metric is based purely on 16 hour daytime and evening movements whilst the
EU system also takes account of night-time movements.
The UK LAeq,8hr and EU Lnight are identical metrics. Therefore, the nearest
Lnight contour produced to the 48 dB LAeq,8hr contour, outside which residential
development should be permitted, is the 50 dB Lnight contour. Similarly, the
Section 3 – Noise Modelling of Operations at a ‘Typical’ Airport 74
Page 75
Methods of Assessment of Aircraft Noise Nigel Burton
nearest Lnight contour produced to the 66 dB LAeq,8hr contour, inside which
residential development should be refused, is the 65 dB Lnight.
Section 3 – Noise Modelling of Operations at a ‘Typical’ Airport 75
Page 76
Methods of Assessment of Aircraft Noise Nigel Burton
4.0 SECTION 4 – SUMMARY, CONCLUSIONS AND AREAS FOR FURTHER WORK
It has been demonstrated that a variety of different systems have been and
are being used for assessment of aircraft noise both historically and around
the world.
Of the methods examined in the last section of this report, the Australian
ANEF system, coupled with its corresponding criteria in that country, appears
to be the most stringent, with the systems and criteria adopted in the USA
being the least strict. From the literature reviewed in Section 2, the
Australian government also appear to be actively encouraging the discussion
of aircraft noise in order to develop new methods to better communicate the
effects of aircraft operations to the layperson. The promotion of the use of
arithmetic noise metrics such as the N70 appears to be assisting this
process.
The opinion of this Author is that a common approach to the assessment of
aircraft noise would be beneficial in order to allow easy comparison of noise
exposures around different airports throughout the world. Whilst it would also
be beneficial for similar criteria to be adopted internationally, it is appreciated
that this is less likely to occur due to the apparent large variation in the
definition of what constitutes acceptable and unacceptable levels of aircraft
noise. A definitive answer as to what is and is not acceptable is unlikely to
be found since, as stated in the Department of Transport Press Notice 304 in
1990 “There is no absolute measure of disturbance from aircraft noise – nor
can there be, given the variation in individual reactions”5.
Areas that could be examined for further work in this area would include the
use and review of the new Australian aircraft noise assessment software
TNIP described in Section 2.5.3. As explained in that section, this author
attempted to obtain a copy of this freeware software but has yet to receive it.
Section 4 – Summary, Conclusions and Further Work 76
Page 77
Methods of Assessment of Aircraft Noise Nigel Burton
It may also be beneficial to repeat this pilot study using actual data for
various major international airports, assessing the noise exposure at each
with different noise metrics and criteria adopted elsewhere. It would also be
interesting to determine whether human response to aircraft noise exposure
differs from region to region. This could be examined by carrying out
carefully constructed surveys of people living and working around the various
airports in question, similar to those carried out on behalf of the Wilson
Committee over 40 years ago.
Section 4 – Summary, Conclusions and Further Work 77
Page 78
Methods of Assessment of Aircraft Noise Nigel Burton
5.0 SECTION 5 – REFERENCES 1 Committee on the Problem of Noise. Noise Final Report, HMSO, Cmnd.2056, July 1963 2 Office of Population Censuses and Surveys, Social Survey Division, Second Survey of Aircraft Noise Annoyance around London (Heathrow) Airport, 1971 3 NELSON P: Transportation Noise Reference Book Butterworths & Co. (Publishers) Ltd, 1987 4 BROOKER P, CRITCHLEY J B, MONKMAN D J, RICHMOND C: DR Report 8402 United Kingdom Aircraft Noise Index Study: main report – Civil Aviation Authority Directorate of Research and Analysis (DORA) Jan 1985 5 Department of Transport, Press Notice No 304, Change Agreed To Daytime Index for Aircraft Noise, 4 September 1990 6 CRICHLEY J B, OLLERHEAD J B: DORA Report 9023 The Use of Leq as an Aircraft Noise Index – Civil Aviation Authority Directorate of Research and Analysis (DORA) September 1990 7 DEPARTMENT OF ENVIRONMENT Planning Policy Guidance Note 24 (PPG 24): Planning and Noise September 1994 8 DEPARTMENT OF TRANSPORT The Future of Air Transport December 2002 9 http://www.uk-airportparking.co.uk/heathrow (Heathrow Airport Parking History) Accessed 27/08/03 10 http://www.heathrow.airport-parking-centre.co.uk/about-heathrow-airport.html (About Heathrow Airport - Facts, Figures and History) Accessed 27/08/03 11 http://www.heathrow-airport-parking-uk.co.uk/heathrow-history/ (Heathrow Airport History) Accessed 27/08/03 12 http://www.heathrow-airport-guide.co.uk/history.html (Heathrow Airport Guide - History of London Heathrow Airport) Accessed 27/08/03 13 http://www.parkandgo.co.uk/heathrow-airport-history.html (Park and Go: Heathrow Airport Parking – Airport History) Accessed 27/08/03 14 HARRIS MILLER MILLER & HANSON Inc: Reid-Hillview Airport FAR Part 150 Draft Noise Exposure Map 2002 15 Federal Interagency Committee on Noise (FICON) Federal Agency Review of Selected Airport Noise Analysis Issues August 1992 16 Schultz, T.J. Synthesis of Social Surveys on Noise Annoyance Journal of the Acoustical Society of America, Vol.64, No.2, August 1978 17 Personal Correspondence with Tom Lowrey of Transport Canada 18 Transport Canada, TP 1247E – Land Use in the Vicinity of Airports, Part IV – Aircraft Noise, Seventh Edition Last Amended May 1996 (http://www.tc.gc.ca/CivilAviation/Aerodrome/Environment/TP1247E/Part4/menu.htm) 19 Airservices Australia The Australian Noise Exposure Forecast System and Associated Land Use Compatibility Advice for Areas in the Vicinity of Airports, Fifth Edition September 1999 20 Senate Select Committee on Aircraft Noise in Sydney: Falling on Deaf Ears Commonwealth of Australia, Canberra, 1995 21 Department of Transport and Regional Services, Australia – Discussion Paper: Expanding Ways to Describe and Assess Aircraft Noise – March 2000 22 HEDE A J, BULLEN R B Aircraft Noise in Australia: A Survey of Community Reaction, NAL Report No.88 National Acoustic Laboratories, Australian Government Publishing Services, Canberra, 1982 23 Australian Standard AS2021-1994 Acoustics – Aircraft noise intrusion – Building siting and construction 24 FLINDELL I H, MCKENZIE A R European Environment Agency – Technical Report – An Inventory of Current European Methodologies and Procedures for Environmental Noise Management – 26 June 2000 – European Environment Agency, Denmark 25 European Parliament Directive 2002/49/EC of the European Parliament and of the Council of 25 June 2002 relating to the assessment and management of environmental noise June 2002 26 GULDING, OLMSTEAD, BRYAN, MIRSKY, FLEMING, D’APRILE, GERBI Integrated Noise Model 6.0 User’s Manual Federal Aviation Administration September 1999
Section 5 – References 78
Page 79
Methods of Assessment of Aircraft Noise Nigel Burton
Section 5 – References 79
27 Department of Transport and Regional Services, Australia – TNIP Transparent Noise Information Package – User’s Manual TNIP v3.2.2 – December 2003 28 http://www.sfu.ca/sonic-studio/handbook/Noise_Exposure_Forecast.html (Noise_Exposure_Forecast - Noise Exposure Forecast (NEF)) Accessed 22/09/03 29 http://www.netvista.net/~hpb/epa1974/epa19741.html (Equivalent Sound Level and Its Relationship to Other Noise Measures) Accessed 25/01/04 30 http://www2.sfu.ca/sonic-studio/handbook/Community_Noise_Equivalent.html (Community Noise Equivalent Level (CNEL)) Accessed 06/01/04
Page 80
Embraer 145 Dash 8
Airbus A319 Airbus A320
Boeing 737-700 Boeing 737-800
Appendix 1: Photographs of Examples of Aircraft Used for Noise Models
Page 1 of 2
Page 81
Airbus A310 Boeing 757
Boeing 767 Airbus A300
Airbus A330
Appendix 1: Photographs of Examples of Aircraft Used for Noise Models
Page 2 of 2
Page 82
ARR DEP DEP ARR DEP DEPINM Type Sector 9 09N 09S 27 27N 27S
737700 3 11.0363 2.2073 8.8290 25.7513 5.1503 20.6010737800 2 11.0363 2.2073 8.8290 25.7513 5.1503 20.6010757RR 4 2.2680 0.4536 1.8144 5.2920 1.0584 4.2336767JT9 6 2.2680 0.4536 1.8144 5.2920 1.0584 4.2336A30062 5 4.8600 0.9720 3.8880 11.3400 2.2680 9.0720A310 4 1.1340 0.2268 0.9072 2.6460 0.5292 2.1168A319 2 11.0363 2.2073 8.8290 25.7513 5.1503 20.6010
A32023 3 11.0363 2.2073 8.8290 25.7513 5.1503 20.6010A33034 6 4.8600 0.9720 3.8880 11.3400 2.2680 9.0720DHC830 1 6.6825 1.3365 5.3460 15.5925 3.1185 12.4740EMB145 1 6.6825 1.3365 5.3460 15.5925 3.1185 12.4740
72.9000 14.5800 58.3200 170.1000 34.0200 136.0800
ARR DEP DEP ARR DEP DEPINM Type Sector 9 09N 09S 27 27N 27S
737700 3 2.7591 0.5518 2.2073 6.4378 1.2876 5.1503737800 2 2.7591 0.5518 2.2073 6.4378 1.2876 5.1503757RR 4 0.5670 0.1134 0.4536 1.3230 0.2646 1.0584767JT9 6 0.5670 0.1134 0.4536 1.3230 0.2646 1.0584A30062 5 1.2150 0.2430 0.9720 2.8350 0.5670 2.2680A310 4 0.2835 0.0567 0.2268 0.6615 0.1323 0.5292A319 2 2.7591 0.5518 2.2073 6.4378 1.2876 5.1503
A32023 3 2.7591 0.5518 2.2073 6.4378 1.2876 5.1503A33034 6 1.2150 0.2430 0.9720 2.8350 0.5670 2.2680DHC830 1 1.6706 0.3341 1.3365 3.8981 0.7796 3.1185EMB145 1 1.6706 0.3341 1.3365 3.8981 0.7796 3.1185
18.2250 3.6450 14.5800 42.5250 8.5050 34.0200
ARR DEP DEP ARR DEP DEPINM Type Sector 9 09N 09S 27 27N 27S
737700 3 2.5547 0.5109 2.0438 5.9609 1.1922 4.7688737800 2 2.5547 0.5109 2.0438 5.9609 1.1922 4.7688757RR 4 0.5250 0.1050 0.4200 1.2250 0.2450 0.9800767JT9 6 0.5250 0.1050 0.4200 1.2250 0.2450 0.9800A30062 5 1.1250 0.2250 0.9000 2.6250 0.5250 2.1000A310 4 0.2625 0.0525 0.2100 0.6125 0.1225 0.4900A319 2 2.5547 0.5109 2.0438 5.9609 1.1922 4.7688
A32023 3 2.5547 0.5109 2.0438 5.9609 1.1922 4.7688A33034 6 1.1250 0.2250 0.9000 2.6250 0.5250 2.1000DHC830 1 1.5469 0.3094 1.2375 3.6094 0.7219 2.8875EMB145 1 1.5469 0.3094 1.2375 3.6094 0.7219 2.8875
16.8750 3.3750 13.5000 39.3750 7.8750 31.5000
112.5
EVENING (19:00-22:00)
36.45 85.05121.5
For DNL, CNEL, NEF and ANEF
NIGHT-TIME (22:00-07:00)
33.75 78.75
DAYTIME (07:00-19:00)
145.8 340.2486
Appendix 3: 15 Hour Day Scenario INM Input Data
Page 83
ARR DEP DEP ARR DEP DEPINM Type Sector 9 09N 09S 27 27N 27S
737700 3 11.0363 2.2073 8.8290 25.7513 5.1503 20.6010737800 2 11.0363 2.2073 8.8290 25.7513 5.1503 20.6010757RR 4 2.2680 0.4536 1.8144 5.2920 1.0584 4.2336767JT9 6 2.2680 0.4536 1.8144 5.2920 1.0584 4.2336A30062 5 4.8600 0.9720 3.8880 11.3400 2.2680 9.0720A310 4 1.1340 0.2268 0.9072 2.6460 0.5292 2.1168A319 2 11.0363 2.2073 8.8290 25.7513 5.1503 20.6010
A32023 3 11.0363 2.2073 8.8290 25.7513 5.1503 20.6010A33034 6 4.8600 0.9720 3.8880 11.3400 2.2680 9.0720DHC830 1 6.6825 1.3365 5.3460 15.5925 3.1185 12.4740EMB145 1 6.6825 1.3365 5.3460 15.5925 3.1185 12.4740
72.9000 14.5800 58.3200 170.1000 34.0200 136.0800
ARR DEP DEP ARR DEP DEPINM Type Sector 9 09N 09S 27 27N 27S
737700 3 2.7591 0.5518 2.2073 6.4378 1.2876 5.1503737800 2 2.7591 0.5518 2.2073 6.4378 1.2876 5.1503757RR 4 0.5670 0.1134 0.4536 1.3230 0.2646 1.0584767JT9 6 0.5670 0.1134 0.4536 1.3230 0.2646 1.0584A30062 5 1.2150 0.2430 0.9720 2.8350 0.5670 2.2680A310 4 0.2835 0.0567 0.2268 0.6615 0.1323 0.5292A319 2 2.7591 0.5518 2.2073 6.4378 1.2876 5.1503
A32023 3 2.7591 0.5518 2.2073 6.4378 1.2876 5.1503A33034 6 1.2150 0.2430 0.9720 2.8350 0.5670 2.2680DHC830 1 1.6706 0.3341 1.3365 3.8981 0.7796 3.1185EMB145 1 1.6706 0.3341 1.3365 3.8981 0.7796 3.1185
18.2250 3.6450 14.5800 42.5250 8.5050 34.0200
ARR DEP DEP ARR DEP DEPINM Type Sector 9 09N 09S 27 27N 27S
737700 3 2.5547 0.5109 2.0438 5.9609 1.1922 4.7688737800 2 2.5547 0.5109 2.0438 5.9609 1.1922 4.7688757RR 4 0.5250 0.1050 0.4200 1.2250 0.2450 0.9800767JT9 6 0.5250 0.1050 0.4200 1.2250 0.2450 0.9800A30062 5 1.1250 0.2250 0.9000 2.6250 0.5250 2.1000A310 4 0.2625 0.0525 0.2100 0.6125 0.1225 0.4900A319 2 2.5547 0.5109 2.0438 5.9609 1.1922 4.7688
A32023 3 2.5547 0.5109 2.0438 5.9609 1.1922 4.7688A33034 6 1.1250 0.2250 0.9000 2.6250 0.5250 2.1000DHC830 1 1.5469 0.3094 1.2375 3.6094 0.7219 2.8875EMB145 1 1.5469 0.3094 1.2375 3.6094 0.7219 2.8875
16.8750 3.3750 13.5000 39.3750 7.8750 31.5000
112.5
EVENING (19:00-22:00)
36.45 85.05121.5
For DNL, CNEL, NEF and ANEF
NIGHT-TIME (22:00-07:00)
33.75 78.75
DAYTIME (07:00-19:00)
145.8 340.2486
Appendix 3: 15 Hour Day Scenario INM Input Data
Page 84
Appendix 4: Utilisation of Integrated Noise Model Software
The Integrated Noise Model Version 6.0c has been utilised for the production of
the noise contours for this project. The software works under the Microsoft
Windows environment and can be used to calculate simple Lmax calculations at
specified locations or more complex noise modelling such as the calculation of
noise contours around airports with multiple runway and route configurations.
The in-built database contains noise data for around 250 different aircraft types
or variants. The software also contains layout data for around 820 airports
within the USA. For the purposes of this project, an original study is to be set
up, the basic processes of which are described below. It should be noted that
the software has many more functions than have been used or described here.
Creating the “Study”
The “Study” is the airport, in this can our hypothetical airport, at which the
operations take place.
• When the INM software has loaded, the “New Study” function is selected
from the “File” menu.
• The “New Study” dialogue box appears where you are prompted to enter a
“New Study Name” of no more than 30 characters as well as specifying the
directory path where the study will be saved. Click “OK”
• Upon completion, you are asked “Do you want to create a new study in” and
then the path name. Click “Yes”
• Next, you are asked to “Select the units to use for your study” where the
options of “English System” or “Metric System” are presented. In this case,
we will choose the latter and click “OK”
• The “Study Setup” screen then appears where a description of the study can
be typed. The “Origin of Coordinates” screen can be used if a preinstalled
US airport is to be selected from the databases or the “latitude”, “longitude”
Appendix 4: Utilisation of Integrated Noise Model Software 1
Page 85
and “elevation” of the airport are to be specified. None of these features are
to be used on this occasion. If a US airport were selected, information such
as the coordinates, runway ends, etc, would be loaded at this point.
Choosing the Aircraft for the “Study”
• Now that the “Study” is set-up, the aircraft that operate from the Airport can
be selected. Under the “Setup” menu, select “Aircraft”.
• The Aircraft Setup dialogue box appears. From the “INM Standard Aircraft”
on the left hand side of the screen, select each required aircraft by
highlighting the choice followed by the “Include” button. The chosen aircraft
type will then move from the left hand box to the right hand “Study Aircraft”
box.
• If the required aircraft cannot be found in the list on the left hand side, the
INM manual can be consulted to find a suitable “substitute aircraft”. This is
not required in this case.
• When all the required aircraft have been moved to the “Study Aircraft” box,
click “OK”. Following this action, an “Aircraft” box will appear with details of
the chosen aircraft such as take off and landing weight, noise stage, etc.
Setting up the Runways and Routes
• From the “Tracks” menu, select the “Runway Identifiers” option.
• If a preloaded US airport has already been selected, the information in this
section will already have been loaded. In this case we will input this
information from scratch.
• The “Runway Identifiers” dialogue box is empty by default. To add a runway,
the user must press Ctrl + A. The user must then select names for “Runway
End #1” and “Runway End #2” and determine the width of the runway in
metres, followed by Ctrl + Enter to commit the details to the software. In this
Appendix 4: Utilisation of Integrated Noise Model Software 2
Page 86
case, the runway ends have been named “09” and “27” and a runway width
of 50m has been chosen.
• If additional runways are required, press Ctrl + A, else close the dialogue
box.
• Next, select the “Runway Ends” option from the “Tracks” menu. The
dialogue box will appear where the user can determine the location of the
runway ends in relation to the origin and edit other parameters such as
displaced thresholds, glide slope, etc. In this case, the centre of the runway
has been taken as the origin and runs east to west. Therefore the location of
the “09” end is –1.5250 km from the origin on the x-axis and 0 km from the
origin on the y-axis whilst the “27” end is +1.5250 km from the origin on the
x-axis and 0 km from the origin on the y-axis, thus the runway is 3050m in
length. No displaced thresholds have been specified and the standard
glideslope of 3° has been adopted. Close the dialogue box.
• Now select the “Track Identifiers” option from the “Tracks” menu. A dialogue
box appears in which the tracks for each runway can be specified. In this
case we have specified one arrival and two departure tracks for each
runway. Other options such as “sub-track” and “percentage operations” can
also be detailed here but have not been used on this occasion. Close the
dialogue box.
• Finally select the “Track Segments” option from the “Tracks” menu. Here the
user can specify the paths that each track will follow. For straight tracks,
such as the arrival routes in this case, a single straight segment is sufficient.
For the curved departure routes a total of three segments have been used
for each; one straight section followed by a turn followed by a straight
section. When inputting a turn, the angle and radius of the turn are specified.
In this case, all the routes turn through 90° with a turn radius of 5 km. Close
the dialogue box.
Appendix 4: Utilisation of Integrated Noise Model Software 3
Page 87
Setting up the Metrics
• This section need only be viewed if, as in this case, custom metrics that are
not installed within the software are required.
• From the “Setup” menu, select the “metrics” option. A dialogue box will
appear containing the inbuilt metrics. These are ‘greyed out’ such that they
cannot be edited. Each metric has a title, or “Metric ID” and belongs to a
noise “Family” and metric “Type”. The families are “A-weighted”,
“C-weighted” and “Tone-Corrected” and the types are “Exposure Based”,
“Maximum Level” and “Time-Above Based”. Each metric also has three
“Flight Multipliers” and an “Averaging Time”. The flight multipliers relate to
the different weighting given to daytime, evening and night-time movements.
The averaging time, specified as 10 LOG T in seconds, relates to the time
period over which the metric is averaged, eg 24 hours, 15 hours, etc.
• To add new metrics, press Ctrl + A and fill in the relevant information. Table
A below shows the information used to calculate both the preinstalled and
custom edited metrics used in this case:
Noise
Metric
Noise
Family
Metric
Type
Flight Multiplier Averaging Time
Day Eve Night (hr) (10LogT)
NEF Perceived Exposure 1 1 16.7 24 88*
ANEF Perceived Exposure 1 4 4 24 88*
DNL A-Weighted Exposure 1 1 10 24 49.37
CNEL A-Weighted Exposure 1 3 10 24 49.37
LDEN A-Weighted Exposure 1 3 10 24 49.37
LNIGHT A-Weighted Exposure 0 0 1 8 44.59
LAEQ16 A-Weighted Exposure 1 1 0 16 47.60
LAEQ8 A-Weighted Exposure 0 0 1 8 44.59
Table A: INM Noise Metric Data
Appendix 4: Utilisation of Integrated Noise Model Software 4
Page 88
* The 10LogT term in the cases of NEF and ANEF is incorrect. The figure of
88 relates to the -88 in the calculation for each of these metrics.
• Close the dialogue box
Creating Cases and Inputting Aircraft Movement Data
• Under the “Setup” menu, select the “Cases” Option. A dialogue box will
appear where a new case can be set-up by pressing Ctrl + A. The user must
enter a “Case ID” and a short description can also be input. “Airport
Parameters” such as temperature and headwind can be edited at this stage
but the default settings have been used in this case. For the purposes of this
exercise, two cases have been set up entitled “15 hour Day Scenario” and
“16 hour Day Scenario”. After inputting the information for a case, the user
should press Ctrl + Enter to commit the case information to the software.
Close the dialogue box.
• Under the “Ops” menu, select the “Flight Operations”. A dialogue box will
appear where the user must select which case to enter the flight operations.
Select the desired case by highlighting it and click “OK”.
• The “Flight Operations” dialogue box for the chosen case will appear. Here
the user can enter flight information for the daytime, evening and night-time
periods by aircraft type, runway, operation and route. The stage length of
the aircraft departures can also be specified under the “Profile ID” option. To
input data, the user must press Ctrl + A, enter the data for that aircraft type,
runway, etc and then press Ctrl + Enter to commit the record to the software.
This process is repeated for all the aircraft types, operations, route and
runways.
• With a large amount of data to be input, as in this case, this can be a rather
arduous task. Although the INM software saves this information as database
files, no simpler way of entering this information has been found by this
author.
Appendix 4: Utilisation of Integrated Noise Model Software 5
Page 89
• Upon completion of data entry for this case, the dialogue box should be
closed. If another case is required, as is for this assessment, the process
should be repeated.
• If cases are very similar, cases can be copied using the “Case Copy”
function under the “Setup” menu.
Running the Cases
• Once the input data is complete, the INM package must be set up to run the
cases. Under the “Run” menu, select the “Grid Setup” option. A dialogue
box will appear where the user must select which case is required. Select
the desired case by highlighting it and click “OK”.
• The Grid is basically the area over which the INM package will calculate the
noise levels of the aircraft. If it is too small, the low value contours may
continue outside the grid boundary. This said, if the grid is too large, the
computation time could be very long. In this case, the standard grid size has
been used and increased only when the model has been run and it has been
found that the grid size is too small. To add a grid, press Ctrl + A, and select
either a “Contour”, “Standard”, “Detailed”, “Location” or Population grid. For
the purposes of creating contours for this assessment, a Contour grid has
been chosen. The grid size can be adjusted by editing the “Grid Origin” and
the “Distance Between Points” option. Close the dialogue box.
• Next select “Run Options” from the “Run” menu. The “Run Options” dialogue
box will appear in which the noise metrics to be run for each of the cases can
be specified. Cases can be run for “Single-Metric” or “Multi-Metric”
scenarios. On this occasion the cases have been run for single metrics and
re-run for each metric. The “Do contours” options is highlighted and the
“refinement” and “tolerance” set to 9 and 0.01 respectively. These are
different to the default values but allow for greater precision in the calculation
of the contour values, if increasing the run time slightly. The “Low Cutoff”
Appendix 4: Utilisation of Integrated Noise Model Software 6
Page 90
Appendix 4: Utilisation of Integrated Noise Model Software 7
and “High Cutoff” values are then set to the minimum and maximum contour
values required. Close the dialogue box.
• From the “Output” menu, select the “Output Setup” option. This is where the
contour values to be produced are selected. The case for which the outputs
are required should be highlighted in the left hand box and “Metric” and
“Contour Levels” specified. The metric should be similar to that specified in
the “Run Options” menu and the maximum and minimum contour levels
should be between the low and high cutoff values. The increments between
contours should also be set at this point. Whilst increments of, for instance,
1 dB could be set, it will increase processing time and in reality we are
usually only interested in increments of say 3 or 5 dB. Close the dialogue
box.
• We are now ready to run the case(s). Select the “Run Start” option from the
“Run” menu. A dialogue box will appear in which the user can select the
cases to be included, in a similar fashion to the way in which the aircraft for
the study were chosen. Upon selection, click “OK”. The INM software will
now run the chosen case(s) whilst showing a “percentage done” value. For
the contours for this project, the average run time was around 2 to 3 minutes
on a laptop with an AMD-K6 III processor with around 96 MB of RAM.
• When the case(s) has/have been run, the contours can be viewed by
selecting the “Output Graphics” option from the “Output” menu. Again, the
user is asked to specify the output from which case are to be viewed. Select
the desired case and press “OK”. At this stage the contours have not be
computed, merely the noise levels across the grid. The contours are now
calculated and appear in a window on the screen.
• From the “Contour Display Control” dialogue box the colour and fill of the
contours can be altered as well as the inclusion or exclusion of contour
labels. From the “File” menu the contours can be printed, to scale if
required, or can be exported as .DXF files for use in design packages such
as AutoCAD.
Page 91
APPENDIX 5
RESULTANT NOISE CONTOURS FROM MODELLING EXERCISE
Page 92
INM 6.1 30-Jan-04 12:02INM 6.1 30-Jan-04 12:0215 Hr Day Scenario OUT15 Hr Day Scenario OUTScale 1 cm = 500 mScale 1 cm = 500 m
NEFNEFsq.kmsq.kmcolorcolor
25.025.025.0725.07
30.030.011.7811.78
35.035.05.305.30
40.040.02.272.27
Page 93
INM 6.1 30-Jan-04 12:11INM 6.1 30-Jan-04 12:1115 Hr Day Scenario OUT15 Hr Day Scenario OUTScale 1 cm = 500 mScale 1 cm = 500 m
ANEFANEFsq.kmsq.kmcolorcolor
20.020.038.5638.56
25.025.017.2217.22
Page 94
INM 6.1 30-Jan-04 11:39INM 6.1 30-Jan-04 11:3915 Hr Day Scenario OUT15 Hr Day Scenario OUTScale 1 cm = 500 mScale 1 cm = 500 m
DNLDNLsq.kmsq.kmcolorcolor
65.065.010.7810.78
70.070.04.404.40
75.075.01.761.76
Page 95
INM 6.1 30-Jan-04 11:54INM 6.1 30-Jan-04 11:5415 Hr Day Scenario OUT15 Hr Day Scenario OUTScale 1 cm = 500 mScale 1 cm = 500 m
CNELCNELsq.kmsq.kmcolorcolor
65.065.011.8611.86
70.070.04.904.90
75.075.01.941.94
Page 96
INM 6.1 30-Jan-04 11:11INM 6.1 30-Jan-04 11:1116 Hr Day Scenario OUT16 Hr Day Scenario OUTScale 1 cm = 500 mScale 1 cm = 500 m
LDENLDENsq.kmsq.kmcolorcolor
55.055.062.7562.75
60.060.024.4424.44
65.065.010.5910.59
70.070.04.314.31
75.075.01.731.73
Page 97
INM 6.1 30-Jan-04 11:22INM 6.1 30-Jan-04 11:2216 Hr Day Scenario OUT16 Hr Day Scenario OUTScale 1 cm = 500 mScale 1 cm = 500 m
LNIGHTLNIGHTsq.kmsq.kmcolorcolor
50.050.029.6729.67
55.055.012.6712.67
60.060.05.285.28
65.065.02.072.07
70.070.00.960.96
Page 98
INM 6.1 30-Jan-04 10:30INM 6.1 30-Jan-04 10:3016 Hr Day Scenario OUT16 Hr Day Scenario OUTScale 1 cm = 500 mScale 1 cm = 500 m
LAEQ16LAEQ16sq.kmsq.kmcolorcolor
57.057.027.2527.25
66.066.05.825.82
72.072.01.911.91
Page 99
INM 6.1 30-Jan-04 10:44INM 6.1 30-Jan-04 10:4416 Hr Day Scenario OUT16 Hr Day Scenario OUTScale 1 cm = 500 mScale 1 cm = 500 m
LAEQ8LAEQ8sq.kmsq.kmcolorcolor
48.048.043.2343.23
57.057.09.039.03
66.066.01.751.75