Superstition, Family Planning, and Human Development ∗ Quy-Toan Do † Tung Duc Phung ‡ Abstract Are “wanted” and “unwanted” children treated equally by their parents? To address this question, we rely on the observation that, according to Vietnamese astrology, dates of birth are believed to be determinants of success, luck, character and good match between individuals. We then examine fertility decisions made in Vietnam between 1976 and 1996. We find that birth cohorts in auspicious years are significantly larger than in other years. Children born in auspicious years moreover do better both in health and education. While parental characteristics seem to affect fertility choices and human development simultaneously, our analysis suggests that family planning is one key mechanism leading to the observed differences in outcomes: in a society in which superstition is widespread, children born in auspicious years are more likely to have been planned by their parents, thus benefiting from more favorable financial, psychological, or emotional conditions for better human development. Keywords: superstition, astrology, horoscope, fertility, education, health. World Bank Policy Research Working Paper 4001, August 2006 (Revised September 2006). The Policy Research Working Paper Series disseminates the findings of work in progress to encourage the exchange of ideas about development issues. An objective of the series is to get the findings out quickly, even if the presentations are less than fully polished. The papers carry the names of the authors and should be cited accordingly. The findings, interpretations, and conclusions expressed in this paper are entirely those of the authors. They do not necessarily represent the view of the World Bank, its Executive Directors, or the countries they represent. Policy Research Working Papers are available online at http://econ.worldbank.org. ∗ We would like to thank Harold Alderman, Jishnu Das, Monica Das Gupta, Do Ngoc Bach, Jed Friedman, Daniel Goodkind, Rema Hanna, Lakshmi Iyer, Ghazala Mansuri, Martin Rama, Biju Rao, Martin Ravallion, Klaus Rohland and Zurab Sajaya for helpful discussions. All remaining errors are ours. † Development Economics Research Group. The World Bank. Email: [email protected]‡ General Statistics Office. Government of Vietnam. Email: [email protected]1 WPS4001
Transcript
Superstition, Family Planning, and Human Development∗
Quy-Toan Do† Tung Duc Phung‡
Abstract
Are “wanted” and “unwanted” children treated equally by their parents? To address this
question, we rely on the observation that, according to Vietnamese astrology, dates of birth are
believed to be determinants of success, luck, character and good match between individuals.
We then examine fertility decisions made in Vietnam between 1976 and 1996. We find that birth
cohorts in auspicious years are significantly larger than in other years. Children born in auspicious
years moreover do better both in health and education. While parental characteristics seem to
affect fertility choices and human development simultaneously, our analysis suggests that family
planning is one key mechanism leading to the observed differences in outcomes: in a society
in which superstition is widespread, children born in auspicious years are more likely to have
been planned by their parents, thus benefiting from more favorable financial, psychological, or
emotional conditions for better human development.
World Bank Policy Research Working Paper 4001, August 2006 (Revised September 2006).
The Policy Research Working Paper Series disseminates the findings of work in progress to
encourage the exchange of ideas about development issues. An objective of the series is to get
the findings out quickly, even if the presentations are less than fully polished. The papers carry
the names of the authors and should be cited accordingly. The findings, interpretations, and
conclusions expressed in this paper are entirely those of the authors. They do not necessarily
represent the view of the World Bank, its Executive Directors, or the countries they represent.
Policy Research Working Papers are available online at http://econ.worldbank.org.
∗We would like to thank Harold Alderman, Jishnu Das, Monica Das Gupta, Do Ngoc Bach, Jed Friedman, Daniel
Goodkind, Rema Hanna, Lakshmi Iyer, Ghazala Mansuri, Martin Rama, Biju Rao, Martin Ravallion, Klaus Rohland
and Zurab Sajaya for helpful discussions. All remaining errors are ours.†Development Economics Research Group. The World Bank. Email: [email protected]‡General Statistics Office. Government of Vietnam. Email: [email protected]
1
WPS4001
1 Introduction
Are children born into the same family being treated equally? Most emphasis in the literature has
been put either on gender preference (Thomas, 1994, Duflo, 2003), or birth order effects (Hauser
and Sewell, 1985, Black et al., 2005). Another perspective taken on this issue consists of looking
whether “wanted” or “unwanted” children receive equal attention from their parents. This question
has been central to the literature on abortion regulation. Donohue and Levitt (2001) find that
abortion legalization in the 1970s in the United States reduced crime levels in the 1990s. Similarly,
Pop-Eleches (2006) documents that an abortion ban in Romania in 1966 induced a drop in average
schooling achievement and labor market performance for children born after the ban. Yet, several
channels may explain these findings. First, the marginal child — defined as the child who would be
born in the absence of an abortion ban (Gruber et al., 1999) — might direclty affect other children of
the same cohort because of crowding effects (Pop-Eleches, 2006). Second, the marginal child might
be born into a family with lower socio-economic status (Gruber et al., 1999), or might induce his or
her family to face adverse circumstances once born (Angrist and Evans, 1999). Finally, the marginal
child might be penalized from not being wanted: parents might be less financially, psychologically
or emotionally prepared to raise a child who has not been planned.1 While a great deal of effort has
been made in order to disentangle these channels, the adopted empirical methodologies are severely
limited. For by definition, the marginal child does not exist, so that the counterfactual is a child
born into another family living in another state or time period with differing regulation vis-à-vis
abortion. Therefore the question of the influence of parental unobservable characteristics on the
marginal child ’s subsequent development remains unanswered.2
By adopting a different approach in a different context, our paper goes a long way towards ad-
dressing this issue. We build our empirical strategy on the observation that according to Vietnamese
astrology, the year of birth of a child will determine his or her future prospects. A child born lucky is
believed to have more chances to be healthy, able, or professionally successful. Superstitious parents
1The medical literature also emphasizes the effect of maternal distress during pregnancy on the risk of child’s
schizophrenia (Myhrman et al., 1996).2Myhrman et al. (1995), Myhrman et al. (1996) look at outcomes of children whose mothers declared that the
pregnancy was unwanted. David (1986) could observe children born to mothers that had requested an abortion twice
but were denied. However, the empirical methodology adopted in all these studies compares two children in two different
families, controlling for observable characteristics, so that outcomes of siblings in families concerned with unwanted
pregnancies are not observed.
2
who put emphasis on the quality of their offspring should then time birth following the horoscope.
Consequently, Vietnamese children born in auspicious cohorts are more likely to have been the fruit
of fertility planning. The marginal child in this context is then assimilated to the child born in a
non-auspicious year. Family fixed-effect estimations allow us to make an even stronger case: by com-
paring siblings, we can control for any latent heterogeneity stemming from parental time-invariant
characteristics.
For our empirical investigation, we use household surveys undertaken in Vietnam in 1992-93 and
1997-98 to compare birth cohorts across years. Years that are believed to bring good luck to either
boys or girls have birth cohorts on average 7 percent larger than other years. Furthermore, sex
ratios seem to follow the Vietnamese horoscope: in auspicious years for boys, there is an average of
106 boys for 100 girls, suggesting that the practice of astrology-driven sex-selective abortion might
be taking place in Vietnam. When we turn to human development outcomes, we find that children
born in these auspicious cohorts have higher levels of human development. While local or family-level
characteristics might simultaneously affect the likelihood of having a child born in an auspicious year
and his or her subsequent human development, explicitly controlling for these factors mildly affects
the observed correlation between horoscope and health or education outcomes. Family fixed-effect
estimations indicate that a child born in an auspicious year for either boys or girls has a body-mass-
index-for-age z-score 0.12 points higher, and will attend school an extra 0.36 years or 0.10 standard
deviations more than his or her sibling born in an inauspicious year. Our results moreover suggest
that better health outcomes are driven by improvements in weight rather than height. If family-
level time invariant characteristics cannot alone explain the observed differences, we are left with two
competing mechanisms: it might be the case that children born lucky are either truly more fortunate,
feel more confident by being told so, or receive more attention because their environment believes
so (the “horoscope” effect); alternatively, children born in auspicious years might have parents that
are then better prepared to raise them as they are the fruit of careful fertility planning. Using the
fact that auspicious years differ across gender, and gender is not known by the time of the fertility
decision, we disentangle these two channels and find strong evidence that fertility planning is an
important determinant of subsequent human development: once controlling for the fertility planning,
the “horoscope” effect is not significant, and the coefficient capturing the fertility-planning effect is
almost unchanged. Furthermore, among children born unlucky because horoscope and gender do
not match, those who are more likely to have been planned exhibit better health and educational
outcomes later on. These results strongly suggest that children, in addition to gender and birth order
3
effects, receive unequal treatment depending on whether they have been planned or not. Whether
these differences are due to financial and psychological preparedness or to preferences remains an
open question.
In addition to the aforementioned literature on child preference and abortion, our paper, by its
cultural context, relates to the literature on religion and beliefs. Goodkind (1991, 1996) and Lee
and Paik (2006) document how the horoscope can influence birth timing among Chinese and Korean
families respectively. The former finds evidence of a “dragon-year baby boom” among the Chinese
populations of South-East Asia, while the latter shows that Korean families avoid the inauspicious
year of the horse to have children.
The paper is organized as follows: section 2 sketches the institutional framework underlying
astrology and superstition in Vietnam. We look at reduced-form results in section 3. A discussion
of the possible mechanisms underlying our findings is made in section 4, while section 5 tests the
theory. Section 6 concludes.
2 A Short Overview of Vietnamese Astrology
In this section, we describe briefly the basis of Vietnamese astrology.3 To the connoisseur, this
overview will surely look over-simplified. At the root of Vietnamese superstition is the Chinese “Y
King” (4000 years B.C.) whereby the Universe found its origin from a unique entity and from such
entity, emerged two states, Yin and Yang. Yang is as positive, masculine, left, high and tough as Yin
is negative, feminine, right, low and soft. Around 200 years B.C., during the Han dynasty, a school
of thought built a theory according to which the tension between Yin and Yang was related to the
five elements: Metal, Wood, Water, Fire and Earth. During the Tsong dynasty (10th century A.D.),
Chen Ruan made this theory into the “Fengshui”, which, among other things, predicted the destiny
of an individual based on her date of birth. A year is actually viewed as the association between a
terrestrial appellation (Zhi) and a celestial prefix (Gan). There are 12 terrestrial appellations also
known as zodiac animals (Rat, Ox, Tiger,...), while a celestial prefix is a combination of Yin or Yang
and one of the five aforementioned elements, yielding a total of 10 prefixes. The 12 zodiac animals
3As Vietnamese astrology takes its root in Chinese astrology, names and references related to astrology will hence-
forth be in Chinese, with the exception of year names which are given in Vietnamese.
4
are also in either Yin or Yang state. The Rat is Yang, while the Ox is Yin. As celestial prefixes
and terrestrial appellations need to be in the same state (Yin or Yang), the Chinese and Vietnamese
calendars are characterized by 60-year cycles.
The horoscope is then determined depending on the compatibility between the gender of the
newborn, and the celestial and terrestrial attributes of the year of birth. For example, a year
characterized by Yin is on average more compatible with girls than with boys, while the reverse
holds for Yang years. On top of that, there are compatibilities based on the elements. Table A1 in
the appendix displays the horoscope for the entire 60-year cycle. To read this table, let’s consider
the top-left corner, “Canh Ty”, which corresponds to year 1960 (modulo 60). That year is an
inauspicious year for boys and neutral for girls. A one-year increment would then consist of moving
one cell (modulo 10) to the right, and one cell (modulo 12) down. Table 1 shows for the time
period we are interested in, which years are auspicious, inauspicious, or neutral for boys and girls
respectively. A complete astral theme would also look at parents’ dates and times of birth and their
compatibility with their child’s to refine the horoscope.
3 Astrology, Fertility and Human Development Outcomes
Most Vietnamese would acknowledge that they are superstitious, and that astrology significantly
affects their daily decision-making. They would have a family fortune-teller whom they would consult
before making important decisions. Having a child is one of them. However, whether this behavior
translates into observed changes in patterns of birth that can be captured in nationally representative
surveys is an open question. This section investigates whether astrology is associated with important
decisions such as fertility choices, and how this translates into human development outcomes.
We therefore look at how fertility decisions are correlated with the Vietnamese horoscope. The
main sources of data are the two rounds of the Vietnam Living Standards Measurement Study
Survey undertaken in 1992-1993 and 1997-1998 respectively. We henceforth refer to these data sets
as VLSS93 and VLSS98, or VLSS more generically. Unless explicitly specified, we will use data
from both surveys. VLSS are household surveys that cover topics ranging from health to education,
labor activities and agricultural production, income and consumption, etc. The first wave consists
of 4800 households while the second interviews 6000 households sampled across the country. Some
5
households are interviewed in both rounds, but we will ignore the panel aspect and consider the two
surveys as repeated cross-sections. We drop observations corresponding to children born during the
survey years, as the timing of the survey would imply smaller observed cohorts in these years. Finally,
due to the mismatch between lunar and solar calendars, years of birth have been re-computed so
that say 1986 henceforth corresponds to the year of the Tiger (from February 9th, 1986 to January
29th, 1987). The year of birth of a child born in January 1986 will hence be coded 1985.
Our empirical methodology is simple: we first check at whether birth cohorts are significantly
larger in auspicious years, and then look at how human development outcomes correlate with the
horoscope. We will focus solely on individuals born in and after 1976, as the country was at war in
the previous years. Moreover, birth timing is believed to be a fairly recent phenomenon as concerns
for child quality started becoming more pressing. Goodkind (1991), while looking at whether fertility
decisions during the auspicious year of the Dragon concludes “that the Dragon Year was not a salient
factor in Chinese fertility-timing decisions until 1976” (p. 666). Finally, in all regressions, unless
specified otherwise, standard errors will be clustered at the year-of-birth level (see Bertrand et al.,
2004).
3.1 Astrology and Fertility Timing
A first test of the effect of superstition consists of looking at whether the choice of the year of birth
of children is driven by Vietnamese astrology:
(1) lnNt = a0 + a1t+ a2t2 + cGt + et,
in which Nt is the national-level aggregate number of children born in year t, Gt is the dummy
variable that is equal to 1 if year t is an auspicious year according to Vietnamese astrology, and 0
otherwise.4
As discussed in Section 2, male are “Yang” and female are “Yin”, so that horoscopes for boys
and girls are likely to be different. We will thus adopt several specifications for variable Gt : (i)
whether year t brings luck to boys, (ii) girls, (iii) both, or (iv) either. We will henceforth designate
Gbt , Ggt , G
andt , and Gort the dummy variables that are equal to 1 when year t is auspicious for boys,
girls, both and either respectively, and 0 otherwise. When Gt = 0, year t can be either neutral or4Nt is computed by aggregating information from VLSS98 only.
6
inauspicious. Given that the horoscope for boys differs than the one for girls, this leaves a large
number of potential explanatory variables to look at. Our field work nevertheless suggests that in
the case of Vietnam, parents care more about whether the year is auspicious or not, while they pay
less attention to years considered as inauspicious.5
The results of the estimation of (1) are shown in Table 2 panel A. The first two columns show
significantly larger cohort sizes in years that are auspicious for either boys or girls. The difference
is estimated to be around 7 percent. This figure is of the same order of magnitude than earlier
findings from Goodkind (1996) who finds between 12 and 22 percent increase in fertility during the
years of the Dragon (1976, 1988) among Chinese households in Singapore. It moreover seems that
the differences are mainly driven by years that are auspicious for boys. First, columns (1) and (2)
give coefficients of similar magnitude, and second, columns (4) and (5) do not show any significant
correlation between cohort size and horoscope for girls. Column (5) restricts the sample to years
that are inauspicious for boys exclusively. Although the coefficient on the variable “auspicious for
girls” is positive, it is not significant. We also tested for first and second order serial correlation, and
could not reject the null hypothesis of no serial correlation of the error terms.
Graphically, the effect of astrology can be captured in Figure 1. The horizontal axis represents
time. The smooth line predicts birth rates at the national level (predicted value of the regression
of the logarithm of cohort size against a quadratic time trend), while the connected line shows
actual country-level cohort sizes. We first notice a sharp fertility transition since the end of the
1980s, coinciding with the beginning of the “Doi Moi”, or transition towards a market economy.
The results found above indicate that most auspicious years (for boys, for girls, or both) are above
the predicted line. Finally, if we add an extra observation corresponding to 1997 (column (6)), the
results are similar to column (1), once we have readjusted cohort size and taken into account that 2
to 3 months have been truncated due to the timing of the survey.
Although Vietnamese, Chinese and Korean horoscope are similar, we can see graphically that
Vietnamese data exhibit neither a “dragon-year baby boom” in 1976 or 1988, nor a “horse-year baby
bust” in 1978 or 1990 contrary to the findings of Goodkind (1996) or Lee and Paik (2006). One reason
for this, is that according to Vietnamese astrology, the year of the dragon is not systematically an
5Lee and Paik (2006) on the contrary find evidence that parents in South Korea tend to avoid having children in
the inauspicious year of the horse.
7
auspicious year; it is actually not so in our sample as shown in Table 1. Similarly, the year of the
horse is not always bad omen either. Moreover, our field experience tends to suggest that Vietnamese
people know little about astrology, but heavily rely on fortune-tellers when it comes to fertility timing.
They are then likely to be advised according to the full horoscope rather than the sole zodiac animal
as seems to be the case for Chinese or Korean populations.
3.2 Astrology and Abortion
If parents seem to deliberately choose auspicious years to have children, this requires the use of con-
traceptive methods. However, we do not have information on reproducive health in the VLSS, and
even if we did, the information would be contemporaneous, hence of little interest to our analysis.
Furthermore, reliable data on abortions are not available but for few recent years only. Nevertheless,
using the fact that the horoscope generally differs for boys and girls, a theory of astrology-based
fertility planning would predict sex-selective abortion which is correlated with the horoscope. Super-
sititious parents who planned to have a child in a year exclusively auspicious for boys (resp. girls),
and who learn that they are expecting a girl (resp. boy), might want to terminate pregnancy.
To test this issue, we estimate (1), with Nt being the national-level aggregate number of boys
(resp. girls) born in year t. The results of the regressions are displayed in Table 2 panel B. The
differences in patterns observed for boys and girls cohorts are suggestive of sex-selective abortion
taking place.6 In the absence of sex-selective abortion, the patterns observed should be statistically
indiguishable from the results in Table 2 panel A. Yet, we see that boys cohort sizes do strongly
respond to astrology (columns (1) to (4)), while no significant effect is detected for girls (columns (5)
to (8)). To formally test whether cohort sizes for boys and girls are equally affected by astrology, we
estimate (1) with the logarithm of the sex ratio (number of boys divided by number of girls) on the
left-hand side. Under the hypothesis of no astrology-related sex-selective abortion, the coefficient
c should be equal to zero. In addition to the common variables Gort , Gbt and G
gt , we look at the
correlation with the variables Gbt −Gandt and Ggt −Gandt which are equal to 1 when year t is a
good year for boys (resp. girls) exclusively. If parents care about having a lucky year, the child
needs to be born in an auspicious year and have the gender which enjoys the good omen that year.
6We omit from our argument the possibility that (i) parents have the ability to choose the gender of their child
before pregnancy is started, and (ii) infanticide is a common practice.
8
Astrology-based sex-selective abortion would predict that in years auspicious for boys only (resp.
girls only), the sex ratio should be higher (resp. lower) than average, which in our case is equal to 1.
Table 2 panel C shows the regression results which suggest that astrology-based sex-selective abortion
is indeed taking place in Vietnam. In years auspicious for boys exclusively, there is an average of
107 boys for 100 girls (column (4)), while in years auspicious for girls exclusively, we on the other
hand find that there is an average of 95 boys for 100 girls (column (7)). However, robustness checks
suggest that the phenomenon observed for girls might capture a mean-reversion phenomenon: if
boy-biased sex-selective abortion is taking place, then years in which no such practice is undertaken
will mechanically exhibit a relatively lower sex ratio. This is even more important than horoscope for
boys and girls tend to be negatively correlated. We therefore control for years that are not auspicious
for boys only, and the measured effect drops significantly and ceases to be significant (column (8)).
The overall results presented so far suggest that broadly speaking fertility timing does follow
Vietnamese astrology. A closer look indicates that astrology-based fertility decisions are potentially
gender biased. First, the horoscope for boys is found to have a stronger effect on cohort sizes than the
horoscope for girls does. This however may not necessarily mean that parents have a son preference.
An alternative explanation lies in the relative frequencies of auspicious years for boys and for girls.
While half of the years in our sample are auspicious for boys, less than a third are good omen for
girls. It is then more costly to parents to time fertility according to girls’ horoscope. Second, looking
at patterns of sex ratios, we find compelling evidence that astrology-driven sex-selective abortion
is taking place in Vietnam. Similarly, it seems that this practice is gender-biased in the sense that
pregnancies might be terminated in years auspicious for boys only, when parents realize that they
are expecting a girl. We do not find convincing evidence that the reverse holds in years auspicious
for girls. As in the previous argument, the first explanation which comes to mind has to do with
outright son preference. However, if the horoscope is not “binding” for girls, then we should not
observe any sex-selective abortion in years auspicious for girls exclusively. Evidence obtained so far
yet does not allow us to privilege one or the other channel.
3.3 Astrology and Human Development: Preliminary Evidence
The next step of the investigation consists of looking at children’s human development outcomes, and
see whether children born in better years actually have better prospects in life. Human development
9
outcome indicators include the number of years of schooling the child completed by the time of
the survey. Limited information on school performance does not allow us to assess the quality of
education. As far as health is concerned, VLSS surveys include anthropometric information. From
data on height and weight, we compute the body mass index (BMI) for each child. The BMI of
an individual is the ratio between her weight (in kg) and the square of her height (in m). We then
compute the z-scores for these anthropometric measures using the UK reference growth charts. The
computation follows Cole (1990). The measures hence obtained are arguably comparable across
gender and age groups; even though the reference group consists of British individuals, they apply
to other countries as well (see Wagstaff et al., 2003 for an application to Vietnam). As expected,
Vietnamese children are well below the UK average. They are more than two standard deviations
below the UK reference average height and weight (see Table 3, panel A). The average BMI of our
sample is also more than one standard deviation below UK reference group average. Although the
construction of such scale was aimed at addressing the issue of childhood obesity in the UK (see Cole
et al., 2000), these measures are also informative about the extent to which Vietnamese children
are undernourished or malnourished (Wagstaff et al., 2003). Thus, in our sample, an increase in
any of the aforementioned anthropometric measures will consistently indicate better health status
on average. Table 3 shows the average weight, height, BMI and years of schooling for our sample
population. Children in our sample are 12 years old on average, and are 1.3 m tall, weighing 29 kg,
with an average of 5 years in school.
We then estimate the following equation:
(2) Yij = a0 + a1tij + a2t2ij + cGij +Xijb+ eij ,
in which Yij is the outcome of interest (education and health) for child i born in year tij into family
j, and Xij includes individual controls: i’s gender and i’s birth order. Our main specification consists
of considering Gorij , the dummy variable which is equal to 1 if child i is born in a year auspicious for
either boys or girls, and 0 otherwise.7
Table 4 panel A shows the result from the estimation of (2) .We observe a statistically significant
difference in human development between children born in auspicious years and those not. Whether
we look at years of education or BMI-for-age, boys and girls born in these years considered to be
auspicious for either boys or girls, perform better on average. The result on schooling (columns (2),
7Unless specified otherwise, auspicious years will henceforth refer to these years for which Gorit = 1.
10
(6), and (10)) shows a positive effect of 0.13 standard deviations. This corresponds to a three month
difference. Moving to health outcomes, even though children born in auspicious years exhibit larger
BMI-for-age (up to 0.18 standard deviations for girls, column (9)), there is no conclusive evidence
at this stage regarding what is driving the observed differences in BMI-for-age. The sign on the
interaction between the horoscope of the year of birth and the child’s birth order is consistently
negative across specifications, but rarely significant.
4 What are the Mechanisms at Work?
We now review possible factors that have been omitted from equation (2) and which could plausibly
drive the observed results.
4.1 Commune-Level Determinants
A first question to address relates to the environment into which children born in auspicious years
belong. It might be the case that the extent of superstition in a community is positively correlated
with some commune-level characteristics that are conducive to better human development outcomes
for children. Communes in which the social norm is stronger or better enforced, could arguably be
communes in which peer effects and role models are more pervasive. Parents are then more likely
to follow the norm in terms of both superstition, and child care. On the other hand, time varying
commune characteristics, such as the size of the cohort a child belongs to, can have a direct effect on
his or her subsequent human development outcomes. In the case of cohort size, we would however
expect such variable to have a negative effect on health and education. The literature on class size
and school performance has promoted a congestion view, whereby larger class sizes make learning
more difficult (see e.g. Angrist and Lavy, 1999). Peer effects on the other hand translate into a
positive externality that a child can have on other children’s learning or school attendance, and
hence a positive relationship between cohort size and schooling. As far as health is concerned, the
notion of congestion of health centers at time of birth comes to mind naturally, but one can think of
reasons to believe that there might also be positive externalities: larger birth cohorts might receive
11
better care if, for example, extra health personnel is mobilized.8
4.2 Family-Level Characteristics
Children born in auspicious years may be born in families with different characteristics. Superstitious
parents who are more able or willing to invest in child care might also be able to time fertility
according to the horoscope more carefully. Alternatively, parents who consult a fortune-teller to make
their fertility decision might also be more open to third-party advice on child care and education. A
direct effect of this is the number of siblings a child might have. If parents want to put an emphasis
on quality rather than quantity of their offspring, choosing to have fewer children and timing fertility
according to astrology are two instruments to achieve that end. Children born in auspicious years
can also end up in smaller families when parents adopt some “lucky-child” stopping rules similar
to the male-preferring stopping rules of Yamaguchi (1989). Thus, as in the case of son preference
documented by Jensen (2002), children born lucky may have more parental resources to enjoy.
4.3 Horoscope versus Fertility Planning
When asking why differences in child outcomes arise, most people in Vietnam will answer in ac-
cordance with their degree of superstition. The answer could very well be that children born lucky
might indeed be privileged by Nature. Alternatively, parents believing that children born lucky
have better innate ability will invest more, provided that ability and investment are complement.
Finally, children learning from their environment that they are born under a lucky star might be
more self-confident. While this might not translate into better health, self-confidence at early ages
can arguably have an impact on schooling and subsequently on the labor market (see Persico et al.,
2004).
An alternative rationale relies on the fertility planning argument made earlier on. Superstitious
parents plan to have children during auspicious years, and one consequence of such careful planning
is financial, psychological, and emotional readiness. Thus, what matters in determining human
development outcomes is ex-ante preparedness rather than ex-post luck. Children born in lucky
8Note that in order to get a convex relationship between cohort size and health care quality, lumpiness of investments
(personnel, infrastructure, assets) needs to be assumed.
12
years grow in a more privileged environment.
As opposed to the discussion made previously, differences in outcomes are here driven by family-
level time-varying rather than time-invariant characteristics.
5 Empirical Results
We now test the hypotheses discussed in the previous section. We look at a specific class of variables
that can be omitted when estimating equation (2); these are commune-level or family-level deter-
minants. First, superstition can be a community-wide feature, and at the same time be associated
with other social norms affecting human development. Second, parental characteristics can drive
both fertility timing and child care. And third, the number of children in a household can be driven
by parental superstitious behavior, but might also directly affect human development outcomes, in-
dependently of parental characteristics. We investigate empirical evidence on these three issues in
turn.
5.1 Characterizing the “Superstitious” Family
It is not possible to directly measure the degree of superstition with our current survey instrument.
We will instead look at outcomes, i.e. whether the first child of a family is born in an auspicious
year. By doing so, we capture both willingness and ability to time birth, rather than the only extent
of superstition.
5.1.1 What Parents are Superstitious?
We want to see whether the propensity to be superstitious is correlated with socio-economic deter-
minants. To assess, though imperfectly, a family’s level of superstition, we observe the year of birth
of the first child. A family will therefore be considered as superstitious if and only if the first child
is born in an auspicious year. We then estimate the following linear probability model:
(3) Fj = α+ βXj + εj,
13
where Fj is a dummy variable equal to 1 if the first child in family j is born in an auspicious year,
and 0 otherwise; Xj is a vector of parental (and commune-level) characteristics. Table 5 panel A
shows the results from the estimation of (3).9 We find that when parents are older, the first child
is relatively less likely to be born in an auspicious year for either boys or girls, or just for boys
(columns (1) and (5)). This is consistent with the idea that older parents have less time ahead of
them to choose the year of birth of their first child. More interestingly, we find that when mothers are
more educated and fathers are less so, then the first child is more likely to be born in an auspicious
year. The effect is not significant for fathers’ education in the simplest specifications (columns (2)
and (6)) but holds when we control for family per-capita expenditure (columns (4) and (8)). While
other mechanisms could explain these findings, the results are consistent with the commonly-shared
view in Vietnam that among parents, women are the ones who are superstitious. The signs of the
coefficients on mother’s and father’s education then reflect the extent of relative bargaining power
in the household when it comes to, among other things, fertility decision.10 Surprisingly, no effect of
real per capita expenditure is detected (columns (3) and (7)).
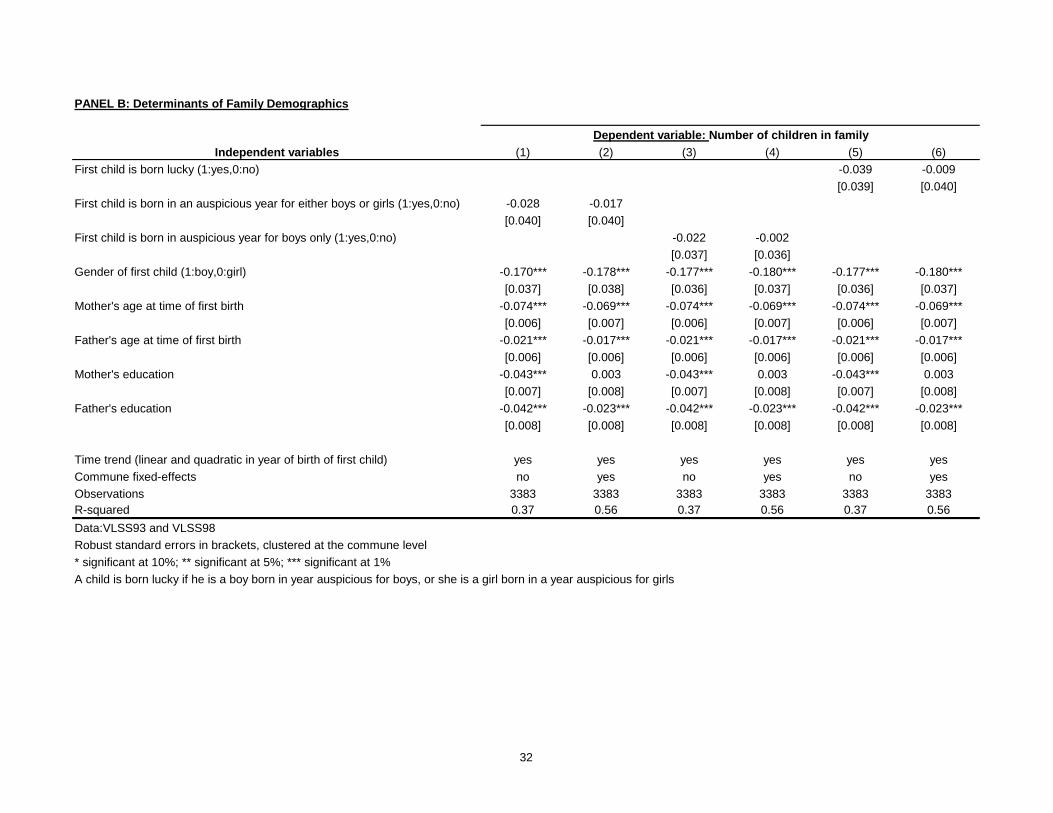
5.1.2 Astrology and Family Size
We push the analysis further by looking at how superstition correlates with family size. To test
whether the channels discussed in section 4 can be detected in the data, we propose the following
model:
(4) Hj = a+ cFj +Xjb+ ej ,
in which Hj is family j s number of children, and Fj is the dummy which is equal to 1 if the first
child in family j is born in an auspicious year. Note that family will refer to the nuclear household
(parents and children), while household refers to the more standard survey definition. To test the
first channel described above, Fj will be the dummy variable which equals 1 if the first child in
family j is born in a year auspicious for either boys or girls (Gor = 1), or alternatively lucky for
boys Gb = 1 . For the second channel, Fj will be equal to 1 if and only if the first child in family
j, is born lucky, i.e. she is a girl born in a year auspicious for girls, or he is a boy born in a year
auspicious for boys.9We also ran probit specifications, without any noticeable differences.10An alternative explanation is the more educated women are more able to control fertility. However such argument
could not at the same time explain the negative effect of fathers’ education.
14
The results of the estimation of (4) are shown in Table 5 panel B. Columns (1) to (4) test the first
channel, while columns (5) and (6) look for evidence of a “lucky-child” preference. All the results
do not lend support to the mechanisms which might relate superstition to household size, although
the coefficients on Fj are consistently negative across various specifications. In the results presented
in Table 5, standard errors were clustered at the family level. The correlation with other covariates
(parents’ age at time of first birth, or parents’ education) are as expected: when parents are older
when the first child is born, they end up having fewer children; educated parents have fewer children
as well. Finally, not surprisingly either given Vietnam’s known son preference, when the first child
is a boy, the family ends up being smaller in size.
5.2 Fertility Planning and Human Development
We have documented in the previous section the fact that parental characteristics might be related
with the willingness or ability to time birth according to Vietnamese astrology. To what extent do
these characteristics drive the observed differences shown in section 3? We address this issue next.
5.2.1 Astrology and Human Development: Further Evidence
We include household, parental and commune-level controls in the estimation of (2). The results
in Table 4 panel B are qualitatively similar to the estimates provided in panel A. Although par-
ents’ background might affect their behavior, observable characteristics do not essentially drive the
observed positive correlation between astrology and human development outcomes.
To control for latent heterogeneity, we also run family-level fixed effect regressions. The results
are presented in Table 4, panel C. The results are consistent with the ones presented previously.
Children born in an auspicious year will achieve higher levels of schooling than their siblings born in
non-auspicious years (column (2)). As far as health is concerned, the result is similar: BMI-for-age
will be larger for children born in auspicious years, compared to their “unlucky” siblings (column
(1)). Under family fixed-effect specifications, the interaction term between horoscope and birth
order is negative and significant (columns (1) and (2)), suggesting that the effect is stronger for first
children. Finally, the results presented in columns (3) and (4), suggest that the observed better
15
health is mostly driven by weight (column (4)) rather than height (column (3)).11
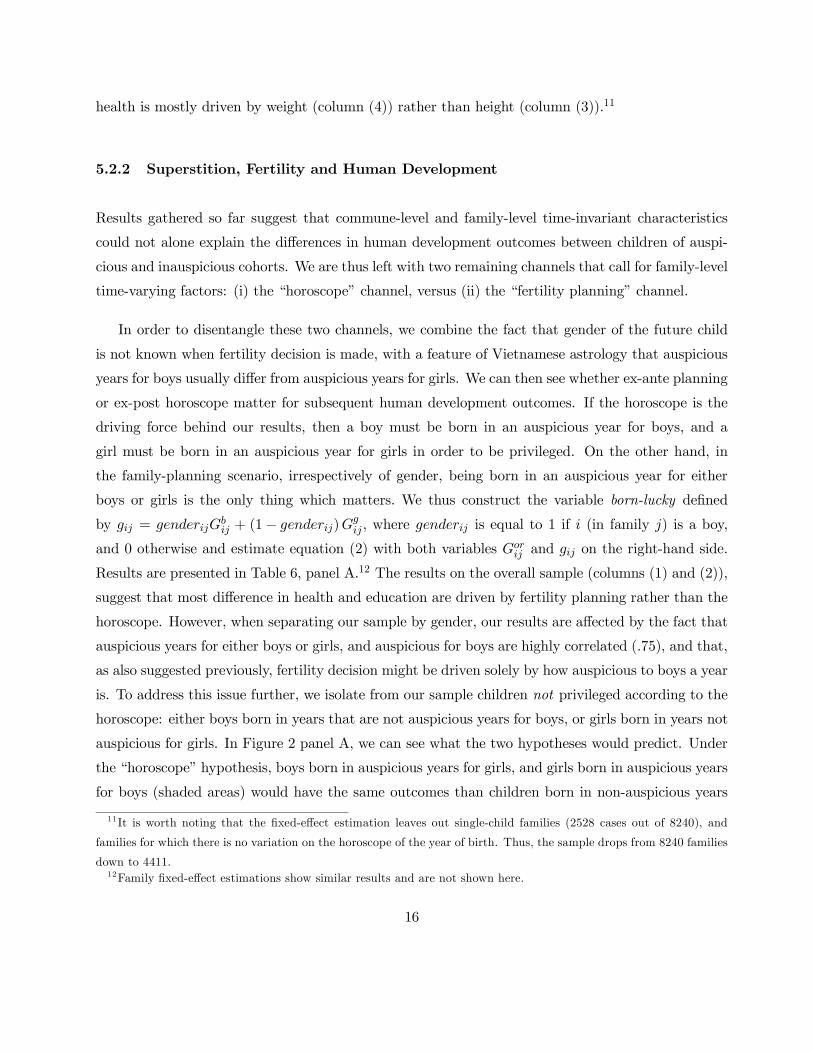
5.2.2 Superstition, Fertility and Human Development
Results gathered so far suggest that commune-level and family-level time-invariant characteristics
could not alone explain the differences in human development outcomes between children of auspi-
cious and inauspicious cohorts. We are thus left with two remaining channels that call for family-level
time-varying factors: (i) the “horoscope” channel, versus (ii) the “fertility planning” channel.
In order to disentangle these two channels, we combine the fact that gender of the future child
is not known when fertility decision is made, with a feature of Vietnamese astrology that auspicious
years for boys usually differ from auspicious years for girls. We can then see whether ex-ante planning
or ex-post horoscope matter for subsequent human development outcomes. If the horoscope is the
driving force behind our results, then a boy must be born in an auspicious year for boys, and a
girl must be born in an auspicious year for girls in order to be privileged. On the other hand, in
the family-planning scenario, irrespectively of gender, being born in an auspicious year for either
boys or girls is the only thing which matters. We thus construct the variable born-lucky defined
by gij = genderijGbij + (1− genderij)Ggij , where genderij is equal to 1 if i (in family j) is a boy,
and 0 otherwise and estimate equation (2) with both variables Gorij and gij on the right-hand side.
Results are presented in Table 6, panel A.12 The results on the overall sample (columns (1) and (2)),
suggest that most difference in health and education are driven by fertility planning rather than the
horoscope. However, when separating our sample by gender, our results are affected by the fact that
auspicious years for either boys or girls, and auspicious for boys are highly correlated (.75), and that,
as also suggested previously, fertility decision might be driven solely by how auspicious to boys a year
is. To address this issue further, we isolate from our sample children not privileged according to the
horoscope: either boys born in years that are not auspicious years for boys, or girls born in years not
auspicious for girls. In Figure 2 panel A, we can see what the two hypotheses would predict. Under
the “horoscope” hypothesis, boys born in auspicious years for girls, and girls born in auspicious years
for boys (shaded areas) would have the same outcomes than children born in non-auspicious years
11 It is worth noting that the fixed-effect estimation leaves out single-child families (2528 cases out of 8240), and
families for which there is no variation on the horoscope of the year of birth. Thus, the sample drops from 8240 families
down to 4411.12Family fixed-effect estimations show similar results and are not shown here.
16
(dotted areas). However, under the “fertility planning” hypothesis, the former would exhibit higher
levels of human development than the latter would. Table 6 panel B shows consistent results that
among these unlucky children, those who were born in a year auspicious for either boys or girls are
doing better than otherwise; even though the horoscope is not favorable to these children, being
the fruit of fertility planning translates into better subsequent human development. These results
confirm our presumption that fertility planning might play a role in explaining the differences in
human development across birth cohorts. Finally, under the hypothesis that astrology-based fertility
planning concerns boys only, we restrict further our sample to girls only: we compare girls born lucky
in a year inauspicious for boys (shaded areas in Figure 2 panel B), with girls born unlucky in a year
auspicious for boys (dotted areas). The regression results are showed in Table 6, panel C. The result
for education suggests that for girls, being born in an auspicious year for boys matters beyond and
above the actual ex-post horoscope.
5.3 Who is the “Marginal Child”? A Tale of Child Preference and its Implication
for Targeting
The conclusions drawn from the analysis above complements the findings of the earlier litterature,
which primarily dealt with the issue of abortion. The analyses of the impact of abortion regulation
usually find evidence that the marginal child is worse off when abortion is banned. The reasons often
invoked either refer to the socio-economic situation of the parents of the marginal child, or to general
equilibrium effects.
Our analysis yet suggests a different story: children who are the outcome of fertility planning
are better taken care of. We find evidence of planned-child preference: parents can or want to take
better care of children who have been planned. The finding that there are within-family inequalities
potentially has implications for how one wants to implement social programs aimed at children.
An interpretation of our findings is that targeting based on parental characteristics might not be
sufficient to reach the child who needs it most. A child born to parents above the poverty line can
well qualify as poor, vice and versa. If female stipend programs are well-suited to address the issue
of male preference (see Khandker et al., 2003), they crucially (and implictly) rely on the fact that
gender is observable. On the other hand, “being-planned” is not a salient feature, which makes
contingent policies not implementable.
17
In our context, we can nevertheless try to characterize families for which planned-child preference
is binding. We estimate (2) with family fixed-effects and interaction terms. Table 7 displays the
regression results. We considered both hypotheses that astrology-based fertility might and might
not be boy-biased. It is worth noting that larger families are more prone to have a planned-child
preference as far as health outcomes are concerned (columns (1) and (5)). This result is fairly
intuitive as larger families are more likely to have unplanned children, and resources per child are
scarcer. An unexpected finding is the positive and significant coefficient on the interaction between
the astrology variables and expenditure (columns (2) and (6)). It is all the more interesting than
planned-child preference among the rich seems to be driving the observed differences in schooling.
Finally, birth order and gender do not seem to affect parental child preference as far as education is
concerned. However, when it comes to health outcomes, we see an effect of gender on both height
and weight, translating to a negative effect on the BMI.
This preliminary analysis sheds some light on the patterns of child preference among Vietnamese
families. The results do not allow for definitive conclusions. There is some evidence of gender and
birth order affecting parental planned-child preference, and it also seems that child preference is
stronger among wealthier parents. On the latter point, when it comes to targeting, the question is
now to determine who to prioritize: the “marginal child” in the “average family”, or the “average
child” in the “marginal family”? Targeting based on child characteristics could be an option; social
programs with a within-family redistributive property or a familiy-level public good component
might also go a long way towards mitigating the potential within-family inequality documented in
this paper.
6 Conclusion
Superstition in Vietnam seems pervasive. Years that might bring luck to girls or boys have birth
cohorts 7 percent larger on average than other years. We find that overall, being born in these
years increases BMI-to-age z-score by 0.12 points, and years of schooling by almost 4 months or 0.12
standard deviations. Family fixed-effects estimations deliver comparable results, which induces us to
claim that such differences are due to a fertility planning effect: parents who have planned their child
have more favorable financial, psychological or emotional conditions to invest in his or her future
human development.
18
One question however remains: what explains the persistence of superstition? If persistence
of superstitious beliefs is driven by observational data, why don’t parents factor out the effects
described in the paper? One reason relates to informational cascades and herding (see e.g. Banerjee,
1992, Welch, 1992). If, for any reason, caring parents all have children born in auspicious years, then
there is no counterfactual to disentangle the impacts of nature versus nurture, or in other words,
lucky-birth effects from fertility planning effects. Thus information stops flowing, and no updating
takes place. Steady-state beliefs can well put a positive probability on the fact that being born lucky
does improve human development. An alternative explanation is discussed in Anderson (1988), who
revisits the arguments of Adam Smith regarding religious participation. Those could apply in the
context of superstition in Vietnam: superstitious beliefs could in part be seen as signaling devices
for parents trying to build reputation for being good parents. They then hope to adhere to a social
network of other good parents, so that their children can grow among other well-educated children.
Empirical evidence supporting these mechanisms is an independent research agenda.
19
References
[1] Anderson, G., “Mr. Smith and the Preachers: The Economics of Religion in the Wealth of Nations”,
Journal of Political Economy, 96(5): 1066-88. 1988.
[2] Angrist, J., and V. Lavy, “Using Maimonides’ Rule to Estimate the Effect of Class Size on Student
Achievement”, Quarterly Journal of Economics, 114(2): 533-75. 1999.
[3] Banerjee, A., “A Simple Model of Herd Behavior”, Quarterly Journal of Economics, 107(3): 797-818.
1992
[4] Bertrand, M., E. Duflo, and S. Mullainathan, “How Should We Trust Difference-in-Differences Esti-
mates?”, Quarterly Journal of Economics, 119(1): 249-75. 2004
[5] Black, S., P. Devereux and K. Salvanes, “The More the Merrier? The Effect of Family Size and Birth
Order on Children’s Education”, Quarterly Journal of Economics, 120(2): 669-701. 2003.
[6] Cole, T., “The LMS method for constructing normalized growth standards”, European Journal of Clinical
Nutrition, 44: 45-60. 1990.
[7] Cole, T., M. Bellizzi, K. Flegal, and W. Dietz, “Establishing a standard definition for child overweight
and obesity worldwide: international survey.” British Medical Journal, 320(7244): 1240-3. 2000.
[8] David, H., “Unwanted Children: A Follow-Up from Prague”, Family Planning Perspectives, 18(3): 143-44.
1986.
[9] Donohue, J., and S. Levitt, “The Impact of Legalized Abortion on Crime”, Quarterly Journal of Eco-
nomics, 116(2): 379-420. 2001.
[10] Duflo, E., “Grandmothers and Granddaughters: Old-Age Pensions and Intrahousehold Allocation in
South Africa”, World Bank Economic Review, 17(1): 1-25. 2003.
[11] Goodkind, D., “Creating New Traditions in Modern Chinese Populations: Aiming for Birth in the Year
of the Dragon”, Population and Development Review, 17(4): 663-86. 1991.
[12] Goodkind, D., “Chinese Lunar Birth Timing in Singapore: New Concerns for Child Quality Amidst
Multicultural Modernity”, Journal of Marriage and the Family, 58(3): 784-95. 1996.
20
[13] Gruber, J., P. Levine, and D. Staiger, “Abortion Legalization and Child Living Circumstances: Who is
the “Marginal Child”?”, Quarterly Journal of Economics, 114(1), 263-92. 1999
[14] Hauser, R. and W. Sewell, “Birth Order and Educational Attainment in Full Sigships”, American Edu-
cational Research Journal, 22: 1-23. 1985.
[15] Jensen, R., “Equal Treatment, Unequal Outcomes? Generating Sex Inequality Through Fertility Behav-
ior”, mimeo Harvard University. 2002.
[16] Khandker, S., M. Pitt, and N. Fuwa, “Subsidy to Promote Girls’ Secondary Education: The Female
Stipend in Bangladesh”, mimeo 2003.
[17] Lee, J., and M. Paik, “Sex preferences and Fertility in South Korea during the Year of the Horse”,
Demography, 43(2). 2006.
[18] Myhrman, A., P. Olsen, P. Rantakallio, and E. Laara, “Does the Wantedness of a Pregnancy Predict a
Child’s Educational Attainement?”, Family Planning Perspectives, 27(3): 116-19. 1995.
[19] Myhrman, A., P. Rantakallio, M. Isohanni, P. Jones, and U. Partanen, “Unwantedness of a Pregnancy
and Schizophrenia in the Child”, British Journal of Psychiatry, 169: 637-40. 1996.
[20] Persico, N., A. Postlewaite, and D. Silverman, “The Effect of Adolescent Experience on Labor Market
Outcomes: The Case of Height”, Journal of Political Economy, 112(5): 1019-53.
[21] Pop-Eleches, C. “The Impact of an Abortion Ban on Socioeconomic Outcomes of Children: Evidence
from Romania”, Journal of Political Economy, 114(4): 744-73. 2006.
[22] Thomas, D., “Like Father, Like Son; Like Mother, Like Daughter. Parental Resources and Child Height”,
Journal of Human Resources, 29(4): 950-88. 1994.
[23] Wagstaff, A., E. van Doorslaer, and N. Watanabe, “On decomposing the causes of health sector in-
equalities with an application to malnutrition inequalities in Vietnam”, Journal of Econometrics, 112(1):
207-223. 2003.
[24] Welch, I., “Sequential Sales, Learning and Cascades”, Journal of Finance, 47(2): 695-732. 1992.
[25] Yamaguchi, K. “A Formal Theory for Male-Preferring Stopping Rules of Child-Bearing: Sex Differences
in Birth Order and in the Number of Siblings,” Demography, 26(3): 451-65. 1989.
21
B&GB&G G
B
B
B
BG
B&GB
B
B
G
66.
26.
46.
66.
8
1975 1980 1985 1990 1995Year of birth
log of cohort size predicted log of cohort size
Auspicious Years for Boys (B), Girls (G), or both (B&G)Figure 1: Superstition and Fertility: 1976-1996
22
Figure 2: Astrology and Human development outcomes: theoretical predictions
PANEL A: Horoscope versus Family Planning
Auspicious year for boys Auspicious year for girls Non-auspicious year
Boys + -- --
Girls -- + --
Auspicious year for boys Auspicious year for girls Non-auspicious year
Boys + + --
Girls + + --
PANEL B: Male-biased Horoscope versus Family Planning
Auspicious year for boys Auspicious year for girls Non-auspicious year
Girls -- + --
Auspicious year for boys Auspicious year for girls Non-auspicious year
Girls + -- --
Horoscope hypothesis
Family planning hypothesis
Male-biased horoscope hypothesis
Family planning hypothesis
23
Table 1: Vietnames horoscope 1975-1997
Birth year Name of year* Boy Girl
1975 At Mao Bad luck Neutral
1976 Binh Thin Neutral Bad luck
1977 Dinh Ty Neutral Bad luck
1978 Mau Ngo Good luck Good luck
1979 Ky Mui Good luck Good luck
1980 Canh Than Bad luck Bad luck
1981 Tan Dau Neutral Good luck
1982 Nham Tuat Good luck Bad luck
1983 Quy Hoi Good luck Neutral
1984 Giap Ty Good luck Bad luck
1985 At Suu Bad luck Bad luck
1986 Binh Dan Neutral Bad luck
1987 Dinh Mao Good luck Bad luck
1988 Mau Thin Neutral Neutral
1989 Ky Ty Bad luck Neutral
1990 Canh Ngo Neutral Good luck
1991 Tan Mui Good luck Good luck
1992 Nham Than Good luck Bad luck
1993 Quy Dau Good luck Bad luck
1994 Giap Tuat Good luck Neutral
1995 At Hoi Neutral Good luck
1996 Binh Ty Neutral Neutral
1997 Dinh Suu Good luck Bad luck
* Name of year is given in VietnameseData source: see Table A1
24
Table 2: Birth cohort sizes and horoscope (1976-1996)
PANEL A: Overall sample
Independent variables (1) (2) (3) (4) (5) (6)Year auspicious for either boys or girls (1:yes,0:no) 0.070** 0.071**
[0.033] [0.032]Year auspicious for boys (1:yes,0:no) 0.064*
[0.033]Year auspicious for both boys and girls (1:yes,0:no) 0.015
[0.034]Year auspicious for girls (1:yes,0:no) 0.009 0.048
[0.034] [0.040]Year of birth 11.760*** 11.663*** 12.301*** 12.291*** 11.192*** 11.493***
Observations 21 21 21 21 14 22R-squared 0.88 0.88 0.85 0.85 0.89 0.91Durbin-Watson d-statistics 2.13 2.18 2.29 2.29 1.22 2.12Durbin test of 2nd order serial correlation: Chi2 (Prob>Chi2) 0.66 (0.72) 1.44 (0.49) 1.84 (0.40) 1.59 (0.45) 0.70 (0.71) 0.72 (0.70)Data: VLSS98 only.Robust standard errors in parenthesis* significant at 10%; ** significant at 5%; *** significant at 1%Column (5): restricted to years that are inauspicious for boys exclusivelyColumn (6): includes adjusted 1997 birth cohort
Dependent variable: Logarithm of birth cohort size
25
PANEL B: Boys vs Girls cohorts
Independent variables (1) (2) (3) (4) (5) (6) (7) (8) (9) (10)Year auspicious for either boys or girls (1:yes,0:no) 0.090** 0.051
[0.036] [0.041]Year auspicious for boys (1:yes,0:no) 0.093** 0.035
[0.037] [0.037]Year auspicious for boys exclusively (1:yes,0:no) 0.105** 0.034
[0.042] [0.041]Year auspicious for girls (1:yes,0:no) -0.003 0.024
[0.041] [0.035]Year auspicious for girls exclusively (1:yes,0:no) -0.021 0.025
[0.051] [0.045]
Time trend (linear, quadratic) yes yes yes yes yes yes yes yes yes yesObservations 21 21 21 21 21 21 21 21 21 21R-squared 0.83 0.84 0.84 0.78 0.78 0.88 0.87 0.87 0.86 0.86Durbin-Watson d-statistics 2.21 2.46 2.51 2.45 2.50 2.00 1.93 1.93 2.10 2.11Durbin test of 2nd order serial correlation: Chi2 (Prob>Chi2) 1.24 (0.53) 2.93 (0.23) 3.33 (0.19) 4.35 (0.11) 5.05 (0.08) 0.08 (0.96) 0.27 (0.87) 0.09 (0.96) 0.14 (0.93) 0.09 (0.95)Data: VLSS98 only.Robust standard errors in parenthesis* significant at 10%; ** significant at 5%; *** significant at 1%
PANEL C: Sex ratios
Independent variables (1) (2) (3) (4) (5) (6) (7) (8)Year auspicious for either boys or girls (1:yes,0:no) 0.042
[0.040]Year auspicious for boys (1:yes,0:no) 0.062* 0.063*
[0.032] [0.032]Year auspicious for boys exclusively (1:yes,0:no) 0.074** 0.076* 0.069*
[0.030] [0.043] [0.038]Year auspicious for girls (1:yes,0:no) -0.032 0.004 -0.032
[0.032] [0.043] [0.034]Year auspicious for girls exclusively (1:yes,0:no) -0.052** -0.018
[0.021] [0.032]
Time trend (linear, quadratic) yes yes yes yes yes yes yes yesObservations 22 22 22 22 22 22 22 22R-squared 0.51 0.56 0.58 0.58 0.58 0.49 0.50 0.59Durbin-Watson d-statistics 2.06 2.37 2.71 2.51 2.49 2.49 2.61 2.65Durbin test of 2nd order serial correlation: Chi2 (Prob>Chi2) 0.17 (0.91) 0.73 (0.69) 2.94 (0.23) 1.20 (0.55) 1.43 (0.49) 2.66 (0.26) 3.32 (0.19) 4.70 (0.10)Data: VLSS98 only.Robust standard errors in parenthesis* significant at 10%; ** significant at 5%; *** significant at 1%
Dependent variable: Logarithm of sex ratiomean (s.d) = 1.00 (.10)
Dependent variable: Logarithm of boys cohort size Dependent variable: Logarithm of girls cohort size
26
TABLE 3: Summary statistics
Variable Observations Mean St. Dev
Born in an auspicious year for either boys or girls (1:yes,0:no) 22386 0.60 0.49
Born in an auspicious year for boys (1:yes,0:no) 22386 0.46 0.50
Born in an auspicious year for girls (1:yes,0:no) 22386 0.27 0.45
Born in an auspicious year for both boys and girls (1:yes,0:no) 23836 0.15 0.35
Gender (1:boy,0:girl) 23836 0.50 0.50
Age 23836 12.69 5.98
Height (cm) 21652 130.22 24.79
Weight (kg) 21653 29.61 14.02
Body Mass Index (kg/m^2) 21652 16.25 2.63
Height for age (z-score) 21652 -2.10 1.14
Weight for age (z-score) 21653 -2.30 1.16
Body Mass Index for age (z-score) 21587 -1.21 1.01
Education level (years) 20320 5.08 3.42
Per capita real expenditure ('000 VND) 23836 2394.07 1929.24
Number of children per (nuclear) family 23836 3.35 1.62
Birth order 23836 2.15 1.30
Mother's age at first birth 22520 27.70 6.33
Father's age at first birth 20704 30.33 7.25
Mother's education level (years) 21811 6.40 3.29
Father's education level (years) 22216 7.44 3.34
Mother's height (cm) 22247 151.80 4.97
Father's height (cm) 19955 161.76 5.71
Mother's weight (kg) 22248 46.42 6.95
Father's weight (kg) 19957 52.04 6.79
Data:VLSS93 and VLSS98.
27
Table 4: Astrology and Human Development
PANEL A: Reduced-form outcomes
BMI for age Schooling Weight for Height for BMI for age Schooling Weight for Height for BMI for age Schooling Weight for Height for
z-score (years) age z-score age z-score z-score (years) age z-score age z-score z-score (years) age z-score age z-score
Robust standard errors in brackets, clustered at the year-of-birth level* significant at 10%; ** significant at 5%; *** significant at 1%An auspicious year is a year that is lucky for either boys or girls
Overall sample Boys only Girls only
28
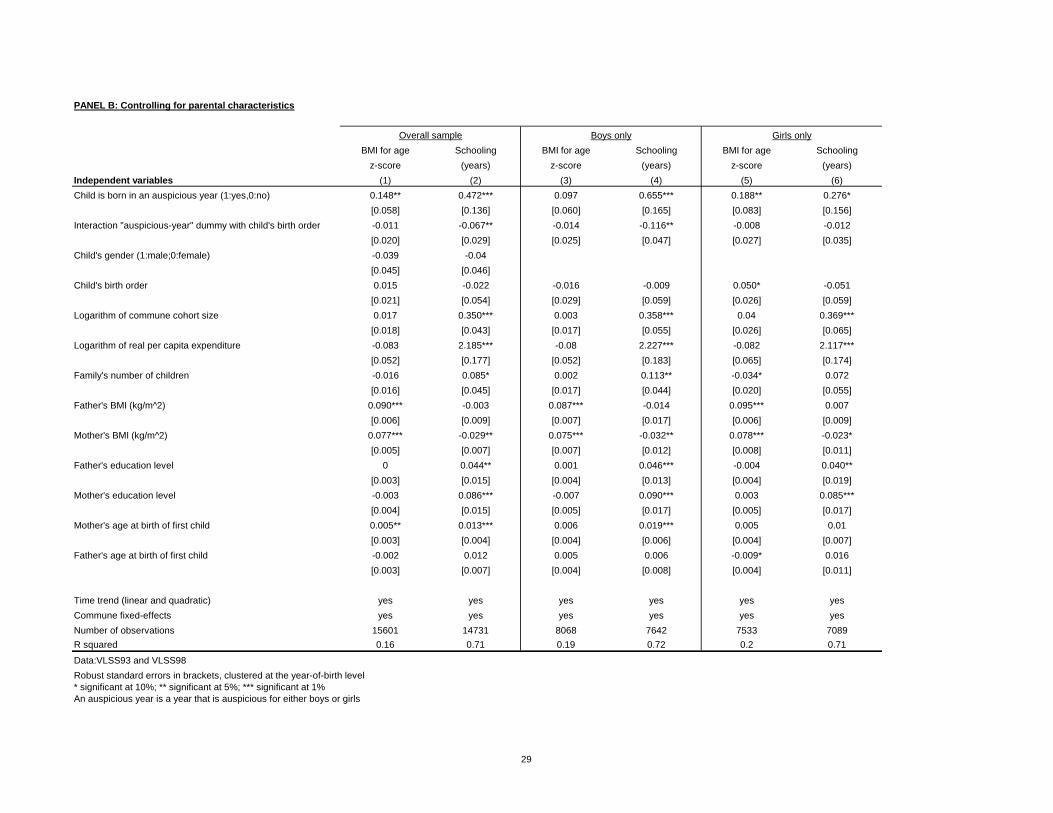
PANEL B: Controlling for parental characteristics
BMI for age Schooling BMI for age Schooling BMI for age Schooling
z-score (years) z-score (years) z-score (years)
Independent variables (1) (2) (3) (4) (5) (6)
Child is born in an auspicious year (1:yes,0:no) 0.148** 0.472*** 0.097 0.655*** 0.188** 0.276*
[0.058] [0.136] [0.060] [0.165] [0.083] [0.156]
Interaction "auspicious-year" dummy with child's birth order -0.011 -0.067** -0.014 -0.116** -0.008 -0.012
[0.020] [0.029] [0.025] [0.047] [0.027] [0.035]
Child's gender (1:male;0:female) -0.039 -0.04
[0.045] [0.046]
Child's birth order 0.015 -0.022 -0.016 -0.009 0.050* -0.051
[0.021] [0.054] [0.029] [0.059] [0.026] [0.059]
Logarithm of commune cohort size 0.017 0.350*** 0.003 0.358*** 0.04 0.369***
[0.018] [0.043] [0.017] [0.055] [0.026] [0.065]
Logarithm of real per capita expenditure -0.083 2.185*** -0.08 2.227*** -0.082 2.117***
[0.052] [0.177] [0.052] [0.183] [0.065] [0.174]
Family's number of children -0.016 0.085* 0.002 0.113** -0.034* 0.072
Mother's age at birth of first child 0.005** 0.013*** 0.006 0.019*** 0.005 0.01
[0.003] [0.004] [0.004] [0.006] [0.004] [0.007]
Father's age at birth of first child -0.002 0.012 0.005 0.006 -0.009* 0.016
[0.003] [0.007] [0.004] [0.008] [0.004] [0.011]
Time trend (linear and quadratic) yes yes yes yes yes yes
Commune fixed-effects yes yes yes yes yes yes
Number of observations 15601 14731 8068 7642 7533 7089
R squared 0.16 0.71 0.19 0.72 0.2 0.71
Data:VLSS93 and VLSS98
Robust standard errors in brackets, clustered at the year-of-birth level* significant at 10%; ** significant at 5%; *** significant at 1%An auspicious year is a year that is auspicious for either boys or girls
Overall sample Boys only Girls only
29
PANEL C: Family fixed-effects
BMI for age Schooling Height for age Weight for age
z-score (years) z-score z-score
Independent variables (1) (2) (3) (4)
Child is born in an auspicious year (1:yes,0:no) 0.177*** 0.402*** -0.015 0.091**
[0.037] [0.072] [0.040] [0.039]
Interaction "Auspicious-year" dummy with child's birth order -0.021* -0.055** -0.02 -0.026*
[0.047] [0.061]Child's birth order 0.008 -0.063 -0.026 -0.079 0.045** -0.052
[0.017] [0.049] [0.023] [0.049] [0.021] [0.059]
Time trend (linear and quadratic) yes yes yes yes yes yesHousehold and Family controls yes yes yes yes yes yesCommune-level controls yes yes yes yes yes yesNumber of observations 15601 14731 8068 7642 7533 7089R squared 0.16 0.71 0.19 0.72 0.20 0.71
Data:VLSS93 and VLSS98Robust standard errors in brackets, clustered at the year-of-birth level* significant at 10%; ** significant at 5%; *** significant at 1%Household controls include logarithm of per capita real consumption; family controls consist of family size, parents' education, height, and weight, parents' age at time of first birthCommune-level controls include commune dummies and logarithm of cohort sizeAn auspicious year is a year that is auspicious for either boys or girlsA child is born lucky if he is a boy born in year auspicious for boys, or she is a girl born in a year auspicious for girls
Overall sample Boys only Girls only
33
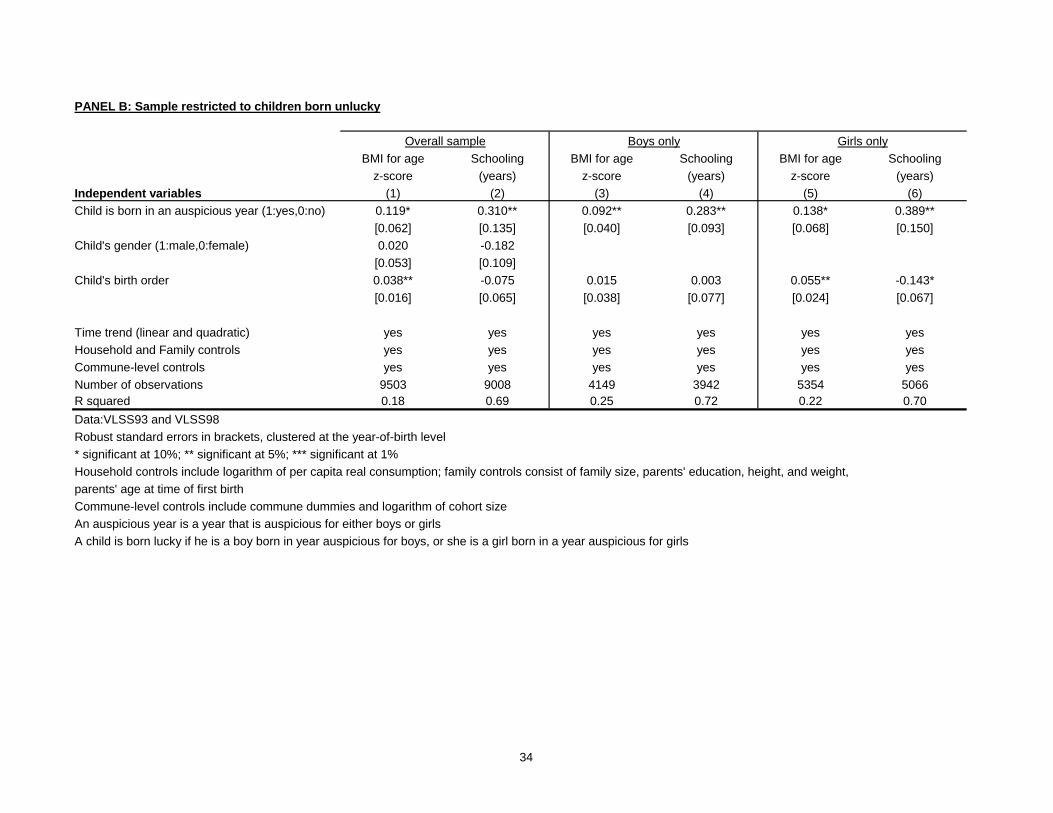
PANEL B: Sample restricted to children born unlucky
BMI for age Schooling BMI for age Schooling BMI for age Schoolingz-score (years) z-score (years) z-score (years)
Independent variables (1) (2) (3) (4) (5) (6)Child is born in an auspicious year (1:yes,0:no) 0.119* 0.310** 0.092** 0.283** 0.138* 0.389**
[0.053] [0.109]Child's birth order 0.038** -0.075 0.015 0.003 0.055** -0.143*
[0.016] [0.065] [0.038] [0.077] [0.024] [0.067]
Time trend (linear and quadratic) yes yes yes yes yes yesHousehold and Family controls yes yes yes yes yes yesCommune-level controls yes yes yes yes yes yesNumber of observations 9503 9008 4149 3942 5354 5066R squared 0.18 0.69 0.25 0.72 0.22 0.70
Data:VLSS93 and VLSS98Robust standard errors in brackets, clustered at the year-of-birth level* significant at 10%; ** significant at 5%; *** significant at 1%Household controls include logarithm of per capita real consumption; family controls consist of family size, parents' education, height, and weight, parents' age at time of first birthCommune-level controls include commune dummies and logarithm of cohort sizeAn auspicious year is a year that is auspicious for either boys or girlsA child is born lucky if he is a boy born in year auspicious for boys, or she is a girl born in a year auspicious for girls
Overall sample Boys only Girls only
34
PANEL C: Sample restricted to girls born lucky in an inauspicious year for boys or born unlucky in an auspicious year for boys
BMI for age Schooling Height for age Weight for age
z-score (years) z-score z-score
Independent variables (1) (2) (3) (4)
Girl is born in an auspicious year boys (1:yes,0:no) -0.047 0.606*** 0.079 0.032
[0.056] [0.070] [0.070] [0.067]
Girl's birth order 0.016 -0.059** -0.040** -0.017
[0.014] [0.024] [0.015] [0.018]
Time trend (linear and quadratic) yes yes yes yes
Household and Family controls yes yes yes yes
Commune-level controls yes yes yes yes
Number of observations 4889 4288 4903 4904R squared 0.03 0.53 0.01 0.01
Data:VLSS93 and VLSS98
Robust standard errors in brackets, clustered at the year-of-birth level
* significant at 10%; ** significant at 5%; *** significant at 1%
Household controls include logarithm of per capita real consumption; family controls consist of family size, parents' education,
height, and weight, parents' age at time of first birth
Commune-level controls include commune dummies and logarithm of cohort size
A child is born lucky if he is a boy born in year auspicious for boys, or she is a girl born in a year auspicious for girls
Dependent variables
35
Table 7: More on the "Marginal Child": Family Fixed-Effect Estimations
BMI for age Schooling Weight for Height for BMI for age Schooling Weight for Height for
z-score (years) age z-score age z-score z-score (years) age z-score age z-score
Standard errors in brackets, clustered at the commune-level
* significant at 10%; ** significant at 5%; *** significant at 1%
Dependent variables
36
Boy Girl Boy Girl Boy Girl Boy Girl Boy Girl Boy Girl Boy Girl Boy Girl Boy Girl Boy Girl
Ty Bad Neutral Neutral Bad Good Bad Neutral Neutral Neutral Good
Suu Neutral Neutral Neutral Bad Bad Bad Good Bad Bad Neutral
Dan Neutral Bad Good Bad Good Neutral Neutral Bad Neutral Bad
Mao Good Neutral Neutral Bad Bad Neutral Good Bad Neutral Good
Thin Neutral Bad Good Neutral Good Neutral Neutral Bad Neutral Neutral
Ty Bad Neutral Neutral Bad Neutral Neutral Neutral Bad Bad Neutral
Ngo Neutral Good Good Bad Good Neutral Neutral Good Good Good
Mui Good Good Good Good Good Good Good Neutral Good Good
Than Bad Bad Good Bad Neutral Bad Bad Bad Bad Bad
Dau Neutral Good Good Bad Bad Neutral Good Bad Bad Neutral
Tuat Neutral Neutral Good Bad Good Neutral Neutral Bad Bad Good
Hoi Good Good Good Good Neutral Good Good Neutral Good Good
Data Source: Informal interviews with a fortune teller in Vietnam, double-checked with Lich Van Nien (Nha Xuat Ban Dan Toc Publishing house, 1999), and http://www.tuviglobal.com.


![[Astrology] Christine Shaw - Predictive Astrology](https://static.documents.pub/doc/80x56/55cf9cec550346d033ab8d6e/astrology-christine-shaw-predictive-astrology-56b92fff20b98.jpg)


