26
SMALL BUSINESS METLIFE & U.S. CHAMBER OF COMMERCE WWW.SBINDEX.US THE VOICES OF SMALL BUSINESS OWNERS Q2 2019

SMALL BUSINESSM E T L I F E & U . S . C H A M B E R O F C O M M E R C E
WWW.SBINDEX.US
THE VOICES OF SMALL BUSINESS OWNERS
Q2 2019


INDEX SUMMARY
INDEX HIGHLIGHTS
QUARTERLY SPOTLIGHT: HEALTHCARE
EXPERT PERSPECTIVE
KEY FINDINGS
SMALL BUSINESS ENVIRONMENT
SMALL BUSINESS EXPECTATIONS
SMALL BUSINESS OPERATIONS
INDEX SNAPSHOTS
REGIONAL SCORES
METHODOLOGY
ABOUT US
2
3
4
5
10
12
14
15
16
17
20
CONTENTS
2
SMALL BUSINESS INDEX | Q2 | 2019
SMALL BUSINESS CONFIDENCE BOUNCES BACK
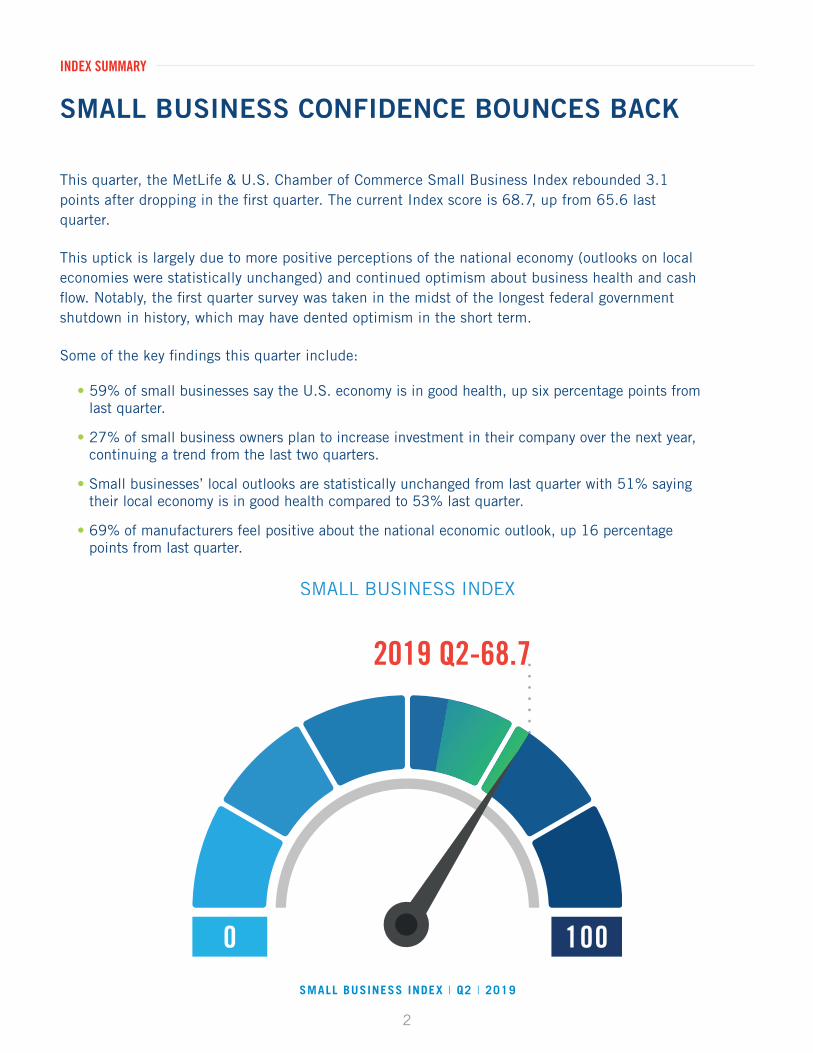
This quarter, the MetLife & U.S. Chamber of Commerce Small Business Index rebounded 3.1 points after dropping in the fi rst quarter. The current Index score is 68.7, up from 65.6 last quarter.
This uptick is largely due to more positive perceptions of the national economy (outlooks on local economies were statistically unchanged) and continued optimism about business health and cash fl ow. Notably, the fi rst quarter survey was taken in the midst of the longest federal government shutdown in history, which may have dented optimism in the short term.
Some of the key fi ndings this quarter include:
• 59% of small businesses say the U.S. economy is in good health, up six percentage points from last quarter.
• 27% of small business owners plan to increase investment in their company over the next year, continuing a trend from the last two quarters.
• Small businesses’ local outlooks are statistically unchanged from last quarter with 51% saying their local economy is in good health compared to 53% last quarter.
• 69% of manufacturers feel positive about the national economic outlook, up 16 percentage points from last quarter.
SMALL BUSINESS INDEX
INDEX SUMMARY
2019 Q2-68.7

3
SMALL BUSINESS INDEX | Q2 | 2019
Optimism about the national economy reaches higher. Small businesses across the country expressed a greater optimism about the health of the U.S. economy compared to last quarter. Nearly six in ten small businesses (59%) believe the U.S. economy is in good health, up six percentage points from last quarter (53%).
Views of the local economy remain steady. Small businesses’ local outlooks are statistically unchanged from last quarter. Currently, 51% say their local economy is in good health compared to 53% last quarter (and 48% in Q2 2018).
Manufacturers turn bullish. Small business manufacturers’ optimism took a big leap in Q2, with 69% feeling positive about the national economic outlook, a substantial 16 percentage point increase from last quarter.
Small businesses hold investment, staffing levels steady. 27% of small business owners plan to increase investment in their company over the next year, continuing a trend from the last two quarters. 28% plan to increase staff in the next year.
Female business owners become more optimistic. Last quarter, we reported a persistent gap between male-owned businesses (more positive) and female-owned businesses (less positive). However, female-owned businesses have optimism (58%) about the U.S. economy this quarter only 1% below that of male-owned businesses.
Northeast turns upbeat. 58% of Northeast small businesses believe the U.S. economy is in good health, up from 51% last quarter and up 12% from one year ago (46%).
Millennial and Gen X-owned small businesses drive hiring plans. Plans to increase headcount are primarily driven by Millennial or Gen-X-owned businesses (39%) despite representing only 27% of survey respondents.
2017Q2
2017Q3
2017Q4
2018Q1
2018Q2
2018Q3
2018Q4
2019Q1
2019Q2
56
58
60
62
66
64
68
70
SMALL BUSINESS INDEX: HISTORICAL CONTEXT
INDEX HIGHLIGHTS

4
SMALL BUSINESS INDEX | Q2 | 2019
This quarter, the MetLife & U.S. Chamber of Commerce Small Business Index surveyed small businesses about how they select healthcare plans for their employees.
The survey tracked three important trends about how small businesses learn about and select healthcare plans:
• Most small businesses (69%) say the process of navigating healthcare options can be time consuming. 42% strongly agree with this sentiment.
• Small businesses commonly rely on human experts for advice. Small businesses most commonly (32%) turn to insurance brokers, consultants, or agents to make informed decisions about healthcare plans.
• Cost is the key driver of decision making. The top priorities for small business owners when considering healthcare coverage options are keeping insurance premiums and out-of-pocket costs (like co-pays) low.
Survey respondents added that small business owners are most commonly (41%) responsible for choosing healthcare coverage and other benefi ts. But larger small businesses tend to delegate this duty to their HR departments.
• Small businesses with fewer than 20 employees are more likely (41%) to say the owner manages benefi t-related decisions compared to those with 20 or more employees (23%).
COST AND COMPLEXITY OF HEALTHCARE POSE CHALLENGES FOR SMALL BUSINESS
QUARTERLY SPOTLIGHT: HEALTHCARE
I feel like it’s pretty time consuming to navigate and understand what are the best options for your employees. We work with a broker, and they put together ‘here are your annual increases’ and ‘here are some other offers you could do.’ We take that data and put it into a spreadsheet to look at usage and how our employees used the insurance in the past.”
NATALIE KADDASPresident and CEO Kaddas Enterprises, Inc. Salt Lake City, Utah

5
SMALL BUSINESS INDEX | Q2 | 2019
HOW SMALL BUSINESSES CHOOSE HEALTHCARE PLANS
QUARTERLY SPOTLIGHT: HEALTHCARE
KATIE MAHONEYVice President, Health PolicyU.S. Chamber of CommerceWashington, D.C.
Q: According to the survey, a lot of small businesses make their healthcare coverage decisions based on the cost of plans. Is prioritizing the cost of a healthcare program the right way to think about and choose health insurance for your small company?
A: I believe the answer really depends on whether the businesses’ employees share that priority. I would hope that the reason cost is the primary driver of making decisions for healthcare coverage is because that is the priority for their employees. If it isn’t, then I think that is another opportunity to educate companies on benefi t options.
Q: What can be done to help those small businesses that don’t offer healthcare coverage for their workers?
A: While robust, comprehensive, soup to nuts coverage is great, it does come with a higher premium price tag. To help small businesses provide coverage, there must be a greater variety of plans available. That’s why we support the ability of state and local chambers of commerce to provide health insurance coverage options for their small business members.
Q: Respondents said that they most commonly (32%) get information about healthcare plans from a healthcare agent, broker, or consultant. Fewer go to a search engine or a corporate website. Is there something about having a human talk you through options that helps reassure people and lead them to a decision?
A: Yes, I think the response speaks to the reason why the brokerage industry exists. Healthcare iscomplicated and being able to ask questions, and get assurances and explanations about different plans is not just reassuring, it is important.

Navigating healthcare options for my buisness is time consuming.
We have enough information to make informed decisions about healthcare for our buisness.
We are able to provide our employees with good coverage options.
I stay informed and educated about changes to healthcare laws and regulations that would affectmy business.
The cost of healthcare crowds out other priorities for our business.
42% 27% 13% 11% 8%
34% 40% 9% 11% 6%
25% 42% 14% 15% 5%
24% 23% 13% 27% 12%
30% 27% 19% 15% 9%
STRONGLY AGREE SOMEWHAT AGREE SOMEWHAT DISAGREE STRONGLY DISAGREEDON'T KNOW/NOT SURE
6
SMALL BUSINESS INDEX | Q2 | 2019
MOST SMALL BUSINESSES FIND CHOOSING HEALTHCARE PLANS TIME CONSUMING The survey revealed that small businesses find they have enough information to make informed decisions about healthcare, but that they find it time consuming to select the right plan.
• Most small businesses believe they have enough information to make informed decisions (74%).
• Almost as many (67%) say they are able to stay informed about changes in healthcare laws and regulations that could impact their business.
• However, a majority (69%) also report that the process of navigating healthcare options is time consuming, with 42% strongly agreeing with this sentiment.
QUARTERLY SPOTLIGHT: HEALTHCARE
ATTITUDES TOWARD HEALTHCARE COVERAGE DECISION MAKING

7
SMALL BUSINESS INDEX | Q2 | 2019
7
QUARTERLY SPOTLIGHT: HEALTHCARE
Small businesses go to a variety of sources of information to learn about offering healthcare coverage for their workers, but clearly prefer talking to actual human experts about available options:
• Small businesses most commonly turn to health insurance or benefit brokers, consultants, or agents (32%) for information regarding benefit plans.
• Fewer turn to Google or other search engines (9%), other business owners (7%), or some “Other” type of resource (11%) to find information on healthcare options.
• A small percentage (7%) says they do not know where to go for information on choosing a healthcare plan.
The top priorities for small business owners when considering healthcare coverage options are keeping insurance premiums and out-of-pocket costs low.
Here’s a breakdown of the top priorities for small businesses considering a healthcare plan:
• Decision makers rated both low premiums (20%) and low out-of-pocket costs like co-pays and deductibles (20%) as the most important criteria for selecting a healthcare plan.
• However, larger small businesses (with 100 or more employees) also see flexibility and variety in choice as a major consideration with 21% seeing this as a priority, compared to just 7% for mid-size and 9% for small size small businesses.
• These larger small businesses also prioritize keeping out-of-pocket costs (25%) and insurance premiums low (24%).
SMALL BUSINESSES TURN TO HEALTHCARE EXPERTS TO MAKE DECISIONS
PRIORITIES FOR HEALTHCARE COVERAGE OPTIONS ACROSS REGIONS
17%
22%
16%
27%
Low health insurancepremiums
19% 19%
24%
15%
Low out-of-pocket health care costs, like
co-pays and deductables
9%10%
9% 9%
Flexibility & variety in choice
2% 3%4%
1%
Affordable cost of perscription drugs
NORTH MIDWEST SOUTH WEST

8
SMALL BUSINESS INDEX | Q2 | 2019
QUARTERLY SPOTLIGHT: HEALTHCARE
Small businesses are the most familiar with more traditional forms of healthcare coverage options, such as traditional group health insurance (66%).
They are less familiar with other options:
• 43% are familiar with changes to contribution limits for health savings accounts.
• 35% are aware of group coverage health reimbursement accounts.
• 28% are familiar with Association Health Plans.
• 22% know about a qualified small employer health reimbursement arrangement.
• 19% have heard of taxable stipends.
By sector, retailers struggle the most to find information to enable them to make informed decisions about healthcare. Small business sectors reporting that they have enough information to make informed decisions about healthcare coverage are:
• 81% in professional services.
• 74% in services.
• 72% in manufacturing.
• 68% of retail businesses.
Costs of offering healthcare are a big concern for the majority of small businesses. A majority (57%) say the cost of healthcare crowds out other priorities for their business and 41% report not being able to provide their employees with good coverage options.
SMALL BUSINESSES SAY HEALTHCARE COSTS CROWD OUT OTHER PRIORITIES
29%26% 25%
34%
25%
Association Health Plans
46%45%
34%
50%
37%
Changes to contribution limits for HSAs
68%70%
58%
72%
58%
Traditional grouphealth insurance
SERVICESMANUFACTURING /RESOURCES RETAIL PROFESSIONAL SERVICES OTHER
FAMILIARITY WITH COVERAGE OPTIONS ACROSS INDUSTRIES

9
SMALL BUSINESS INDEX | Q2 | 2019
QUARTERLY SPOTLIGHT: HEALTHCARE
We use a broker who understands the needs of our team members and stays within their budget and ours. It is less time consuming now that we use a broker and we have enough information. Before, I would do all the research and find the different options. It was very time consuming.”
MAUREEN BUTLER TreasurerVistra Communications, LLCLutz, Florida
Somewhat Agree
SomewhatDisagree
StronglyDisagree
Don’t Know
9%
15%
19%
27%
30%
Strongly Agree
THE COST OF HEALTHCARE CROWDS OUT OTHER PRIORITIES FOR OUR BUSINESS
By sector, concerns over healthcare costs are greatest in manufacturing (62%), as compared to services (57%), professional services (55%), and retail (53%).
Retailers are also the least likely to report they are able to provide good healthcare coverage options by a significant margin. Here’s how sectors rated themselves on their ability to provide good healthcare options for their employees:
• 54% in professional services.
• 54% in manufacturing.
• 46% in services.
• 36% of retailers.

10
SMALL BUSINESS INDEX | Q2 | 2019
This quarter, small businesses’ optimism about the U.S. economy rebounded, with 59% of small businesses reporting that the U.S. economy is in good health, up six percentage points from last quarter (53%).
While the national economic outlook improved, small businesses’ outlooks on their local economies are statistically unchanged from last quarter. Currently, 51% say their local economy is in good health (53% said the same last quarter and 48% said so in Q2 2018).
Across sectors, manufacturers—who reported a decline in economic optimism last quarter—are the most positive about the national economy and their local economies. Strikingly, manufacturers’ optimism took a big leap, with 69% feeling positive about the national economic outlook, a substantial 16 percentage point increase from last quarter.
On the other hand, professional services companies feel less optimistic about the national economy and their local economies compared to previous quarters. Professional services business owners reported a 9% drop in their view of their local economy.
SMALL BUSINESSES’ VIEWS ON THE NATIONAL ECONOMY REBOUND
SMALL BUSINESS ENVIRONMENT
KEY FINDINGS
U.S. ECONOMIC OUTLOOK VARIES BY INDUSTRY
MANUFACTURING
Q1 20
19
69%
Q2 20
19
Q1 20
19
Q2 20
19
Q1 20
19
Q2 20
19
Q1 20
19
Q2 20
19
Q1 20
19
Q2 20
19
53%
SERVICES
49%
58%
RETAIL
48%
59%
PROFESSIONALSERVICES
61%
OTHER
51% 51%56%

11
SMALL BUSINESS INDEX | Q2 | 2019
“I’m very optimistic about the local economy…We’ve had a long, steady growth pattern in that regard and we don’t see that slowing down at all.
We have brand new businesses starting between eight and nine thousand jobs in our region every year. It’s especially notable at a time where we have record low unemployment. Seeing those new folks starting off means we’ve created an environment where they can do that in a successful manner.”
MEG SCHNEIDERSenior Vice President,Business Resources & Community DevelopmentGreater Des Moines PartnershipDes Moines, Iowa
Other key findings about the small business environment include:
• Nearly three-quarters (72%) of small businesses report that the level of competition from smaller or local companies has stayed the same over the past six months, unchanged from last quarter.
• 18% of businesses report facing more competition, while 7% report less.
• Nearly a quarter of retailers and professional service firms (23% each) report facing more competition compared to six months ago.
• Bucking a previous trend, female-owned businesses have a renewed optimism about the U.S. economy this quarter, with 58% characterizing it as good. 59% of male-owned businesses said the same.
• Nearly three-quarters (73%) report the amount of time they have spent on compliance or licensing has stayed the same over the same period, up slightly from last quarter (69%).
• 21% of small businesses say time spent on compliance has increased, compared to 25% last quarter, 3% say it has decreased.
KEY FINDINGS
12
SMALL BUSINESS INDEX | Q2 | 2019
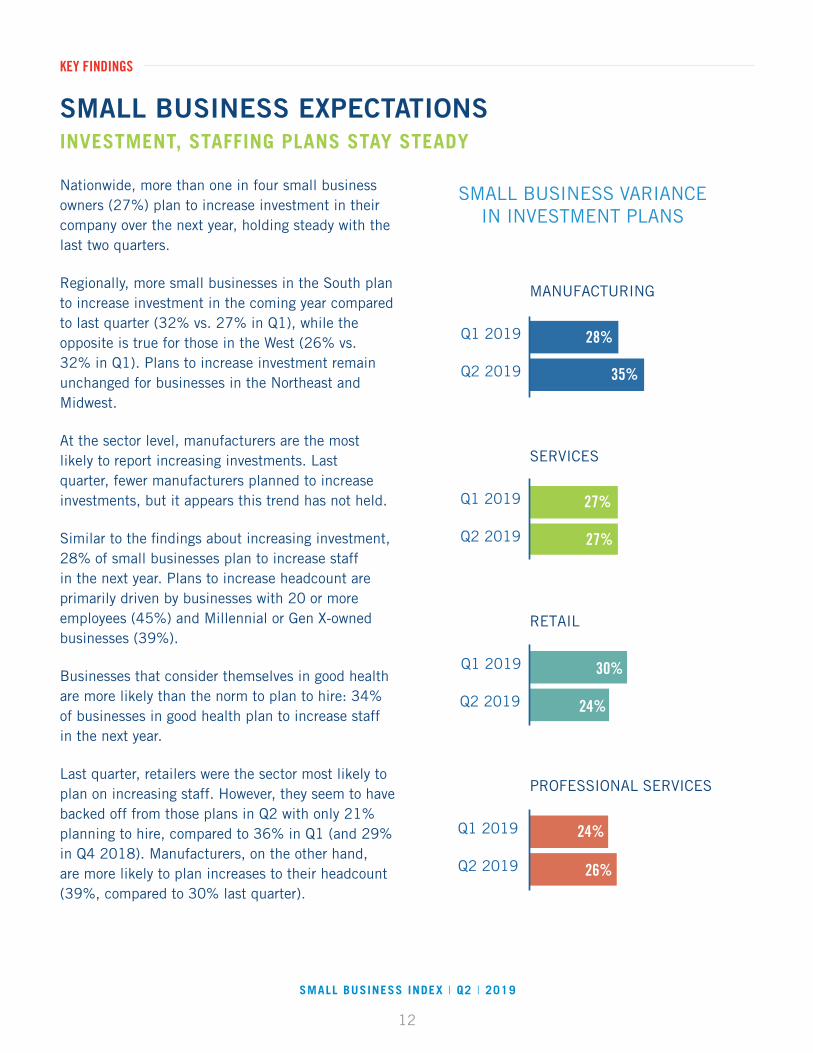
Nationwide, more than one in four small business owners (27%) plan to increase investment in their company over the next year, holding steady with the last two quarters.
Regionally, more small businesses in the South plan to increase investment in the coming year compared to last quarter (32% vs. 27% in Q1), while the opposite is true for those in the West (26% vs. 32% in Q1). Plans to increase investment remain unchanged for businesses in the Northeast and Midwest.
At the sector level, manufacturers are the most likely to report increasing investments. Last quarter, fewer manufacturers planned to increase investments, but it appears this trend has not held.
Similar to the fi ndings about increasing investment, 28% of small businesses plan to increase staff in the next year. Plans to increase headcount are primarily driven by businesses with 20 or more employees (45%) and Millennial or Gen X-owned businesses (39%).
Businesses that consider themselves in good health are more likely than the norm to plan to hire: 34% of businesses in good health plan to increase staff in the next year.
Last quarter, retailers were the sector most likely to plan on increasing staff. However, they seem to have backed off from those plans in Q2 with only 21% planning to hire, compared to 36% in Q1 (and 29% in Q4 2018). Manufacturers, on the other hand, are more likely to plan increases to their headcount (39%, compared to 30% last quarter).
INVESTMENT, STAFFING PLANS STAY STEADY
SMALL BUSINESS EXPECTATIONS
KEY FINDINGS
SMALL BUSINESS VARIANCEIN INVESTMENT PLANS
MANUFACTURING
Q1 2019
Q2 2019
SERVICES
Q1 2019
Q2 2019
RETAIL
Q1 2019
Q2 2019
PROFESSIONAL SERVICES
Q1 2019
Q2 2019
28%
35%
27%
27%
30%
24%
24%
24%26%
13
SMALL BUSINESS INDEX | Q2 | 2019
Revenue expectations also hold steady this quarter. More than half of small businesses (57%) report expectations that next year’s revenues will increase, unchanged statistically from last quarter. Another third (34%) expect revenue to stay the same, while just 7% think it will decrease.
As in past quarters, the larger the business, the more likely they are to expect revenue to increase. Currently, two-thirds of businesses with 20 or more employees expect next year’s revenue to go up (66%), compared to 52% of businesses with fewer than five employees.
By sector, revenue expectations had some interesting standouts:
• Manufacturers’ renewed optimism this quarter extends here, too, with 59% expecting next year’s revenue to increase, compared to 53% in Q1.
• Retailers are slightly less hopeful than they were last quarter: 55% expect an increase in revenue, versus 61% in Q1.
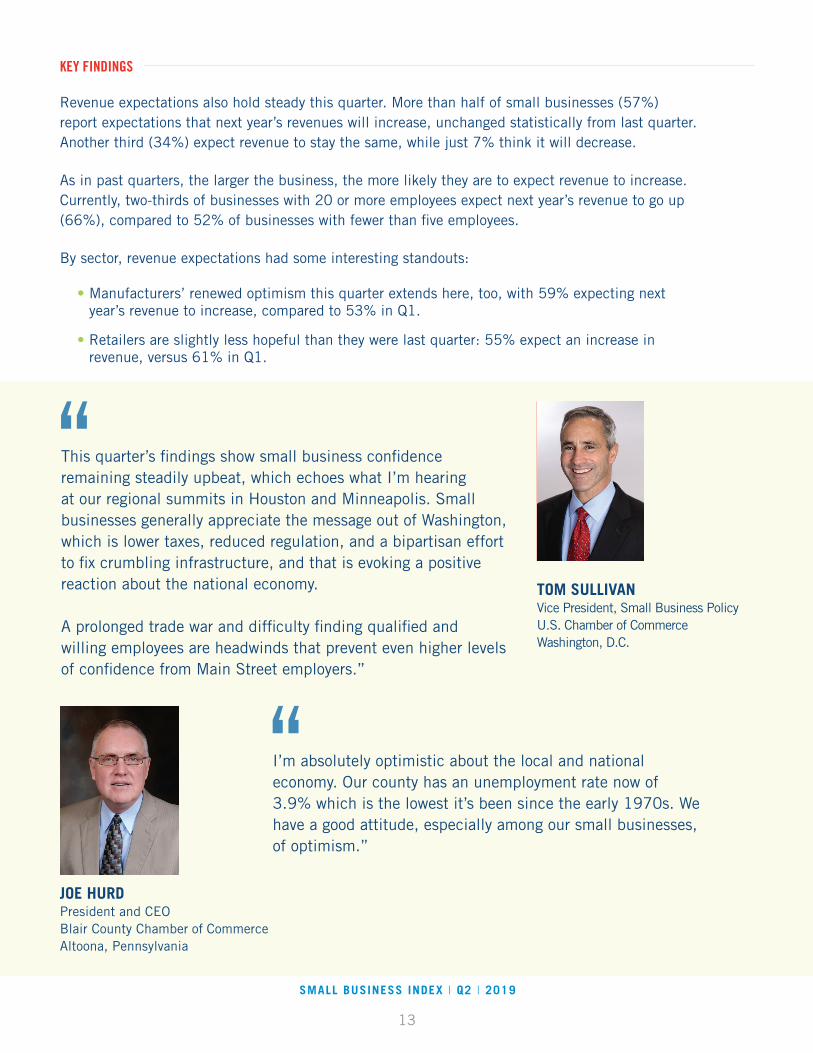
This quarter’s findings show small business confidence remaining steadily upbeat, which echoes what I’m hearing at our regional summits in Houston and Minneapolis. Small businesses generally appreciate the message out of Washington, which is lower taxes, reduced regulation, and a bipartisan effort to fix crumbling infrastructure, and that is evoking a positive reaction about the national economy.
A prolonged trade war and difficulty finding qualified and willing employees are headwinds that prevent even higher levels of confidence from Main Street employers.”
TOM SULLIVAN Vice President, Small Business PolicyU.S. Chamber of CommerceWashington, D.C.
KEY FINDINGS
I’m absolutely optimistic about the local and national economy. Our county has an unemployment rate now of 3.9% which is the lowest it’s been since the early 1970s. We have a good attitude, especially among our small businesses, of optimism.”
JOE HURD President and CEOBlair County Chamber of Commerce Altoona, Pennsylvania

14
SMALL BUSINESS INDEX | Q2 | 2019
The number of small businesses reporting good health remains consistent this quarter, with 65% of small businesses reporting that their business is in good health (64% reported good health in Q1). Business size impacts perceptions of health: the smallest businesses are least likely to believe they are in good health.
At the sector level, retailers remain less optimistic. In contrast, manufacturers, in a trend visible in other areas this quarter, are slightly more optimistic than last quarter. 66% of manufacturers report good health, up fi ve percentage points from Q1.
Most small businesses report consistent staffi ng levels this quarter, with more hiring than reducing staff. Overall, 70% of small businesses say they have retained the same size staff over the past year, on par with last quarter (71%) and similar to a year ago (68%). Of the remaining 30% of businesses, more say they have increased staff (18%) than reduced it (11%).
Overall comfort with cash fl ow is in line with past quarters (83%). At the regional level, all four regions report steady levels of comfort with their cash fl ow, with Midwestern businesses the most likely to say they are very comfortable (39%), refl ecting a growing optimism from previous quarters.
Small businesses in their second decade (11-20 years) of operations seem to be in an optimism sweet spot. They are most optimistic about their business health (71%), compared to both younger and older businesses. Those in operation for less than 10 years (62%), as well as those around for 20 or more (64%), are both less optimistic about their health.
SMALL BUSINESS OPERATIONSSMALL BUSINESSES’ HEALTH AND CASH FLOW COMFORT REMAIN HIGH
KEY FINDINGS
Less than 10 years
62%
11 - 20 years
71%
20 years and up
64%
SECOND DECADE SMALL BUSINESSES ARE MOST OPTIMISTIC ABOUT BUSINESS HEALTH

15
SMALL BUSINESS INDEX | Q2 | 2019
Most small businesses see a strong national economy.
59% of small businesses say the U.S. economy is in good
health, up six percentage points from 53% last quarter.
The MetLife & U.S. Chamber of Commerce Small Business Index
jumped 3.1 points to 68.7, up from 65.6 in Q1 2019.
Small businesses most commonly turn to insurance
brokers, consultants, or agents (32%) for
information regarding benefit plans.
Nearly two-thirds of manufacturers (62%) say the
cost of healthcare crowds out other priorities for their
business.
Female-owned businesses report renewed optimism
about the U.S. economy this quarter, with 58% saying
they are optimistic about the economy compared to 59% of male-owned businesses.
69% of small businesses report that the process of navigating
healthcare options is time consuming. Four in ten (42%)
strongly agree.
Manufacturers bounce back. 69% of manufacturers feel positive about the national economic outlook, up 16
percentage points from last quarter.
INDEX SNAPSHOTS
Second decade success: Businesses that have
operated for 11 to 20 years are most optimistic about their business health and
cash flow.
One in five: The number of small businesses that rate
low insurance premiums and low out-of-pocket cost as the most important criteria for
choosing healthcare coverage for employees.

16
SMALL BUSINESS INDEX | Q2 | 2019
OPTIMISM ABOUT THE ECONOMY RETURNS ACROSS ALL REGIONS
REGIONAL SCORES
Q2 SMALL BUSINESS INDEX SCORES BY REGION
NORTHEAST
68.7 MIDWEST
68.9 WEST+3.0
+3.3
68.7SOUTH
68.7
NATIONAL SCORE 68.7
+3.6
+2.9
Northeast: Last quarter, we reported a decline in optimism about economic outlook in the Northeast. This quarter, things are looking brighter. 58% percent of Northeast small businesses believe the U.S. economy is in good health, up from 51% last quarter and up 12% from one year ago (46%). Currently, 48% believe their local economy is in good health, up from 38% last quarter.
Midwest: The percentage of Midwest small businesses reporting the U.S. economy is in good health rose 7 percentage points from last quarter to 57% from 50%. In contrast, Midwesterners’ outlook on the local economy has softened slightly, dropping to 46% from 50% last quarter. 85% of Midwest small businesses are very comfortable with their cash fl ow compared to 81% last quarter and 67% believe their business is in good health.
South: 62% of small businesses in the South are optimistic about their overall business health, but this optimism has slightly declined from the past two quarters (67% in Q4 2018 and 68% in Q1 2019). Their local economic outlook is also down 9 percentage points from 60% in Q1 to 51% this quarter. They have not reported a change in their outlook on the national economy (57% say it is good).
West: This quarter, optimism has returned to Western small businesses: 67% feel their business is in good health, compared to 60% last quarter. Outlooks on the U.S. economy have also improved, and businesses in this region now are the most optimistic (62% say the economy is good, a 10-percentage point increase from last quarter). Their local economic outlook is unchanged at 55%.

17
SMALL BUSINESS INDEX | Q2 | 2019
SURVEY METHODOLOGY
Small businesses are defi ned in this study as companies with fewer than 500 employees that are not sole proprietorships. The sample for this study is a listed business directory of all U.S. businesses obtained through Dun & Bradstreet. Ipsos used fi xed sample targets, unique to this study, in drawing the sample. This sample calibrates respondent characteristics to be representative of the U.S. small business population using standard procedures such as raking-ratio adjustments. The source of these population targets is the U.S. Census 2016 Statistics of U.S. Businesses dataset. The sample drawn for this study refl ects fi xed sample targets on fi rmographics. Post-hoc weights were made to the population characteristics on region, industry sector, and size of business.
All sample surveys and polls may be subject to other sources of error, including, but not limited to, coverage error and measurement error. The poll has a margin of error of plus or minus 3.5 percentage points for all respondents. Ipsos calculates a design effect (DEFF) for each study based on the variation of the weights, following the formula of Kish (1965). This study had a confi dence interval adjusted for design effect of the following: (n=1,000, DEFF=1.5) adjusted Confi dence Interval=+/-5 percentage points. Where fi gures do not sum to 100, this is due to the effects of rounding.
METHODOLOGY
To construct national, regional, employee size, and broad industry group level estimates of the health of small businesses in the U.S. a sequence of statistical techniques were applied to the survey results, including elastic net for variable selection and multilevel regression with post stratifi cation (MRP) from the survey data.
Since each business may report the state of its health by different standards, Ipsos uses the core survey questions to construct a stable, consistent defi nition of small business status. Each business is then classifi ed into one of three categories: poor, neutral, or good. Once each business is measured on a consistent scale, the survey results are fed into a multilevel regression model to generalize our results to a broader set of businesses enabling us to measure the health of businesses not just nationally but also at the level of state, industry, and business
INDEX METHODOLOGYsize. The model uses employee size, industry type, and location as individual level predictors, as well as data from the BLS on job change by industry.
Next, to ensure that our model results are refl ective of the small business population in the U.S., we adjust our estimates using the number of businesses in the over 5,000 possible combinations of state, industry, and fi rm-size categories to ensure that the model of business health represents the U.S. population of small businesses.
The process used is known as post-stratifi cation, something which was not possible with the original sample due to sample-size limitations. The population estimates for employee size, industry, and location were obtained from the U.S. Census 2015 Statistics of U.S. Businesses dataset.
These are fi ndings from an Ipsos poll conducted April 1 – May 6, 2019, via telephone in English. For the survey, a sample of 1,000 small business owners and operators were sourced from the continental U.S., Alaska, and Hawaii.

18
SMALL BUSINESS INDEX | Q2 | 2019
MIDWEST
WEST
NORTHEAST
SOUTH
20%21%
34%
25%
Survey Makeup of 1,000 Respondents
INDUSTRY BREAKDOWN COMPANY SIZE BREAKDOWN
REGIONAL BREAKDOWN
61%27%
9%2%
0–4 employees
5–19 employees
20–99 employees
100–500 employees
22% Retail
23% Education, Healthcare,
and Recreation
17%Manufacturing and Resources
26% Professional Services
METHODOLOGY

19
SMALL BUSINESS INDEX | Q2 | 2019
SMALL BUSINESS OPERATIONS1. How would you rate the overall health of
your business?
2. Over the past year, would you say you have increased staff, retained the same size staff, or reduced staff?
3. How comfortable are you with your company’s current cash fl ow situation?
SMALL BUSINESS EXPECTATIONS4. In the next year, do you anticipate increasing staff,
retaining the same size staff, or reducing staff?
5. For the upcoming year, do you plan to increase investment, invest about as much in the business as you did last year, or reduce investment?
6. Looking forward one year, do you expect next year’s revenue to increase, decrease, or stay the same?
CORE INDEX QUESTIONS
2019 CORE INDEX TRENDSThe infographic below charts responses – in percentages – to each of the Index’s 10 core questions andwill provide insights into the changing attitudes and expectations of small business owners over time. This infographic refl ects responses to the last four surveys, Q3 and Q4 of 2018 and Q1 and Q2 of 2019. Responses to the 10 core questions are used to calculate the MetLife & U.S. Chamber of Commerce Small Business Index number, which currently stands at 68.7% – meaning 68.7% of small business owners have a positive outlook for their companies and the environment in which they operate.
METHODOLOGY
2019 Q12019 Q2
2018 Q32018 Q4
20%
40%
60%
80%
100%
0% 2019 Q12019 Q2
2018 Q32018 Q4
2019 Q12019 Q2
2018 Q32018 Q4
2019 Q12019 Q2
2018 Q32018 Q4
2019 Q12019 Q2
2018 Q32018 Q4
2019 Q12019 Q2
2018 Q32018 Q4
2019 Q12019 Q2
2018 Q32018 Q4
2019 Q12019 Q2
2018 Q32018 Q4
2019 Q12019 Q2
2018 Q32018 Q4
2019 Q12019 Q2
2018 Q32018 Q4
Good Health Comfortable Cash Increased Staff U.S. Economy Good Local Economy Good More Competition
Expect to Hire Increased Investment Increased RevenueSame or Less Compliance
SMALL BUSINESS ENVIRONMENT7. How would you rate the overall health of the
U.S. economy?
8. How would you rate the overall health of the economy in your local area?
9. Compared to six months ago, does your business see more competition, less competition, or about the same level of competition from small or local companies?
10. Compared to six months ago, has the time or resources you spend completing licensing, compliance, or other government requirements increased, decreased, or stayed the same?

20
SMALL BUSINESS INDEX | Q2 | 2019
ABOUT US
The U.S. Chamber of Commerce is the world’s largest business federation representing the interests of more than 3 million businesses of all sizes, sectors, and regions, as well as state and local chambers and industry associations. Its International Affairs Division includes more than 70 regional and policy experts and 25 country- and region-specifi c business councils and initiatives. The U.S. Chamber also works closely with 117 American Chambers of Commerce abroad. For more information, visit www.uschamber.com.
MetLife, Inc. (NYSE: MET), through its subsidiaries and affi liates (“MetLife”), is one of the world’s leading fi nancial services companies, providing insurance, annuities, employee benefi ts, and asset management to help its individual and institutional customers navigate their changing world. Founded in 1868, MetLife has operations in more than 40 countries and holds leading market positions in the United States, Japan, Latin America, Asia, Europe, and the Middle East. For more information, visit www.MetLife.com.
JD HARRISONU.S. CHAMBER OF [email protected]
DAVID [email protected]
PRESS CONTACT:
FOR MORE INFORMATION ON THIS INDEX, VISIT WWW.SBINDEX.US.

21
SMALL BUSINESS INDEX | Q2 | 2019
NOTES

22
SMALL BUSINESS INDEX | Q2 | 2019
NOTES


WWW.SBINDEX.US


