Metrics and Valuation Framework for Distribution System Planning MICHAEL KINTNER-MEYER (PNNL) 10/2/2017 1 PNNL-SA-129312 Distribution Systems and Planning Training for New England Conference of Public Utility Commissioners, Sept. 27-29, 2017
Transcript
Metrics and Valuation Framework for
Distribution System Planning
MICHAEL KINTNER-MEYER (PNNL)
10/2/2017 1
PNNL-SA-129312
Distribution Systems and Planning Training
for New England Conference of Public Utility Commissioners, Sept. 27-29, 2017
10/2/2017 2
Project ObjectivesWork directly with strategic stakeholdersto confirm the usefulness of new and enhanced existing metrics that will guide grid modernization efforts to maintain and improve:
Value Proposition Ensuring that all stakeholders understand how grid
modernization investments will affect and benefit them Audiences: grid modernization technology developers and
investors; utility and ISO technology adopters or sponsors; federal, state, and municipal regulatory or oversight authorities; and electricity consumers (i.e., the ratepayers)
GMLC 1.1: Metrics AnalysisHigh Level Summary
Expected Outcomes Definition, Validation, and Adoption of
metrics and analysis approaches by leading
industry stakeholders and regional
partners
Better alignment of DOE R&D priorities
with stakeholder and public-interest
objectives
GMLC 1.1: Metrics AnalysisApproach
10/2/2017 3
Establish Methodologyfor Monitoring
Progress of Grid Modernization
STEP 2. Engage Stakeholders -
Establish Partnerships
STEP 3: Validate
Metrics with Partners
STEP 4: Foster
Broader Adoption
STEP 1: Assess
Existing and develop new
metrics
Work closely with existing channels (EPA, EIA, IEEE standards, best practice
GMLC Regional Partners will apply metrics
Utilities and key stakeholders will test metrics for self-assessment
Collaborate with GMLC Portfolio
researchers
Utilities and ISO/RTOsFederal and State regulators,
Municipal authorities,Industry associations
Work closely with existing channels (EPA, EIA, IEEE standards, EPRI, best practice
3-year project9 national labs
10/2/2017 4
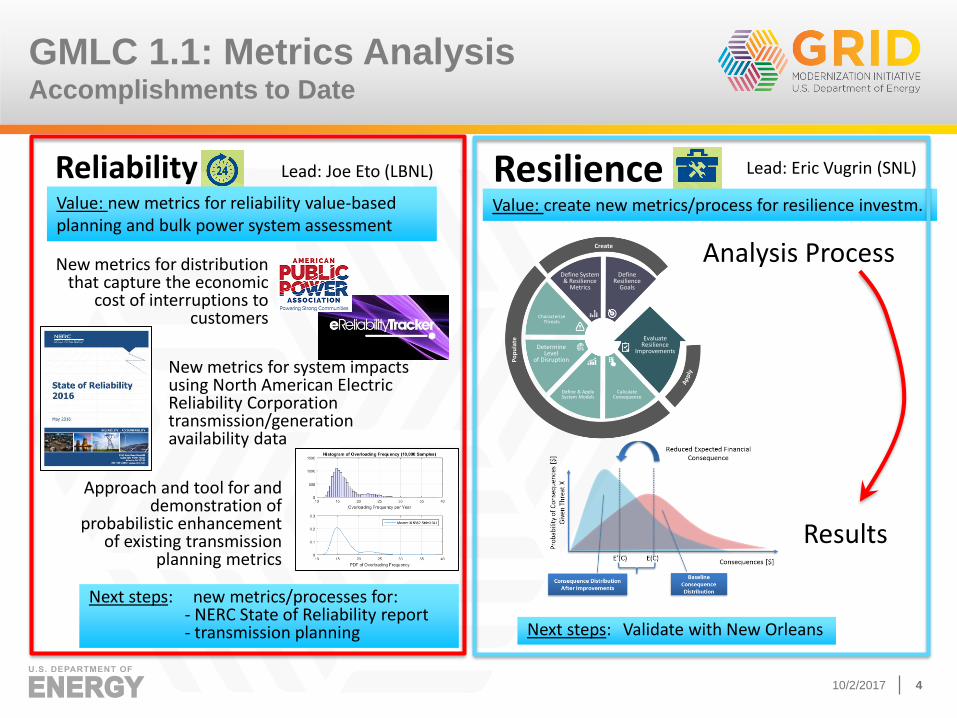
GMLC 1.1: Metrics AnalysisAccomplishments to Date
Reliability
New metrics for distribution that capture the economic
cost of interruptions to customers
New metrics for system impacts using North American Electric Reliability Corporation transmission/generation availability data
Approach and tool for and demonstration of
probabilistic enhancement of existing transmission
planning metrics
Lead: Joe Eto (LBNL)
Value: new metrics for reliability value-based planning and bulk power system assessment
Next steps: new metrics/processes for: - NERC State of Reliability report - transmission planning
Resilience
CharacterizeThreats
Po
pu
late
Define Resilience
Goals
Define System & Resilience
Metrics
Determine Level
of Disruption
Define & Apply System Models
Calculate Consequence
Evaluate Resilience
Improvements
Create Analysis Process
Results
Lead: Eric Vugrin (SNL)
Value: create new metrics/process for resilience investm.
Next steps: Validate with New Orleans
10/2/2017 5
GMLC 1.1: Metrics AnalysisAccomplishments to Date
Flexibility
Leading indicators• Requires production cost simulations with weather and other
uncertainties to design for sufficient flexibility.• Use production cost models to examine tradeoffs between
different sources of flexibility.
Lagging indicators• Requires statistical analysis of market and grid conditions to
reveal curtailments, loss of load, or other economic impacts caused by insufficient flexibility.
Developed large set of candidate metrics that represent network properties of flexibility and lack of flexibility, engaging stakeholders to identify most useful metrics
Lead: Tom Edmunds(LLNL)
Value: Develop and demonstrate usefulness of new flexibility metrics
Next steps: Work with CAISO, ERCOT to adoptflexibility metrics
Sustainability
Ability of federal greenhouse gas data products to capture changes in electric-sector CO2 emissions that might result from future grid modernization varies, depending on coverage of certain energy sources anticipated to grow.
Lead: Garvin Heath (NREL)
Value: Identify needed improvements to GHG reporting
Next steps: Assess usefulness and availability of data for impacts on water resources
EIA: AEO
EIA: MER
EPA: GHGRP
EPA: eGRID
10/2/2017 6
GMLC 1.1: Metrics AnalysisAccomplishments to Date
Affordability
Cost Burden Metrics (emerging)
• Customer electricity cost burden• Electricity affordability gap• Affordability gap headcount • Temporal indices of these metrics
Incr
easi
ng
Aff
ord
abili
tyDecreasin
gA
fford
ability
Lead: Dave Anderson (PNNL)
Value: Establish new metrics based on cost burden to consumers
Next steps: Validating metrics with Regional Partners (Alaska, New Orleans)
Security Lead: Steve Folga (ANL)
Value: Spur electric industry adoption of DHS Protective Measures Indices (i.e., security metrics)
Next steps: Validate PMI Approach with ComED and Idaho Falls
Survey/analysis Process
Results
Landscape of Existing and Proposed Metrics
Reliability
10/2/2017 7
Distribution Reliability
Existing metrics Existing (data needed) Proposed Metrics Proposed Data Needed
SAIFI Total customers servedInterruption Cost
Customers interrupted (by type of customer)
SAIDI
Characteristics of interruptions by customer type (e.g., duration, start time)
CAIDI Customer interruption duration
CAIFI
CTAIDI
ASAI Customer hours service availability
Customer service hours demanded
MAIFI Total customer momentary interruptions
CEMITotal customers experiencing more than n sustained outages
CEMSMITotal customers experiencing more than n momentary interruptions
CI Customers interrupted
CMI Customer minutes interrupted
ASIFI Total connected kVA of load interrupted
ASIDI Total connected kVA served
CELIDtotal number of customers that have experienced more than eight interruptions in a single reporting year
SARI Circuit outage number and duration
COR number of correct operations
total number of operations commanded
DELI total distribution equipment experiencing long outages
DEMI length of interruption (by equipment type)
ACOD Transmission circuit outage and duration
ACSI
TACStotal amount of equipment that have more than N # of interruptions in a single year
Cost of recovery Cumulative customer-hours of outages customer interruption duration (hours)
Utility revenue lost outage cost for utility ($) Cumulative customer energy demand not served total kVA of load interrupted
Cost of grid damage total cost of equipment repairAvg (or %) customers experiencing an outage during a specified time period
total kVA of load served
Cost per outage Cumulative critical customer-hours of outages critical customer interruption duration
Critical customer energy demand not servedtotal kVA of load interrupted for critical customers
Avg (or %) of critical loads that experience an outage
total kVA of load severed to critical customers
Time to recovery
Cost of recovery
Loss of utility revenue outage cost for utility ($)
Cost of grid damages (e.g., repair or replace lines, transformers)
total cost of equipment repair
Avoided outage costtotal kVA of interrupted load avoided
$ / kVA
Critical services without powernumber of critical services without power
total number of critical services
Critical services without power after backup fails
total number of critical services with backup powerduration of backup power for critical services
Loss of assets and perishables
Business interruption costsavg business losses per day (other than utility)
Impact on GMP or GRP
Key production facilities w/o powertotal number of key production facilities w/o power (how is this different from total kVA interrupted for critical customers?)
Key military facilities w/o powertotal number of military facilities w/o power (same comment as above)
Cost of recovery Cumulative customer-hours of outages customer interruption duration (hours)
Utility revenue lost outage cost for utility ($)Cumulative customer energy demand not served
total kVA of load interrupted (by customer?)
Cost of grid damage total cost of equipment repairAvg (or %) customers experiencing an outage during a specified time period
total kVA of load served (by customer?)
Cost per outageCumulative critical customer-hours of outages
critical customer interruption duration
Critical customer energy demand not served
total kVA of load interrupted for critical customers
Avg (or %) of critical loads that experience an outage
total kVA of load severed to critical customers
Time to recovery Thresholds? What does recovery mean?
Cost of recovery Same as above
Loss of utility revenue outage cost for utility ($)
Cost of grid damages (e.g., repair or replace lines, transformers)
total cost of equipment repair
Avoided outage costtotal kVA of interrupted load avoided
$ / kVA
Critical services without powernumber of critical services without power
total number of critical services
Critical services without power after backup fails
total number of critical services with backup power
duration of backup power for critical services
Loss of assets and perishables
Business interruption costs avg business losses per day (other than utility)
Impact on GMP or GRP
Key production facilities w/o powertotal number of key production facilities w/o power (how is this different from total kVA interrupted for critical customers?)
Key military facilities w/o powertotal number of military facilities w/o power (same comment as above)
Distribution ReliabilityExisting metrics Existing (data needed)
Proposed Metrics
Proposed Data Needed
SAIFI Total customers served Interruption Cost
Customers interrupted (by type of customer)
SAIDI
Characteristics of interruptions by customer type (e.g., duration, start time)
CAIDI Customer interruption duration
CAIFI
CTAIDI
ASAI Customer hours service availability
Customer service hours demanded
MAIFI Total customer momentary interruptions
CEMITotal customers experiencing more than n sustained outages
CEMSMITotal customers experiencing more than n momentary interruptions
CI Customers interrupted
CMI Customer minutes interrupted
ASIFI Total connected kVA of load interrupted
ASIDI Total connected kVA served
CELID
total number of customers that have experienced more than eight interruptions in a single reporting year
SARI Circuit outage number and duration
COR number of correct operations
total number of operations commanded
DELItotal distribution equipment experiencing long outages
DEMI length of interruption (by equipment type)
ACOD Transmission circuit outage and duration
ACSI
TACStotal amount of equipment that have more than N # of interruptions in a single year
FOHMY Outages per hundred miles per year
Interdependence of Metrics
only between 2 Metrics Areas
10/2/2017 10
Reliability Resilience
Flexibility
Outage cost
Sustainability
SecurityAffordability
Technologies Impact Several Metrics
10/2/2017 11
Reliability Resilience
Flexibility
Sustainability
SecurityAffordability
Technology A
Technology B
10/2/2017 12
► Metrics = the language by which one expresses changes in system
operations and system states and their impacts to customers and the
environment
► Valuation = estimating cost of a technology or policy and the monetary or
non-monetary values of the changes (before and after deployment) and
their impacts.
► Thus, with more refined and richer set of metrics, more precise and more
comprehensive valuation can be performed.
► However, methods and tools need to be created to support valuation to
project likely changes to the system and their impacts to customers and
the environment.
Synergy between Metrics and Valuation
October 2, 2017 13October 2, 2017 13
Valuation Framework Development
Define Scope
• 1. Determine Question
2. Identify Alternatives
3. Draw Bounds
Construct and Execute Study
• 4. Catalog Metrics
5. Prioritize Impacts
6. Select Tools and Assumptions
7. Model Impacts
Interpret Results and
Iterate
•8. Select Decision Criteria
9. Compare Alternatives
10. Address Uncertainty
11. Develop Recommendation
The “Framework” is really a set of guidelines on how to move through a valuation as a process to reveal all assumptions and models used
From RMI “A review of solar PV benefit and cost studies”
October 2, 2017 14October 2, 2017 14
Example Valuation: Distributed Energy
Storage
► ALL Storage provides flexibility most systems
“desire/need” under growing renewable technology
deployment
◼ Question: Which location, which size, and how to control it
► Storage technology is expensive, thus requires to capture
multiple values to be cost-effective.
◼ Requires operational optimization ALL THE TIME
► What are the right business cases for storage?
◼ How does performance and storage type matter?
◼ How to value multiple benefits?
October 2, 2017 15October 2, 2017 15
How to value multiple benefits?
Energy price ($/MWh)
Arbitrage only
October 2, 2017 16October 2, 2017 16
How to value multiple benefits?
Energy price ($/MWh)
Arbitrage only
Arbitrage + Balancing
October 2, 2017 17October 2, 2017 17
Energy price ($/MWh)
Arbitrage only
Arbitrage + Balancing
Arbitrage + Balancing + T&D deferral
How to value multiple benefits?
October 2, 2017 18October 2, 2017 18
How to value multiple benefits?
Energy price ($/MWh)
Arbitrage only
Arbitrage + Balancing
Arbitrage + Balancing + T&D deferral
Arbitrage + Balancing + T&D deferral + volt/var
October 2, 2017 19October 2, 2017 19
Battery Storage Evaluation Tool (BSET)
Graphical User Interface
October 2, 2017 20October 2, 2017 20
BSET Output
Key Lesson: Capacity
value, distribution
deferral and outage
mitigation represent a
small share of ESS
usage but a large
share of total value.
Arbitrage
Arbitrage:
Arbitrage
October 2, 2017 21October 2, 2017 21
2 MW / 4.4 MWh lithium-
ion/phosphate battery –
Glacier, WA
1 MW / 3.2 MWh UET vanadium-flow
battery – Pullman, WA
2MW / 1 MWh Li-ion system 2MW, 8.8 MWh UET
vanadium-flow- Everett, WA
Total – 7 MW / 15 MWh; $14.3
million state investment / $43 million
total investment for energy storage
systems
Washington State CEF
Energy Storage Projects
October 2, 2017 22October 2, 2017 22
Washington CEF Matrix
October 2, 2017 23
Summary of Best Practice for Storage Valuation
Developing clear understanding of the function of storage. Function will
drive valuation process
In most cases, cost-effectiveness requires to estimate bundled values
Bundling multiple services is challenging and requires optimization to make
decisions which is the highest valued service to capture.
■ Valuation Trap:
Double counting of resources
Over-committing available resources
Performance of storage technology matters in the valuation process
Not all values of grid services are easily obtainable.
■ Market based values are preferred, however, don’t help if value is to be
estimated into the future
■ For non-market services, simulations and avoided cost estimation
become necessary. This often requires a lot of modeling effort
October 2, 2017 24October 2, 2017 24
Bibliography
► GMLC1.1 Metrics Analysis. Reference Document. Version 2.1. May 2017: available at:
Simple Payback Period - Utilitytime to undiscounted equilibrium after first investment total consumption (by geographic area, customer class)
Net Revenue Requirements - Utility
fuel costsAverage customer cost index -Customer
previous average customer cost
O&M costs current average customer cost
depreciation Affordability thresholdPercent of household income deemed affordable to spend on electricity
taxes
return on rate base
Avoided Cost - Utility
energy avoided from other generators
capacity
reconfigure substations
transmission expansion or contraction
distribution expansion or contraction
Landscape of Existing and Proposed Metrics
Security
10/2/2017 31
SecurityExisting Metrics Existing Data Needed Proposed Metrics Proposed Data NeededPhysical Security Protective Measures Index (infrastructure agnostic) Input from facility owners/operators
Physical Security Protective Measures Index (electric specific)
Default aggregated data from DHS by electric infrastructure type; publically available data
Security Force Protective Measures Index (infrastructure agnostic) Input from facility owners/operators
Security Force Protective Measures Index (electric specific)
Default aggregated data from DHS by electric infrastructure type; publically available data
Security Management Protective Measures Index (infrastructure agnostic) Input from facility owners/operators
Security Management Protective Measures Index (electric specific)
Default aggregated data from DHS by electric infrastructure type; publically available data
Information Sharing Protective Measures Index (infrastructure agnostic) Input from facility owners/operators
Information Sharing Protective Measures Index (electric specific)
Default aggregated data from DHS by electric infrastructure type; publically available data
Annualized Loss ExpectancySingle loss expectancyAnnualized Rate of Occurrence
Reportable cyber security incidents
Number of cyber incidents that result in loss of load
Reportable physical security incidents Number of physical incidentsCopper theft
AttacksNumber of successful and unsuccessful attacks
Alarms Number of false or nuisance alarms
Monitoring equipment conditionNumber of malfunctions of security equipment
Security personnel performanceScore on security training exercisesScore on security tests
Vandalism Number of incidents of vandalism
Note: the above table only identifies proposed Physical Security metrics; Cyber Security metrics to be determined depending on DOE concurrence.