Page 1
pag. 3
International Journal of Serious Games Volume 4, Issue 4, December 2017
ISSN: 2384-8766 http://dx.doi.org/10.17083/ijsg.v4i4.192
Metrics Feedback Cycle: measuring and improving user engagement in gamified eLearning systems
Adam Atkins1, Vanissa Wanick2, Gary Wills3 1 First Author University of Southampton, [email protected]
2 Corresponding Author University of Southampton, [email protected] 3 University of Southampton, [email protected]
Abstract
This paper presents the identification, design and implementation of a set of metrics
of user engagement in a gamified eLearning application. The 'Metrics Feedback Cycle'
(MFC) is introduced as a formal process prescribing the iterative evaluation and
improvement of application-wide engagement, using data collected from metrics as
input to improve related engagement features. This framework was showcased using
a gamified eLearning application as a case study. In this paper, we designed a
prototype and tested it with thirty-six (N=36) students to validate the effectiveness of
the MFC. The analysis and interpretation of metrics data shows that the gamification
features had a positive effect on user engagement, and helped identify areas in which
this could be improved. We conclude that the MFC has applications in gamified
systems that seek to maximise engagement by iteratively evaluating implemented
features against a set of evolving metrics.
Keywords: gamification, eLearning, metrics;
1. Introduction
With advances in interactive technologies and the widespread adoption of games in education, the
learning experience has been through constant transformation and eLearning has become a common
supplementation to traditional schooling. In some cases, (e.g. distance learning), traditional
schooling has been completely replaced, with the implementation of Massive Open Online Courses
(MOOCs), with platforms like Coursera, and online tools like Moodle and Blackboard. It is in this
context that gamification has emerged as a design strategy to increase user engagement. There is
significant activity both in academic literature and in industry around gamification [1]. In fact,
gamification techniques are spanning many domains, including health and fitness, social computing,
and the workplace [2]. In education, gamification has been used to make learning more engaging
and motivating for students. Research has reported positive results for the application of gamification
in education, which encourages institutions to employ gamified strategies with their learning
activities [3]. Although this shows an inspiring scenario for the adoption of gamification, there is
still little research in the measurement of user engagement in gamified eLearning systems.
Gamification is the use of design components from games in non-gaming contexts to enhance
user engagement [4] and motivate users to change their behaviour [5]. Hence, user engagement and
motivation are the key outcomes of gameful system design. By definition, engagement is an active
relationship between a consumer and a product or service, with engagement measured with metrics
of recency, frequency, duration, virality and ratings [6]. Metrics from these categories can be used
to form an ‘E-score’ (i.e. engagement score), which is a single number defining the level of user
engagement. Engagement also has a strong relationship with user experience, since it reinforces
affective meaning, interaction, feedback and user control, which culminates in a positive user
experience [7]. However, gamification faces a big challenge since it is very difficult to maintain
long-term relationships with consumers [8]; i.e. ‘keeping engagement levels high’ is hard, but is
achievable through positive reinforcements and actions towards mastery.
Considering this, our paper focuses on the concept of user engagement, how gamification
techniques can be used to increase user engagement, and how it is possible to measure the
effectiveness of gamification techniques. More specifically, this paper presents the Metrics
Page 2
pag. 4
International Journal of Serious Games Volume 4, Issue 4, December 2017
ISSN: 2384-8766 http://dx.doi.org/10.17083/ijsg.v4i4.192
Feedback Cycle (MFC), which is a framework for using metric data to improve gamification
features, with the aim of increasing user engagement within a gameful application. In order to
explore the usage of the framework, we created a prototype for gamified eLearning, using game-
like elements to motivate students to learn mathematics. Details of the prototype development are
discussed in this paper, together with the metrics implemented within the prototype, which measure
the user engagement effect of corresponding gamification features.
It is important to mention, though, that together with gamification, there is the application of
games in education (serious games), which are used for purposes other than entertainment. This
paper focuses on gamification, as the emphasis is on the incorporation of game elements into an
application, rather than creating a complete game. This paper concludes with recommendations for
metrics and features in systems that employ gamification, as well as a prescription for further work
on and usage of the Metrics Feedback Cycle (MFC) for systematically improving user engagement
in other domains, over more practical longitudinal studies, and as part of software engineering
processes, to enrich real-world applications.
2. Theoretical background
This section is an analysis of the main aspects of gamification in learning environments, including
the relationship between gamification, engagement and motivation.
2.1 Gamification in learning environments
In learning environments, explicit rewards systems like points and levels are only one part of
gamification. In other words, gamification in education goes beyond those elements, involving
aspects like sense of engagement, immediate feedback, a feeling of accomplishment, and success of
overcoming a challenge [9]. Unsurprisingly, education is one of the most common applications of
gamification, with the aim to promote enjoyable experiences for learners through the use of levels,
feedback and engaging challenges [2]. Two notable and successful examples are DuoLingo and
Coursera, but some less intrusive examples of gamified learning are present in videogames like
Minecraft [10] [11] [12].
As an implemented concept, gamification is advantageous in many business contexts, as it can be
used to improve engagement with a product or brand [6], and facilitate long term product-user
relationships by motivating users to interact with the gamified elements of the application/system
(e.g. gain points in a reward system). Foursquare, StackOverflow and eBay are some examples of
web companies using gamification techniques to improve user experience and engagement.
Understanding and quantifying the level of engagement in gamified applications is paramount when
looking for ways to measure the effectiveness of gamification techniques. In fact, the main
components of a gamified strategy are: the definition of outcome, user requirements and metrics
[13]. Without a doubt, there is a need for metrics for measuring user engagement levels in gamified
applications in education. This could lead to subsequent evaluation of gamification features with
user engagement as criterion, followed by iteration on their design.
2.2 Gamification and engagement
The number of times users interact with an application, including the frequency and duration, gives
an indication of user engagement [6]. This indication of engagement can be captured by a range of
metrics. For example, if the application provides a way to interact with other people, such as giving
tips, ratings and feedback, then engagement levels can be derived from the interactions that users
have with this element. To truly capture long-term engagement levels, multiple metrics covering
different aspects and time horizons are necessary, particularly because users may be very engaged
during their first interaction and then abandon the application after some time. This approach is
heavily used in measurements of website performance through tools like Google Analytics (GA),
which can provide detailed data about the number of visits, including concepts like bounce rate,
unique visitors per page, error page analysis, dropout rate and return visits [14]. This utilisation of
GA could be very helpful when looking for insights about interactions with web applications;
however in the case of gamified applications it is expected that those metrics would be adapted. That
is, user engagement is more than just clicks and interactions, it is about the user experience [7].
In gamified applications there is the concept of gamification analytics, which tends to seek out
aspects that combine game elements and interactions with systems. An example of a game metric is
Page 3
Atkins, A., Wanick, V., Wills, G., Metrics Feedback Cycle pag. 5
International Journal of Serious Games Volume 4, Issue 4, December 2017
ISSN: 2384-8766 http://dx.doi.org/10.17083/ijsg.v4i4.192
the average time of completion of a level, the E-score (which measures recency, frequency, duration,
virality and rating) and social game metrics, which is used to measure the daily active users (DAU),
entry and exit factors, retention, interactions with other members and re-engagement (similar to
return visits) [15]. What has not been mentioned in the work of Xu [15] are the other qualities of
user engagement, such as feedback, interest and motivation, which can also help to measure the level
of user engagement in gamified applications. Thus, considering this, there are motivational elements
that should be considered when looking for metrics of effectiveness of gamified systems.
2.3 Gamification and motivation
Learning and motivation are two interrelated concepts, particularly in gaming environments. In
games, players are required to learn the game’s rules and continue playing in order to progress,
feeling hooked and interested in particular game elements or mechanics through feedback loops [16].
For example, players can perceive the consequences of their actions within the gaming environment,
augmented by their choices in the game. With this, learning becomes a motivating action, in which
players can get a sense of accomplishment and learn by doing. In this scenario, games turn into
effective tools to enhance learning motivation, which includes states like focus, engagement and
enthusiasm over time [17]. Thus, when using gamification techniques in education, ‘learning
motivation’ from a student’s perspective must be considered, in order to guide gamification feature
discovery.
Motivational affordances refer to implemented gamification features, such as a points system,
leaderboards or badges. Psychological outcomes and behavioural outcomes are the dependent
variables, and may relate to increased user engagement behaviour or increased motivation to succeed
in the game/application. The focus of this paper is on motivational affordances, the resultant
behavioural outcomes and their relation to user engagement. ‘Behavioural outcomes’ refers to the
resultant change in user behaviour stemming from the psychological outcomes induced by the
motivational affordance.
Some examples of motivational affordances described in [2] are a points system, leaderboards,
badges/achievements, levels, having an overall story/theme, clear goals, feedback, rewards, progress
and challenge. These motivational affordances focus on different areas of engagement, e.g.
increasing engagement, providing instant feedback, or inducing a feeling of accomplishment.
The two types of motivation are intrinsic and extrinsic. Intrinsic motivation is the desire to perform
an activity for the enjoyment of the activity itself, whereas extrinsic motivation is the desire to
perform an activity solely for the enjoyment of the outcome of that activity [18] [8]. According to
Hamari et al.[2], extrinsic motivation can deteriorate, depending on individual characteristics; thus,
extrinsic motivation has to be combined with intrinsic motivation in order to change behaviour [19].
If using extrinsic rewards solely, then change of behaviour may only be temporary, before the
original behaviour is reverted. For example, an individual may feel motivated to study hard, but after
time the desire for the outcomes of studying hard may reduce, so the original behaviour of working
less hard may return.
Squire [20] compares Pac-Man with traditional schooling and suggests that schools are
structured around extrinsic motivators, such as good grades or fear of failure. In contrast: games are
played for the intrinsic reward of playing them, and for the emotional state they induce [21].
Crossing over the two may have some benefit, as developing a learning system that evokes the same
intrinsic reward and emotional response, may (at least partially) remove the need for extrinsic
rewards, resulting in the learning application itself motivating students.
The origination of motivation for an individual can be derived from four main types of interaction.
These include, ‘Hard Fun’, ‘Easy Fun’, ‘Serious Fun’ and ‘People Fun’ [22]. Table 1 shows
commonly used gamification techniques (all used in this study), along with the effect on engagement
and the type of interaction.
Considering this, there are many benefits of gamification, such as increased engagement,
increasing the intrinsic reward produced by a learning system, reducing the need for extrinsic
rewards, providing immediate feedback and nurturing a sense of accomplishment.
Page 4
pag. 6
International Journal of Serious Games Volume 4, Issue 4, December 2017
ISSN: 2384-8766 http://dx.doi.org/10.17083/ijsg.v4i4.192
Table 1. Commonly used gamification techniques, the resultant effect on engagement, and
the type of motivation interaction involved
Gamification
technique
Effect on Engagement Motivation interaction
Leaderboard/Points Users return, to try and gain points
or progress in the leaderboard ‘People Fun’ interaction
Competitive nature of
leaderboard encourages users
to overtake their peers
Points system without
leaderboard reduces potential
embarrassment while
maintaining a level of
competition, through indirect
social means
Badges/Achievements Users return, to continue with a
challenge in order to receive a
badge or achieve a goal, increasing
engagement
‘Easy Fun’ interaction
Badge introduces a goal for
users to work towards
Levelling system Users remain engaged for longer,
to try to progress to the next level ‘Hard Fun’ interaction
Defined levels act as goals for
a user to work towards
Hard, as opposed to ‘Easy
fun’, as gaining levels can be
laborious
Feedback When users receive positive
feedback their engagement
increases. Negative feedback has
potential to reduce engagement if
it occurs too often
‘Easy Fun’ interaction
Motivation to receive good
feedback over negative
Can be linked to
badges/achievements
2.4 Metrics of gamification effectiveness
There is a breadth of research considering metrics for monitoring web applications [23], and features
for increasing engagement, gamification-based and otherwise. However, currently there is no formal
definition of a process describing the iterative evaluation and improvement of engagement features,
using metric data as guidance. Therefore, there is an opportunity to link the two concepts of metrics
and features in a useful and synergistic manner, using a feedback loop to positively reinforce features
that promote desired behaviour.
Literature case studies by O’Donovan et al. [24] and Ibanez et al. [25] make use of gamification
features for improving engagement, and touch on metrics to a lesser extent, but do not use the
collected metric data for iterative improvement. O’Donovan et al. [24] looked at metrics from the
perspective of the student through student questionnaires, feedback and other data analytics, such as
attendance, grades and time spent, and Ibanez et al. [25] collected similar qualitative and quantitative
data.
Similarly, Heilbrunn et al. [27] [28] utilised expert interviews to confirm that key performance
indicators (KPIs), game elements and user groups are important areas in which metric data should
be collected and monitored. These are the areas of focus in our study.
In terms of actual metrics, these are sometimes borrowed and adapted from web analytics, with
metrics such as: bounce rate, churn, average revenue per user (ARPU) and daily active users (DAU)
[15]. Commercial products like Google Analytics can be used to collect some of these metrics and
provide broad insight, but are too generalised for specific feature-level monitoring. Heilbrunn et al.
[28] imply that bespoke metrics are necessary to monitor custom application features. This paper
focuses on bespoke metrics, often tailored per-feature, to track the engagement effect of
implemented gamification features. These not only measure the engagement levels of the eLearning
application, but also contribute to a novel way of improving gamified systems, by providing
actionable analytics data.
Page 5
Atkins, A., Wanick, V., Wills, G., Metrics Feedback Cycle pag. 7
International Journal of Serious Games Volume 4, Issue 4, December 2017
ISSN: 2384-8766 http://dx.doi.org/10.17083/ijsg.v4i4.192
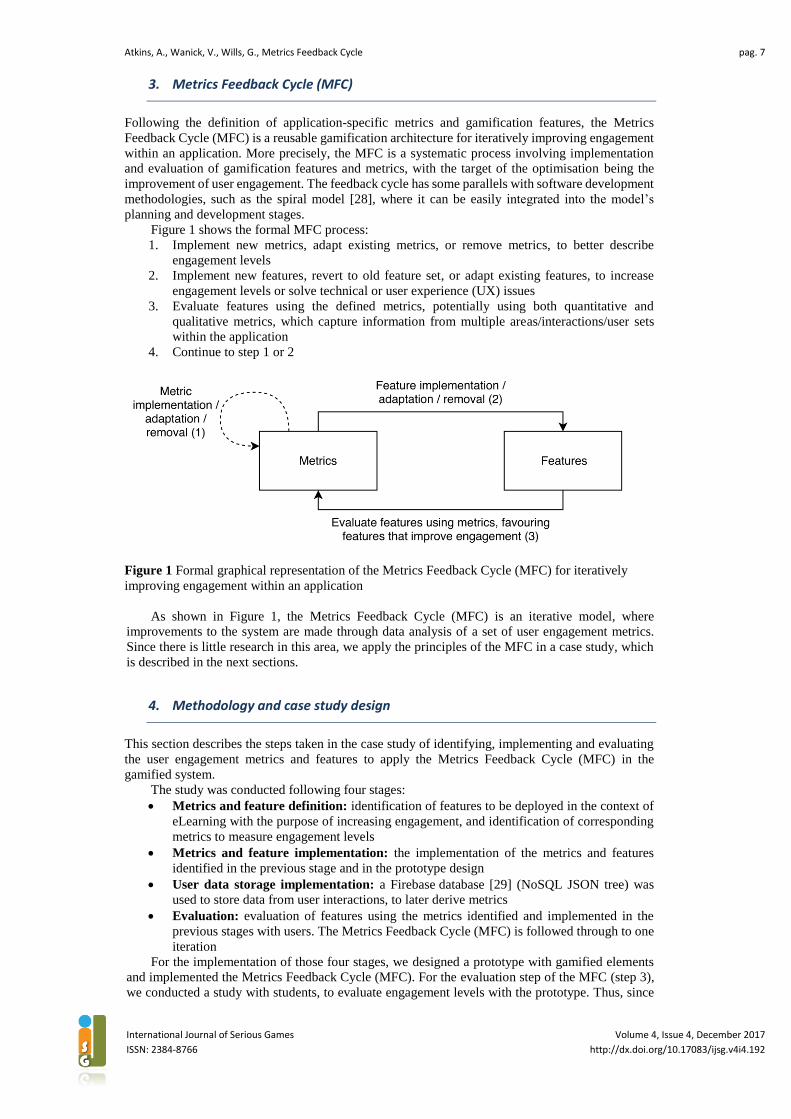
3. Metrics Feedback Cycle (MFC)
Following the definition of application-specific metrics and gamification features, the Metrics
Feedback Cycle (MFC) is a reusable gamification architecture for iteratively improving engagement
within an application. More precisely, the MFC is a systematic process involving implementation
and evaluation of gamification features and metrics, with the target of the optimisation being the
improvement of user engagement. The feedback cycle has some parallels with software development
methodologies, such as the spiral model [28], where it can be easily integrated into the model’s
planning and development stages.
Figure 1 shows the formal MFC process:
1. Implement new metrics, adapt existing metrics, or remove metrics, to better describe
engagement levels
2. Implement new features, revert to old feature set, or adapt existing features, to increase
engagement levels or solve technical or user experience (UX) issues
3. Evaluate features using the defined metrics, potentially using both quantitative and
qualitative metrics, which capture information from multiple areas/interactions/user sets
within the application
4. Continue to step 1 or 2
Figure 1 Formal graphical representation of the Metrics Feedback Cycle (MFC) for iteratively
improving engagement within an application
As shown in Figure 1, the Metrics Feedback Cycle (MFC) is an iterative model, where
improvements to the system are made through data analysis of a set of user engagement metrics.
Since there is little research in this area, we apply the principles of the MFC in a case study, which
is described in the next sections.
4. Methodology and case study design
This section describes the steps taken in the case study of identifying, implementing and evaluating
the user engagement metrics and features to apply the Metrics Feedback Cycle (MFC) in the
gamified system.
The study was conducted following four stages:
Metrics and feature definition: identification of features to be deployed in the context of
eLearning with the purpose of increasing engagement, and identification of corresponding
metrics to measure engagement levels
Metrics and feature implementation: the implementation of the metrics and features
identified in the previous stage and in the prototype design
User data storage implementation: a Firebase database [29] (NoSQL JSON tree) was
used to store data from user interactions, to later derive metrics
Evaluation: evaluation of features using the metrics identified and implemented in the
previous stages with users. The Metrics Feedback Cycle (MFC) is followed through to one
iteration
For the implementation of those four stages, we designed a prototype with gamified elements
and implemented the Metrics Feedback Cycle (MFC). For the evaluation step of the MFC (step 3),
we conducted a study with students, to evaluate engagement levels with the prototype. Thus, since
Page 6
pag. 8
International Journal of Serious Games Volume 4, Issue 4, December 2017
ISSN: 2384-8766 http://dx.doi.org/10.17083/ijsg.v4i4.192
our objective was to implement and evaluate the application of the MFC, the MFC process described
in the previous section guided our methodology and study design. This is explained in detail in the
next sections.
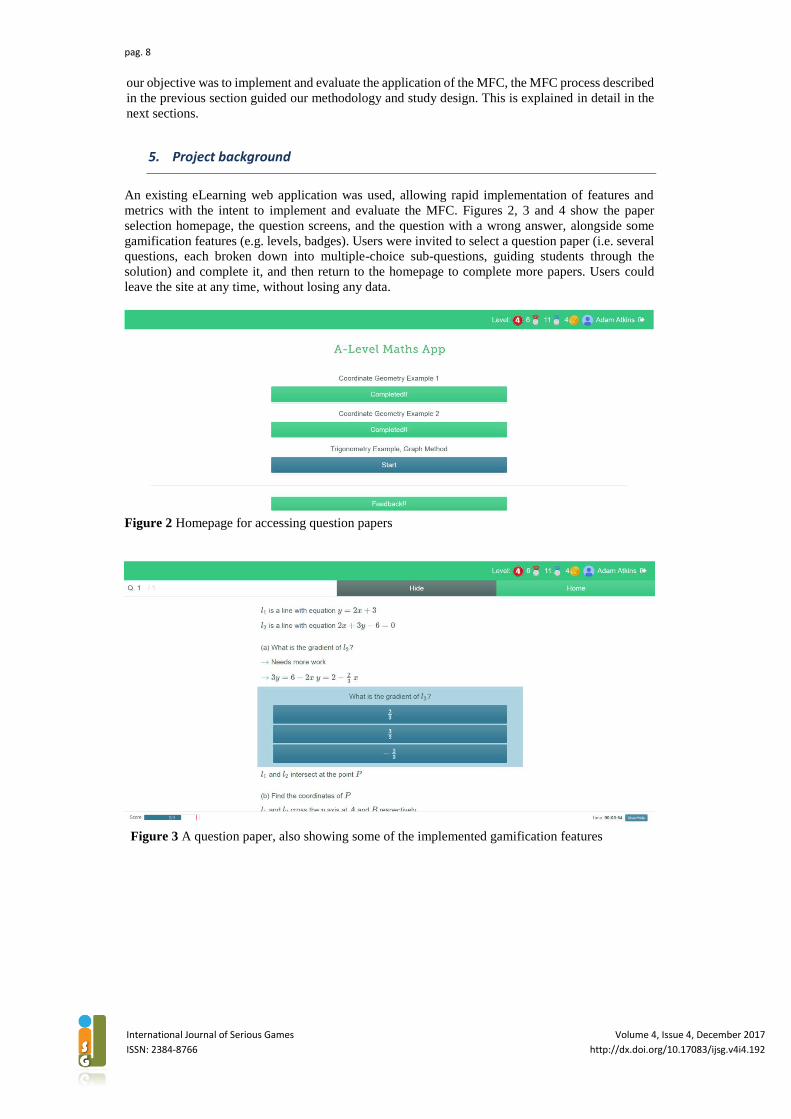
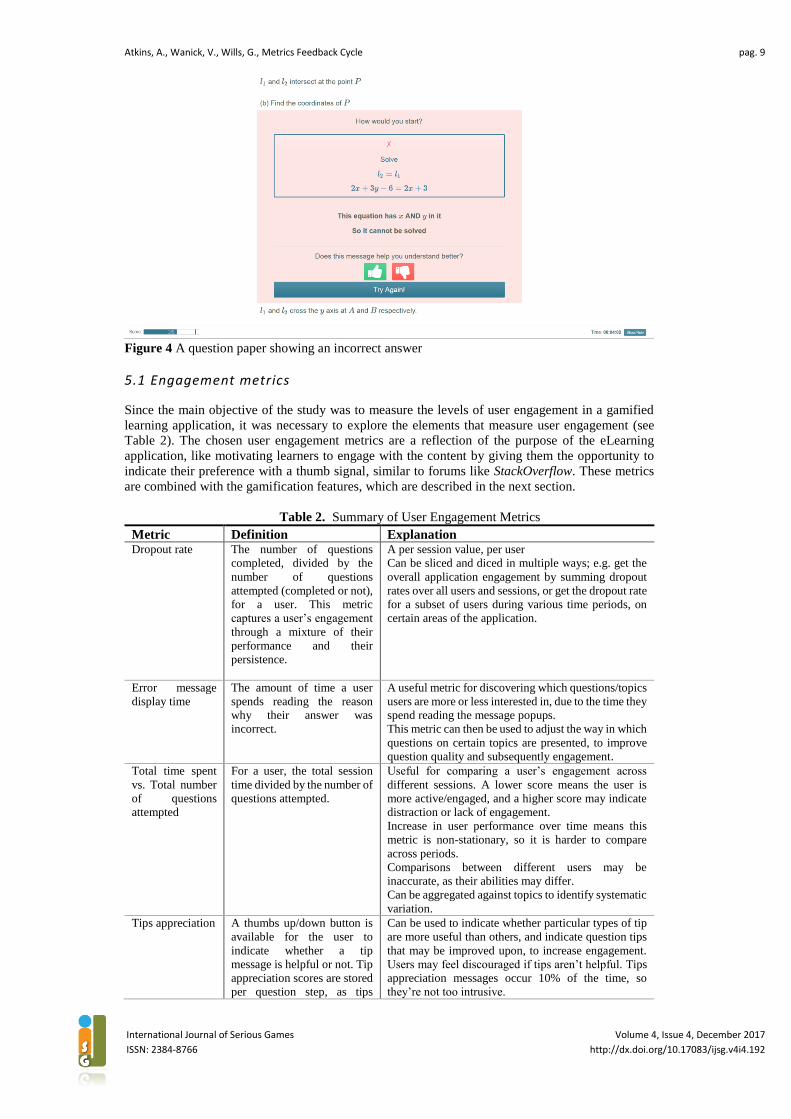
5. Project background
An existing eLearning web application was used, allowing rapid implementation of features and
metrics with the intent to implement and evaluate the MFC. Figures 2, 3 and 4 show the paper
selection homepage, the question screens, and the question with a wrong answer, alongside some
gamification features (e.g. levels, badges). Users were invited to select a question paper (i.e. several
questions, each broken down into multiple-choice sub-questions, guiding students through the
solution) and complete it, and then return to the homepage to complete more papers. Users could
leave the site at any time, without losing any data.
Figure 2 Homepage for accessing question papers
Figure 3 A question paper, also showing some of the implemented gamification features
Page 7
Atkins, A., Wanick, V., Wills, G., Metrics Feedback Cycle pag. 9
International Journal of Serious Games Volume 4, Issue 4, December 2017
ISSN: 2384-8766 http://dx.doi.org/10.17083/ijsg.v4i4.192
Figure 4 A question paper showing an incorrect answer
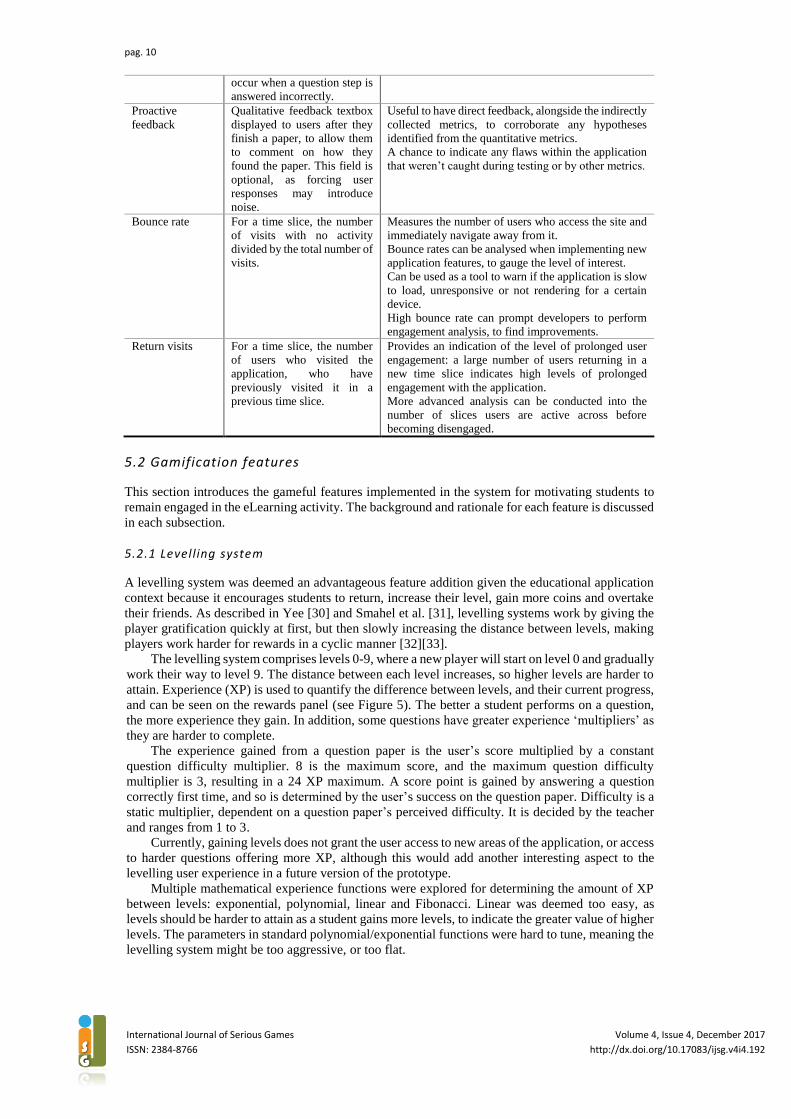
5.1 Engagement metrics
Since the main objective of the study was to measure the levels of user engagement in a gamified
learning application, it was necessary to explore the elements that measure user engagement (see
Table 2). The chosen user engagement metrics are a reflection of the purpose of the eLearning
application, like motivating learners to engage with the content by giving them the opportunity to
indicate their preference with a thumb signal, similar to forums like StackOverflow. These metrics
are combined with the gamification features, which are described in the next section.
Table 2. Summary of User Engagement Metrics
Metric Definition Explanation Dropout rate The number of questions
completed, divided by the
number of questions
attempted (completed or not),
for a user. This metric
captures a user’s engagement
through a mixture of their
performance and their
persistence.
A per session value, per user
Can be sliced and diced in multiple ways; e.g. get the
overall application engagement by summing dropout
rates over all users and sessions, or get the dropout rate
for a subset of users during various time periods, on
certain areas of the application.
Error message
display time
The amount of time a user
spends reading the reason
why their answer was
incorrect.
A useful metric for discovering which questions/topics
users are more or less interested in, due to the time they
spend reading the message popups.
This metric can then be used to adjust the way in which
questions on certain topics are presented, to improve
question quality and subsequently engagement.
Total time spent
vs. Total number
of questions
attempted
For a user, the total session
time divided by the number of
questions attempted.
Useful for comparing a user’s engagement across
different sessions. A lower score means the user is
more active/engaged, and a higher score may indicate
distraction or lack of engagement.
Increase in user performance over time means this
metric is non-stationary, so it is harder to compare
across periods.
Comparisons between different users may be
inaccurate, as their abilities may differ.
Can be aggregated against topics to identify systematic
variation.
Tips appreciation A thumbs up/down button is
available for the user to
indicate whether a tip
message is helpful or not. Tip
appreciation scores are stored
per question step, as tips
Can be used to indicate whether particular types of tip
are more useful than others, and indicate question tips
that may be improved upon, to increase engagement.
Users may feel discouraged if tips aren’t helpful. Tips
appreciation messages occur 10% of the time, so
they’re not too intrusive.
Page 8
pag. 10
International Journal of Serious Games Volume 4, Issue 4, December 2017
ISSN: 2384-8766 http://dx.doi.org/10.17083/ijsg.v4i4.192
occur when a question step is
answered incorrectly.
Proactive
feedback
Qualitative feedback textbox
displayed to users after they
finish a paper, to allow them
to comment on how they
found the paper. This field is
optional, as forcing user
responses may introduce
noise.
Useful to have direct feedback, alongside the indirectly
collected metrics, to corroborate any hypotheses
identified from the quantitative metrics.
A chance to indicate any flaws within the application
that weren’t caught during testing or by other metrics.
Bounce rate For a time slice, the number
of visits with no activity
divided by the total number of
visits.
Measures the number of users who access the site and
immediately navigate away from it.
Bounce rates can be analysed when implementing new
application features, to gauge the level of interest.
Can be used as a tool to warn if the application is slow
to load, unresponsive or not rendering for a certain
device.
High bounce rate can prompt developers to perform
engagement analysis, to find improvements.
Return visits For a time slice, the number
of users who visited the
application, who have
previously visited it in a
previous time slice.
Provides an indication of the level of prolonged user
engagement: a large number of users returning in a
new time slice indicates high levels of prolonged
engagement with the application.
More advanced analysis can be conducted into the
number of slices users are active across before
becoming disengaged.
5.2 Gamification features
This section introduces the gameful features implemented in the system for motivating students to
remain engaged in the eLearning activity. The background and rationale for each feature is discussed
in each subsection.
5.2.1 Levelling system
A levelling system was deemed an advantageous feature addition given the educational application
context because it encourages students to return, increase their level, gain more coins and overtake
their friends. As described in Yee [30] and Smahel et al. [31], levelling systems work by giving the
player gratification quickly at first, but then slowly increasing the distance between levels, making
players work harder for rewards in a cyclic manner [32][33].
The levelling system comprises levels 0-9, where a new player will start on level 0 and gradually
work their way to level 9. The distance between each level increases, so higher levels are harder to
attain. Experience (XP) is used to quantify the difference between levels, and their current progress,
and can be seen on the rewards panel (see Figure 5). The better a student performs on a question,
the more experience they gain. In addition, some questions have greater experience ‘multipliers’ as
they are harder to complete.
The experience gained from a question paper is the user’s score multiplied by a constant
question difficulty multiplier. 8 is the maximum score, and the maximum question difficulty
multiplier is 3, resulting in a 24 XP maximum. A score point is gained by answering a question
correctly first time, and so is determined by the user’s success on the question paper. Difficulty is a
static multiplier, dependent on a question paper’s perceived difficulty. It is decided by the teacher
and ranges from 1 to 3.
Currently, gaining levels does not grant the user access to new areas of the application, or access
to harder questions offering more XP, although this would add another interesting aspect to the
levelling user experience in a future version of the prototype.
Multiple mathematical experience functions were explored for determining the amount of XP
between levels: exponential, polynomial, linear and Fibonacci. Linear was deemed too easy, as
levels should be harder to attain as a student gains more levels, to indicate the greater value of higher
levels. The parameters in standard polynomial/exponential functions were hard to tune, meaning the
levelling system might be too aggressive, or too flat.
Page 9
Atkins, A., Wanick, V., Wills, G., Metrics Feedback Cycle pag. 11
International Journal of Serious Games Volume 4, Issue 4, December 2017
ISSN: 2384-8766 http://dx.doi.org/10.17083/ijsg.v4i4.192
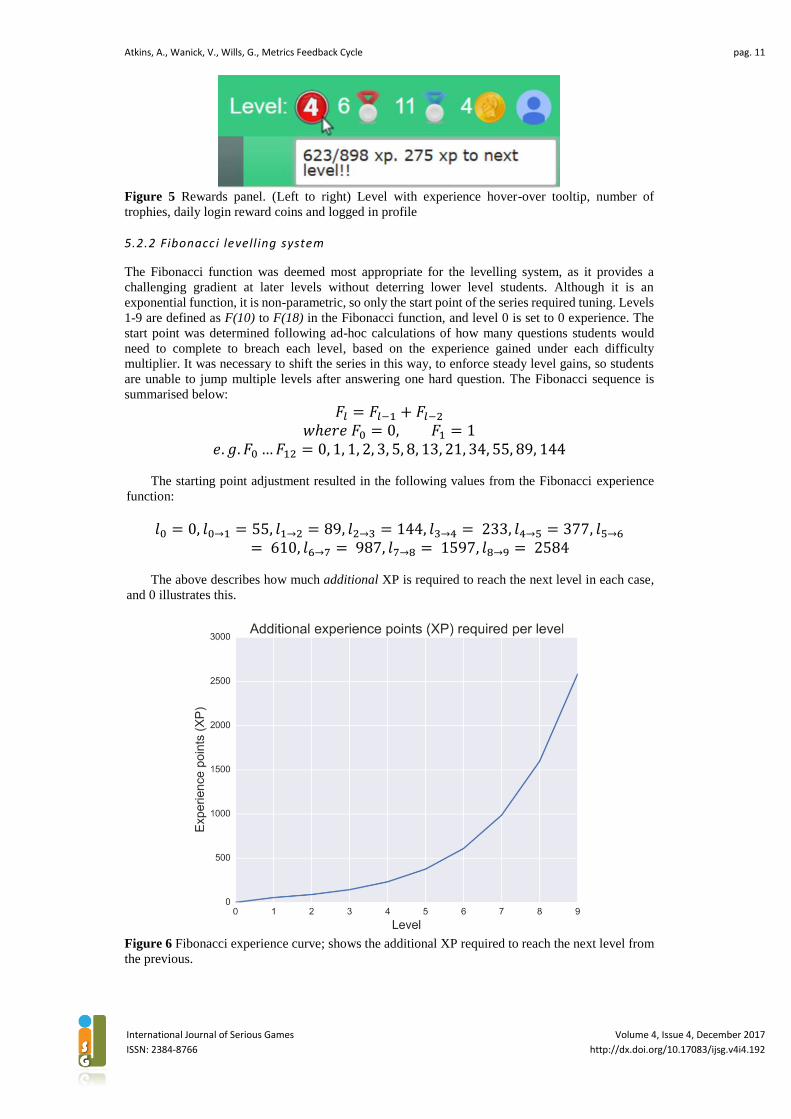
Figure 5 Rewards panel. (Left to right) Level with experience hover-over tooltip, number of
trophies, daily login reward coins and logged in profile
5.2.2 Fibonacci levell ing system
The Fibonacci function was deemed most appropriate for the levelling system, as it provides a
challenging gradient at later levels without deterring lower level students. Although it is an
exponential function, it is non-parametric, so only the start point of the series required tuning. Levels
1-9 are defined as F(10) to F(18) in the Fibonacci function, and level 0 is set to 0 experience. The
start point was determined following ad-hoc calculations of how many questions students would
need to complete to breach each level, based on the experience gained under each difficulty
multiplier. It was necessary to shift the series in this way, to enforce steady level gains, so students
are unable to jump multiple levels after answering one hard question. The Fibonacci sequence is
summarised below:
𝐹𝑙 = 𝐹𝑙−1 + 𝐹𝑙−2
𝑤ℎ𝑒𝑟𝑒 𝐹0 = 0, 𝐹1 = 1
𝑒. 𝑔. 𝐹0 … 𝐹12 = 0, 1, 1, 2, 3, 5, 8, 13, 21, 34, 55, 89, 144
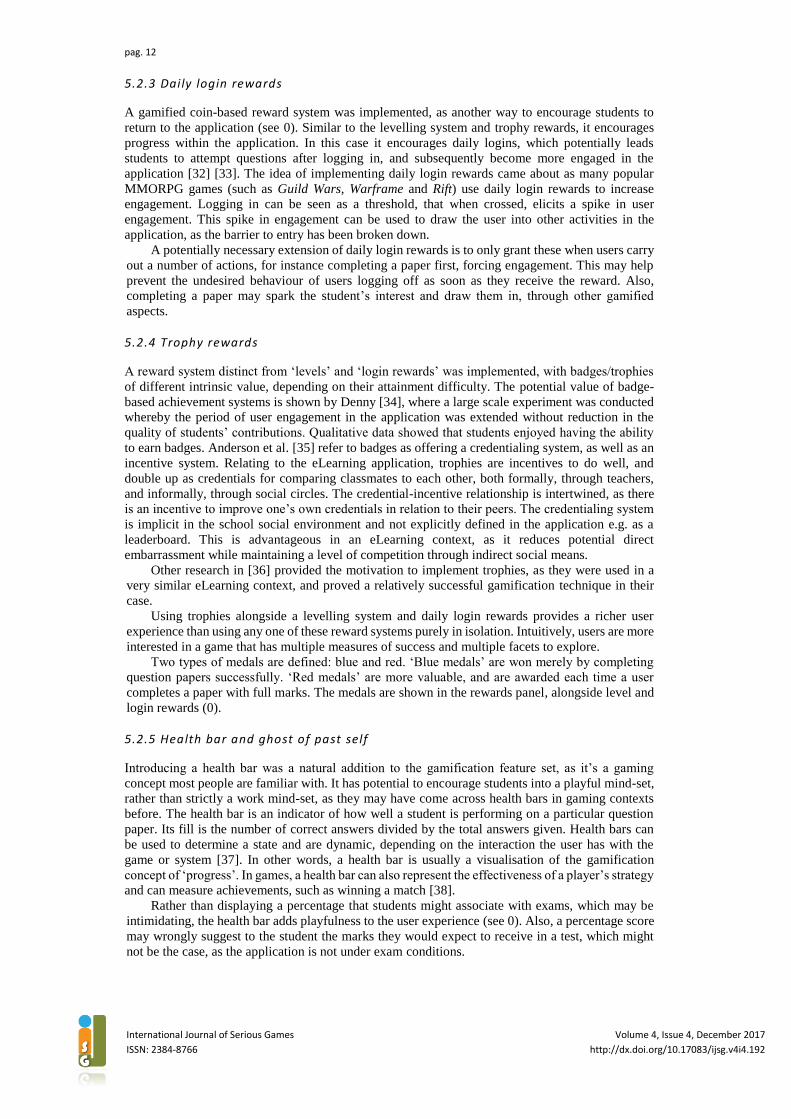
The starting point adjustment resulted in the following values from the Fibonacci experience
function:
𝑙0 = 0, 𝑙0→1 = 55, 𝑙1→2 = 89, 𝑙2→3 = 144, 𝑙3→4 = 233, 𝑙4→5 = 377, 𝑙5→6
= 610, 𝑙6→7 = 987, 𝑙7→8 = 1597, 𝑙8→9 = 2584
The above describes how much additional XP is required to reach the next level in each case,
and 0 illustrates this.
Figure 6 Fibonacci experience curve; shows the additional XP required to reach the next level from
the previous.
Page 10
pag. 12
International Journal of Serious Games Volume 4, Issue 4, December 2017
ISSN: 2384-8766 http://dx.doi.org/10.17083/ijsg.v4i4.192
5.2.3 Daily login rewards
A gamified coin-based reward system was implemented, as another way to encourage students to
return to the application (see 0). Similar to the levelling system and trophy rewards, it encourages
progress within the application. In this case it encourages daily logins, which potentially leads
students to attempt questions after logging in, and subsequently become more engaged in the
application [32] [33]. The idea of implementing daily login rewards came about as many popular
MMORPG games (such as Guild Wars, Warframe and Rift) use daily login rewards to increase
engagement. Logging in can be seen as a threshold, that when crossed, elicits a spike in user
engagement. This spike in engagement can be used to draw the user into other activities in the
application, as the barrier to entry has been broken down.
A potentially necessary extension of daily login rewards is to only grant these when users carry
out a number of actions, for instance completing a paper first, forcing engagement. This may help
prevent the undesired behaviour of users logging off as soon as they receive the reward. Also,
completing a paper may spark the student’s interest and draw them in, through other gamified
aspects.
5.2.4 Trophy rewards
A reward system distinct from ‘levels’ and ‘login rewards’ was implemented, with badges/trophies
of different intrinsic value, depending on their attainment difficulty. The potential value of badge-
based achievement systems is shown by Denny [34], where a large scale experiment was conducted
whereby the period of user engagement in the application was extended without reduction in the
quality of students’ contributions. Qualitative data showed that students enjoyed having the ability
to earn badges. Anderson et al. [35] refer to badges as offering a credentialing system, as well as an
incentive system. Relating to the eLearning application, trophies are incentives to do well, and
double up as credentials for comparing classmates to each other, both formally, through teachers,
and informally, through social circles. The credential-incentive relationship is intertwined, as there
is an incentive to improve one’s own credentials in relation to their peers. The credentialing system
is implicit in the school social environment and not explicitly defined in the application e.g. as a
leaderboard. This is advantageous in an eLearning context, as it reduces potential direct
embarrassment while maintaining a level of competition through indirect social means.
Other research in [36] provided the motivation to implement trophies, as they were used in a
very similar eLearning context, and proved a relatively successful gamification technique in their
case.
Using trophies alongside a levelling system and daily login rewards provides a richer user
experience than using any one of these reward systems purely in isolation. Intuitively, users are more
interested in a game that has multiple measures of success and multiple facets to explore.
Two types of medals are defined: blue and red. ‘Blue medals’ are won merely by completing
question papers successfully. ‘Red medals’ are more valuable, and are awarded each time a user
completes a paper with full marks. The medals are shown in the rewards panel, alongside level and
login rewards (0).
5.2.5 Health bar and ghost of past self
Introducing a health bar was a natural addition to the gamification feature set, as it’s a gaming
concept most people are familiar with. It has potential to encourage students into a playful mind-set,
rather than strictly a work mind-set, as they may have come across health bars in gaming contexts
before. The health bar is an indicator of how well a student is performing on a particular question
paper. Its fill is the number of correct answers divided by the total answers given. Health bars can
be used to determine a state and are dynamic, depending on the interaction the user has with the
game or system [37]. In other words, a health bar is usually a visualisation of the gamification
concept of ‘progress’. In games, a health bar can also represent the effectiveness of a player’s strategy
and can measure achievements, such as winning a match [38].
Rather than displaying a percentage that students might associate with exams, which may be
intimidating, the health bar adds playfulness to the user experience (see 0). Also, a percentage score
may wrongly suggest to the student the marks they would expect to receive in a test, which might
not be the case, as the application is not under exam conditions.
Page 11
Atkins, A., Wanick, V., Wills, G., Metrics Feedback Cycle pag. 13
International Journal of Serious Games Volume 4, Issue 4, December 2017
ISSN: 2384-8766 http://dx.doi.org/10.17083/ijsg.v4i4.192
Figure 7 Health bar with ghost of past self. Appears in bottom panel.
To build upon this, when students come back to a question paper, their past attempt is indicated
on the health bar as a red line. This encourages students to compete with themselves, by trying to
surpass their previous final health score. Self-competition was favoured over implementing a feature
to evoke competition between users, which may discourage weaker students from participating, due
to potential embarrassment.
5.2.6 Question t imer
As students approach exams, a useful feature is to be able to time question answering, so exam
readiness can be tracked. As well as the obvious utility benefits of the tool, it is also an instrument
for gamification, as it encourages self-competition, albeit less directly than the health bar.
Question timing and test score data can be aggregated and used as engagement measures,
effectively using student performance as a proxy for engagement. Improvement in question
completion time and test scores indicates a more engaged learner.
The timer does not affect a student’s final score, and it can optionally be hidden, so that students
are not encouraged to rush through papers to complete them quickly (see 0). Functionally, the ethos
of the application is around students learning from their mistakes by reading the tips, and less around
speed, until they’re confident.
Figure 8 Question timer with show/hide. Appears in bottom panel.
5.2.7 Distraction-reduction alerts
As the application is web-based, there is a possibility of users changing tabs or applications, due to
distractions. To maintain a high level of engagement, it is important to regain the user’s attention
when their focus is not on the application. To achieve this, the web page title blinks between two
messages when focus is on another tab or application. After 15 seconds of the application being out
of focus, the title intermittently changes (every half second) between two predefined strings ‘Hey!’
and ‘Come back!’. An alert sound also plays after the 15-second period of inactivity, but only once,
to avoid potential annoyance.
5.2.8 Random encouragements
Web-based tutoring loses some of the nuances of traditional tutoring, such as encouragement and
motivation provided by a human tutor, which stimulates the student, and in turn reinforces their
engagement and concentration (see 0). To try and replicate this to some extent, random
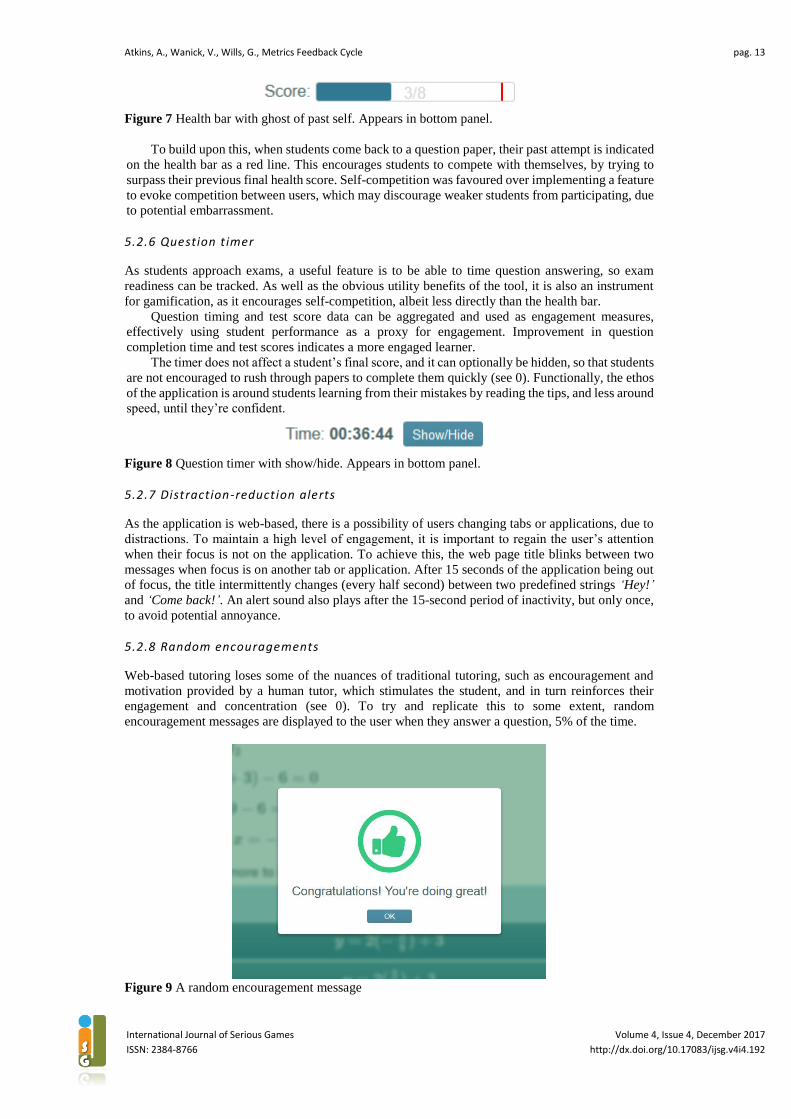
encouragement messages are displayed to the user when they answer a question, 5% of the time.
Figure 9 A random encouragement message
Page 12
pag. 14
International Journal of Serious Games Volume 4, Issue 4, December 2017
ISSN: 2384-8766 http://dx.doi.org/10.17083/ijsg.v4i4.192
This method of increasing engagement is distinct from levels, and trophy rewards, in that it
benefits both low and high achieving students. The other gamification features may alienate lower
achieving students, whereas random encouragements (along with ‘Blue trophy rewards’) remedy
this, as they are related to effort rather than performance.
The existing encouragement mechanism is rudimentary; however more targeted encouragement
messages in later versions could potentially increase engagement further. For example, ‘You’re
doing really well at topic X. Keep up the good work!’, which may be triggered because the student
has improved significantly over a number of papers in a given topic. Furthermore, encouragements
like these can be displayed when a student positively completes a task, rather than displaying them
randomly; this could be more effective for overall student motivation. Currently, the dialog is modal,
but in later versions a notification style popup will be used, to ensure it doesn’t interrupt the student’s
train of thought.
6. Data analysis and interpretation
Thirty-six (n=36) participants were invited to take part in the study. All participants had, or were
working towards, advanced level high school mathematics qualifications and were between 16-18
years old. Participants were both male and female, although demographic data was not recorded, as
considering differences between sexes is not the purpose of this study. Participants were invited to
interact with the online prototype and solve three question papers in one, approximately one hour,
session. The sessions took part under guided supervision, in a quiet classroom. Data from the
participants’ interaction were gathered during this process and assigned to an anonymous string ID,
so no personal information was recorded.
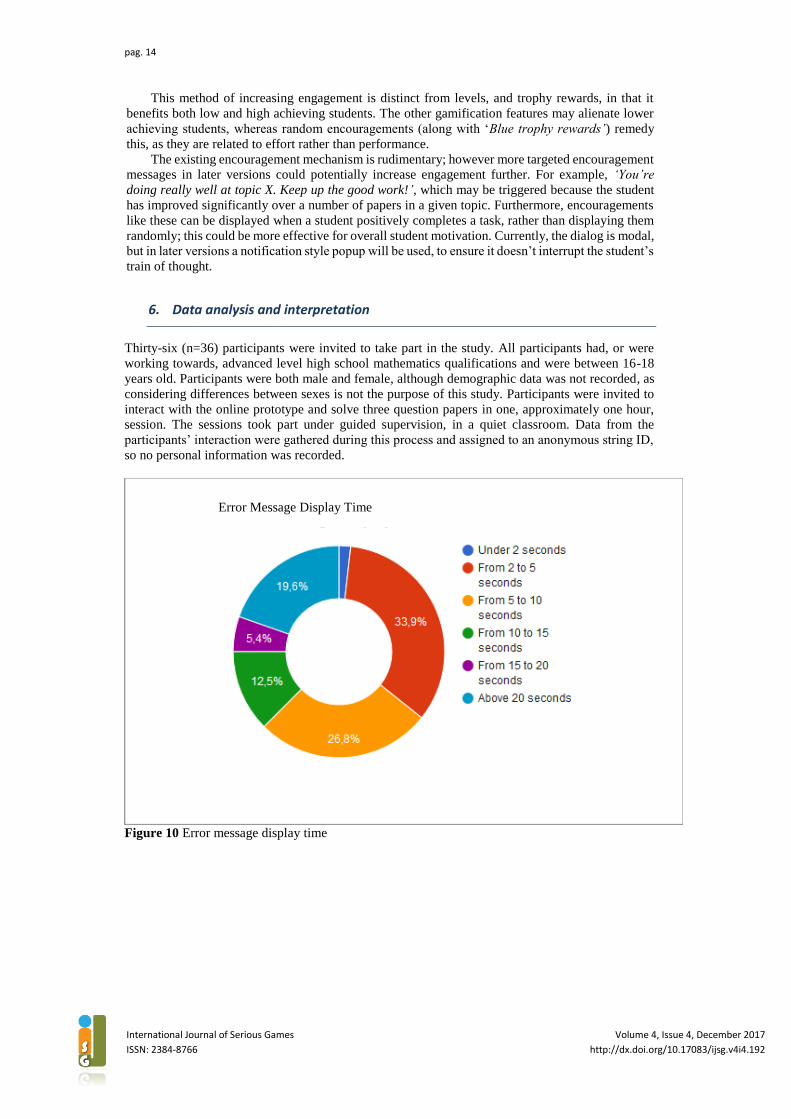
Figure 10 Error message display time
Error Message Display Time
Page 13
Atkins, A., Wanick, V., Wills, G., Metrics Feedback Cycle pag. 15
International Journal of Serious Games Volume 4, Issue 4, December 2017
ISSN: 2384-8766 http://dx.doi.org/10.17083/ijsg.v4i4.192
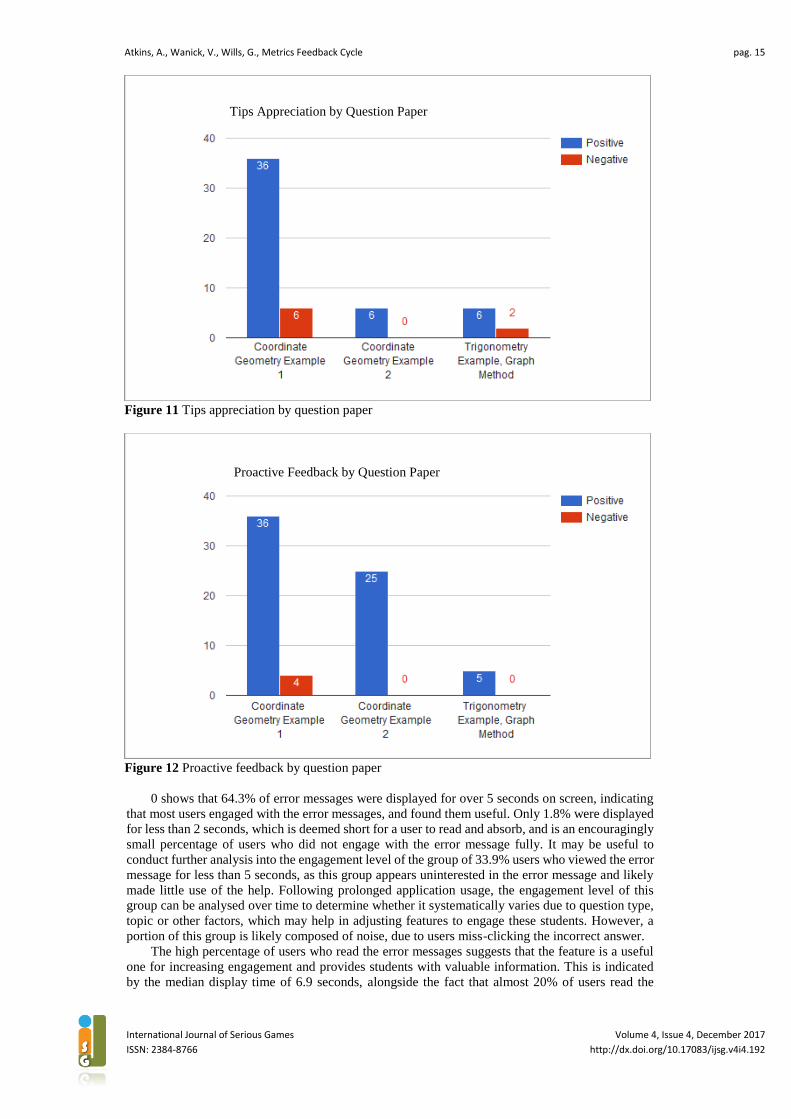
Figure 11 Tips appreciation by question paper
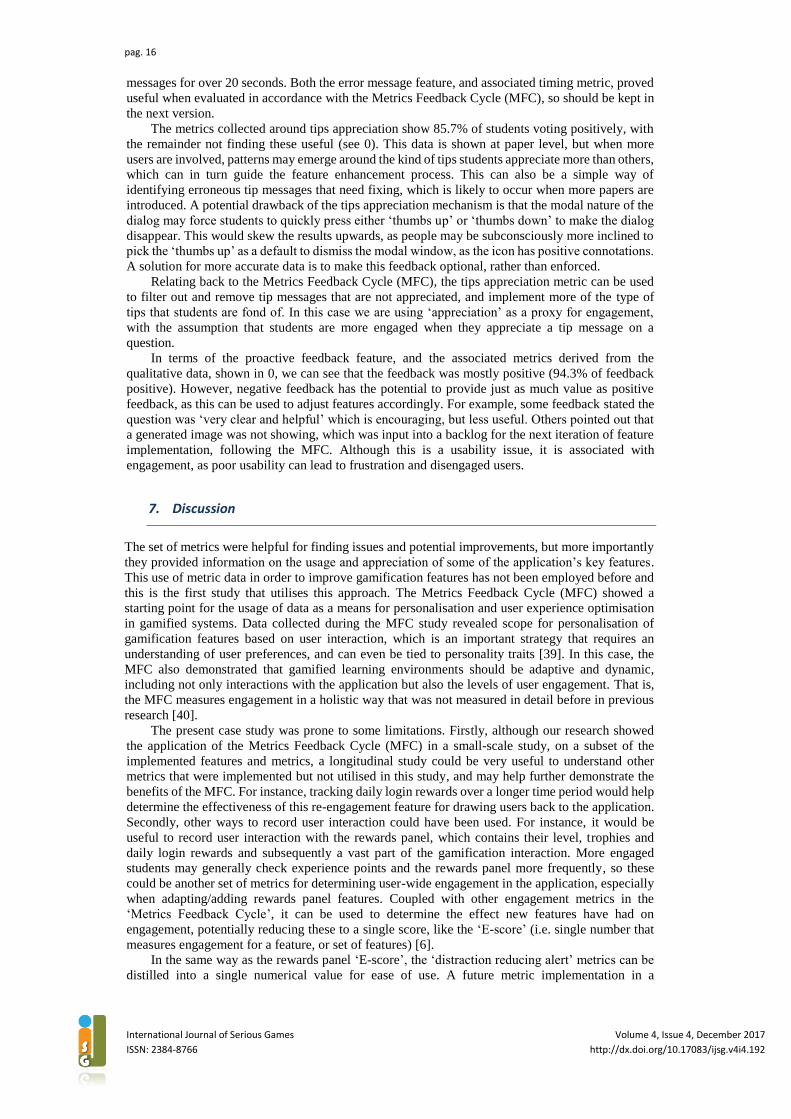
Figure 12 Proactive feedback by question paper
0 shows that 64.3% of error messages were displayed for over 5 seconds on screen, indicating
that most users engaged with the error messages, and found them useful. Only 1.8% were displayed
for less than 2 seconds, which is deemed short for a user to read and absorb, and is an encouragingly
small percentage of users who did not engage with the error message fully. It may be useful to
conduct further analysis into the engagement level of the group of 33.9% users who viewed the error
message for less than 5 seconds, as this group appears uninterested in the error message and likely
made little use of the help. Following prolonged application usage, the engagement level of this
group can be analysed over time to determine whether it systematically varies due to question type,
topic or other factors, which may help in adjusting features to engage these students. However, a
portion of this group is likely composed of noise, due to users miss-clicking the incorrect answer.
The high percentage of users who read the error messages suggests that the feature is a useful
one for increasing engagement and provides students with valuable information. This is indicated
by the median display time of 6.9 seconds, alongside the fact that almost 20% of users read the
Tips Appreciation by Question Paper
Proactive Feedback by Question Paper
Page 14
pag. 16
International Journal of Serious Games Volume 4, Issue 4, December 2017
ISSN: 2384-8766 http://dx.doi.org/10.17083/ijsg.v4i4.192
messages for over 20 seconds. Both the error message feature, and associated timing metric, proved
useful when evaluated in accordance with the Metrics Feedback Cycle (MFC), so should be kept in
the next version.
The metrics collected around tips appreciation show 85.7% of students voting positively, with
the remainder not finding these useful (see 0). This data is shown at paper level, but when more
users are involved, patterns may emerge around the kind of tips students appreciate more than others,
which can in turn guide the feature enhancement process. This can also be a simple way of
identifying erroneous tip messages that need fixing, which is likely to occur when more papers are
introduced. A potential drawback of the tips appreciation mechanism is that the modal nature of the
dialog may force students to quickly press either ‘thumbs up’ or ‘thumbs down’ to make the dialog
disappear. This would skew the results upwards, as people may be subconsciously more inclined to
pick the ‘thumbs up’ as a default to dismiss the modal window, as the icon has positive connotations.
A solution for more accurate data is to make this feedback optional, rather than enforced.
Relating back to the Metrics Feedback Cycle (MFC), the tips appreciation metric can be used
to filter out and remove tip messages that are not appreciated, and implement more of the type of
tips that students are fond of. In this case we are using ‘appreciation’ as a proxy for engagement,
with the assumption that students are more engaged when they appreciate a tip message on a
question.
In terms of the proactive feedback feature, and the associated metrics derived from the
qualitative data, shown in 0, we can see that the feedback was mostly positive (94.3% of feedback
positive). However, negative feedback has the potential to provide just as much value as positive
feedback, as this can be used to adjust features accordingly. For example, some feedback stated the
question was ‘very clear and helpful’ which is encouraging, but less useful. Others pointed out that
a generated image was not showing, which was input into a backlog for the next iteration of feature
implementation, following the MFC. Although this is a usability issue, it is associated with
engagement, as poor usability can lead to frustration and disengaged users.
7. Discussion
The set of metrics were helpful for finding issues and potential improvements, but more importantly
they provided information on the usage and appreciation of some of the application’s key features.
This use of metric data in order to improve gamification features has not been employed before and
this is the first study that utilises this approach. The Metrics Feedback Cycle (MFC) showed a
starting point for the usage of data as a means for personalisation and user experience optimisation
in gamified systems. Data collected during the MFC study revealed scope for personalisation of
gamification features based on user interaction, which is an important strategy that requires an
understanding of user preferences, and can even be tied to personality traits [39]. In this case, the
MFC also demonstrated that gamified learning environments should be adaptive and dynamic,
including not only interactions with the application but also the levels of user engagement. That is,
the MFC measures engagement in a holistic way that was not measured in detail before in previous
research [40].
The present case study was prone to some limitations. Firstly, although our research showed
the application of the Metrics Feedback Cycle (MFC) in a small-scale study, on a subset of the
implemented features and metrics, a longitudinal study could be very useful to understand other
metrics that were implemented but not utilised in this study, and may help further demonstrate the
benefits of the MFC. For instance, tracking daily login rewards over a longer time period would help
determine the effectiveness of this re-engagement feature for drawing users back to the application.
Secondly, other ways to record user interaction could have been used. For instance, it would be
useful to record user interaction with the rewards panel, which contains their level, trophies and
daily login rewards and subsequently a vast part of the gamification interaction. More engaged
students may generally check experience points and the rewards panel more frequently, so these
could be another set of metrics for determining user-wide engagement in the application, especially
when adapting/adding rewards panel features. Coupled with other engagement metrics in the
‘Metrics Feedback Cycle’, it can be used to determine the effect new features have had on
engagement, potentially reducing these to a single score, like the ‘E-score’ (i.e. single number that
measures engagement for a feature, or set of features) [6].
In the same way as the rewards panel ‘E-score’, the ‘distraction reducing alert’ metrics can be
distilled into a single numerical value for ease of use. A future metric implementation in a
Page 15
Atkins, A., Wanick, V., Wills, G., Metrics Feedback Cycle pag. 17
International Journal of Serious Games Volume 4, Issue 4, December 2017
ISSN: 2384-8766 http://dx.doi.org/10.17083/ijsg.v4i4.192
longitudinal study could measure how long it takes for the user to return after the alert sounds,
together with how often users would be distracted from the application.
Alongside improvements to the metrics, and ways in which to aggregate them, the overall
gameful experience could be improved by introducing more gaming elements, such as missions,
mini-games and the introduction of an overall theme (e.g. medieval, pirates or sci-fi). These game
mechanics target user intrinsic motivation, whereas others, like virtual goods or gifting mechanisms,
are more extrinsically oriented [12][40][41].
8. Conclusions
This paper shows the identification, implementation and evaluation of user engagement metrics and
features in a gamified learning environment. The main contribution of this paper is the Metrics
Feedback Cycle (MFC), which is a unique and formal definition of a process for iteratively
improving engagement within an application, by using metrics data to systematically improve
engagement features. The case study allowed the framework to be used and evaluated in a real-world
eLearning context, with gamification as the focal instrument for improving engagement. Usage of
the MFC encourages user engagement to be measured in a holistic way, considering user interactions
with the entire system as well as with the gamified elements. This can be extremely useful when
exploring the linkage between personalisation and gamification.
An analysis of gamification literature identified the linkage between gamification and
engagement, and how it can be used as a tool for increasing engagement, and more broadly a tool
for changing behaviour. Understanding how users might interact with different kinds of features was
fundamental to the feature discovery process, and techniques like categorising features into ‘People
fun’, ‘Easy fun’, ‘Serious fun’ and ‘Hard fun’ groups guided this process [22]. ‘People/Easy/Hard
fun’ features were the focus, while avoiding the ‘Serious fun’ category in this case study.
The implemented gamification features were discussed, along with design decisions made; such
as the levelling function intensity, as tuning this has a distinct engagement effect, so was carefully
selected. The features implemented are well known and widely used in academia and industry;
however, the novelty lies in selection of context appropriate features that provide a suitable overall
gamification experience, and identifying corresponding metrics that marry up with these features
appropriately.
The results of the study show that the users were engaged in the application, so the implemented
features are proven to be useful, where data is available: students responded positively towards the
error messages, tips, and the proactive feedback. Further student interaction across a longer time
span is necessary to fully make use of the Metrics Feedback Cycle (MFC), as this would allow more
data points to be collected, allowing for richer analysis.
A drawback of the study is that it is not longitudinal, with returning students, so it was not
possible to show multiple iterations of the Metrics Feedback Cycle (MFC) and subsequent
modification of the features and metrics at each stage. This also left some of the metrics redundant,
as they are appropriate to multiple visits. For example, ‘Dropout rate’ and ‘Total time spent vs
questions attempted’ pertain to multiple sessions as their purpose is for making comparisons across
sessions, and identifying any systematic variation of engagement levels – e.g. certain topics or
questions may be linked to low engagement sessions. Further work in the area would involve making
use of the Metrics Feedback Cycle (MFC) in a longitudinal study, to evaluate its efficacy more fully.
Exploring more formal linkage to software development models, like the spiral model, is also an
area of future focus, as gamification needs to be fully integrated and proven within development
processes in order to encourage its wider use.
The features and metrics identified are of use in eLearning related contexts, but more broadly,
the Metrics Feedback Cycle (MFC) has applications in any context that seeks to maximise
engagement by iteratively evaluating and adapting implemented features against a set of evolving
metrics, within a wider software engineering process.
Page 16
pag. 18
International Journal of Serious Games Volume 4, Issue 4, December 2017
ISSN: 2384-8766 http://dx.doi.org/10.17083/ijsg.v4i4.192
References
[1] Adkins, S., “The 2016-2021 Global Game-based Learning Market,” in Serious Play Conference,
2016.
[2] Hamari, H., Koivisto, J., Sarsa, J., “Does Gamification Work? - A Literature Review of
Empirical Studies on Gamification,” in System Sciences (HICSS), 2014 47th Hawaii
International Conference on, 2014, pp. 3025–3034. https://doi.org/10.1109/HICSS.2014.377
[3] Dicheva, D., Dichev, C., Agre, G. and Angelova, G., “Gamification in Education: A Systematic
Mapping Study,” J. Educ. Technol. Soc., vol. 18, pp. 75–88, 2015.
[4] Deterding, S., Sicart, M., Nacke, L., O’Hara, K. and Dixon D., “Gamification. using game-
design elements in non-gaming contexts,” in the 2011 annual conference extended abstracts,
2011, pp. 2425–2428. https://doi.org/10.1145/1979742.1979575
[5] Deterding, S., “Situated motivational affordances of game elements : A conceptual model,” in
CHI2011, 2011, pp. 3–6.
[6] G. Zichermann and C. Cunningham, “Gamification by Design: Implementing Game Mechanics
in Web and Mobile Apps,” in Gamification by Design: Implementing Game Mechanics in Web
and Mobile Apps, O’Reilly Media, Inc, 2011, p. 208.
[7] O’Brien, H. L and Toms, E. G., “What is user engagement? A Conceptual Framework for
defining user engagement with technology,” J. Am. Soc. Inf. Sci. Technol., vol. 59, no. 6, pp.
938–955, 2008. https://doi.org/10.1002/asi.20801
[8] AlMarshedi, A., Wanick, V., Ranchhod, A., and others, “SGI: A framework for increasing the
sustainability of gamification impact,” Int. J. Infonomics, vol. 8, no. 1/2, pp. 1044–1052, 2015.
https://doi.org/10.20533/iji.1742.4712.2015.0123
[9] Kapp, K. M., “The Gamification of Learning and Instruction: Game-based Methods and
Strategies for Training and Education,” in The Gamification of Learning and Instruction: Game-
based Methods and Strategies for Training and Education, San Francisco: John Wiley & Sons,
2012, pp. 1–22.
[10] I. R. M. Association, Gamification: Concepts, Methodologies, Tools, and Applications, 1st ed.
Hershey, PA, USA: IGI Global, 2015.
[11] Gee, P. J., “Good video games and good learning,” in Phi Kappa Phi Forum, 2005, vol. 85, no.
2, p. 33.
[12] Squire, D., “‘All I Know I Learned from Zelda’: Immersive Gaming and Learning and Why The
Legend of Zelda Is a Perfect Learning Game,” in Learning to Play: Exploring the Future of
Education with Video Games, M. Khine Swe, Ed. Peter Lang, 2011, pp. 167--176.
[13] Deterding, S. “The Lens of Intrinsic Skill Atoms: A Method for Gameful Design,” Human-
Computer Interact., vol. 30, no. 3–4, pp. 294–335, 2015.
https://doi.org/10.1080/07370024.2014.993471
[14] Clifton, B., Advanced Web Metrics with Google Analytics. 2010.
[15] Xu, Y., “Literature Review on Web Application Gamification and Analytics,” 2011.
[16] Gee, J. P., “Learning by design: Games as learning machines,” Interact. Educ. Multimed., vol.
8, pp. 15–23, 2004.
[17] Garris, R., Ahlers, R. and Driskell, J. E. ,“Games, Motivation, and Learning: A Research and
Practice Model,” Simul. Gaming, vol. 33, no. 4, pp. 441–467, Dec. 2002.
https://doi.org/10.1177/1046878102238607
[18] Ryan, R. M. and Deci, E. L. “Intrinsic and Extrinsic Motivations: Classic Definitions and New
Directions,” Contemp. Educ. Psychol., vol. 25, no. 1, pp. 54–67, 2000.
https://doi.org/10.1006/ceps.1999.1020
[19] AAlmarshedi, A., Wanick, V. , Wills, G., and Ranchhod, A., “Gamification and Behaviour,” in
More than just games, Stieglitz et al. (eds.), Ed. Switzerland: Springer International Publishing,
2016, pp. 19–29.
[20] Squire, K., “Video games in education.,” Games Simul., vol. 2, no. 1, pp. 49–62, 2003.
[21] Herz, J. C., Joystick Nation: How Videogames Ate Our Quarters, Won Our Hearts, and Rewired
Our Minds, 1st ed. Boston, MA: Little, Brown & Co. Inc., 1997.
[22] Lazzaro, N., “Why We Play Games : Four Keys to More Emotion Without Story,” 2004.
[23] A. Phippen, L. Sheppard, and S. Furnell, “A practical evaluation of Web analytics,” Internet
Res., vol. 14, no. 4, pp. 284--293, 2004. https://doi.org/10.1108/10662240410555306
[24] O’Donovan, S., Gain, J., Marais, P., Donovan, S. O. and Marais, P., “A Case Study in the
Gamification of a University-level Games Development Course,” in ACM International
Conference Proceeding Series, 2013, pp. 242–251. https://doi.org/10.1145/2513456.2513469
Page 17
Atkins, A., Wanick, V., Wills, G., Metrics Feedback Cycle pag. 19
International Journal of Serious Games Volume 4, Issue 4, December 2017
ISSN: 2384-8766 http://dx.doi.org/10.17083/ijsg.v4i4.192
[25] Ibanez, M.-B., Di-Serio, A., and Delgado-Kloos, C., “Gamification for Engaging Computer
Science Students in Learning Activities: A Case Study,” IEEE Trans. Learn. Technol., vol. 7,
no. 3, pp. 291–301, 2014. https://doi.org/10.1109/TLT.2014.2329293
[26] Heilbrunn, B., Herzig, P. and Schill, A., “Towards gamification analytics-requirements for
monitoring and adapting gamification designs,” 44th Annu. Meet. Soc. Comput. Sci.
INFORMATICS 2014, vol. P-232, pp. 333–344, 2014.
[27] Heilbrunn, B., Herzig, P. and Schill, A., “Tools for gamification analytics: A survey,” in
Proceedings - 2014 IEEE/ACM 7th International Conference on Utility and Cloud Computing,
UCC 2014, 2014, pp. 603–608. https://doi.org/10.1109/UCC.2014.93
[28] Boehm, B. W., “A spiral model of software development and enhancement,” Computer (Long.
Beach. Calif)., vol. 21, no. 5, pp. 61–72, 1988. https://doi.org/10.1109/2.59
[29] Google, “Firebase.” [Online]. Available: https://firebase.google.com/.
[30] Yee, N., “Ariadne - Understanding MMORPG Addiction,” 2002. .
[31] Smahel, D., Blinka, L. and Ledabyl, O., “Playing MMORPGs: connections between addiction
and identifying with a character.,” Cyber Psychol. Behav., vol. 11, no. 6, pp. 715--718, 2008.
https://doi.org/10.1089/cpb.2007.0210
[32] Wen, D. M.-H., Chang, D. J.-W., Lin, Y.-T., Liang, C.-W., and Yang, S.-Y. “Gamification
design for increasing customer purchase intention in a mobile marketing campaign app,” in
International Conference on HCI in Business, 2014, pp. 440–448. https://doi.org/10.1007/978-
3-319-07293-7_43
[33] Meder, M., Plumbaum, T., and Hopfgartner, F., “Perceived and actual role of gamification
principles,” in Proceedings of the 2013 IEEE/ACM 6th International Conference on Utility and
Cloud Computing, 2013, pp. 488–493. https://doi.org/10.1109/UCC.2013.95
[34] Denny, P. “The Effect of Virtual Achievements on Student Engagement,” in Proceedings of the
SIGCHI Conference on Human Factors in Computing Systems, 2013, pp. 763–772.
[35] Anderson, A., Huttenlocher, D., Kleinberg, J., and Leskovec, J.“ Steering User Behavior with
Badges,” in Proceedings of the 22Nd International Conference on World Wide Web, 2013, pp.
95–106.
[36] Domínguez, A., Saenz-de-Navarrete, J., de-Marcos, L., Fernández-Sanz, L., Pagés, C. , and
Martínez-Herráiz, J.-J., “Gamifying learning experiences: Practical implications and outcomes,”
Comput. Educ., vol. 63, pp. 380–392, 2013. https://doi.org/10.1016/j.compedu.2012.12.020
[37] Pinchbeck, D., “An affordance based model for gameplay,” Break. New Gr. Innov. Games, Play.
Pract. Theory Proc. 2009 Digit. Games Res. Assoc. Conf., 2009.
[38] Salen, K. and Zimmerman, E., Rules of Play: Game Design Fundamentals, vol. 37, no. 5.
Massachusetts Institute of Technology, 2004.
[39] Tondello, G. F., Wehbe, R. R., Diamond, L., Busch, M., Marczewski, A. and Nacke, L. E. “The
Gamification User Types Hexad Scale,” Proc. 2016 Annu. Symp. Comput. Interact. Play - CHI
Play ’16, pp. 229–243, 2016. https://doi.org/10.1145/2967934.2968082
[40] Monterrat, B., Lavoué, É. and George, S. ,“Motivation for learning: Adaptive gamification for
web-based learning environments,” in CSEDU 2014 - Proceedings of the 6th International
Conference on Computer Supported Education, 2014, vol. 1, pp. 117–125.
[41] Malone, T. W., “What makes things fun to learn? heuristics for designing instructional computer
games,” in Proceedings of the 3rd ACM SIGSMALL symposium and the first SIGPC
symposium on Small systems - SIGSMALL ’80, 1980, pp. 162–169.
https://doi.org/10.1145/800088.802839
[42] Muntean, C. C. I., “Raising engagement in e-learning through gamification,” 6th Int. Conf.
Virtual Learn. ICVL 2011, no. 1, pp. 323–329, 2011.