40
Metrics for Eclipse MicroProfile Heiko W. Rupp, Raymond Lam, David Chan, Don Bourne, Antonin Stefanutti, Brennan Nichyporuk, Mike Croft, Werner Keil Version 1.0, 2017-08-22

Metrics for Eclipse MicroProfileHeiko W. Rupp, Raymond Lam, David Chan, Don Bourne, Antonin Stefanutti,
Brennan Nichyporuk, Mike Croft, Werner Keil
Version 1.0, 2017-08-22

Table of Contents1. Introduction. . . . . . . . . . . . . . . . . . . . . . . . . . . . . . . . . . . . . . . . . . . . . . . . . . . . . . . . . . . . . . . . . . . . . . . . . . . . . . 2
1.1. Motivation . . . . . . . . . . . . . . . . . . . . . . . . . . . . . . . . . . . . . . . . . . . . . . . . . . . . . . . . . . . . . . . . . . . . . . . . . . . 2
1.2. Difference to health checks . . . . . . . . . . . . . . . . . . . . . . . . . . . . . . . . . . . . . . . . . . . . . . . . . . . . . . . . . . . . 2
2. Architecture . . . . . . . . . . . . . . . . . . . . . . . . . . . . . . . . . . . . . . . . . . . . . . . . . . . . . . . . . . . . . . . . . . . . . . . . . . . . . . 3
2.1. Metrics Setup . . . . . . . . . . . . . . . . . . . . . . . . . . . . . . . . . . . . . . . . . . . . . . . . . . . . . . . . . . . . . . . . . . . . . . . . . 3
2.1.1. Scopes. . . . . . . . . . . . . . . . . . . . . . . . . . . . . . . . . . . . . . . . . . . . . . . . . . . . . . . . . . . . . . . . . . . . . . . . . . . . 3
Required Base metrics . . . . . . . . . . . . . . . . . . . . . . . . . . . . . . . . . . . . . . . . . . . . . . . . . . . . . . . . . . . . . . . . 3
Application metrics. . . . . . . . . . . . . . . . . . . . . . . . . . . . . . . . . . . . . . . . . . . . . . . . . . . . . . . . . . . . . . . . . . . 3
Vendor specific Metrics . . . . . . . . . . . . . . . . . . . . . . . . . . . . . . . . . . . . . . . . . . . . . . . . . . . . . . . . . . . . . . . 4
2.1.2. Supplying of Tags . . . . . . . . . . . . . . . . . . . . . . . . . . . . . . . . . . . . . . . . . . . . . . . . . . . . . . . . . . . . . . . . . 4
2.1.3. Metadata . . . . . . . . . . . . . . . . . . . . . . . . . . . . . . . . . . . . . . . . . . . . . . . . . . . . . . . . . . . . . . . . . . . . . . . . . 4
2.2. Metric Registry . . . . . . . . . . . . . . . . . . . . . . . . . . . . . . . . . . . . . . . . . . . . . . . . . . . . . . . . . . . . . . . . . . . . . . . 5
2.3. Exposing metrics via REST API . . . . . . . . . . . . . . . . . . . . . . . . . . . . . . . . . . . . . . . . . . . . . . . . . . . . . . . . . 5
3. REST endpoints . . . . . . . . . . . . . . . . . . . . . . . . . . . . . . . . . . . . . . . . . . . . . . . . . . . . . . . . . . . . . . . . . . . . . . . . . . . 7
3.1. JSON format . . . . . . . . . . . . . . . . . . . . . . . . . . . . . . . . . . . . . . . . . . . . . . . . . . . . . . . . . . . . . . . . . . . . . . . . . . 7
3.1.1. Gauge JSON Format . . . . . . . . . . . . . . . . . . . . . . . . . . . . . . . . . . . . . . . . . . . . . . . . . . . . . . . . . . . . . . . 8
3.1.2. Counter JSON Format . . . . . . . . . . . . . . . . . . . . . . . . . . . . . . . . . . . . . . . . . . . . . . . . . . . . . . . . . . . . . . 8
3.1.3. Meter JSON Format . . . . . . . . . . . . . . . . . . . . . . . . . . . . . . . . . . . . . . . . . . . . . . . . . . . . . . . . . . . . . . . . 8
3.1.4. Histogram JSON Format . . . . . . . . . . . . . . . . . . . . . . . . . . . . . . . . . . . . . . . . . . . . . . . . . . . . . . . . . . . 9
3.1.5. Timer JSON Format. . . . . . . . . . . . . . . . . . . . . . . . . . . . . . . . . . . . . . . . . . . . . . . . . . . . . . . . . . . . . . . . 9
3.1.6. Metadata . . . . . . . . . . . . . . . . . . . . . . . . . . . . . . . . . . . . . . . . . . . . . . . . . . . . . . . . . . . . . . . . . . . . . . . . 10
3.2. Prometheus format . . . . . . . . . . . . . . . . . . . . . . . . . . . . . . . . . . . . . . . . . . . . . . . . . . . . . . . . . . . . . . . . . . 11
3.2.1. Translation rules for metric names . . . . . . . . . . . . . . . . . . . . . . . . . . . . . . . . . . . . . . . . . . . . . . . . 12
3.2.2. Handling of tags . . . . . . . . . . . . . . . . . . . . . . . . . . . . . . . . . . . . . . . . . . . . . . . . . . . . . . . . . . . . . . . . . 12
3.2.3. Handling of units . . . . . . . . . . . . . . . . . . . . . . . . . . . . . . . . . . . . . . . . . . . . . . . . . . . . . . . . . . . . . . . . 12
3.2.4. Gauge Prometheus Text Format . . . . . . . . . . . . . . . . . . . . . . . . . . . . . . . . . . . . . . . . . . . . . . . . . . . 13
3.2.5. Counter Prometheus Text Format . . . . . . . . . . . . . . . . . . . . . . . . . . . . . . . . . . . . . . . . . . . . . . . . . 14
3.2.6. Meter Prometheus Text Format . . . . . . . . . . . . . . . . . . . . . . . . . . . . . . . . . . . . . . . . . . . . . . . . . . . 14
3.2.7. Histogram Prometheus Text Format . . . . . . . . . . . . . . . . . . . . . . . . . . . . . . . . . . . . . . . . . . . . . . . 15
3.2.8. Timer Prometheus Text Format . . . . . . . . . . . . . . . . . . . . . . . . . . . . . . . . . . . . . . . . . . . . . . . . . . . 16
3.3. Security . . . . . . . . . . . . . . . . . . . . . . . . . . . . . . . . . . . . . . . . . . . . . . . . . . . . . . . . . . . . . . . . . . . . . . . . . . . . . 17
4. Required Metrics . . . . . . . . . . . . . . . . . . . . . . . . . . . . . . . . . . . . . . . . . . . . . . . . . . . . . . . . . . . . . . . . . . . . . . . . 18
4.1. General JVM Stats . . . . . . . . . . . . . . . . . . . . . . . . . . . . . . . . . . . . . . . . . . . . . . . . . . . . . . . . . . . . . . . . . . . . 18
4.2. Thread JVM Stats. . . . . . . . . . . . . . . . . . . . . . . . . . . . . . . . . . . . . . . . . . . . . . . . . . . . . . . . . . . . . . . . . . . . . 20
4.3. Thread Pool Stats . . . . . . . . . . . . . . . . . . . . . . . . . . . . . . . . . . . . . . . . . . . . . . . . . . . . . . . . . . . . . . . . . . . . 20
4.4. ClassLoading JVM Stats . . . . . . . . . . . . . . . . . . . . . . . . . . . . . . . . . . . . . . . . . . . . . . . . . . . . . . . . . . . . . . . 21
4.5. Operating System . . . . . . . . . . . . . . . . . . . . . . . . . . . . . . . . . . . . . . . . . . . . . . . . . . . . . . . . . . . . . . . . . . . . 22
5. Application Metrics Programming Model . . . . . . . . . . . . . . . . . . . . . . . . . . . . . . . . . . . . . . . . . . . . . . . . . . 24

5.1. Responsibility of the MicroProfile Metrics implementation . . . . . . . . . . . . . . . . . . . . . . . . . . . . . . 24
5.2. Base Package . . . . . . . . . . . . . . . . . . . . . . . . . . . . . . . . . . . . . . . . . . . . . . . . . . . . . . . . . . . . . . . . . . . . . . . . 25
5.3. Annotations . . . . . . . . . . . . . . . . . . . . . . . . . . . . . . . . . . . . . . . . . . . . . . . . . . . . . . . . . . . . . . . . . . . . . . . . . 25
5.3.1. Fields . . . . . . . . . . . . . . . . . . . . . . . . . . . . . . . . . . . . . . . . . . . . . . . . . . . . . . . . . . . . . . . . . . . . . . . . . . . 26
5.3.2. Annotated Naming Convention. . . . . . . . . . . . . . . . . . . . . . . . . . . . . . . . . . . . . . . . . . . . . . . . . . . . 26
5.3.3. @Counted . . . . . . . . . . . . . . . . . . . . . . . . . . . . . . . . . . . . . . . . . . . . . . . . . . . . . . . . . . . . . . . . . . . . . . . 27
CONSTRUCTOR . . . . . . . . . . . . . . . . . . . . . . . . . . . . . . . . . . . . . . . . . . . . . . . . . . . . . . . . . . . . . . . . . . . . . 28
METHOD . . . . . . . . . . . . . . . . . . . . . . . . . . . . . . . . . . . . . . . . . . . . . . . . . . . . . . . . . . . . . . . . . . . . . . . . . . . 28
TYPE . . . . . . . . . . . . . . . . . . . . . . . . . . . . . . . . . . . . . . . . . . . . . . . . . . . . . . . . . . . . . . . . . . . . . . . . . . . . . . . 28
5.3.4. @Gauge . . . . . . . . . . . . . . . . . . . . . . . . . . . . . . . . . . . . . . . . . . . . . . . . . . . . . . . . . . . . . . . . . . . . . . . . . 28
METHOD . . . . . . . . . . . . . . . . . . . . . . . . . . . . . . . . . . . . . . . . . . . . . . . . . . . . . . . . . . . . . . . . . . . . . . . . . . . 29
5.3.5. @Metered . . . . . . . . . . . . . . . . . . . . . . . . . . . . . . . . . . . . . . . . . . . . . . . . . . . . . . . . . . . . . . . . . . . . . . . 29
CONSTRUCTOR . . . . . . . . . . . . . . . . . . . . . . . . . . . . . . . . . . . . . . . . . . . . . . . . . . . . . . . . . . . . . . . . . . . . . 29
METHOD . . . . . . . . . . . . . . . . . . . . . . . . . . . . . . . . . . . . . . . . . . . . . . . . . . . . . . . . . . . . . . . . . . . . . . . . . . . 29
TYPE . . . . . . . . . . . . . . . . . . . . . . . . . . . . . . . . . . . . . . . . . . . . . . . . . . . . . . . . . . . . . . . . . . . . . . . . . . . . . . . 30
5.3.6. @Timed . . . . . . . . . . . . . . . . . . . . . . . . . . . . . . . . . . . . . . . . . . . . . . . . . . . . . . . . . . . . . . . . . . . . . . . . . 30
CONSTRUCTOR . . . . . . . . . . . . . . . . . . . . . . . . . . . . . . . . . . . . . . . . . . . . . . . . . . . . . . . . . . . . . . . . . . . . . 30
METHOD . . . . . . . . . . . . . . . . . . . . . . . . . . . . . . . . . . . . . . . . . . . . . . . . . . . . . . . . . . . . . . . . . . . . . . . . . . . 31
TYPE . . . . . . . . . . . . . . . . . . . . . . . . . . . . . . . . . . . . . . . . . . . . . . . . . . . . . . . . . . . . . . . . . . . . . . . . . . . . . . . 31
5.3.7. @Metric . . . . . . . . . . . . . . . . . . . . . . . . . . . . . . . . . . . . . . . . . . . . . . . . . . . . . . . . . . . . . . . . . . . . . . . . . 31
FIELD . . . . . . . . . . . . . . . . . . . . . . . . . . . . . . . . . . . . . . . . . . . . . . . . . . . . . . . . . . . . . . . . . . . . . . . . . . . . . . 31
METHOD . . . . . . . . . . . . . . . . . . . . . . . . . . . . . . . . . . . . . . . . . . . . . . . . . . . . . . . . . . . . . . . . . . . . . . . . . . . 32
PARAMETER . . . . . . . . . . . . . . . . . . . . . . . . . . . . . . . . . . . . . . . . . . . . . . . . . . . . . . . . . . . . . . . . . . . . . . . . 32
5.4. Metric Registries . . . . . . . . . . . . . . . . . . . . . . . . . . . . . . . . . . . . . . . . . . . . . . . . . . . . . . . . . . . . . . . . . . . . . 33
5.4.1. @RegistryType. . . . . . . . . . . . . . . . . . . . . . . . . . . . . . . . . . . . . . . . . . . . . . . . . . . . . . . . . . . . . . . . . . . 33
5.4.2. Application Metric Registry . . . . . . . . . . . . . . . . . . . . . . . . . . . . . . . . . . . . . . . . . . . . . . . . . . . . . . . 33
5.4.3. Base Metric Registry. . . . . . . . . . . . . . . . . . . . . . . . . . . . . . . . . . . . . . . . . . . . . . . . . . . . . . . . . . . . . . 34
5.4.4. Vendor Metric Registry . . . . . . . . . . . . . . . . . . . . . . . . . . . . . . . . . . . . . . . . . . . . . . . . . . . . . . . . . . . 34
6. Appendix . . . . . . . . . . . . . . . . . . . . . . . . . . . . . . . . . . . . . . . . . . . . . . . . . . . . . . . . . . . . . . . . . . . . . . . . . . . . . . . 35
6.1. Alternatives considered . . . . . . . . . . . . . . . . . . . . . . . . . . . . . . . . . . . . . . . . . . . . . . . . . . . . . . . . . . . . . . 35
6.2. References . . . . . . . . . . . . . . . . . . . . . . . . . . . . . . . . . . . . . . . . . . . . . . . . . . . . . . . . . . . . . . . . . . . . . . . . . . 35
6.3. Example configuration format for base and vendor-specific data. . . . . . . . . . . . . . . . . . . . . . . . . 35
6.4. Example Metric Registry Factory . . . . . . . . . . . . . . . . . . . . . . . . . . . . . . . . . . . . . . . . . . . . . . . . . . . . . . 36

Specification: Metrics for Eclipse MicroProfile
Version: 1.0
Status: Proposal
Release: 2017-08-22
Copyright (c) 2016-2017 Eclipse Microprofile Contributors:Heiko W. Rupp, Raymond Lam, David Chan, Don Bourne, Antonin Stefanutti, BrennanNichyporuk, Mike Croft, Werner Keil
Licensed under the Apache License, Version 2.0 (the "License");you may not use this file except in compliance with the License.You may obtain a copy of the License at
http://www.apache.org/licenses/LICENSE-2.0
Unless required by applicable law or agreed to in writing, softwaredistributed under the License is distributed on an "AS IS" BASIS,WITHOUT WARRANTIES OR CONDITIONS OF ANY KIND, either express or implied.See the License for the specific language governing permissions andlimitations under the License.
1

Chapter 1. IntroductionTo ensure reliable operation of software it is necessary to monitor essential system parameters.This enhancement proposes the addition of well-known monitoring endpoints and metrics for eachprocess adhering to the Eclipse MicroProfile standard.
This proposal does not talk about health checks. There is a separate specification for Health Checks.
1.1. MotivationReliable service of a platform needs monitoring. There is already JMX as standard to exposemetrics, but remote-JMX is not easy to deal with and especially does not fit well in a polyglotenvironment where other services are not running on the JVM. To enable monitoring in an easyfashion it is necessary that all MicroProfile implementations follow a certain standard with respectto (base) API path, data types involved, always available metrics and return codes used.
1.2. Difference to health checksHealth checks are primarily targeted at a quick yes/no response to the question "Is my applicationstill running ok?". Modern systems that schedule the starting of applications (e.g. Kubernetes) usethis information to restart the application if the answer is 'no'.
Metrics on the other hand can help to determine the health. Beyond this they serve to pinpointissues, provide long term trend data for capacity planning and pro-active discovery of issues (e.g.disk usage growing without bounds). Metrics can also help those scheduling systems decide whento scale the application to run on more or fewer machines.
2

Chapter 2. ArchitectureThis chapter describes the architectural overview of how metrics are setup, stored and exposed forconsumption. This chapter also lists the various scopes of metrics.
See section Required Metrics for more information regarding metrics that are required for eachvendor.
See section Application Metrics Programming Model for more information regarding theapplication metrics programming model.
2.1. Metrics SetupMetrics that are exposed need to be configured in the server. On top of the pure metrics, metadataneeds to be provided.
The following three sets of sub-resource (scopes) are exposed.
• base: metrics that all MicroProfile vendors have to provide
• vendor: vendor specific metrics (optional)
• application: application-specific metrics (optional)
It is expected that a future version of this specification will also have a sub-resource for integrations with other specifications of MicroProfile.
2.1.1. Scopes
Required Base metrics
Required base metrics describe a set of metrics that all MicroProfile-compliant servers have toprovide. Each vendor can implement the set-up of the metrics in the base scope in a vendor-specificway. The metrics can be hard coded into the server or read from a configuration file or supplied viathe Java-API described in Application Metrics Programming Model. The Appendix shows a possibledata format for such a configuration. The configuration and set up of the base scope is thus animplementation detail and is not expected to be portable across vendors.
Section Required Metrics lists the required metrics. This list also includes a few items marked asoptional. These are listed here as they are dependent on the underlying JVM and not the server andthus fit better in base scope than the vendor one.
Required base metrics are exposed under /metrics/base.
Application metrics
Application specific metrics can not be baked into the server as they are supposed to be providedby the application at runtime. Therefore a Java API is provided. Application specific metrics aresupposed to be portable to other implementations of the MicroProfile. That means that anapplication written to this specification which exposes metrics, can expose the same metrics on a
3

different compliant server without change.
Details of this Java API are described in Application Metrics Programming Model.
Application specific metrics are exposed under /metrics/application.
Vendor specific Metrics
It is possible for MicroProfile server implementors to supply their specific metrics data on top ofthe basic set of required metrics. Vendor specific metrics are exposed under /metrics/vendor.
Examples for vendor specific data could be metrics like:
• OSGi statistics if the MicroProfile-enabled container internally runs on top of OSGi.
• Statistics of some internal caching modules
Vendor specific metrics are not supposed to be portable between different implementations ofMicroProfile servers, even if they are compliant with the same version of this specification.
2.1.2. Supplying of Tags
Tags (or labels) play an important role in modern microservices and microservice schedulingsystems (like e.g. Kubernetes). Application code can run on any node and can be re-scheduled to adifferent node at any time. Each container in such an environment gets its own ID; when thecontainer is stopped and a new one started for the same image, it will get a different id. Theclassical mapping of host/node and application runtime on it, therefore no longer works.
Tags have taken over the role to, for example, identify an application (app=myShop), the tier insidethe application (tier=database or tier=app_server) and also the node/container id. Aggregation ofmetrics can then work over label queries (Give me the API hit count for app=myShop &&
tier=app_server).
Tags can be supplied in two ways:
• At the level of a metric as described in Application Metrics Programming Model.
• At the application server level by passing the list of tags in an environment variableMP_METRICS_TAGS.
Set up global tags
export MP_METRICS_TAGS=app=shop,tier=integration
Global tags and tags set in metric metadata are included in the output returned from the REST API.
2.1.3. Metadata
Metadata can be specified for metrics in any scope. For base metrics, metadata must be provided bythe implementation. Metadata is exposed by the REST handler.
4

While technically it is possible to expose metrics without (some) of the metadata, ithelps tooling and also operators when correct metadata is provided, as this helpsgetting a context and an explanation of the metric.
The Metadata:
• unit: a fixed set of string units
• type:
◦ counter: an incrementally increasing or decreasing numeric value (e.g. total number ofrequests received or total number of concurrently active HTTP sessions).
◦ gauge: a metric that is sampled to obtain its value (e.g. cpu temperature or disk usage).
◦ meter: a metric which tracks mean throughput and one-, five-, and fifteen-minuteexponentially-weighted moving average throughput.
◦ histogram: a metric which calculates the distribution of a value.
◦ timer: a metric which aggregates timing durations and provides duration statistics, plusthroughput statistics.
• description (optional): A human readable description of the metric.
• displayName (optional): A human readable name of the metric for display purposes if themetric name is not human readable. This could e.g. be the case when the metric name is a uuid.
• tags (optional): A list of key=value pairs, which are separated by comma. See also Supplying ofTags.
Metadata must not change over the lifetime of a process (i.e. it is not allowed to return the units asseconds in one retrieval and as hours in a subsequent one). The reason behind it is that e.g. amonitoring agent on Kubernetes may read the metadata once it sees the new container and store it.It may not periodically re-query the process for the metadata.
In fact, metadata should not change during the life-time of the whole containerimage or an application, as all containers spawned from it will be "the same" andform part of an app, where it would be confusing in an overall view if the samemetric has different metadata.
2.2. Metric RegistryThe MetricRegistry stores the metrics and metadata information. There is one MetricRegistryinstance for each of the scopes listed in Scopes.
Metrics can be added to or retrieved from the registry either using the @Metric annotation (seeMetrics Annotations) or using the MetricRegistry object directly.
2.3. Exposing metrics via REST APIData is exposed via REST over HTTP under the /metrics base path in two different data formats forGET requests:
5

• JSON format - used when the HTTP Accept header matches application/json.
• Prometheus text format - default response format when the HTTP Accept header does not matchany more specific media type like application/json.
Future versions may allow for more export formats that are triggered by theirspecific media type. The Prometheus text format will stay as fall-back.
Formats are detailed below.
Data access must honour the HTTP response codes, especially
• 200 for successful retrieval of an object
• 204 when retrieving a subtree that would exist, but has no content. E.g. when the application-specific subtree has no application specific metrics defined.
• 404 if a directly-addressed item does not exist. This may be a non-existing sub-tree or non-existing object
• 406 if the HTTP Accept Header in the request cannot be handled by the server.
• 500 to indicate that a request failed due to "bad health". The body SHOULD contain details ifpossible { "details": <text> }
The API MUST NOT return a 500 Internal Server Error code to represent a non-existing resource.
Table 1. Supported REST endpoints
Endpoint RequestType
SupportedFormats
Description
/metrics GET JSON,Prometheus
Returns all registered metrics
/metrics/<scope> GET JSON,Prometheus
Returns metrics registered for therespective scope. Scopes are listed inMetrics Setup
/metrics/<scope>/<metric_name>
GET JSON,Prometheus
Returns the metric that matches themetric name for the respective scope
/metrics OPTIONS JSON Returns all registered metrics' metadata
/metrics/<scope> OPTIONS JSON Returns metrics' metadata registered forthe respective scope. Scopes are listed inMetrics Setup
/metrics/<scope>/<metric_name>
OPTIONS JSON Returns the metric’s metadata thatmatches the metric name for therespective scope
6

Chapter 3. REST endpointsThis section describes the REST-api, that monitoring agents would use to retrieve the collectedmetrics. (Java-) methods mentioned refer to the respective Objects in the Java API. See alsoApplication Metrics Programming Model
3.1. JSON format• When using JSON format, the REST API will respond to GET requests with data formatted in a
tree like fashion with sub-trees for the sub-resources. A sub-tree that does not contain data mustbe omitted.
• A 'shadow tree' that responds to OPTIONS will provide the metadata.
REST-API Objects
API-objects MAY include one or more metrics as in
{ "thread.count" : 33, "thread.max.count" : 47, "memory.maxHeap" : 3817863211, "memory.usedHeap" : 16859081, "memory.committedHeap" : 64703546}
or
{ "hitCount": 45}
In case /metrics is requested, then the data for the scopes are wrapped in the scope name:
{ "application": { "hitCount": 45 }, "base": { "thread.count" : 33, "thread.max.count" : 47 }, "vendor": {...}}
7

3.1.1. Gauge JSON Format
The value of the gauge must be equivalent to a call to the instance Gauge’s getValue().
Example Gauge JSON GET Response
{ "responsePercentage": 48.45632}
3.1.2. Counter JSON Format
The value of the counter must be equivalent to a call to the instance Counter’s getCount().
Example Counter JSON GET Response
{ "hitCount": 45}
3.1.3. Meter JSON Format
Meter is a complex metric type comprised of multiple key/values. The format is specified by thetable below.
Table 2. JSON mapping for a Meter metric
JSON Key Value (Equivalent Meter method)
count getCount()
meanRate getMeanRate()
oneMinRate getOneMinuteRate()
fiveMinRate getFiveMinuteRate()
fifteenMinRate getFifteenMinuteRate()
Example Meter JSON GET Response
{ "requests": { "count": 29382, "meanRate": 12.223, "oneMinRate": 12.563, "fiveMinRate": 12.364, "fifteenMinRate": 12.126, }}
8

3.1.4. Histogram JSON Format
Histogram is a complex metric type comprised of multiple key/values. The format is specified by thetable below.
Table 3. JSON mapping for a Histogram metric
JSON Key Value (Equivalent Histogram method)
count getCount()
min getSnapshot().getMin()
max getSnapshot().getMax()
mean getSnapshot().getMean()
stddev getSnapshot().getStdDev()
p50 getSnapshot().getMedian()
p75 getSnapshot().get75thPercentile()
p95 getSnapshot().get95thPercentile()
p98 getSnapshot().get98thPercentile()
p99 getSnapshot().get99thPercentile()
p999 getSnapshot().get999thPercentile()
Example Histogram JSON GET Response
{ "daily_value_changes": { "count":2, "min":-1624, "max":26, "mean":-799.0, "stddev":825.0, "p50":26.0, "p75":26.0, "p95":26.0, "p98":26.0, "p99":26.0, "p999":26.0 }}
3.1.5. Timer JSON Format
Timer is a complex metric type comprised of multiple key/values. The format is specified by thetable below.
Table 4. JSON mapping for a Timer metric
JSON Key Value (Equivalent Timer method)
count getCount()
meanRate getMeanRate()
9
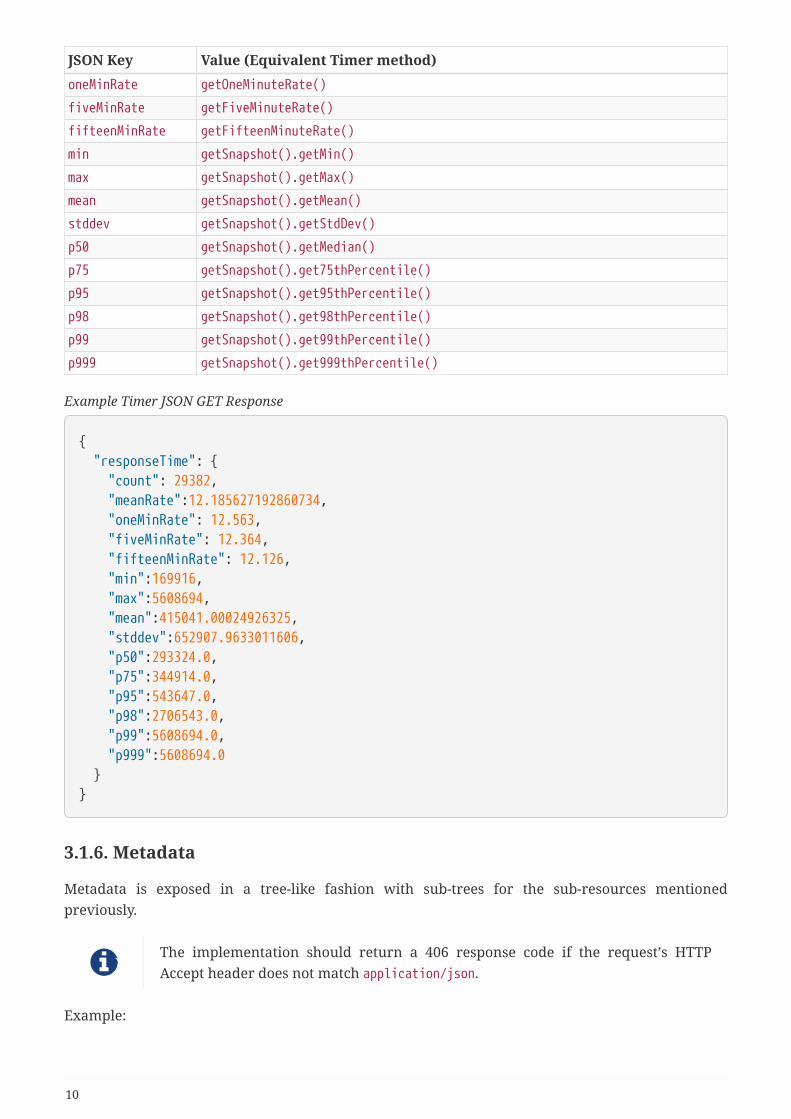
JSON Key Value (Equivalent Timer method)
oneMinRate getOneMinuteRate()
fiveMinRate getFiveMinuteRate()
fifteenMinRate getFifteenMinuteRate()
min getSnapshot().getMin()
max getSnapshot().getMax()
mean getSnapshot().getMean()
stddev getSnapshot().getStdDev()
p50 getSnapshot().getMedian()
p75 getSnapshot().get75thPercentile()
p95 getSnapshot().get95thPercentile()
p98 getSnapshot().get98thPercentile()
p99 getSnapshot().get99thPercentile()
p999 getSnapshot().get999thPercentile()
Example Timer JSON GET Response
{ "responseTime": { "count": 29382, "meanRate":12.185627192860734, "oneMinRate": 12.563, "fiveMinRate": 12.364, "fifteenMinRate": 12.126, "min":169916, "max":5608694, "mean":415041.00024926325, "stddev":652907.9633011606, "p50":293324.0, "p75":344914.0, "p95":543647.0, "p98":2706543.0, "p99":5608694.0, "p999":5608694.0 }}
3.1.6. Metadata
Metadata is exposed in a tree-like fashion with sub-trees for the sub-resources mentionedpreviously.
The implementation should return a 406 response code if the request’s HTTPAccept header does not match application/json.
Example:
10

If GET /metrics/base/fooVal exposes:
{"fooVal": 12345}
then OPTIONS /metrics/base/fooVal will expose:
{ "fooVal": { "unit": "milliseconds", "type": "gauge", "description": "The size of foo after each request", "displayName": "Size of foo", "tags": "app=webshop" }}
If GET /metrics/base exposes multiple values like this:
Example of exposed metrics data
{ "fooVal": 12345, "barVal": 42}
then OPTIONS /metrics/base exposes:
Example of JSON output of Metadata
{ "fooVal": { "unit": "milliseconds", "type": "gauge", "description": "The average duration of foo requests during last 5 minutes", "displayName": "Duration of foo", "tags": "app=webshop" }, "barVal": { "unit": "megabytes", "type": "gauge", "tags": "component=backend,app=webshop" }}
3.2. Prometheus formatData is exposed in the Prometheus text format, version 0.0.4 as described in Prometheus text
11

format.
The metadata will be included as part of the normal Prometheus text format. Unlike the JSONformat, the text format does not support OPTIONS requests.
Users that want to write tools to transform the metadata can still request themetadata via OPTIONS request and application/json media type.
The above json example would look like this in Prometheus format
Example of Prometheus output
# TYPE base:foo_val_seconds gauge ①# HELP base:foo_val_seconds The average duration of foo requests during last 5 minutes②base:foo_val_seconds{app="webshop"} 12.345 ③# TYPE base:bar_val_bytes gauge ①base:bar_val_bytes{component="backend", app="webshop"} 42000 ③
① Metric names are turned from camel case into snake_case.
② The description goes into the HELP line
③ Metric names gets the base unit of the family appended with _ and defined labels. Values arescaled accordingly. See Handling of units
3.2.1. Translation rules for metric names
Prometheus text format does not allow for all characters and adds the base unit of a family to thename.
• Dot (.), Space ( ), Dash (-) are translated to underscore (_).
• Scope is always specified at the start of the metric name.
• Scope and name are separated by colon (:).
• camelCase is translated to camel_case
• Double underscore is translated to single underscore
• Colon-underscore (:_) is translated to single colon
• The unit is appended to the name, separated by underscore. See Handling of units
3.2.2. Handling of tags
Metric tags are appended to the metric name in curly braces { and } and are separated by comma.Each tag is a key-value-pair in the format of <key>="<value>" (the quotes around the value arerequired).
3.2.3. Handling of units
The Prometheus text format adheres to using "base units" when creating the HTTP response. Due to
12

the different context of each metric type, certain metrics' values must be converted to therespective "base unit" when responding to Prometheus requests. For example, times in millisecondsmust be divided by 1000 and displayed in the base unit (seconds).
The following sections outline how each metric type is handled:
Gauges and Histograms
The metric name and values for Gauge and Histogram are converted to the "base unit" in respect tothe unit value in the Metadata.
• If the Metadata is empty, NONE, or null, the metric name is used as is without appending the unitname and no scaling is applied.
• If the metric’s metadata contains a known unit, as defined in the MetricUnits class, thePrometheus value should be scaled to the base unit of the respective family. The name of thebase unit is appended to the metric name delimited by underscores (_).
• If the unit is specified and is not defined in the MetricUnits class, the value is not scaled but theunit is still appended to the metric name delimited by underscores (_).
Unit families and their base units are described under Prometheus metric names, Base units.
Families and Prometheus base units are:
Family Base unit
Bits bytes
Bytes bytes
Time seconds
Percent ratio (normally ratio is A_per_B, but there areexceptions like disk_usage_ratio)
Counters
Counter metrics are considered dimensionless. The implementation must not append the unit nameto the metric name and must not scale the value.
Meters and Timers
Meter and Timer have fixed units as described below regardless of the unit value in the Metadata.
3.2.4. Gauge Prometheus Text Format
The value of the gauge must be the value of getValue() with appropriate naming/scaling based onHandling of units
13

Example Prometheus text format for a Gauge in dollars.
# TYPE application:cost_dollars gauge# HELP application:cost_dollars The running cost of the server in dollars.application:cost_dollars 80
3.2.5. Counter Prometheus Text Format
The value of the counter must be the value of getCount().
Implementors must not convert the unit of Counters or append the unit suffix tothe metric.
Example Prometheus text format for a Counter.
# TYPE application:visitors counter# HELP application:visitors The number of unique visitorsapplication:visitors 80
3.2.6. Meter Prometheus Text Format
Meter is a complex metric type comprised of multiple key/values. Each key will require a suffix to beappended to the metric name. The format is specified by the table below.
The # HELP description line is only required for the total value as shown below.
Table 5. Prometheus text mapping for a Meter metric
Suffix{label} TYPE Value (Meter method) Units
total Counter getCount() N/A
rate_per_second Gauge getMeanRate() PER_SECOND
one_min_rate_per_second Gauge getOneMinuteRate() PER_SECOND
five_min_rate_per_second Gauge getFiveMinuteRate() PER_SECOND
fifteen_min_rate_per_second Gauge getFifteenMinuteRate() PER_SECOND
14
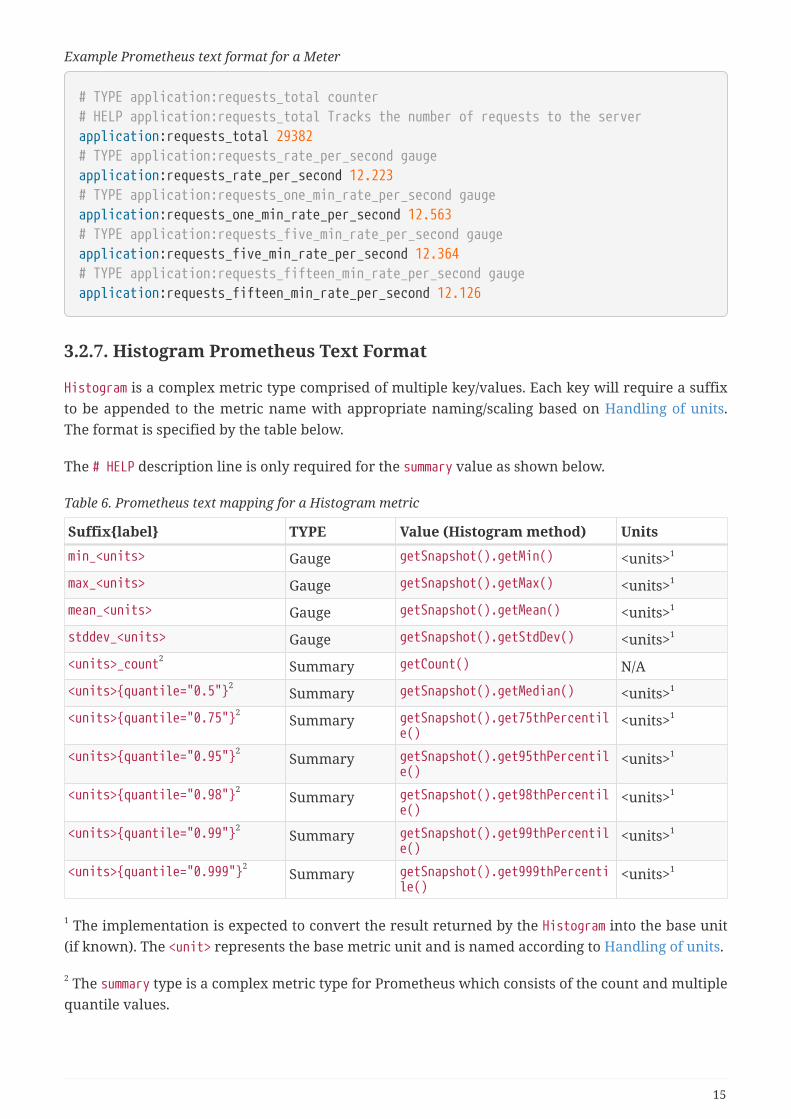
Example Prometheus text format for a Meter
# TYPE application:requests_total counter# HELP application:requests_total Tracks the number of requests to the serverapplication:requests_total 29382# TYPE application:requests_rate_per_second gaugeapplication:requests_rate_per_second 12.223# TYPE application:requests_one_min_rate_per_second gaugeapplication:requests_one_min_rate_per_second 12.563# TYPE application:requests_five_min_rate_per_second gaugeapplication:requests_five_min_rate_per_second 12.364# TYPE application:requests_fifteen_min_rate_per_second gaugeapplication:requests_fifteen_min_rate_per_second 12.126
3.2.7. Histogram Prometheus Text Format
Histogram is a complex metric type comprised of multiple key/values. Each key will require a suffixto be appended to the metric name with appropriate naming/scaling based on Handling of units.The format is specified by the table below.
The # HELP description line is only required for the summary value as shown below.
Table 6. Prometheus text mapping for a Histogram metric
Suffix{label} TYPE Value (Histogram method) Units
min_<units> Gauge getSnapshot().getMin() <units>1
max_<units> Gauge getSnapshot().getMax() <units>1
mean_<units> Gauge getSnapshot().getMean() <units>1
stddev_<units> Gauge getSnapshot().getStdDev() <units>1
<units>_count2Summary getCount() N/A
<units>{quantile="0.5"}2Summary getSnapshot().getMedian() <units>1
<units>{quantile="0.75"}2Summary getSnapshot().get75thPercentil
e()<units>1
<units>{quantile="0.95"}2Summary getSnapshot().get95thPercentil
e()<units>1
<units>{quantile="0.98"}2Summary getSnapshot().get98thPercentil
e()<units>1
<units>{quantile="0.99"}2Summary getSnapshot().get99thPercentil
e()<units>1
<units>{quantile="0.999"}2Summary getSnapshot().get999thPercenti
le()<units>1
1 The implementation is expected to convert the result returned by the Histogram into the base unit(if known). The <unit> represents the base metric unit and is named according to Handling of units.
2 The summary type is a complex metric type for Prometheus which consists of the count and multiplequantile values.
15

Example Prometheus text format for a Histogram with unit bytes.
# TYPE application:file_sizes_mean_bytes gaugeapplication:file_sizes_mean_bytes 4738.231# TYPE application:file_sizes_max_bytes gaugeapplication:file_sizes_max_bytes 31716# TYPE application:file_sizes_min_bytes gaugeapplication:file_sizes_min_bytes 180# TYPE application:file_sizes_stddev_bytes gaugeapplication:file_sizes_stddev_bytes 1054.7343037063602# TYPE application:file_sizes_bytes summary# HELP application:file_sizes_bytes Users file sizeapplication:file_sizes_bytes_count 2037application:file_sizes_bytes{quantile="0.5"} 4201application:file_sizes_bytes{quantile="0.75"} 6175application:file_sizes_bytes{quantile="0.95"} 13560application:file_sizes_bytes{quantile="0.98"} 29643application:file_sizes_bytes{quantile="0.99"} 31716application:file_sizes_bytes{quantile="0.999"} 31716
3.2.8. Timer Prometheus Text Format
Timer is a complex metric type comprised of multiple key/values. Each key will require a suffix to beappended to the metric name. The format is specified by the table below.
The # HELP description line is only required for the summary value as shown below.
Table 7. Prometheus text mapping for a Timer metric
Suffix{label} TYPE Value (Timer method) Units
rate_per_second Gauge getMeanRate() PER_SECOND
one_min_rate_per_second Gauge getOneMinuteRate() PER_SECOND
five_min_rate_per_second Gauge getFiveMinuteRate() PER_SECOND
fifteen_min_rate_per_second Gauge getFifteenMinuteRate() PER_SECOND
min_seconds Gauge getSnapshot().getMin() SECONDS1
max_seconds Gauge getSnapshot().getMax() SECONDS1
mean_seconds Gauge getSnapshot().getMean() SECONDS1
stddev_seconds Gauge getSnapshot().getStdDev() SECONDS1
seconds_count2Summary getCount() N/A
seconds{quantile="0.5"}2Summary getSnapshot().getMedian() SECONDS1
seconds{quantile="0.75"}2Summary getSnapshot().get75thPercentil
e()SECONDS1
seconds{quantile="0.95"}2Summary getSnapshot().get95thPercentil
e()SECONDS1
seconds{quantile="0.98"}2Summary getSnapshot().get98thPercentil
e()SECONDS1
16
Suffix{label} TYPE Value (Timer method) Units
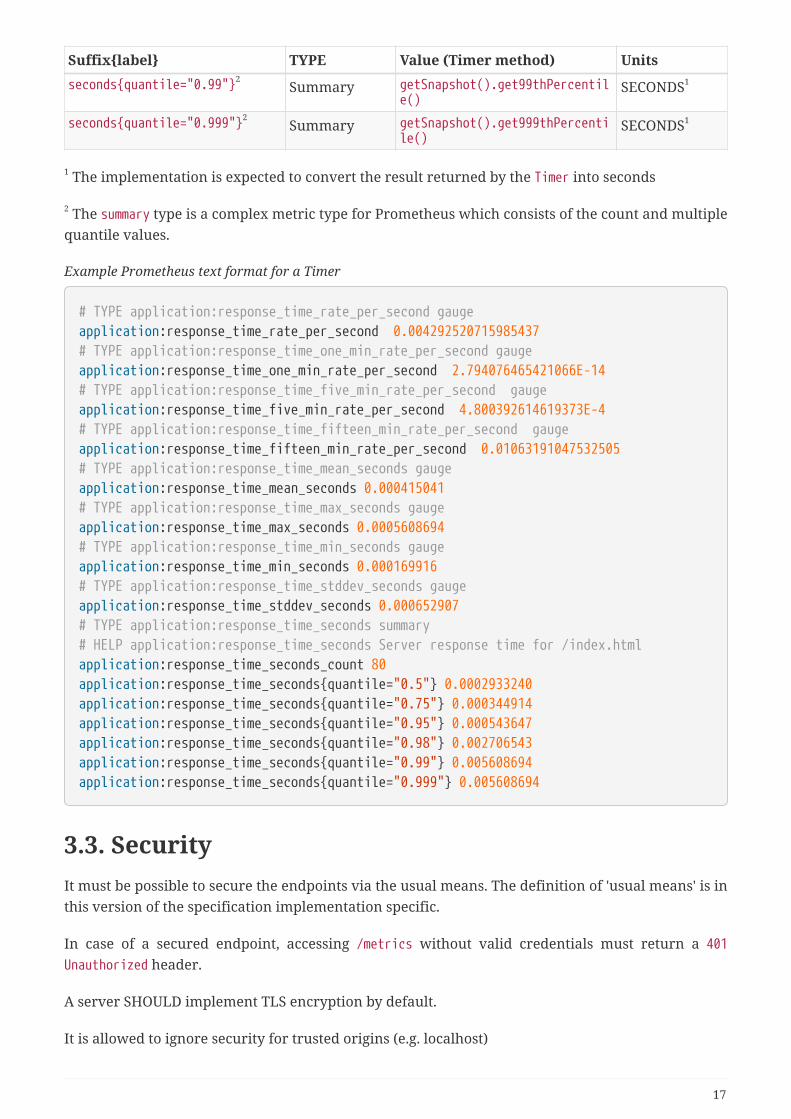
seconds{quantile="0.99"}2Summary getSnapshot().get99thPercentil
e()SECONDS1
seconds{quantile="0.999"}2Summary getSnapshot().get999thPercenti
le()SECONDS1
1 The implementation is expected to convert the result returned by the Timer into seconds
2 The summary type is a complex metric type for Prometheus which consists of the count and multiplequantile values.
Example Prometheus text format for a Timer
# TYPE application:response_time_rate_per_second gaugeapplication:response_time_rate_per_second 0.004292520715985437# TYPE application:response_time_one_min_rate_per_second gaugeapplication:response_time_one_min_rate_per_second 2.794076465421066E-14# TYPE application:response_time_five_min_rate_per_second gaugeapplication:response_time_five_min_rate_per_second 4.800392614619373E-4# TYPE application:response_time_fifteen_min_rate_per_second gaugeapplication:response_time_fifteen_min_rate_per_second 0.01063191047532505# TYPE application:response_time_mean_seconds gaugeapplication:response_time_mean_seconds 0.000415041# TYPE application:response_time_max_seconds gaugeapplication:response_time_max_seconds 0.0005608694# TYPE application:response_time_min_seconds gaugeapplication:response_time_min_seconds 0.000169916# TYPE application:response_time_stddev_seconds gaugeapplication:response_time_stddev_seconds 0.000652907# TYPE application:response_time_seconds summary# HELP application:response_time_seconds Server response time for /index.htmlapplication:response_time_seconds_count 80application:response_time_seconds{quantile="0.5"} 0.0002933240application:response_time_seconds{quantile="0.75"} 0.000344914application:response_time_seconds{quantile="0.95"} 0.000543647application:response_time_seconds{quantile="0.98"} 0.002706543application:response_time_seconds{quantile="0.99"} 0.005608694application:response_time_seconds{quantile="0.999"} 0.005608694
3.3. SecurityIt must be possible to secure the endpoints via the usual means. The definition of 'usual means' is inthis version of the specification implementation specific.
In case of a secured endpoint, accessing /metrics without valid credentials must return a 401Unauthorized header.
A server SHOULD implement TLS encryption by default.
It is allowed to ignore security for trusted origins (e.g. localhost)
17

Chapter 4. Required MetricsBase metrics is a list of metrics that all vendors need to implement. Optional base metrics arerecommended to be implemented but are not required. These metrics are exposed under/metrics/base.
The following is a list of required and optional base metrics. All metrics are singletons and haveMulti: set to false unless otherwise stated. Visit Metadata for the meaning of each key
4.1. General JVM StatsUsedHeapMemory
Name memory.usedHeap
DisplayName Used Heap Memory
Type Gauge
Unit Bytes
Description Displays the amount of used heap memory in bytes.
MBean java.lang:type=Memory/HeapMemoryUsage#used
CommittedHeapMemory
Name memory.committedHeap
DisplayName Committed Heap Memory
Type Gauge
Unit Bytes
Description Displays the amount of memory in bytes that is committed for the Java virtualmachine to use. This amount of memory is guaranteed for the Java virtualmachine to use.
MBean java.lang:type=Memory/HeapMemoryUsage#committed
Notes Also from JSR 77
MaxHeapMemory
Name memory.maxHeap
DisplayName Max Heap Memory
Type Gauge
Unit Bytes
Description Displays the maximum amount of heap memory in bytes that can be used formemory management. This attribute displays -1 if the maximum heapmemory size is undefined. This amount of memory is not guaranteed to beavailable for memory management if it is greater than the amount ofcommitted memory. The Java virtual machine may fail to allocate memoryeven if the amount of used memory does not exceed this maximum size.
18

MBean java.lang:type=Memory/HeapMemoryUsage#max
GCCount
Name gc.%s.count
DisplayName Garbage Collection Count
Type Counter
Unit None
Multi true
Description Displays the total number of collections that have occurred. This attribute lists-1 if the collection count is undefined for this collector.
MBean java.lang:type=GarbageCollector,name=%s/CollectionCount
Notes There can be multiple garbage collectors active that are assigned to differentmemory pools. The %s should be substituted with the name of the garbagecollector.
GCTime - Approximate accumulated collection elapsed time in ms
Name gc.%s.time
DisplayName Garbage Collection Time
Type Gauge
Unit Milliseconds
Multi true
Description Displays the approximate accumulated collection elapsed time in milliseconds.This attribute displays -1 if the collection elapsed time is undefined for thiscollector. The Java virtual machine implementation may use a high resolutiontimer to measure the elapsed time. This attribute may display the same valueeven if the collection count has been incremented if the collection elapsedtime is very short.
MBean java.lang:type=GarbageCollector,name=%s/CollectionTime
Notes There can be multiple garbage collectors active that are assigned to differentmemory pools. The %s should be substituted with the name of the garbagecollector.
JVM Uptime - Up time of the Java Virtual machine
Name jvm.uptime
DisplayName JVM Uptime
Type Gauge
Unit Milliseconds
Description Displays the start time of the Java virtual machine in milliseconds. Thisattribute displays the approximate time when the Java virtual machinestarted.
MBean java.lang:type=Runtime/Uptime
19

Notes Also from JSR 77
4.2. Thread JVM StatsThreadCount
Name thread.count
DisplayName Thread Count
Type Counter
Unit None
Description Displays the current number of live threads including both daemon and non-daemon threads
MBean java.lang:type=Threading/ThreadCount
DaemonThreadCount
Name thread.daemon.count
DisplayName Daemon Thread Count
Type Counter
Unit None
Description Displays the current number of live daemon threads.
MBean java.lang:type=Threading/DaemonThreadCount
PeakThreadCount
Name thread.max.count
DisplayName Peak Thread Count
Type Counter
Unit None
Description Displays the peak live thread count since the Java virtual machine started orpeak was reset. This includes daemon and non-daemon threads.
MBean java.lang:type=Threading/PeakThreadCount
4.3. Thread Pool Stats(Optional) ActiveThreads
Name threadPool.%s.activeThreads
DisplayName Active Threads
Type Gauge
Unit None
Multi true
20

Description Number of active threads that belong to a specific thread pool. Note: The %sshould be substituted with the name of the thread pool. This is a vendorspecific attribute/operation that is not defined in java.lang.
(Optional) PoolSize
Name threadPool.%s.size
DisplayName Thread Pool Size
Type Gauge
Unit None
Multi true
Description The size of a specific thread pool. Note: The %s should be substituted with thename of the thread pool. This is a vendor specific attribute/operation that isnot defined in java.lang.
4.4. ClassLoading JVM StatsLoadedClassCount
Name classloader.currentLoadedClass.count
DisplayName Current Loaded Class Count
Type Counter
Unit None
Description Displays the number of classes that are currently loaded in the Java virtualmachine.
MBean java.lang:type=ClassLoading/LoadedClassCount
TotalLoadedClassLoaded
Name classloader.totalLoadedClass.count
DisplayName Total Loaded Class Count
Type Counter
Unit None
Description Displays the total number of classes that have been loaded since the Javavirtual machine has started execution.
MBean java.lang:type=ClassLoading/TotalLoadedClassCount
UnloadedClassCount
Name classloader.totalUnloadedClass.count
DisplayName Total Unloaded Class Count
Type Counter
Unit None
21

Description Displays the total number of classes unloaded since the Java virtual machinehas started execution.
MBean java.lang:type=ClassLoading/UnloadedClassCount
4.5. Operating SystemAvailableProcessors
Name cpu.availableProcessors
DisplayName Available Processors
Type Gauge
Unit None
Description Displays the number of processors available to the Java virtual machine. Thisvalue may change during a particular invocation of the virtual machine.
MBean java.lang:type=OperatingSystem/AvailableProcessors
(Optional) SystemLoadAverage
Name cpu.systemLoadAverage
DisplayName System Load Average
Type Gauge
Unit None
Description Displays the system load average for the last minute. The system load averageis the sum of the number of runnable entities queued to the availableprocessors and the number of runnable entities running on the availableprocessors averaged over a period of time. The way in which the load averageis calculated is operating system specific but is typically a damped time-dependent average. If the load average is not available, a negative value isdisplayed. This attribute is designed to provide a hint about the system loadand may be queried frequently. The load average may be unavailable on someplatforms where it is expensive to implement this method.
MBean java.lang:type=OperatingSystem/SystemLoadAverage
(Optional) ProcessCpuLoad
Name cpu.processCpuLoad
DisplayName Process CPU Load
Type Gauge
Unit Percent
Description Displays the "recent cpu usage" for the Java Virtual Machine process
22

MBean java.lang:type=OperatingSystem(com.sun.management.UnixOperatingSystemMXBean for Oracle Java, similarone exists for IBM Java:com.ibm.lang.management.ExtendedOperatingSystem) Note: This is a vendorspecific attribute/operation that is not defined in java.lang
23

Chapter 5. Application Metrics ProgrammingModelMicroProfile Metrics provides a way to register Application-specific metrics to allow applications toexpose metrics in the application scope (see Scopes for the description of scopes).
Metrics and their metadata are added to a Metric Registry upon definition and can afterwards havetheir values set and retrieved via the Java-API and also be exposed via the REST-API (see Exposingmetrics via REST API).
Implementors of this specification can use the Java API to also expose metrics forbase and vendor scope by using the respective Metric Registry.
In order to make setting the values easier, Annotations are made available.
Example set-up of a Gauge metric. No unit is given, so MetricUnits.NONE is used, an explicit name isprovided
@Gauge(name = "queueSize")public int getQueueSize() { return queue.size;}
The programming API follows Dropwizard Metrics 3.2.3 API, but with localchanges. It is expected that many existing DropWizard Metrics based applicationscan easily be ported over by exchanging the package names.
It will be possible to use the non-annotations API, but using the annotations will generally be easierfor developers.
5.1. Responsibility of the MicroProfile Metricsimplementation
• The implementation must scan the application at deploy time for Annotations and register theMetrics along with their metadata in the application MetricsRegistry.
• The implementation must watch the annotated objects and update internal data structureswhen the values of the annotated objects change.
• The implementation must expose the values of the objects registered in the MetricsRegistry viaREST-API as described in Exposing metrics via REST API.
• Metrics registered via non-annotations API need their values be set via updates from theapplication code.
• The implementation must flag duplicate metrics upon registration and reject the duplicate. Aduplicate metric is a metric that has the same scope and name as an existing one.
24

5.2. Base PackageAll Java-Classes are in the top-level package org.eclipse.microprofile.metrics or one of its sub-packages.
The org.eclipse.microprofile.metrics package was influenced by the Drop WizardMetrics project release 3.2.3.
Implementors can consult this project for implementation ideas.
See References for more information.
5.3. AnnotationsAll Annotations are in the org.eclipse.microprofile.metrics.annotation package
These annotations include interceptor bindings as defined by the Java Interceptorsspecification.
CDI leverages on the Java Interceptors specification to provide the ability toassociate interceptors to beans via typesafe interceptor bindings, as a mean toseparate cross-cutting concerns, like Metrics annotations instrumentation, fromthe application business logic.
Both the Java Interceptors and CDI specifications set restrictions about the type ofbean to which an interceptor can be bound.
That implies only managed beans whose bean types are proxyable can beinstrumented using the Metrics annotations.
The org.eclipse.microprofile.metrics.annotation package was influenced by theCDI extension for Dropwizard Metric project release 1.4.0.
Implementors can consult this project for implementation ideas.
See References for more information.
The following Annotations exist, see below for common fields:
Annotation Applies to Description Default Unit
@Counted M, C, T Denotes a counter, which counts theinvocations of the annotated object.
MetricUnits.NONE
@Gauge M Denotes a gauge, which samples thevalue of the annotated object.
none Must be supplied bythe user
@Metered M, C, T Denotes a meter, which tracks thefrequency of invocations of theannotated object.
MetricUnits.PER_SECOND
25

Annotation Applies to Description Default Unit
@Metric M, F, P An annotation requesting that a metricshould be injected. This annotation canbe used on the fields of type Meter, Timer,Counter, and Histogram.
MetricUnits.NONE
@Timed M, C, T Denotes a timer, which tracks duration ofthe annotated object.
MetricUnits.NANOSECONDS
(C=Constructor, F=Field, M=Method, P=Parameter, T=Type)
Annotation Description Default
@RegistryType Qualifies the scope of Metric Registry to injectwhen injecting a MetricRegistry.
application (scope)
5.3.1. Fields
All annotations (Except RegistryType) have the following fields that correspond to the metadatafields described in Metadata.
String name
Optional. Sets the name of the metric. If not explicitly given the name of the annotated object isused.
boolean absolute
If true, uses the given name as an absolute name of the metric. If false, prepends the packagename and class name before the given name. Default value is false.
String displayName
Optional. A human readable display name for metadata.
String description
Optional. A description of the metric.
String unit
Unit of the metric. For @Gauge no default is provided. Check the MetricUnits class for a set of pre-defined units.
String[] tags
Optional. Array of Strings in the <key>=<value> format to supply special tags to a metric.
Implementors are encouraged to issue warnings in the server log if metadata ismissing. Implementors MAY stop the deployment of an application if Metadata ismissing.
5.3.2. Annotated Naming Convention
Annotated metrics are registered into the application MetricRegistry with the name based on theannotation’s name and absolute fields.
26
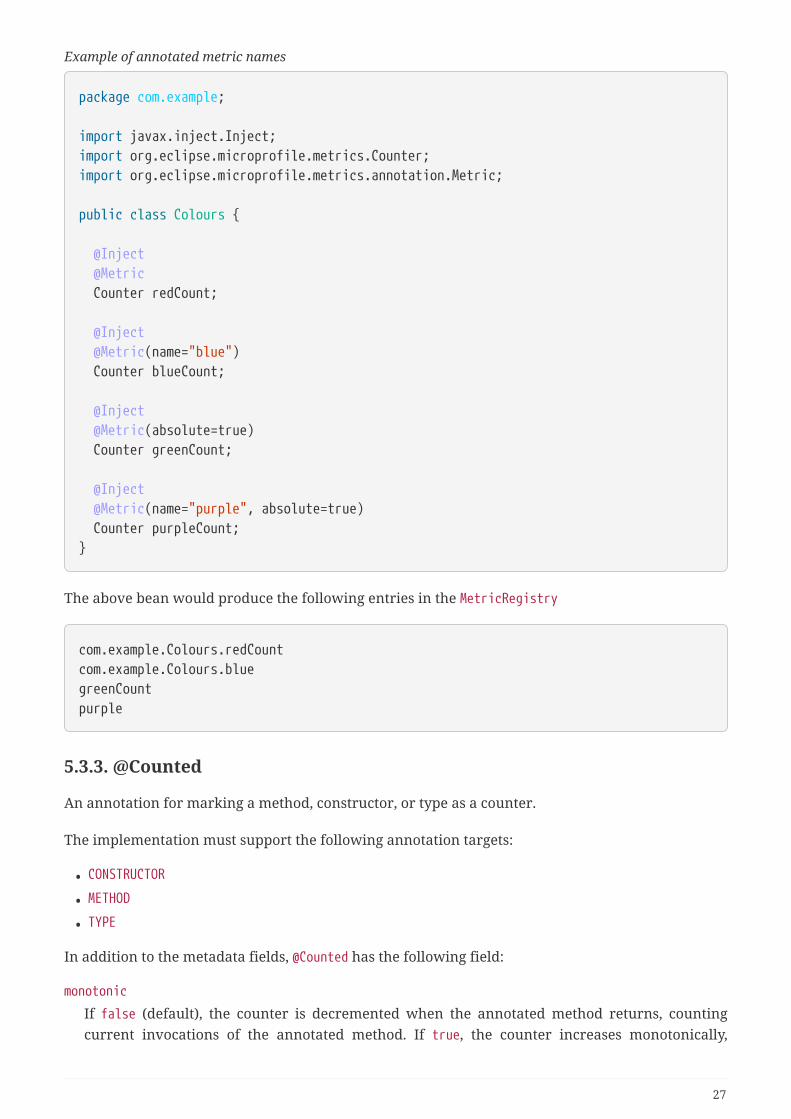
Example of annotated metric names
package com.example;
import javax.inject.Inject;import org.eclipse.microprofile.metrics.Counter;import org.eclipse.microprofile.metrics.annotation.Metric;
public class Colours {
@Inject @Metric Counter redCount;
@Inject @Metric(name="blue") Counter blueCount;
@Inject @Metric(absolute=true) Counter greenCount;
@Inject @Metric(name="purple", absolute=true) Counter purpleCount;}
The above bean would produce the following entries in the MetricRegistry
com.example.Colours.redCountcom.example.Colours.bluegreenCountpurple
5.3.3. @Counted
An annotation for marking a method, constructor, or type as a counter.
The implementation must support the following annotation targets:
• CONSTRUCTOR
• METHOD
• TYPE
In addition to the metadata fields, @Counted has the following field:
monotonic
If false (default), the counter is decremented when the annotated method returns, countingcurrent invocations of the annotated method. If true, the counter increases monotonically,
27
counting total invocations of the annotated method.
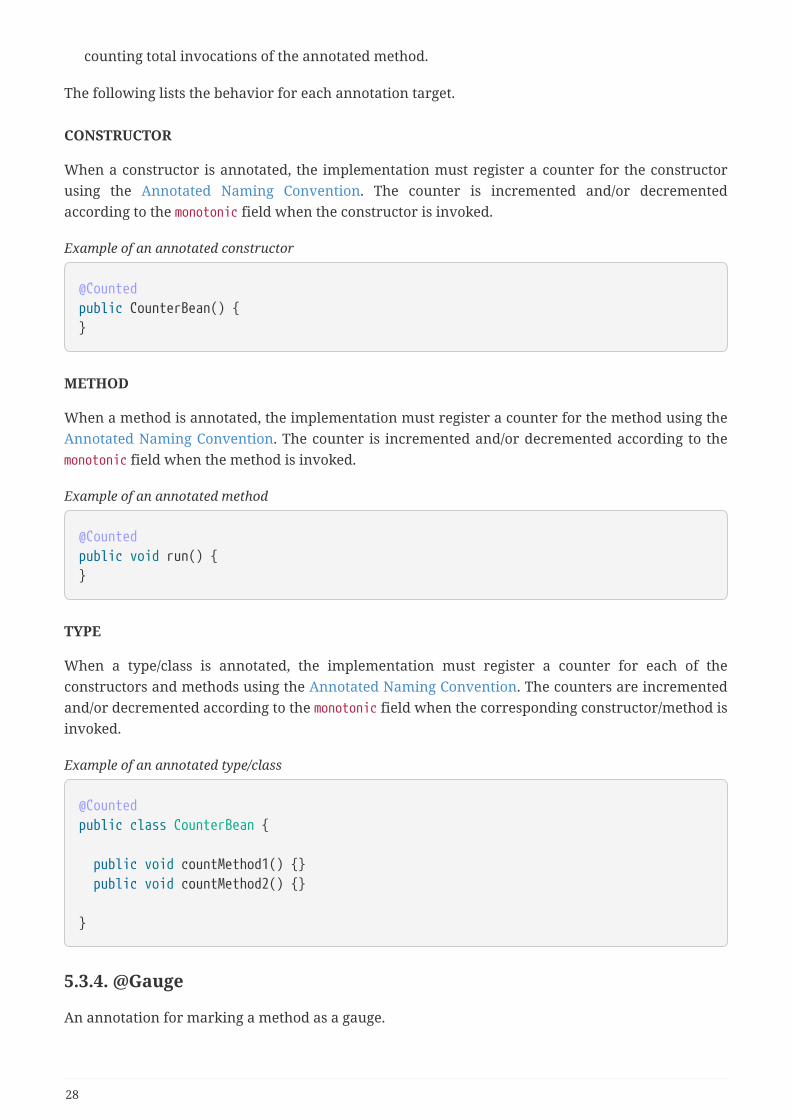
The following lists the behavior for each annotation target.
CONSTRUCTOR
When a constructor is annotated, the implementation must register a counter for the constructorusing the Annotated Naming Convention. The counter is incremented and/or decrementedaccording to the monotonic field when the constructor is invoked.
Example of an annotated constructor
@Countedpublic CounterBean() {}
METHOD
When a method is annotated, the implementation must register a counter for the method using theAnnotated Naming Convention. The counter is incremented and/or decremented according to themonotonic field when the method is invoked.
Example of an annotated method
@Countedpublic void run() {}
TYPE
When a type/class is annotated, the implementation must register a counter for each of theconstructors and methods using the Annotated Naming Convention. The counters are incrementedand/or decremented according to the monotonic field when the corresponding constructor/method isinvoked.
Example of an annotated type/class
@Countedpublic class CounterBean {
public void countMethod1() {} public void countMethod2() {}
}
5.3.4. @Gauge
An annotation for marking a method as a gauge.
28
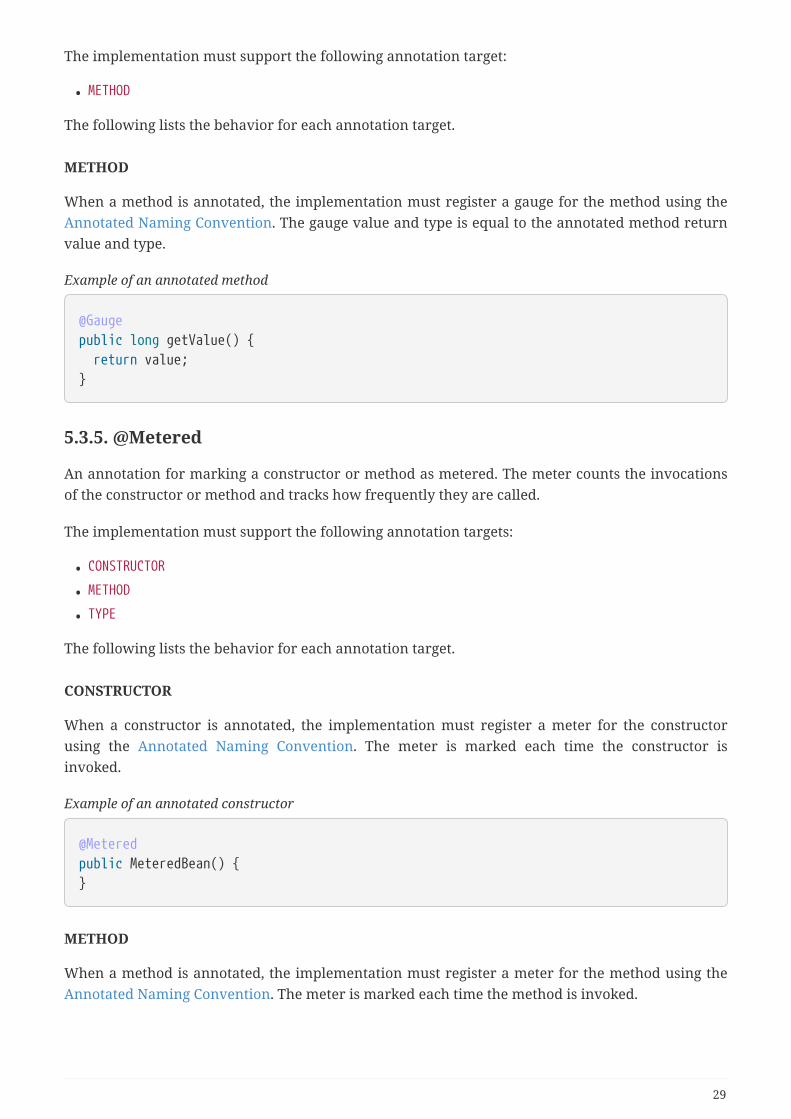
The implementation must support the following annotation target:
• METHOD
The following lists the behavior for each annotation target.
METHOD
When a method is annotated, the implementation must register a gauge for the method using theAnnotated Naming Convention. The gauge value and type is equal to the annotated method returnvalue and type.
Example of an annotated method
@Gaugepublic long getValue() { return value;}
5.3.5. @Metered
An annotation for marking a constructor or method as metered. The meter counts the invocationsof the constructor or method and tracks how frequently they are called.
The implementation must support the following annotation targets:
• CONSTRUCTOR
• METHOD
• TYPE
The following lists the behavior for each annotation target.
CONSTRUCTOR
When a constructor is annotated, the implementation must register a meter for the constructorusing the Annotated Naming Convention. The meter is marked each time the constructor isinvoked.
Example of an annotated constructor
@Meteredpublic MeteredBean() {}
METHOD
When a method is annotated, the implementation must register a meter for the method using theAnnotated Naming Convention. The meter is marked each time the method is invoked.
29

Example of an annotated method
@Meteredpublic void run() {}
TYPE
When a type/class is annotated, the implementation must register a meter for each of theconstructors and methods using the Annotated Naming Convention. The meters are marked eachtime the corresponding constructor/method is invoked.
Example of an annotated type/class
@Meteredpublic class MeteredBean {
public void meteredMethod1() {} public void meteredMethod2() {}
}
5.3.6. @Timed
An annotation for marking a constructor or method of an annotated object as timed. The metric oftype Timer tracks how frequently the annotated object is invoked, and tracks how long it took theinvocations to complete.
The implementation must support the following annotation targets:
• CONSTRUCTOR
• METHOD
• TYPE
The following lists the behavior for each annotation target.
CONSTRUCTOR
When a constructor is annotated, the implementation must register a timer for the constructorusing the Annotated Naming Convention. Each time the constructor is invoked, the execution willbe timed.
Example of an annotated constructor
@Timedpublic TimedBean() {}
30

METHOD
When a method is annotated, the implementation must register a timer for the method using theAnnotated Naming Convention. Each time the method is invoked, the execution will be timed.
Example of an annotated method
@Timedpublic void run() {}
TYPE
When a type/class is annotated, the implementation must register a timer for each of theconstructors and methods using the Annotated Naming Convention. Each time aconstructor/method is invoked, the execution will be timed with the corresponding timer.
Example of an annotated type/class
@Timedpublic class TimedBean {
public void timedMethod1() {} public void timedMethod2() {}
}
5.3.7. @Metric
An annotation requesting that a metric should be injected or registered.
The implementation must support the following annotation targets:
• FIELD
• METHOD
• PARAMETER
The following lists the behavior for each annotation target.
FIELD
When a metric producer field is annotated, the implementation must register the metric to theapplication MetricRegistry (using the Annotated Naming Convention). If a metric with the givenname already exist (created by another @Produces for example), anjava.lang.IllegalArgumentException must be thrown.
31

Example of a producer field
@Produces@Metric(name="hitPercentage")@ApplicationScopedGauge<Double> hitPercentage = new Gauge<Double>() {
@Override public Double getValue() { return hits / total; }};
When a metric injected field is annotated, the implementation must provide the registered metricwith the given name (using the Annotated Naming Convention) if the metric already exist. If nometric exists with the given name then the implementation must produce and register therequested metric. @Metric can only be used on injected fields of type Meter, Timer, Counter, andHistogram.
Example of an injected field
@Inject@Metric("applicationCount")Counter count;
METHOD
When a metric producer method is annotated, the implementation must register the metricproduced by the method using the Annotated Naming Convention.
Example of a producer method
@Produces@Metric(name = "hitPercentage")@ApplicationScopedprotected Gauge<Double> createHitPercentage() { return new Gauge<Double>() {
@Override public Double getValue() { return hits / total; } };}
PARAMETER
When a metric parameter is annotated, the implementation must provide the registered metricwith the given name (using the Annotated Naming Convention) if the metric already exist. If no
32

metric exists with the given name then the implementation must produce and register therequested metric.
Example of an annotated parameter
@Injectpublic void init(@Metric(name="instances") Counter instances) { instances.inc();}
5.4. Metric RegistriesThe MetricRegistry is used to maintain a collection of metrics along with their metadata. There isone shared singleton of the MetricRegistry per scope (application, base, and vendor). When metricsare registered using annotations, the metrics are registered in the application MetricRegistry (andthus the application scope).
When injected, the @RegistryType is used as a qualifier to selectively inject either the APPLICATION,BASE, or VENDOR registry. If no qualifier is used, the default MetricRegistry returned is the APPLICATIONregistry.
Implementations may choose to use a Factory class to produce the injectable MetricRegistry beanvia CDI. See Example Metric Registry Factory. Note: The factory would be an internal class and notexposed to the application.
5.4.1. @RegistryType
The @RegistryType can be used to retrieve the MetricRegistry for a specific scope. Theimplementation must produce the corresponding MetricRegistry specified by the RegistryType.
The implementor can optionally provide a read_only copy of the MetricRegistry forbase and vendor scopes.
5.4.2. Application Metric Registry
The implementation must produce the application MetricRegistry when no RegistryType is provided(@Default) or when the RegistryType is APPLICATION.
Example of the application injecting the application registry
@InjectMetricRegistry metricRegistry;
33

is equivalent to
@Inject@RegistryType(type=MetricRegistry.Type.APPLICATION)MetricRegistry metricRegistry;
5.4.3. Base Metric Registry
The implementation must produce the base MetricRegistry when the RegistryType is BASE. The baseMetricRegistry must contain the required metrics specified in Required Metrics.
Example of the application injecting the base registry
@Inject@RegistryType(type=MetricRegistry.Type.BASE)MetricRegistry baseRegistry;
5.4.4. Vendor Metric Registry
The implementation must produce the vendor MetricRegistry when the RegistryType is VENDOR. Thevendor MetricRegistry must contain any vendor specific metrics.
Example of the application injecting the vendor registry
@Inject@RegistryType(type=MetricRegistry.Type.VENDOR)MetricRegistry vendorRegistry;
34
Chapter 6. Appendix
6.1. Alternatives consideredJolokia JMX-HTTP bridge. Using this for application specific metrics would require those metrics tobe exposed to JMX first, which many users are not familiar with.
6.2. ReferencesDropwizard Metrics 3.2.3
CDI extension for Dropwizard Metrics 1.4.0
HTTP return codes
UoM, JSR 363
Metrics 2.0
6.3. Example configuration format for base andvendor-specific dataThe following is an example configuration in YAML format.
35
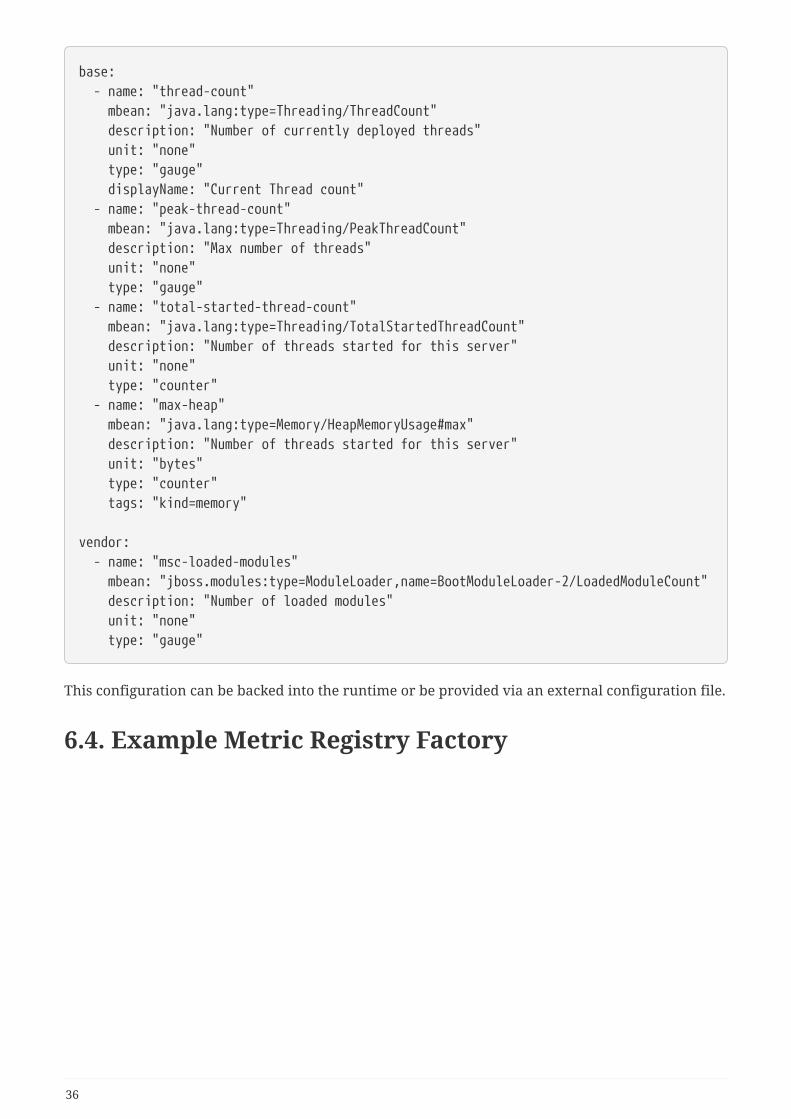
base: - name: "thread-count" mbean: "java.lang:type=Threading/ThreadCount" description: "Number of currently deployed threads" unit: "none" type: "gauge" displayName: "Current Thread count" - name: "peak-thread-count" mbean: "java.lang:type=Threading/PeakThreadCount" description: "Max number of threads" unit: "none" type: "gauge" - name: "total-started-thread-count" mbean: "java.lang:type=Threading/TotalStartedThreadCount" description: "Number of threads started for this server" unit: "none" type: "counter" - name: "max-heap" mbean: "java.lang:type=Memory/HeapMemoryUsage#max" description: "Number of threads started for this server" unit: "bytes" type: "counter" tags: "kind=memory"
vendor: - name: "msc-loaded-modules" mbean: "jboss.modules:type=ModuleLoader,name=BootModuleLoader-2/LoadedModuleCount" description: "Number of loaded modules" unit: "none" type: "gauge"
This configuration can be backed into the runtime or be provided via an external configuration file.
6.4. Example Metric Registry Factory
36

Sample skeleton factory class to produce MetricRegistry via CDI
@ApplicationScopedpublic class MetricRegistryFactory {
@Produces public static MetricRegistry getDefaultRegistry() { return getApplicationRegistry(); }
@Produces @RegistryType(type = Type.APPLICATION) public static MetricRegistry getApplicationRegistry() { // Returns the static instance of the Application MetricRegistry [...] }
@Produces @RegistryType(type = Type.BASE) public static MetricRegistry getBaseRegistry() { // Returns the static instance of the Base MetricRegistry [...] }
@Produces @RegistryType(type = Type.VENDOR) public static MetricRegistry getVendorRegistry() { // Returns the static instance of the Vendor MetricRegistry [...] }
}
37


