Date post: | 30-Dec-2015 |
Category: |
Documents |
Upload: | sharlene-reynolds |
View: | 216 times |
Download: | 0 times |
Metro Area and State Competitiveness Report 2002Metro Area and State Competitiveness Report 2002
Metro Area and State Metro Area and State Competitiveness Report Competitiveness Report 20022002
Beacon Hill Institute at Suffolk UniversityBeacon Hill Institute at Suffolk University8 Ashburton PlaceBoston, MA 02108
617-573-8750
www.beaconhill.org
8 Ashburton PlaceBoston, MA 02108
617-573-8750
www.beaconhill.org
Jonathan HaughtonSenior Economist
Corina MurgEconomist
Jonathan HaughtonSenior Economist
Corina MurgEconomist
Metro Area and State Competitiveness Report 2002Metro Area and State Competitiveness Report 2002
A QuestionA Question
• What do Seattle, San Francisco, Boston, Denver and Minneapolis have in common?
• Ans: Competitiveness Index > 6.7; they are the top ranked cities.
Metro Area and State Competitiveness Report 2002Metro Area and State Competitiveness Report 2002
Competitiveness?Competitiveness?
• What does this mean?
• Why does it matter?• What are the
implications for policy?
Metro Area and State Competitiveness Report 2002Metro Area and State Competitiveness Report 2002
A metropolitan area is competitive if it has in place the policies and conditions that ensure and sustain a high level of per capita income and its continued growth.
Michael Porter Competitiveness =“the
microfoundations of prosperity.”
What Is Competitiveness?What Is Competitiveness?
Metro Area and State Competitiveness Report 2002Metro Area and State Competitiveness Report 2002
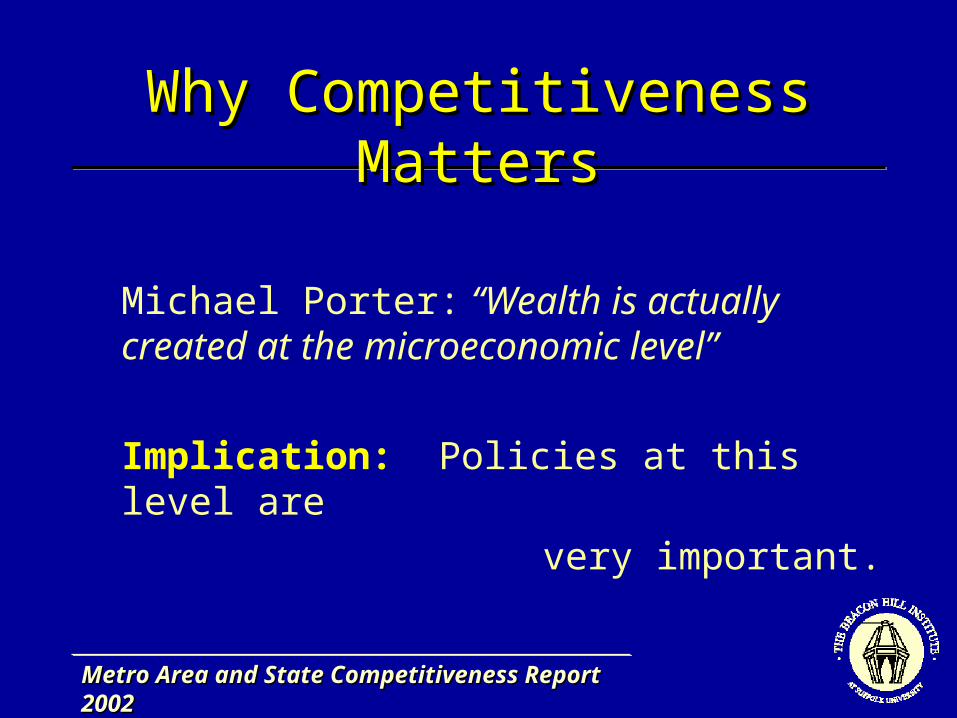
Michael Porter: “Wealth is actually created at the microeconomic level”
Implication: Policies at this level are
very important.
Why Competitiveness MattersWhy Competitiveness Matters
Metro Area and State Competitiveness Report 2002Metro Area and State Competitiveness Report 2002
Focus on 50 Metro Areas (163m)Population, m
NY 21.2
LA 16.4
Chicago 9.2
Washington 7.6
San Francisco 7.0
Philadelphia 6.2
Population, m
Boston 5.8
Detroit 5.5
Dallas-FW 5.2
Providence 1.2
Hartford 1.2
Richmond 1.0
Metro Area and State Competitiveness Report 2002Metro Area and State Competitiveness Report 2002
Metro Area Metro Area Competitiveness IndexCompetitiveness Index
- grouped into 9 sub-indexes; - 42 objective indicators for each of 50
largest metro areas- final index: normalized average of the
sub-indexes;- indexes scaled from 0 (least
competitive) to 10, with mean of 5 and SD of 1.
Metro Area and State Competitiveness Report 2002Metro Area and State Competitiveness Report 2002
ComponentsComponents
Boston index Boston rank- Government and fiscal policy 3.87 43- Security 6.60 2- Infrastructure 5.28 17- Human resources 7.52 1- Technology 8.43 1- Finance and cost 5.90 10- Openness 4.69 28- Domestic competition 6.04 10- Environmental policy 5.05 25
OVERALL 7.00 3
Metro Area and State Competitiveness Report 2002Metro Area and State Competitiveness Report 2002
1. Government & Fiscal Policy
Rank Index
Taxes as a % of current GSP 22 5.16
Workers' compensation collections per employee 26 5.47
Unemployment payments per unemployed worker 50 1.84
Bond rating: S&P's/Moody's composite 30 4.92
State bond rating 39 4.43
Boston
Metro Area and State Competitiveness Report 2002Metro Area and State Competitiveness Report 2002
2. Security
Rank Index
Crime index change 1999-2000, % 18 5.33
Violent crimes per 100,000 inhabitants 15 5.54
Thefts per 100,000 inhabitants 2 6.61
Murders per 100,000 inhabitants 1 6.35
Boston
Metro Area and State Competitiveness Report 2002Metro Area and State Competitiveness Report 2002
3. Infrastructure
Rank Index
Mass transit availability 4 6.20
Travel time to work 41 4.16
% of households with computers 11 5.61
% of adults online 15 5.57
Median household gross rent 43 3.96
Boston
Metro Area and State Competitiveness Report 2002Metro Area and State Competitiveness Report 2002
4. Human Resources
Rank Index
High school finishers as % of 18-year olds 11 5.73
% of population that graduated from high school 8 5.85
Enrollment in degree-granting institutions per capita 4 6.57
% of labor force represented by unions 26 4.76
Unemployment rate 6 6.23
% of adults in the labor force 25 5.05
% of population born abroad 14 5.24
% of population without health insurance 6 6.18
Infant mortality rate, deaths per 1000 live births 3 6.57
Nonfederal physicians per 100,000 inhabitants 1 7.63
Boston
Metro Area and State Competitiveness Report 2002Metro Area and State Competitiveness Report 2002
5. Technology
Rank Index
Academic R&D funding relative to employment 2 6.47
NIH support to institutions per capita 1 9.58
New patents issued per 100,000 inhabitants 6 5.86
Science & engineering grad. students per capita 1 8.59
Scientists and engineers in the labor force 1 7.83
High tech payroll as % of total payroll 7 6.11
Boston
Metro Area and State Competitiveness Report 2002Metro Area and State Competitiveness Report 2002
6. Finance and Cost
Rank Index
Bank deposits per capita 4 6.72
Venture capital as % of Gross Metro Product (GMP) 4 6.19
Cost of living 50 3.27
Boston
Metro Area and State Competitiveness Report 2002Metro Area and State Competitiveness Report 2002
7. OpennessRank Index
Exports per capita 18 5.10
Air passengers per capita 31 4.48
Boston
Metro Area and State Competitiveness Report 2002Metro Area and State Competitiveness Report 2002
8. Domestic Competition
Rank Index
Net firm creation per 100,000 inhabitants 2 6.67
New publicly traded companies 4 6.01
Cognetics entrepreneurial hot spot index 35 4.56
Boston
Metro Area and State Competitiveness Report 2002Metro Area and State Competitiveness Report 2002
9. Environmental Policy
Rank Index
Pollution standards index 8 5.92
Serious pollution days p.a. 15 5.71
Toxic release, pounds per capita 14 5.23
Electricity prices, $ per mbtu 46 3.26
Boston
Metro Area and State Competitiveness Report 2002Metro Area and State Competitiveness Report 2002
Where Does Boston Stand?Where Does Boston Stand?
• Boston ranks 3rd- Strengths:
- Human resources - Technology - Security
- Also- Finance- Competition
- Main Weakness: - Government policy
- Near middle of pack
- Infrastructure- Environment- Openness
Metro Area and State Competitiveness Report 2002Metro Area and State Competitiveness Report 2002
Other High Performers
• Seattle: scores high on openness, infrastructure, domestic competition, environment
• San Francisco: strong human resources, technology, finance, openness and domestic competition
• Denver: broad-based strengths; below average only in finance
• Minneapolis: strong human resources, openness, and environmental policy
Metro Area and State Competitiveness Report 2002Metro Area and State Competitiveness Report 2002
Weak Performers
• New Orleans: poor scores on crime, human resources, and technology
• Buffalo: weak on fiscal policy and finance, as well as domestic competition.
Metro Area and State Competitiveness Report 2002Metro Area and State Competitiveness Report 2002
The Index Fits WellThe Index Fits Well
Real personal income per capita = 21,105 + 2,226 Indicators Index. R2 = 0.29 t = 8.2 t = 4.4
Metro Area and State Competitiveness Report 2002Metro Area and State Competitiveness Report 2002
State Competitiveness
• Stability between 2001 and 2002 rankings
• Biggest drop:
Alaska from 22 to 34• Biggest rise:
PA from 37 to 27• Notable:
CA from 10 to 16.
2002 2001Delaware 1 1Massachusetts 2 2Washington 3 4Colorado 4 6Connecticut 5 8Wyoming 6 3Vermont 7 5New Hampshire 8 7Minnesota 9 9Oregon 10 13
California 16 10
Louisiana 47 48West Virginia 48 49Arkansas 49 47Mississippi 50 50
Rank
Metro Area and State Competitiveness Report 2002Metro Area and State Competitiveness Report 2002
The Pattern of Competitiveness
• Geography does not determine success: top 10 are widely spread
• But 10 worst are disproportionately east of the Mississippi
• Of the 10 worst performers, two each are in CA, FL, NY and TN.
• State and metro performance are not necessarily correlated:– Raleigh: 7 NC: 35
– Austin: 6 TX: 28
But
- Boston: 3 MA: 2
Metro Area and State Competitiveness Report 2002Metro Area and State Competitiveness Report 2002
Policy ImplicationsPolicy Implications
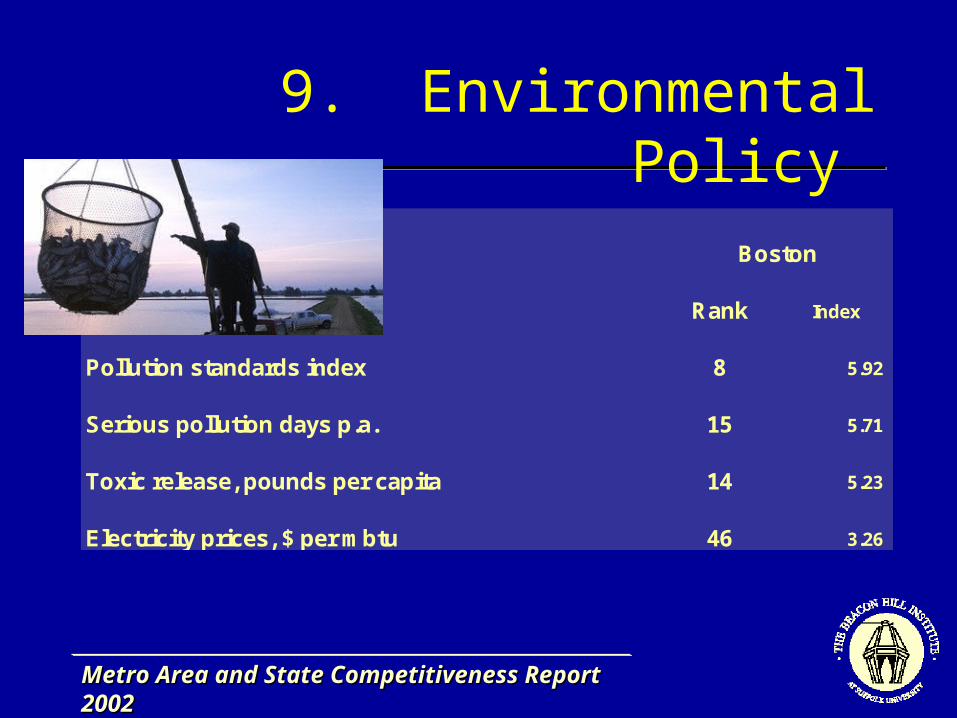
Examples• Boston: Fiscal restraint; attention to high
cost of living; some concern about openness.
• Hartford: Fiscal restraint; need for more competition; concern about environment.
• Los Angeles: Needs attention to environment, and to finance.
Metro Area and State Competitiveness Report 2002Metro Area and State Competitiveness Report 2002
Implications for Recovery
• Competitiveness is a medium- to long-run concept
• Boston’s fundamentals are good– The problems are “the trappings of success”– It will rebound nicely.
• Michael Porter said the same in 1991-92.
Metro Area and State Competitiveness Report 2002Metro Area and State Competitiveness Report 2002
Other ReportsOther Reports
• Robert Atkinson and Paul Gottlieb, The Metropolitan New Economy Index, Progressive Policy Institute and Center for Regional Economic Issues, April 2001.
• Index of the Massachusetts Innovation Economy by the Massachusetts Technology Collaborative, Dec 2002.
• Index of Economic Freedom by John Byars, Robert McCormick and Bruce Yandle of Clemson University;
• Index of Economic Freedom by the Heritage Foundation (constructed for the countries of the world rather than for the states).