METROPOLITAN POLICY PROGRAM Audrey Singer, Senior Fellow Latin American Immigrants in the Washington, DC Metropolitan area Latin American Immigrants: Civic and Political Participation in the Washington DC-Metro Area Woodrow Wilson Center November 1, 2007
Transcript
METROPOLITAN POLICY PROGRAM
Audrey Singer, Senior Fellow
Latin American Immigrants in the Washington, DC Metropolitan area
Latin American Immigrants: Civic and Political Participation in the Washington DC-Metro Area
Woodrow Wilson CenterNovember 1, 2007
METROPOLITAN POLICY PROGRAM
Suburban residence
Global origins
A very fast-growing immigrant population
Washington DC’s foreign-born population is characterized by:
METROPOLITAN POLICY PROGRAM
New York
Los Angeles
Miami-Fort Lauderdale
Chicago
San Francisco-Oakland
Houston
Washington
Dallas-Fort Worth
Riverside-San Bernardino
Boston
27.9 5,117,290
34.7 4,407,353
36.5 1,949,629
17.5 1,625,649
29.5 1,201,209
21.4 1,113,875
19.9 1,017,432
17.7 1,016,221
21.6 827,584
16.0 684,165
%FB Millions
Metropolitan Washington ranks 7th in number of foreign-born residents
Source: US Census Bureau, ACS 2005
METROPOLITAN POLICY PROGRAM
Washington DC’s foreign-born population, 2006
Rank Country Estimate Percent
Total Foreign Born 1,063,033 100.0
1 El Salvador 133,191 12.5
2 India 62,311 5.9
3 Korea 58,934 5.5
4 Mexico 43,633 4.1
5 Vietnam 43,215 4.1
6 Philippines 40,517 3.8
7 China 40,422 3.8
8 Guatemala 33,843 3.2
9 Bolivia 32,344 3.0
10 Ethiopia 27,703 2.6
11 Peru 27,676 2.6
12 Other Western Africa 25,270 2.4
13 Honduras 22,763 2.1
14 Iran 20,443 1.9
15 Nigeria 20,277 1.9
Source: US Census Bureau, ACS 2006
METROPOLITAN POLICY PROGRAM
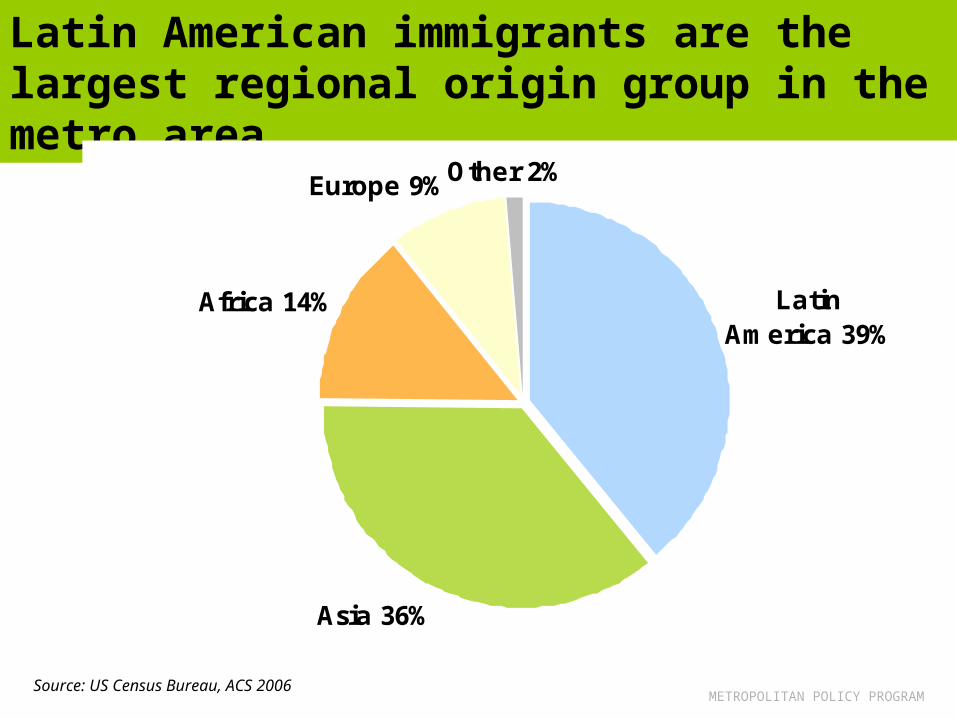
Latin American immigrants are the largest regional origin group in the metro area
Other 2%Europe 9%
Africa 14%
Asia 36%
Latin America 39%
Source: US Census Bureau, ACS 2006
METROPOLITAN POLICY PROGRAM
In 1980, birth countries were primarily South American and Caribbean
Latin American Immigrants, 1980
12%
8%
6%
6%
6%
5%5%5%5%
4%
38%
Jamaica
Cuba
El Salvador
Colombia
Trinidad & Tobago
Argentina
Chile
Peru
Ecuador
Guyana
Other LAC
Source: 1980 Census
METROPOLITAN POLICY PROGRAM
By 2006, most were from Central America
Latin American Immigrants, 2006
32%
10%
8%8%
7%
5%
4%
3%
3%
2%
18% El Salvador
Mexico
Guatemala
Bolivia
Peru
Honduras
Jamaica
Trinidad and Tobago
Colombia
Brazil
Other LAC
Source: US Census Bureau, ACS 2006
METROPOLITAN POLICY PROGRAM
Washington’s Latin American population has grown by 600 percent in 25 years, twice as fast as the total immigrant pop
Source: US Census Bureau, ACS 2006
Latin American Immigrants in the Washington Metropolitan Area, 1980-2006
0
50,000
100,000
150,000
200,000
250,000
300,000
350,000
400,000
450,000
19801980 1990 2000 2006xxxx
59,823
161,663
319,903
417,885
METROPOLITAN POLICY PROGRAM
2000 or later34%
1990-199931%
1980-198923%
Before 198012%
One-third of all Latin American immigrants in Washington arrived in the United States since 2000
Source: US Census Bureau, ACS 2006
Period of Entry to the United States, Latin American Immigrants, 2006
METROPOLITAN POLICY PROGRAM
Source: US Census Bureau
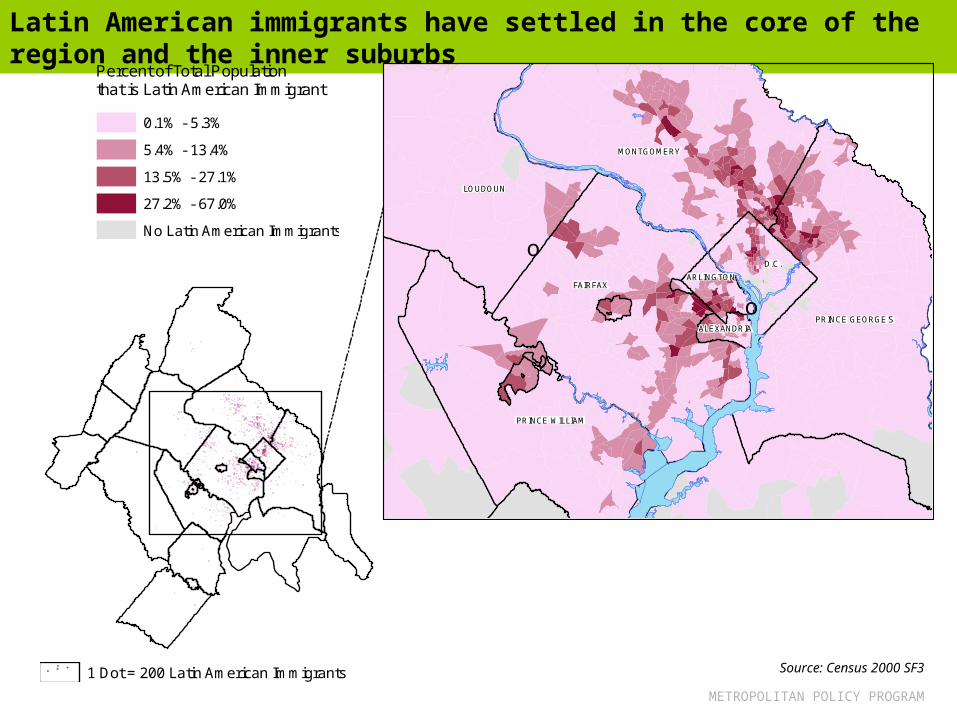
Latin American immigrants have settled in the core of the region and the inner suburbs
o
o
LOUDOUN
FAIRFAX
MONTGOMERY
PRINCE GEORGE'S
PRINCE WILLIAM
D.C.
ARLINGTON
ALEXANDRIA
Percent of Total Population that is Latin American Immigrant
0.1% - 5.3%
5.4% - 13.4%
13.5% - 27.1%
27.2% - 67.0%
No Latin American Immigrants
1 Dot = 200 Latin American Immigrants Source: Census 2000 SF3
METROPOLITAN POLICY PROGRAM
Sources: 1980, 1990 and 2000 censuses; 2006 ACS
Recently however, the suburbs continue to attract Latin American immigrants, the inner core’s population began to decline after 2000
0
10
20
30
40
50
60
70
80
90
100
District of
Columbia
Arlington
County, VA
Alexandria
city, VA
Montgomery
County, MD
Prince
George's
County, MD
Fairfax County,
VA*
Loudoun
County, VA
Prince William
County, VA**
1980 1990 2000 2006
Number of Latin American Immigrants in Washington Area Jurisdictions, 1980-2006
METROPOLITAN POLICY PROGRAM
Latin Americans are now the majority of immigrants in Prince William and Prince George’s Counties
0
10
20
30
40
50
60
1980 1990 2000 2006
Per
cent
Lat
in A
mer
ican
District of Columbia Montgomery County, MD Arlington County, VA Prince George's County, MD Fairfax County, VA* Loudoun County, VA Prince William County, VA**
Sources: 1980, 1990 and 2000 censuses; 2006 ACS
Percent of Foreign-born Population that was born in Latin America, 1980-2006
METROPOLITAN POLICY PROGRAM
Washington’s Latin American immigrants differ greatly from the total population along demographic lines
Source: US Census Bureau, ACS 2006
Age Latin American
Immigrants Total
Population <18 years 7.7 24.6 18-64 years 86.5 65.7 65+ years 5.9 9.6 Sex Ratio, 18-64
Educational Attainment Less than high school 37.5 10.4 High school graduate 24.9 20.7 Some college/AA degree 18.2 22.4 Bachelor's degree/higher 19.4 46.4
Limited English Proficient 66.7 43.4
METROPOLITAN POLICY PROGRAM
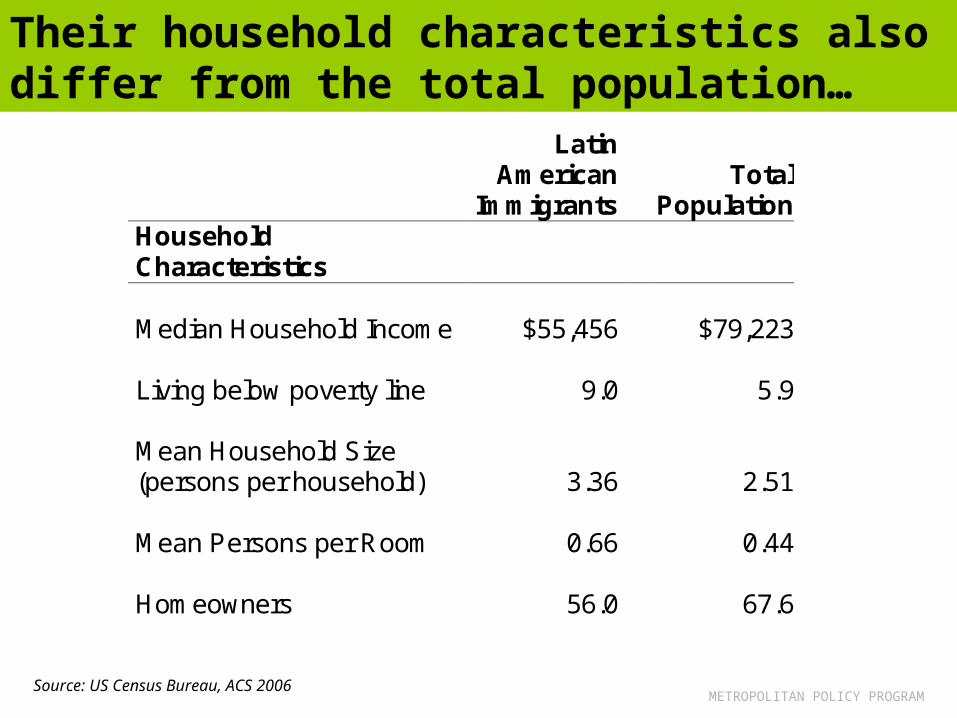
Their household characteristics also differ from the total population…
Source: US Census Bureau, ACS 2006
Latin American
Immigrants Total
Population Household Characteristics Median Household Income $55,456 $79,223 Living below poverty line 9.0 5.9 Mean Household Size (persons per household) 3.36 2.51 Mean Persons per Room 0.66 0.44 Homeowners 56.0 67.6
METROPOLITAN POLICY PROGRAM
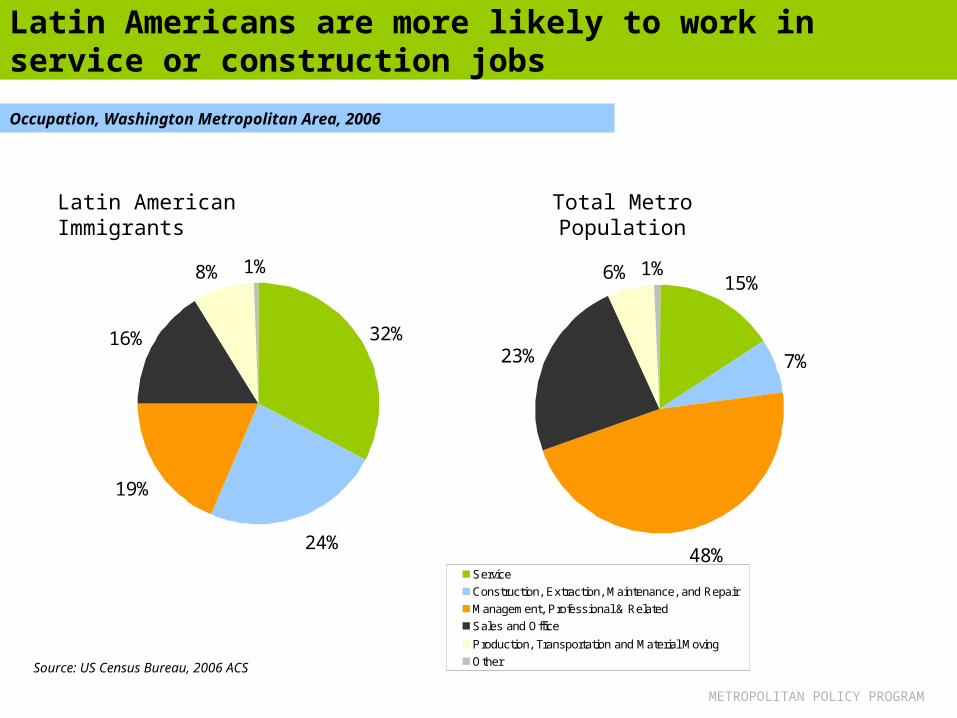
…as do their labor market characteristics
Source: US Census Bureau, ACS 2006
Employment Status
Latin American
Immigrants Total
Population Total, in the labor force 100.0 100.0 Employed 95.4 95.4 Unemployed 4.6 4.6 Not in the labor force 20.2 21.5
METROPOLITAN POLICY PROGRAM
Latin Americans are more likely to work in service or construction jobs