27
MeVis Medical Soluons AG, Bremen Interim Report H1/2011

MeVis Medical Solutions AG, BremenInterim Report H1/2011

MeVis Medical Solutions AG, Bremen Interim Report H1/2011
Consolidated key figures (IFRS)
FIGURES IN € k Jan. 1 – Jun. 30
2011Jan. 1 – Jun. 30
2010 Change
Revenues 6,688 7,321 ‐9%
of which segment1 Digital Mammography 5,191 5,356 ‐3%Other Diagnostic 1,497 1,965 ‐24%
of which billing currency1,2 Euro 1,201 1,064 13% US‐Dollar 5,487 6,257 ‐12%
EBITDA 1,965 1,924 2%
EBITDA margin 29.4% 26.3% n.a.
EBIT 181 150 21%
EBIT margin 3% 2% n.a.
Net financial result ‐617 ‐363 ‐70%
EBT ‐435 ‐213 ‐105%
Consolidated net profit ‐1,172 ‐652 ‐80%
Earnings per share in € (basic and diluted) ‐0.68 ‐0.38 ‐78%
Jun. 30, 2011 Dec. 31, 2010 ChangeEquity capital 23,577 24,789 ‐5%
Intangible assets 21,591 22,001 ‐2%
Non‐current and current liabilities 14,118 13,996 1%
Balance sheet total 37,695 38,785 ‐3%
Equity ratio in % 63% 64% n.a.
Liquid Funds3 9,540 8,162 17%
Employees4 150 169 ‐11%1 Not comprising intersegment revenues. 2 Revenues are allocated to the currency according to the location of the customer; comprising indirect sales via industry partners as well
as sales to clinical end customers in the segment Distant Services. Revenues generated by MeVis Japan KK are invoiced in Euro. 3 Comprising cash, cash equivalents and securities available for sale. 4 Full‐time equivalents as of Jun. 30
Key share date as at June 30, 2011
Industry sector Software / Medical Technology Subscribed capital € 1,820,000.00 No. of shares 1,820,000 Last quotation on Dec. 31, 2010 € 13.80 Last quotation on Jun. 30, 2011 € 7.40 High/low 2011 € 15.80 / € 7.40 Market capitalization € 12.746 Mio. Treasury stock 97,553 Free float 13.4% Prime Standard (Regulated Market) Frankfurt and Xetra Over‐the‐counter markets Frankfurt, Berlin, Dusseldorf, Munich, Stuttgart Indices CDAX, PrimeAS, TechnologyAS, DAXsector
Software, DAXsubsector Software, GEX ISIN / WKN / Ticker symbol DE000A0LBFE4 / A0LBFE / M3V
2 | P a g e

MeVis Medical Solutions AG, Bremen Interim Report H1/2011
Content
Letter to the shareholders .................................................... 4
MeVis Stock .......................................................................... 7
Business activities of the MeVis Group................................. 8
Interim management report of the MeVis Group .............. 10
Interim consolidated financial statement for H1 2011 ....... 13
Consolidated income statement H1 2011 .......................... 14
Consolidated statement of comprehensive income ........... 14
Consolidated income statement Q2 2011 .......................... 15
Consolidated statement of comprehensive income ........... 15
Consolidated statement of financial positions ................... 16
Consolidated cash flow statement ..................................... 17
Statement of changes in equity .......................................... 18
Responsibility Statement („Bilanzeid“) ............................... 25
Disclaimer ........................................................................... 26
3 | P a g e

MeVis Medical Solutions AG, Bremen Interim Report H1/2011
Letter to the shareholders
Dear Shareholders, Customers, Business Associates and Employees,
In the second quarter, consolidated sales were down by 18% year over year and amounted to € 3.0 m, falling back to the levels seen in the second quarter of 2009. The composition of consolidated sales continued to change in favor of the maintenance business. While developments in this segment were once again dynamic, with an 18% sales increase to € 1,348 k (previous year: € 1,146 k), licensing sales saw a disproportionate decrease, falling by 26% to € 1,520 k (previous year: € 2,062 k). This led to a total decline in sales for the first half of the year of 9%, meaning sales were down to € 6.7 m.
To the contrary, a study conducted by the sector association SPECTARIS and published in August has reported that in the first half of the current year, the economic environment of the German medical technology sector showed itself to be favorable overall, with an increase in sales of approximately 10%. This positive situation is primarily attributable to the high export quota, whereas business in Germany fell short of expectations. These figures indicate that the financial crisis experienced in 2009 is no longer impacting on the medical technology sector. We have seen the highest rates of growth in German medical technology exports to China (35%), the US (18%) and Russia (16%).
New business at our company has declined significantly in the last quarter, a trend also observable in comparison to the preceding four quarters. We attribute this reduction primarily to increasing market saturation in our core business, software applications for digital mammography on the vital US sales market, which we have been conducting successfully for a long period of time together with our industry partner Hologic, Inc. At the current point in time, 78% (previous year: 65%) of clinical institutions approved by the U.S. Food and Drug Administration (FDA) have replaced their film‐based systems with digital mammography equipment. We were unable to compensate this anticipated decrease in business with our planned new business in the Other Diagnostics segment.
An increased proportion of revenue coming from maintenance minimized the decline of business in the Digital Mammography segment in the first half of the current year, limiting it to 3% (down to € 5,191 k, previous year: € 5,356 k). Here, maintenance revenue amounted to 49% (previous year: 35%) of sales in the segment. At the Group level, maintenance revenue rose to 43% in the first quarter (previous year: 30%). In addition to this, business with our industry partner Siemens, which we conduct in our joint venture MeVis BreastCare, developed pleasingly in the second quarter of the current year. The primary drivers of this notable rate of growth were the increase in license sales for our software application for automatic full‐field ultrasound breast scanner ACUSON S2000™ (ABVS) and for digital mammography and tomosynthesis (MammoReport), as well as – to a lesser extent – our breast MRI software application syngo BreVis™.
The development of business with the new products in the Other Diagnostics segment continued to disappoint. Nevertheless, the decline in sales we have seen in this segment, by 24% to € 1,497 k (previous year: € 1,965 k), is overwhelmingly attributable to a further slowdown in business in the breast MRI segment (DynaCAD® Breast), which we conduct, focusing primarily on the US sales market, with our industry partner Invivo Corp. Business with the software applications introduced in 2009 in the neurology (DynaSuite Neuro) and prostate (DynaCAD® Prostate) fields, on the other hand, maintained their previous levels. The company’s lung product, Visia™ CT‐Lung System, once again did not generate any significant sales in the past quarter. The results of the long‐term US study NLST (National Lung Screening Trial), published in June, demonstrated the clear superiority of CT technology over traditional X‐ray methods; the specifically defined test group whose members received regular, specific CT investigations (low‐dose spiral CT) showed a decrease of 20% in mortality rates. However, a series of follow‐up studies will be
4 | P a g e

MeVis Medical Solutions AG, Bremen Interim Report H1/2011
required to clear up unresolved issues before the technology can be used widely in clinical settings. Maintenance revenue in this segment amounted overall to 25% of segment sales (previous year: 14%).
The first half of the current year saw staff costs decrease considerably once again, by 11% to € 4,852 k (previous year: € 5,461 k); this development contributed substantially to the 2% increase in EBITDA, which rose to € 1,965 k (previous year: € 1,924 k). Other operating expenses declined only slightly, by 2%, amounting to € 1,431 k in the period under review (previous year: € 1,455 k) and showing that our cost reduction measures are continuing to have an effect.
Depreciation and amortization came in at € 1,784 k in the reporting period, almost at the level of the previous year (€ 1,774 k). The increase in amortization on previously capitalized development expenses was offset by a reduction in amortization on other acquired intangible assets as a result of the balance sheet adjustment at the end of 2010. The rate of total capitalization, that is the ratio between depreciation and amortization on capitalized development costs and newly recognized own development activities, was 0.79 in the period under review (previous year: 0.75).
Therefore, earnings before interest and taxes (EBIT), which amounted to € 181 k in the period under review, remained approximately at the previous year’s level (€ 150 k). Correspondingly, the EBIT margin, standing at approximately 3%, remained almost unchanged (previous year: 2%).
The net financial result of € ‐617 k (previous year: € ‐363 k) was influenced in the first half of the current year by the unfavorable development of the USD exchange rate. Additionally, the pro‐rata loss on our 41% equity interest in Medis Holding B.V., amounting to € ‐138 k (previous year: € ‐2 k), has also negatively impacted our financial result.
Pre‐tax earnings declined accordingly to € ‐435 k in the period under review (previous year: € ‐212 k). Taking into account much higher income tax expenses, largely defined by deferred tax expenditures with no impact on liquidity, we are posting a loss of € ‐1,172 k for the first half of 2011 (previous year: € ‐652 k). This results in earnings per share of € ‐0.68 (previous year: € ‐0.38). Deferred taxes are mainly the result of the strategic acquisition of shares in MeVis BreastCare Solutions held by Siemens and the capitalization of development expenses. Cash and cash equivalents totaled € 9,540 k at the end of the first half of the current year (31 December 2010: € 8,162 k).
In contrast to the development of our sales figures, the worldwide development of the individual market segments in which we are active is proving positive overall, albeit with variations from segment to segment. A study conducted by the market research institute MarketsandMarkets and published in July 2011 recorded global market volume for the diagnostic imaging market as standing at USD 20.7 billion. MarketsandMarkets anticipates that growth in the sector in the next five years will show an annual rate of 4.2% (CAGR), taking the market volume to USD 26.6 billion by 2016. The study further found that America continued to dominate the global market in 2010, with a share of 36.3%, followed by Europe (27.3%), Asia (27%) and the rest of the world (9.4%).
A study by GBI Research, also published in July, expects global market volume to have reached USD 24.4 billion by 2016, anticipating annual growth of 6% to be largely driven by the developing economies of Brazil, India and China.
A further study appearing in July, conducted by iData Research, predicts that the European market for digital mammography, which is currently dominated by GE Healthcare, Siemens and Hologic, will experience growth in double figures in the period until 2017. The study names the continued introduction of national screening programs and the new 3D tomosynthesis technology as the anticipated key drivers of this growth.
The “Medical Imaging Markets” study, published in May 2011 by TriMark Publications, predicts that the primary drivers of growth in the segment of software for medical imaging will lie in the development of new, advanced solutions for a more rapid rate of image recording and editing per patient (known as workflow optimization) and in the improvement of existing devices’ image accuracy in order to provide a
5 | P a g e
MeVis Medical Solutions AG, Bremen Interim Report H1/2011
method of image quality optimization that is relatively inexpensive compared to the purchase of newer, better‐performing devices.
Additionally, we are currently observing an increase in activities carried out by large players on the markets of Asian and eastern European countries. It is in the same context that we note the recent trend towards strategic acquisitions and cooperations, which is a phenomenon typical of maturing markets and which has given rise to repositioning on the part of some players in these markets. For example, Hologic, Inc., our most important industry partner, acquired TCT International Co Ltd. in June, a move which provided it with strategically significant access to the Chinese mammography market. Moreover, also in June, the Swedish IT company Sectra entered the Russian market by means of commencing cooperation with the distributor McBrothers. At the end of June, it was announced that Philips Healthcare had taken over Sectra’s mammography business, which is centralized in Sectra Mamea AB. Both parties have indicated that they intend to continue cooperating closely. Our industry partner Vital Images, Inc. was taken over by Toshiba Medical Systems in April; In July, Agfa HealthCare, a Belgian company producing picture archiving and communication systems (PACS), announced it is cooperating with TeraRecon, Inc., a California‐based manufacturer of advanced visualization solutions for diagnostic imaging.
In the light of the market growth described above, in which our participation has been limited, and the rapid rate of change in the customer and competitive landscape with its multiplicity of M&A activities, we have embarked on a review of our strategy. This review of our business activities and their alignment with changing market conditions will be concluded by the end of the year and include reassessments of our product portfolio, our platform software activities and the question of our participation in the cardiovascular imaging segment. We will work closely with our Supervisory Board throughout. In this context, we will additionally take a decision on the acquisition of the remaining shares in Medis Holding B.V., in which our stake currently amounts to approx. 41%. Our strategic review, depending on its results, may entail structural and organizational changes for MeVis Group.
Our search for a strategic partner, throughout which we have enlisted the support of an external firm since the beginning of 2011, will continue in parallel to our strategic review.
In the light of business developments to date, we are confirming our forecast published in the 2010 consolidated annual report. We expect a slight reduction in consolidated sales for the current financial year, based on the decrease in the new licensing business at the Group level. Consolidated earnings before interest and earnings (EBIT) should be slightly positive on account of ongoing cost savings.
At this point, we would like to thank all employees for their exceptional performance as well as our business associates, customers and shareholders for their confidence!
Carl J.G. Evertsz, Ph.D. Robert Hannemann, Ph.D. Thomas E. Tynes
Chairman & CEO Member of the Executive Board Member of the Executive Board
6 | P a g e

MeVis Medical Solutions AG, Bremen Interim Report H1/2011
MeVis Stock
Price trend of MeVis stock
In the second quarter of 2011, MeVis stock was trading at a median price level of € 9, lower than in the first quarter of 2011 (€ 12). While an annual high of € 15.80 was temporarily registered at the end of January, the stock was trading at € 7.40 at the end of the second quarter. For the quarter as a whole, the share price performance was once again down significantly at ‐27% (compared with 5% for the SDAX and ‐5% for the TecDAX). Even in light of general capital market trends in the medical technology sector (DAXsubsector MedTech 7%), the performance of the MeVis stock was markedly disproportionately low in the second quarter of 2011.
Development of the shareholder structure
The shareholder structure essentially remained unchanged in the course of the second quarter of 2011. As in the past, the three founders accounted for approximately 55% of the share capital. The number of treasury shares amounted to 97,553 in the second quarter (5.36% of share capital), while the shareholder base remained nearly unchanged compared to the 2010 year end. Compared to the middle of 2010, the number of custodian accounts held decreased by approximately 6%. The average daily trading volume fell to approximately € 3,000 in the second quarter of 2011 (second quarter of 2010: approximately € 22,500).
Evertsz19.5%
Peitgen19.5%
Juergens16.5%
Kuhlmann‐Lehmkuhle
3.0%
Fortelus 10.0%
Warburg 9.1%
Allianz 3.6%
Treasury stock 5.4%
Other Freefloat13.4%
Fig.: Shareholder structure as at June 30, 2011
7 | P a g e
MeVis Medical Solutions AG, Bremen Interim Report H1/2011
Business activities of the MeVis Group
Group structure
Through a joint venture with Siemens Aktiengesellschaft, Berlin and Munich (hereafter: “Siemens”), MeVis Medical Solutions AG (hereafter: “MMS AG”) holds 51% of MeVis BreastCare GmbH & Co. KG (hereafter: “MBC KG”). Under an agreement of October 21, 2008, the business division comprising industry customer Hologic, Inc., Bedford, USA (hereafter: “Hologic”) was carved out of the joint venture and Siemens’ stake was taken over by MMS AG. The company MeVis BreastCare Solutions GmbH & Co. KG (hereafter: “MBS KG”) arising from this spin‐off has been fully included in the consolidated financial statements of MMS AG since November 1, 2008.
In addition, in 2007, MMS AG founded a wholly owned subsidiary in the USA, MeVis Medical Solutions, Inc., located in Pewaukee, Wisconsin (hereafter: “MMS Inc.”). The company MeVis Research GmbH, treated as an associate until December 31, 2007, has not been included in the consolidated financial statements since June 30, 2008. The shares held were returned to the Free Hanseatic City of Bremen at their book value. As a result, MeVis Research was incorporated in the Fraunhofer‐Gesellschaft effective January 1, 2009 and is now trading as Fraunhofer MEVIS ‐ Institute for Medical Image Computing MEVIS (hereafter: “Fraunhofer MEVIS”).
Business activities of the wholly owned subsidiary MeVis Japan K.K., which was founded in Tokyo at the end of 2009 and commenced business on January 1, 2010, have been suspended in the meantime.
MMS AG has held around 41% of the stock in Medis Holding B.V., Leiden (Netherlands) since the beginning of June 2010. The pro‐rata earnings of this equity interest are reported in the net financial result.
Brief overview of business activities
The MeVis Group develops, produces and markets innovative software applications for computer‐assisted medical imaging.
The specialized software applications from the MeVis Group help medical practitioners to analyze diverse image data produced by a variety of imaging modalities used in diagnosis and therapy. Our clinical orientation is governed by epidemiologically important diseases. Our primary focus is on image‐based early detection and diagnosis of breast cancer, which involves the provision of support for surgical interventions and biopsies as well.
With a worldwide incidence of 1.3 million, breast cancer is the most common tumor disease. In Germany and Europe, breast cancer accounts for almost 30 percent of all cancers.
Building on existing expertise, software applications are adapted for use in other oncological disorders, such as disorders of the lungs, liver and brain, as well as cardiovascular diseases. The software solutions support all the imaging modalities available. These not only include X‐ray modalities such as computed tomography, digital mammography and tomosynthesis, but also magnetic resonance imaging and digital sonography. Then there are the more modern imaging modalities, such as positron emission tomography (PET), sonoelastography and molecular imaging. Such systems are used predominantly by radiologists, gynecologists, surgeons, cardiologists and medical technicians.
8 | P a g e

MeVis Medical Solutions AG, Bremen Interim Report H1/2011
Business segments
For reporting purposes and internal governance, the MeVis Group has two operating segments (“Digital Mammography” and “Other Diagnostics”).
The Digital Mammography segment develops and markets software products which support breast diagnostic imaging and intervention. Aside from the original products for digital mammography, the 2009 financial year saw the arrival of new software applications for other imaging modalities such as ultrasound, magnetic resonance imaging and tomosynthesis. These products are distributed to radiological and clinical end customers via the OEMs Siemens and Hologic. The Digital Mammography segment includes the joint venture MBC KG, operated in conjunction with Siemens AG, which was consolidated at 51% and, since November 1, 2008, the wholly‐owned subsidiary MBS KG, which encompasses the business with Hologic, Inc. and had also been part of MBC KG before then.
In addition to the business of breast diagnostics by means of magnetic resonance imaging conducted with Invivo, Corp., the Other Diagnostics segment also includes digital radiology products (e.g. magnetic resonance imaging (MRI), computed tomography (CT) etc.) for other types of diseases such as lung, prostate and intestinal disorders as well as the general image‐based analysis and diagnostics of radiology images. Other main activities in this segment include image and risk analysis for planning liver surgery and tumor diagnostics in connection with clinical studies of pharmaceutical companies (Distant Services business segment). The Other Diagnostics segment includes the parent company MMS AG as well as the wholly‐owned subsidiaries MMS Inc. and MeVis Japan K.K.
9 | P a g e

MeVis Medical Solutions AG, Bremen Interim Report H1/2011
Interim management report of the MeVis Group
Results of operations
Consolidated sales of € 2,970 k in the 1st quarter were down approximately 18% from the level of the previous year (€ 3,603 k) and fell below the € 3 million mark for the first time since the 2nd quarter of 2009, which marked the peak of the global economic crisis for the MeVis Group. In addition, the sales structure had changed significantly compared to the 1st quarter of 2010. While developments in the maintenance business were once again positive with growth of 18% to € 1,348 k (previous year: € 1,146 k), the new license business dropped by an additional 26% to € 1,520 k (previous year: € 2,062 k). The trend established in previous quarters therefore continued. Key factors in this development were the increasing market saturation in digital mammography in the USA, which has reached 78% in the meantime (previous year: 65%). As a result of the rising number of cooperations and mergers of market participants, the market positions of device and components manufacturers on the world market are shifting. This development impacts in particular our business for breast MRI on the US sales market, which we operate together with our industry partner Invivo Corp. and is disclosed in the Other Diagnostics segment.
In the reporting period, consolidated sales fell by a total of 9% compared to the previous year to € 6,688 k (previous year: € 7,321 k). This is broken down into the segments of Digital Mammography at € 5,191 k (previous year: € 5,356 k) and Other Diagnostics at € 1,497 k (previous year: € 1,964 k). With 78% (previous year: 73%) the Digital Mammography segment continues to be the main source of revenues.
The increase of the installed base of software licenses in the past once again led to higher maintenance and service revenue. In the first half of 2011, the share of consolidated sales revenue accounted for by maintenance and service increased to 43% (previous year: 30%).
Staff costs fell by a significant 11% to € 4,852 k (previous year: € 5,461 k) on account of a smaller workforce. At the end of the 2nd quarter of 2011, the MeVis Group had 192 employees. This corresponds to 150 full‐time equivalents (December 31, 2010: 215 employees or 169 full‐time equivalents).
The capitalized development costs, which are attributable to the staff costs, increased by 9% to € 1,309 k in the period under review (previous year: € 1,202 k), while in the previous year, additionally costs of services purchased in the amount of € 121 k were capitalized.
Other operating expenses fell slightly against the first half of 2010 and amounted to € 1,431 k in the period under review (previous year: € 1,455 k). This amount mainly breaks down into rental expenses/leasing of € 285 k (previous year: € 304 k), legal and consultancy costs of € 248 k (previous year: € 162 k), the cost of preparing and auditing financial statements of € 78 k (previous year: € 87 k), travel expenses of € 73 k (previous year: € 87 k), energy costs of € 69 k (previous year: € 36 k) and maintenance and repair costs of € 64 k (previous year: € 77 k).
EBITDA (earnings before interest, taxes, depreciation and amortization) totaled € 1,965 k in the period under review (previous year: € 1,924 k). The EBITDA margin increased accordingly to 29% (previous year: 26%).
Depreciation and amortization amounted to € 1,784 k in the reporting period, almost at the level of the previous year (previous year: € 1,774 k). This comprised amortization of intangible assets amounting to € 519 k (previous year: € 636 k), amortization on capitalized development expenses of € 1,037 k (previous year: € 905 k) as well as depreciation of property, plant and equipment amounting to € 228 k (previous year: € 233). The increase in amortization on capitalized development expenses is attributable to the market rollout of new products in the 2010 financial year.
10 | P a g e

MeVis Medical Solutions AG, Bremen Interim Report H1/2011
Earnings before interest and taxes (EBIT) also increased correspondingly to € 181 k (previous year: € 150 k). Therefore the EBIT margin remained almost unchanged in the period under review at 3% (previous year: 2%).
On the one hand, the financial result of € ‐617 k (previous year: € ‐363 k) fell against the level for the previous year due to the development of the USD exchange rate, which negatively impacted currency translation gains net of currency translation losses of € ‐360 k (previous year: € 486 k). This effect reduced the other financial result to € ‐333 k (previous year: € ‐209 k) and could not be offset by increases in the market value of derivative financial instruments. On the other hand, Medis Holding B.V.’s net income from investments of € ‐138 k (previous year: € ‐2 k) negatively affected the financial result. Medis Holding B.V. holds a 41% stake in MMS AG. In addition, interest income fell in the year under review, coming to € 48 k (previous year: € 248 k). Interest expenses decreased to € 194 k (previous year: € 400 k), which is mainly due to the interest payable, at matching maturities, on the remaining purchase price installments for the acquisition of the 49% stake in MBS KG.
Earnings before taxes (EBT) amounted to € ‐436 k in the period under review (previous year: € ‐213 k). This corresponds to a return on sales before tax of ‐6.5% (previous year: ‐3%).
After‐tax earnings are impacted by a significant rise in tax expenses and the deferred tax expenses of € 736 k reported here (previous year: € 439 k), amounting to € ‐1,172 k in the first half of 2011 (previous year: € ‐652 k). This resulted in earnings per share of € ‐0.68 in the period under review (previous year: € ‐0.38).
Assets, liabilities and financial position
As of the balance sheet date, cash and cash equivalents in the MeVis Group totaled € 9,540 k (December 31, 2010: € 8,162 k), comprising cash and cash equivalents and securities held for sale.
The balance sheet structure remained almost unchanged at the end of the 2nd quarter compared with the end of the 2010 financial year. Assets fell by 3% to € 37,695 k (December 31, 2010: € 38,785 k), including € 23,599 k (December 31, 2010: € 24,207 k) in non‐current assets. The latter mainly consisted of intangible assets amounting to € 21,591 k (December 31, 2010: € 22,001 k). Current assets of € 14,096 k (December 31, 2010: € 14,578 k) mainly comprised trade receivables of € 3,126 k (December 31, 2010: € 5,139 k), other financial assets of € 2,476 k (December 31, 2010: € 2,882 k) as well as cash and cash equivalents of € 7,806 k (December 31, 2010: € 5,621 k). The other financial assets mainly consisted of fixed‐income securities available for sale at short notice in the amount of € 1,734 k (December 31, 2010: € 2,541 k).
The Group’s property, plant and equipment amounted to € 866 k at the balance sheet date (December 31, 2010: € 926 k).
Shareholders’ equity as at June 30, 2011 amounted to € 23,577 k (December 31, 2010: € 24,789 k), mainly consisting of the capital reserve at € 28,328 k (previous year: € 28,513 k). The level of subscribed capital remained unchanged at € 1,820 k. The equity ratio remained almost unchanged compared to the end of the previous year at 63% (December 31, 2010: 64%).
Cash flow from current operating activities came to € 3,091 k (previous year: € 3,220 k). It essentially comprises earnings before interest and taxes (EBIT) of € 181 k (previous year: € 150 k), adjusted for depreciation and amortization of € 1,784 k (previous year: € 1,774 k), other non‐cash expenses/income of € ‐421 k (previous year: € 305 k), interest received of € 107 k (previous year: € 220 k), taxes paid of € 155 k (previous year: € 468 k), exchange rate differences received and paid of € 79 k (previous year: € ‐262 k), changes in trade receivables and other assets of € 1,923 k (previous year: € 277 k) and changes in trade payables and other liabilities of € ‐760 k (previous year: € 1,138 k).
In the period under review, cash flow from investing activities came to € ‐704 k (previous year: € ‐3,015 k) and mainly consisted of payments for intangible assets of € 195 k (previous year: € 303 k), payments for
11 | P a g e

MeVis Medical Solutions AG, Bremen Interim Report H1/2011
capitalized development costs of 1,309 k (previous year: € 1,323), and also payments for the disposal of securities in the amount of € 800 k (previous year: € 578 k).
Cash flow from financing activities was € 0 k (previous year: € ‐401 k).
Change in cash and cash equivalents in the year under review came to € 2,387 k (previous year: € ‐197 k).
Risk report
No material changes have occurred with regard to the risk situation of the MeVis Group since the beginning of the financial year. Therefore, the statements made in the risk report of the consolidated annual financial statements as of December 31, 2010 remain valid.
If the sales dynamic for new licenses for individual products were to continue to worsen in the second half of the year, this could result in particular in unscheduled amortization on capitalized development expenses, impairment of goodwill based on negative impairment test results, to write‐downs on deferred tax assets. These one‐time effects that do not have an effect on liquidity could significantly impact the company’s and the Group’s earnings.
Outlook & Opportunities
We hereby confirm the outlook published in the 2010 consolidated financial statements.
Based on the decrease in the new licensing business at the group level in the 2010 financial year, we expect another slight reduction in consolidated sales for the current financial year. The digital mammography business segment will remain the main sales driver, comprising around 75% to 80% of total revenue. Consolidated earnings before interest and earnings (EBIT) should be slightly positive on account of the ongoing savings regarding personnel and material costs. Income from the highly profitable Digital Mammography segment will again offset the significant deficits in the Other Diagnostics segment in 2011. Group liquidity of € 9.5 m on the balance sheet date will continue to fall as planned in 2011, due to the payment obligations of up to € 3.5 m that will come due on the strategic acquisition of the 49% interest in MBS KG.
We will review our expectations in the course of the financial year, taking into account the exchange rate trend for the US dollar in which approximately 80% of our sales are invoiced, in order to issue more specific forecasts.
Material events occurring after the balance sheet date
No transactions of material relevance to the MeVis Group have arisen since the balance sheet date.
Bremen, August 29, 2011
Carl J.G. Evertsz, Ph.D. Robert Hannemann, Ph.D. Thomas E. Tynes
Chairman & CEO Member of the Executive Board Member of the Executive Board
12 | P a g e
MeVis Medical Solutions AG, Bremen Interim Report H1/2011
MeVis Medical Solutions AG, Bremen
Interim consolidated financial statement for H1 2011
Consolidated income statement H1 2011 .......................... 14
Consolidated statement of comprehensive income ........... 14
Consolidated income statement Q2 2011 .......................... 15
Consolidated statement of comprehensive income ........... 15
Consolidated statement of financial positions ................... 16
Consolidated cash flow statement ..................................... 17
Statement of changes in equity .......................................... 18
13 | P a g e

MeVis Medical Solutions AG, Bremen Interim Report H1/2011
Consolidated income statement H1 2011
for the period January 1 through June 30, 2011
FIGURES IN € k NotesJan. 1 – Jun. 30
2011 Jan. 1 – Jun. 30
2010
Revenues 1 6,688 7,321
Income from the capitalization of development expenses 2 1,309 1,202
Other operating income 359 597
Cost of material ‐108 ‐280
Staff costs 3 ‐4,852 ‐5,461
Other operating expenses 4 ‐1,431 ‐1,455Earnings before interest, taxes, depreciation and amortization (EBITDA) 1,965 1,924
Depreciation and Amortization 5 ‐1,784 ‐1,774
Earnings before interest and tax (EBIT) 181 150
Interest income 48 248
Interest expenses ‐194 ‐400
Other net financial result ‐333 ‐209
Profit share from associated companies ‐138 ‐2
Net financial result 6 ‐617 ‐363
Earnings before taxes (EBT) ‐436 ‐213
Income tax 7 ‐736 ‐439
Consolidated net result for period ‐1,172 ‐652
Earnings per share in €
Basic ‐0.68 ‐0.38
Diluted ‐0.68 ‐0.38
Consolidated statement of comprehensive income
for the period January 1 through June 30, 2011
FIGURES IN € k NotesJan. 1 – Jun. 30
2011 Jan. 1 – Jun. 30
2010
Consolidated net result for period ‐1,172 ‐652
Changes in the currency translation reserve 9 ‐97 983
Changes in fair value of available‐for‐sale financial instruments 9 6 49
Deferred tax on changes in fair value ‐2 ‐14
Other comprehensive income ‐92 1,018
Total comprehensive income ‐1,265 366
14 | P a g e
MeVis Medical Solutions AG, Bremen Interim Report H1/2011
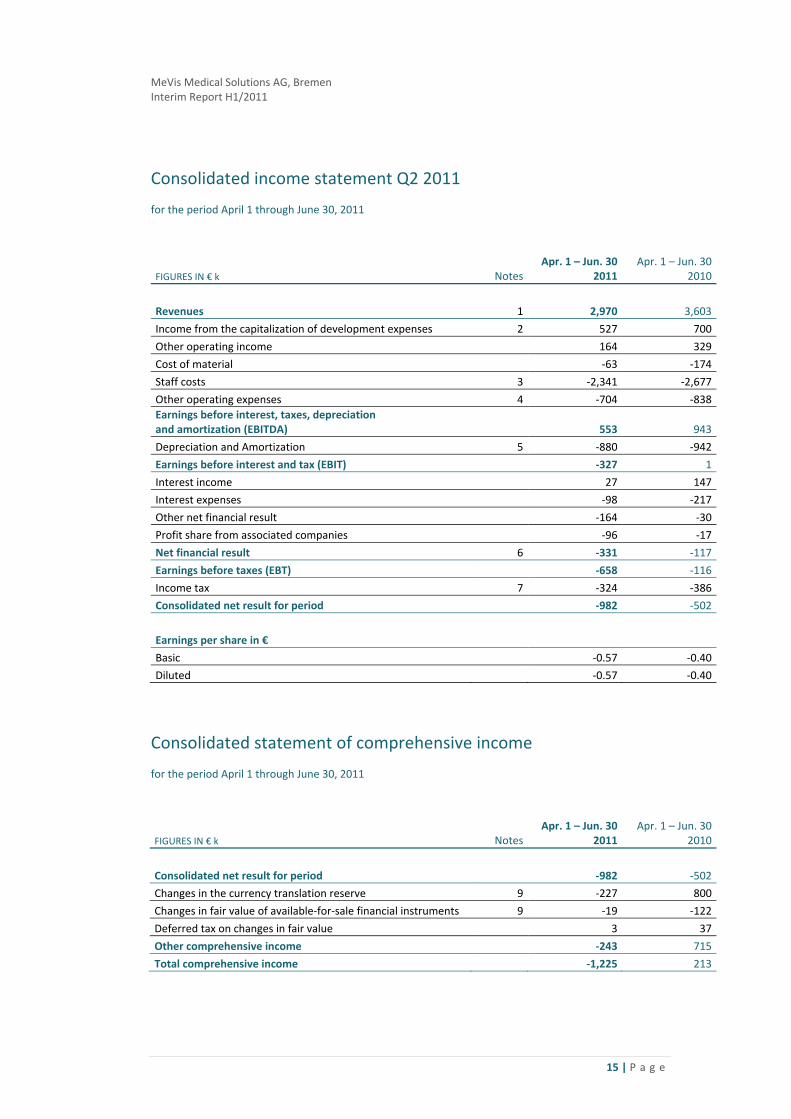
Consolidated income statement Q2 2011
for the period April 1 through June 30, 2011
FIGURES IN € k NotesApr. 1 – Jun. 30
2011 Apr. 1 – Jun. 30
2010
Revenues 1 2,970 3,603
Income from the capitalization of development expenses 2 527 700
Other operating income 164 329
Cost of material ‐63 ‐174
Staff costs 3 ‐2,341 ‐2,677
Other operating expenses 4 ‐704 ‐838Earnings before interest, taxes, depreciation and amortization (EBITDA) 553 943
Depreciation and Amortization 5 ‐880 ‐942
Earnings before interest and tax (EBIT) ‐327 1
Interest income 27 147
Interest expenses ‐98 ‐217
Other net financial result ‐164 ‐30
Profit share from associated companies ‐96 ‐17
Net financial result 6 ‐331 ‐117
Earnings before taxes (EBT) ‐658 ‐116
Income tax 7 ‐324 ‐386
Consolidated net result for period ‐982 ‐502
Earnings per share in €
Basic ‐0.57 ‐0.40
Diluted ‐0.57 ‐0.40
Consolidated statement of comprehensive income
for the period April 1 through June 30, 2011
FIGURES IN € k NotesApr. 1 – Jun. 30
2011 Apr. 1 – Jun. 30
2010
Consolidated net result for period ‐982 ‐502
Changes in the currency translation reserve 9 ‐227 800
Changes in fair value of available‐for‐sale financial instruments 9 ‐19 ‐122
Deferred tax on changes in fair value 3 37
Other comprehensive income ‐243 715
Total comprehensive income ‐1,225 213
15 | P a g e
MeVis Medical Solutions AG, Bremen Interim Report H1/2011
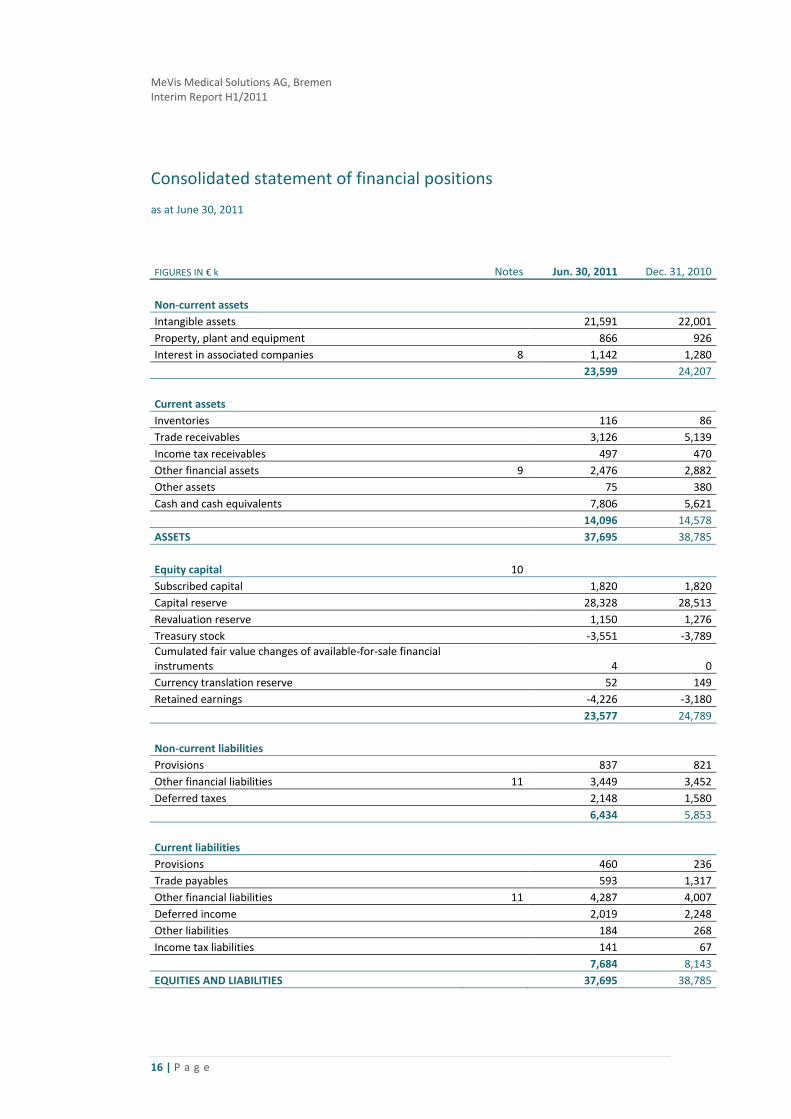
Consolidated statement of financial positions
as at June 30, 2011
FIGURES IN € k Notes Jun. 30, 2011 Dec. 31, 2010
Non‐current assets Intangible assets 21,591 22,001Property, plant and equipment 866 926Interest in associated companies 8 1,142 1,280 23,599 24,207 Current assets Inventories 116 86Trade receivables 3,126 5,139Income tax receivables 497 470Other financial assets 9 2,476 2,882Other assets 75 380Cash and cash equivalents 7,806 5,621 14,096 14,578ASSETS 37,695 38,785 Equity capital 10 Subscribed capital 1,820 1,820Capital reserve 28,328 28,513Revaluation reserve 1,150 1,276Treasury stock ‐3,551 ‐3,789Cumulated fair value changes of available‐for‐sale financial instruments 4 0Currency translation reserve 52 149Retained earnings ‐4,226 ‐3,180 23,577 24,789 Non‐current liabilities Provisions 837 821Other financial liabilities 11 3,449 3,452Deferred taxes 2,148 1,580 6,434 5,853 Current liabilities Provisions 460 236Trade payables 593 1,317Other financial liabilities 11 4,287 4,007Deferred income 2,019 2,248Other liabilities 184 268Income tax liabilities 141 67 7,684 8,143EQUITIES AND LIABILITIES 37,695 38,785
16 | P a g e
MeVis Medical Solutions AG, Bremen Interim Report H1/2011
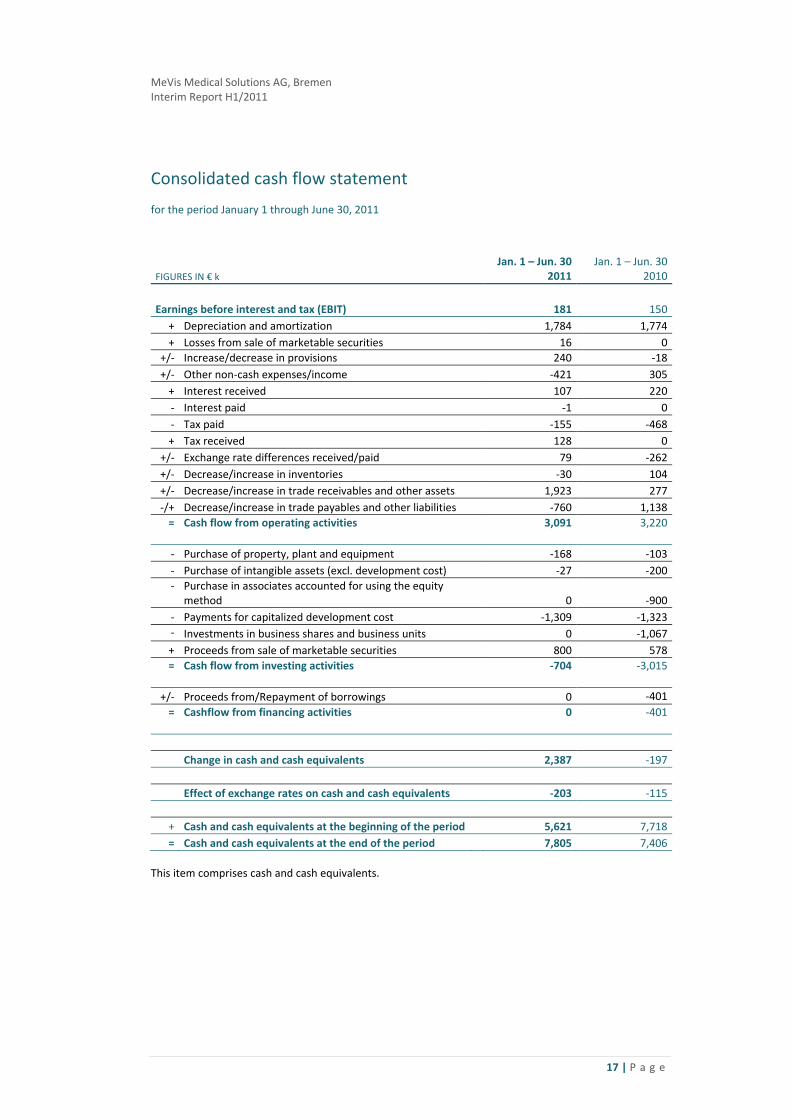
Consolidated cash flow statement
for the period January 1 through June 30, 2011
FIGURES IN € k Jan. 1 – Jun. 30
2011 Jan. 1 – Jun. 30
2010
Earnings before interest and tax (EBIT) 181 150
+ Depreciation and amortization 1,784 1,774+ Losses from sale of marketable securities 16 0
+/‐ Increase/decrease in provisions 240 ‐18 +/‐ Other non‐cash expenses/income ‐421 305 + Interest received 107 220‐ Interest paid ‐1 0‐ Tax paid ‐155 ‐468+ Tax received 128 0
+/‐ Exchange rate differences received/paid 79 ‐262+/‐ Decrease/increase in inventories ‐30 104+/‐ Decrease/increase in trade receivables and other assets 1,923 277 ‐/+ Decrease/increase in trade payables and other liabilities ‐760 1,138 = Cash flow from operating activities
3,091 3,220
‐ Purchase of property, plant and equipment ‐168 ‐103‐ Purchase of intangible assets (excl. development cost) ‐27 ‐200‐ Purchase in associates accounted for using the equity
method 0 ‐900‐ Payments for capitalized development cost ‐1,309 ‐1,323‐ Investments in business shares and business units 0 ‐1,067+ Proceeds from sale of marketable securities 800 578 = Cash flow from investing activities
‐704 ‐3,015
+/‐ Proceeds from/Repayment of borrowings 0 ‐401 = Cashflow from financing activities
0 ‐401
Change in cash and cash equivalents 2,387 ‐197 Effect of exchange rates on cash and cash equivalents ‐203 ‐115
+ Cash and cash equivalents at the beginning of the period 5,621 7,718 = Cash and cash equivalents at the end of the period 7,805 7,406
This item comprises cash and cash equivalents.
17 | P a g e

MeVis Medical Solutions AG, Bremen Interim Report H1/2011
Statement of changes in equity
for the period January 1 through June 30, 2011
FIGURES IN € k Subscribed
capital Capital reserve
Re‐valuation reserve
Treasury stock
Cumulative change in fair value for sale of available
assets
Currency trans‐lation differ‐ences
Retained earnings Total
Balance on January 1, 2010 1,820 28,465 1,506 ‐4,156 53 ‐20 4,939 32,607
Disposal of treasury stock 0 0 0 367 0 0 0 367
Transfer to retained earnings
according to amortization 0 0 ‐115 0 0 0 115 0
Stock options – change in fair value 0 31 0 0 0 0 0 31
Consolidated net profit 0 0 0 0 ‐18 983 ‐652 313
Balance on June 30, 2010 1,820 28,496 1,391 ‐3,789 35 963 4,403 33,319
Balance on January 1, 2011 1,820 28,513 1,276 ‐3,789 0 149 ‐3,180 24,789
Disposal of treasury stock 0 ‐184 0 239 0 0 0 55
Transfer to retained earnings
according to amortization 0 0 ‐126 0 0 0 126 0Stock options – change in fair value 0 0 0 0 0 0 0 0
Consolidated net profit 0 0 0 0 4 ‐97 ‐1,172 ‐1,266
Balance on June 30, 2011 1,820 28,328 1,150 ‐3,551 4 52 ‐4,226 23,577
18 | P a g e
MeVis Medical Solutions AG, Bremen Interim Report H1/2011
MeVis Medical Solutions AG, Bremen Notes to the interim consolidated financial statements as of June 30, 2011
Basic information on the group
General disclosures
The interim financial report of the MeVis Group was prepared in accordance with the provisions of § 37x (3) of the German Securities Trading Act (WpHG) along with consolidated interim financial statements and a consolidated management report.
The consolidated interim financial statements of MeVis Medical Solutions AG, Bremen (MMS AG) as at June 30, 2011 were prepared in accordance with Section 315a (1) of the German Commercial Code (HGB) in line with the rules and regulations in force on the balance sheet date and approved by the European Union of the International Financial Reporting Standards (IFRS) published by the International Accounting Standards Board (IASB) as well as the interpretations of the International Financial Reporting Interpretations Committee (IFRIC). Accordingly, this interim report as at June 30, 2011 was prepared in conformity with IAS 34 Interim Reporting. The notes to the consolidated interim financial statements are presented in abridged form in line with the option provided by IAS 34. The interim financial statements and interim management report have neither been audited nor subjected to accounting review.
Recognition and measurement methods
The interim consolidated financial statements from January 1 to June 30, 2011 use the same recognition and measurement policies as the IFRS consolidated financial statements for the 2010 financial year. The interim consolidated financial statements as of June 30, 2011 must therefore be read in conjunction with the consolidated financial statements as of December 31, 2010.
Effects of new accounting standards
MMS AG’s consolidated interim financial statements as of June 30, 2011 including the previous year’s figures have been prepared in accordance with IFRS as endorsed by the European Union as of December 31, 2010. The same accounting and valuation principles were applied that were used in preparing the consolidated financial statements as at December 31, 2010; in addition, IAS 34 “Interim reporting” was applied. Fresh announcements of the IASB newly applicable as of June 30, 2011 had no material impacts on the MeVis consolidated financial statements.
Selected notes on the consolidated balance sheet and the consolidated income statement:
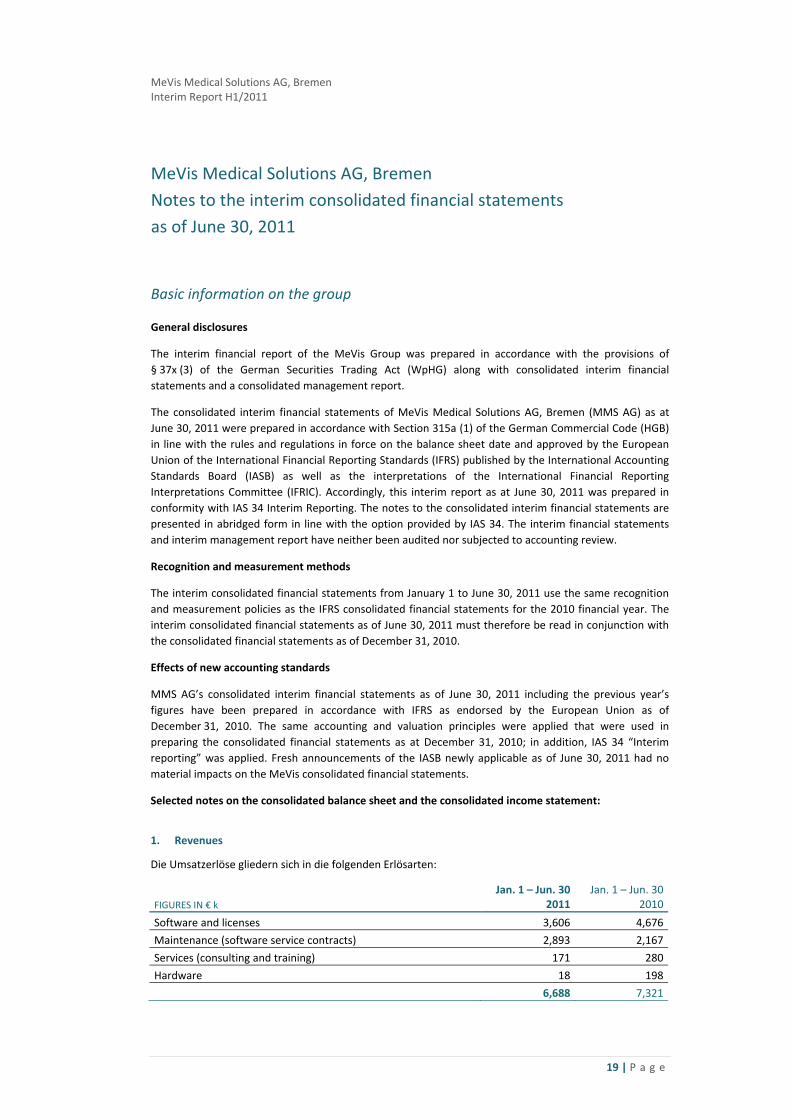
1. Revenues
Die Umsatzerlöse gliedern sich in die folgenden Erlösarten:
FIGURES IN € k Jan. 1 – Jun. 30
2011 Jan. 1 – Jun. 30
2010
Software and licenses 3,606 4,676
Maintenance (software service contracts) 2,893 2,167
Services (consulting and training) 171 280
Hardware 18 198
6,688 7,321
19 | P a g e

MeVis Medical Solutions AG, Bremen Interim Report H1/2011
2. Income from the capitalisation of development costs
In the period under review, expenditures on research and development came to € 3,186 k (June 30, 2010: € 3,346 k). In accordance with IAS 38, development expenses of € 1,309 k (June 30, 2010: € 1,323 k) were capitalized, of which € 0 (June 30, 2010: € 121 k) was accounted for by third‐party services.
3. Staff costs
The average headcount was 196 (previous year: 230). This is equivalent to an average of 154 full‐time positions (previous year: 181). Of the 196 employees, 26 (previous year: 31) are accounted for by the proportionately consolidated company MeVis BreastCare GmbH & Co. KG. The average figures include 54 testers (as a rule, students employed on a negligible part‐time basis) (previous year: 61).
4. Other operating expenses
FIGURES IN € k Jan. 1 – Jun. 30
2011 Jan. 1 – Jun. 30
2010
Rental/leasing expense 285 304
Legal and consulting costs 248 162
Cost of preparing and auditing financial statements 78 87
Travel expense 73 87
Energy costs 69 36
Maintenance/repairs 64 77
Accounting costs 57 63
Stationary 57 35
Guarantee/warranty expenses 40 30
Supervisory Board remuneration 40 46
External work 37 34
Advertising costs 33 17
Cost of annual general meeting 32 37
Internet expense 25 15
Cleaning expense 24 23
Others 269 402
1,431 1,455
5. Depreciation and amortization
FIGURES IN € k Jan. 1 – Jun. 30
2011 Jan. 1 – Jun. 30
2010
Amortization of industrial property rights and similar rights and customer bases 519 636
Amortization of capitalized development costs 1,037 905
Depreciation of property, plant and equipment 228 233
Total amortization/depreciation 1,784 1,774
6. Net financial result
The MeVis Group’s net financial result as at June 30, 2011 amounted to € ‐617 k (previous year: € ‐363 k). This comprises interest income from the investment of cash and cash equivalents of € 48 k (previous year: € 248 k), interest expense of € ‐194 k (previous year: € ‐400 k), the other financial result of € ‐333 k (previous year: € ‐209 k) and the result derived from associates, amounting to € ‐138 k (previous year: € ‐2 k). The other financial result primarily comprises the change in value of derivative financial
20 | P a g e

MeVis Medical Solutions AG, Bremen Interim Report H1/2011
instruments amounting to € 68 k (previous year: € ‐662 k) plus currency translation gains net of currency translation losses of € ‐360 k (previous year: € 486 k).
7. Income taxes
Income tax expenses were mainly the result of MBS KG’s trade tax as well as deferred tax assets and liabilities resulting from the differences between amounts included in the financial statements (for income and expenditure and assets and liabilities) and those included in the tax assessment.
8. Financial assets
Financial assets concern the equity interest of roughly 41%, valued in accordance with the equity method, in Medis Holding B.V., Leiden (Netherlands), which was acquired in the first half of 2010.
9. Other current financial assets
FIGURES IN € k Jun. 30, 2011 Dec. 31, 2010
Loans granted and receivables 257 10Derivatives 193 136Securities 1,734 2,541Deferred interest 43 102Other 249 93 2,476 2,882
Derivatives comprise forward exchange transactions and currency options, which were measured at market value with an impact on profit and loss.
These securities primarily are Pfandbrief bonds and corporate bonds.
10. Shareholders’ equity
Revaluation reserve
In connection with the acquisition of the 49% interest in MBS KG from Siemens AG and the subsequent full consolidation of MBS KG, the assets and liabilities of MBS KG were completely remeasured. Where these increases were attributable to the 51% interest in MBS KG already held by the Group, the difference was recognized within the revaluation reserve. Amounts equaling the depreciation expense recognized on these assets are reclassified as retained earnings on a proportionate basis.
FIGURES IN € k Status as at Dec. 31, 2009 1,506‐ Transfer of the amount corresponding to write‐downs and the associated deferred taxes to retained earnings, without an impact on profit and loss ‐115Status as at Jun. 30, 2010 1,391 Status as at Dec. 31, 2010 1,276‐ Transfer of the amount corresponding to write‐downs and the associated deferred taxes to retained earnings, without an impact on profit and loss ‐126Status as at Jun. 30, 2011 1,150
21 | P a g e

MeVis Medical Solutions AG, Bremen Interim Report H1/2011
Treasury stock
In accordance with a new resolution passed by the shareholders at the annual general meeting on September 28, 2007 concerning the acquisition of the Company’s own stock in accordance with Section 71 (1) No. 8 of the German Stock Corporation Act (AktG), the Company was authorized to acquire up to 10% of its current share capital (€ 1,300 k) on or before March 27, 2009. MMS AG already held 37,800 treasury shares on December 31, 2007. On March 4, 2008 the Executive Board decided to initially buy back up to a further 53,200 of the Company’s own shares on the stock market by August 30, 2008. As part of this stock buyback program, the Company acquired 53,200 of its own shares for a total amount of € 1,502 k as of June 17, 2008.
In the course of acquiring the software product Colotux for a total of € 220 k on October 23, 2008, half of the first purchase price installment of € 110 k was settled in mid‐November 2008 by the transfer of treasury shares (a total of 1,832 treasury shares with a market value of € 55 k).
In accordance with a new resolution passed by the shareholders at the annual general meeting on July 9, 2008 concerning the acquisition of the Company’s own shares in accordance with Section 71 (1) No. 8 of the German Stock Corporation Act (AktG), the Company was authorized to acquire up to 10% of its current share capital (€ 1,820 k) on or before January 8, 2010. On November 4, 2008, the Executive Board decided to buy up to a further 91,000 of the Company’s own shares on the stock market. As part of this stock buyback program, the Company acquired 33,682 of its own shares for a total amount of € 1,163 k as of March 31, 2009. When the stock buyback program was concluded on March 31, 2009, MMS AG held a total of 122,850 treasury shares (6.75% of share capital). A total of 18,726 treasury shares were transferred to the seller as part of the second stage in the acquisition of Medis shares on May 31, 2010. The second purchase price installment for the acquisition of the Colotux software product was paid in advance on April 15, 2011. The seller was paid a total of 6,571 treasury shares, among other things.
Therefore a total of 97,553 treasury shares were held as of 30.06.11. This corresponds to 5.4% of the current share capital.
11. Other financial liabilities
Other non‐current financial liabilities
FIGURES IN € k Jun. 30, 2011 Dec. 31, 2010
Liability from 49% acquisition of MBS KG 3,358 3,276Leasing liabilities 47 0Liability to Fraunhofer MEVIS 43 175Other 1 1 Other non‐current financial liabilities 3,449 3,452
Other current financial liabilities
FIGURES IN € k Jun. 30, 2011 Dec. 31, 2010
Liability from 49% acquisition of MBS KG 3,358 3,405Staff liabilities 609 395Liability to Fraunhofer MEVIS 189 180Leasing liabilities 84 0Derivative financial instruments 0 5Miscellaneous other financial liabilities 47 22Other current financial liabilities 4,287 4,007
22 | P a g e
MeVis Medical Solutions AG, Bremen Interim Report H1/2011
12. Transactions with related parties
With reference to business transacted with related parties, there have been no material changes since December 31, 2010.
13. Contingent receivables and contingent liabilities
In comparison with the contingent receivables and contingent liabilities presented in the consolidated financial statements for the 2010 financial year, no changes occurred in the first half of the current fiscal year.
14. Earnings per share
Earnings per share equal the profit on continuing activities or profit (after tax) divided by the weighted average number of shares outstanding during the financial year. Earnings per share (fully diluted) are calculated on the assumption that all securities, stock options and stock awards with a potentially dilutory effect are converted or exercised.
As the criteria for exercising the options had not been satisfied as of the balance sheet date, it can be assumed that no options had been exercised by the employees and that no shares had been awarded to entitled members of the Executive Board. Accordingly, they are not included in the calculation of earnings per share, which means that diluted earnings per share are identical to basic earnings per share.
The weighted average of shares outstanding is determined by taking account of shares redeemed and reissued subject to a chronological weighting.
Jun. 30, 2011 Jun. 30, 2010
Consolidated net income for the year in € k ‐1,172 ‐652
Weighted average of the number of no‐par‐value shares outstanding during the period under review 1,719,162 1,700,271Basic earnings per share in € ‐0.68 ‐0.38Diluted earnings per share in € ‐0.68 ‐0.38
15. Segment information
In the 1st half of 2011, the activities of the MeVis Group are again thus classified into the reportable segments of Digital Mammography and Other Diagnostics. The management of each of these segments reports directly to the Executive Board of MMS AG in its function as the responsible corporate entity.
Segment earnings and the result of operating activities remain the key benchmarks for assessing and controlling the earnings position of a particular segment. As a rule, the result of operating activities corresponds to earnings before interest and taxes (EBIT).
23 | P a g e

MeVis Medical Solutions AG, Bremen Interim Report H1/2011
The segments break down as follows:
Digital Mammography
Other Diagnostics
Other/Consolidation and reconciliation
MeVis Group
Jan. 1 – Jun. 30 Jan. 1 – Jun. 30 Jan. 1 – Jun. 30 Jan. 1 – Jun. 30
FIGURES IN € k 2011 2010 2011 2010 2011 2010 2011 2010
External revenues 5,191 5,356 1,497 1,965 0 0 6,688 7,321
Intersegment revenues 0 0 0 4 0 ‐4 0 0
Revenues 5,191 5,356 1,497 1,969 0 ‐4 6,688 7,321
Grants 0 0 82 216 0 0 82 216
Total segment revenues 5,191 5,356 1,579 2,185 0 ‐4 6,770 7,537 Capitalization of development expenses 795 760 514 639 0 ‐197 1,309 1,202
Depreciation and amortization ‐1,082 ‐960 ‐702 ‐841 0 27 ‐1,784 ‐1,774
Operating expenses ‐1,762 ‐2,022 ‐3,402 ‐3,841 205 122 ‐4,959 ‐5,741
Segmentergebnis 3,142 3,135 ‐2,011 ‐1,857 205 ‐53 1,336 1,224
Other operating income 136 34 609 616 ‐468 ‐269 277 381
Other operating expenses ‐554 ‐443 ‐1,177 ‐1,233 300 222 ‐1,431 ‐1,455
Result of operating activities 2,724 2,726 ‐2,579 ‐2,475 36 ‐100 181 150
16. Post balance sheet events
No transactions of material relevance to the MeVis Group have arisen since the balance sheet date.
Bremen, August 29, 2011
Carl J.G. Evertsz, Ph.D. Robert Hannemann, Ph.D. Thomas E. Tynes
Chairman & CEO Member of the Executive Board Member of the Executive Board
24 | P a g e
MeVis Medical Solutions AG, Bremen Interim Report H1/2011
Responsibility Statement („Bilanzeid“)
Responsibility statement required by section 37y no. 1 of the Wertpapierhandelsgesetz (WpHG – German Securities Trading Act) in conjunction with sections 297(2) sentence 4 and 315(1) sentence 6 of the Handelsgesetzbuch (HGB – German Commercial Code) for the consolidated financial statements and the group management report:
“To the best of our knowledge, and in accordance with the applicable reporting principles, the consolidated financial statements give a true and fair view of the assets, liabilities, financial position and profit or loss of the group, and the group management report includes a fair review of the development and performance of the business and the position of the group, together with a description of the principal opportunities and risks associated with the expected development of the group.”
Bremen, August 29, 2011
MeVis Medical Solutions AG
Carl J.G. Evertsz, Ph.D. Robert Hannemann, Ph.D. Thomas E. Tynes
Chairman & CEO Member of the Executive Board Member of the Executive Board
25 | P a g e

MeVis Medical Solutions AG, Bremen Interim Report H1/2011
Disclaimer
Forward‐looking statement
This report contains forward‐looking statements which are based on management’s current estimates of future developments. Such statements are subject to risks and uncertainties, which MeVis Medical Solutions AG is not able to control or estimate with any precision, e.g. future market conditions and the general economic environment, the behavior of other market participants, the successful integration of new acquisitions and government acts. If any of these uncertainties or imponderabilities materialize or if the assumptions on which these statements are based prove to be incorrect, this may cause actual results to deviate materially from those expressly or implicitly contained in these statements. MeVis Medical Solutions AG does not intend and is under no obligation to update the forward‐looking statements in the light of any events or developments occurring after the date of this report.
Deviations for technical reasons
Deviations may occur between the accounting data contained in this report and that submitted to the electronic Bundesanzeiger for technical reasons (e.g. conversion of electronic formats). In the case of any doubt, the version submitted to the electronic Bundesanzeiger will prevail.
This report is also available in a German‐language version. In case of any doubt, the German‐language version takes priority over the English‐language one.
The report is available for downloading in both languages on the Internet at http://www.mevis.de/mms/en/Financial_Reports.html.
26 | P a g e
MeVis Medical Solutions AG, Bremen Interim Report H1/2011
27 | P a g e
Contact
Investor Relations
Dr. Kai Holtmann Investor Relations Manager Phone +49 421 22495 63 Fax +49 421 22495 11 [email protected]
Company Address
MeVis Medical Solutions AG Universitaetsallee 29 28359 Bremen Germany Phone +49 421 22495 0 Fax +49 421 22495 11 [email protected] www.mevis.de


![[22.5] [20.7] [195 [2àa] 49 (1821 [200] [23.1] -90 [184 ...](https://static.documents.pub/doc/80x56/61cf6a254278407e963c0494/225-207-195-2a-49-1821-200-231-90-184-.jpg)


