Structure and mechanical behavior of a toucan beak Yasuaki Seki, Matthew S. Schneider, Marc A. Meyers * Department of Mechanical and Aerospace Engineering, University of California, 9500 Gilman Drive, San Diego, La Jolla, CA 92093-0411, USA Received 13 December 2004; received in revised form 25 April 2005; accepted 25 April 2005 Available online 5 October 2005 Abstract The toucan beak, which comprises one third of the length of the bird and yet only about 1/20th of its mass, has outstanding stiffness. The structure of a Toco toucan (Ramphastos toco) beak was found to be a sandwich composite with an exterior of keratin and a fibrous network of closed cells made of calcium-rich proteins. The keratin layer is comprised of superposed hexagonal scales (50 lm diameter and 1 lm thickness) glued together. Its tensile strength is about 50 MPa and YoungÕs modulus is 1.4 GPa. Micro and nanoindentation hardness measurements corroborate these values. The keratin shell exhibits a strain-rate sensitivity with a tran- sition from slippage of the scales due to release of the organic glue, at a low strain rate (5 · 10 5 /s) to fracture of the scales at a higher strain rate (1.5 · 10 3 /s). The closed-cell foam is comprised of fibers having a YoungÕs modulus twice as high as the keratin shells due to their higher calcium content. The compressive response of the foam was modeled by the Gibson–Ashby constitutive equations for open and closed-cell foam. There is a synergistic effect between foam and shell evidenced by experiments and analysis establishing the separate responses of shell, foam, and foam + shell. The stability analysis developed by Karam and Gibson, assum- ing an idealized circular cross section, was applied to the beak. It shows that the foam stabilizes the deformation of the beak by providing an elastic foundation which increases its Brazier and buckling load under flexure loading. Ó 2005 Acta Materialia Inc. Published by Elsevier Ltd. All rights reserved. Keywords: Mechanical properties; Foams; Biological materials; Keratin; Toucan 1. Introduction The study of biological materials can provide insights into heretofore unexploited mechanisms of designing and toughening synthetic materials [1–4]. Shells have received a great deal of attention over the past years [1,5–9] and are inspiring new processing methods for materials. The spicule of the sea urchin is another example of a bio- logical material with mechanical properties far surpass- ing those of synthetic materials. It is composed of concentric layers of amorphous silica, providing a flexure strength four times higher than synthetic silica [10]. In addition, the failure is graceful and not catastrophic. Other examples, such as silk and spider web, abound. A fascinating class of biological materials is sandwich structures consisting of a solid shell and a cellular core. Karam and Gibson [11] include porcupine quills, hedge- hog spines, and plant stems in this category; the cellular core increases the resistance of the shell to buckling, lead- ing to a synergism between the two constituents. Bird beaks usually fall into two categories: short/ thick, and long/thin. The toucan is an exception. It has a long beak that is also thick, a necessity for food gathering in tall trees. This is accomplished by an inge- nious solution, enabling a low density and high stiffness: a composite structure consisting of an external solid ker- atin shell and a cellular core. Fig. 1 shows the beak in schematic fashion. The toucan beak has a density of approximately 0.1, which enables the bird to fly while maintaining a center of mass at the line of the wings. In- deed, the beak comprises 1/3 the length of the bird, yet only makes up about 1/20 of its mass. The mesostruc- ture and microstructure of a toucan beak reveal a 1359-6454/$30.00 Ó 2005 Acta Materialia Inc. Published by Elsevier Ltd. All rights reserved. doi:10.1016/j.actamat.2005.04.048 * Corresponding author. Tel.: +1 858 534 4719. E-mail address: [email protected](M.A. Meyers). Acta Materialia 53 (2005) 5281–5296 www.actamat-journals.com
Transcript
Acta Materialia 53 (2005) 5281–5296
www.actamat-journals.com
Structure and mechanical behavior of a toucan beak
Yasuaki Seki, Matthew S. Schneider, Marc A. Meyers *
Department of Mechanical and Aerospace Engineering, University of California, 9500 Gilman Drive, San Diego, La Jolla, CA 92093-0411, USA
Received 13 December 2004; received in revised form 25 April 2005; accepted 25 April 2005Available online 5 October 2005
Abstract
The toucan beak, which comprises one third of the length of the bird and yet only about 1/20th of its mass, has outstandingstiffness. The structure of a Toco toucan (Ramphastos toco) beak was found to be a sandwich composite with an exterior of keratinand a fibrous network of closed cells made of calcium-rich proteins. The keratin layer is comprised of superposed hexagonal scales(50 lm diameter and 1 lm thickness) glued together. Its tensile strength is about 50 MPa and Young�s modulus is 1.4 GPa. Microand nanoindentation hardness measurements corroborate these values. The keratin shell exhibits a strain-rate sensitivity with a tran-sition from slippage of the scales due to release of the organic glue, at a low strain rate (5 · 10�5/s) to fracture of the scales at ahigher strain rate (1.5 · 10�3/s). The closed-cell foam is comprised of fibers having a Young�s modulus twice as high as the keratinshells due to their higher calcium content. The compressive response of the foam was modeled by the Gibson–Ashby constitutiveequations for open and closed-cell foam. There is a synergistic effect between foam and shell evidenced by experiments and analysisestablishing the separate responses of shell, foam, and foam + shell. The stability analysis developed by Karam and Gibson, assum-ing an idealized circular cross section, was applied to the beak. It shows that the foam stabilizes the deformation of the beak byproviding an elastic foundation which increases its Brazier and buckling load under flexure loading.� 2005 Acta Materialia Inc. Published by Elsevier Ltd. All rights reserved.
The study of biological materials can provide insightsinto heretofore unexploited mechanisms of designing andtoughening synthetic materials [1–4]. Shells have receiveda great deal of attention over the past years [1,5–9] andare inspiring new processing methods for materials.The spicule of the sea urchin is another example of a bio-logical material with mechanical properties far surpass-ing those of synthetic materials. It is composed ofconcentric layers of amorphous silica, providing a flexurestrength four times higher than synthetic silica [10]. Inaddition, the failure is graceful and not catastrophic.Other examples, such as silk and spider web, abound.A fascinating class of biological materials is sandwich
1359-6454/$30.00 � 2005 Acta Materialia Inc. Published by Elsevier Ltd. A
structures consisting of a solid shell and a cellular core.Karam and Gibson [11] include porcupine quills, hedge-hog spines, and plant stems in this category; the cellularcore increases the resistance of the shell to buckling, lead-ing to a synergism between the two constituents.
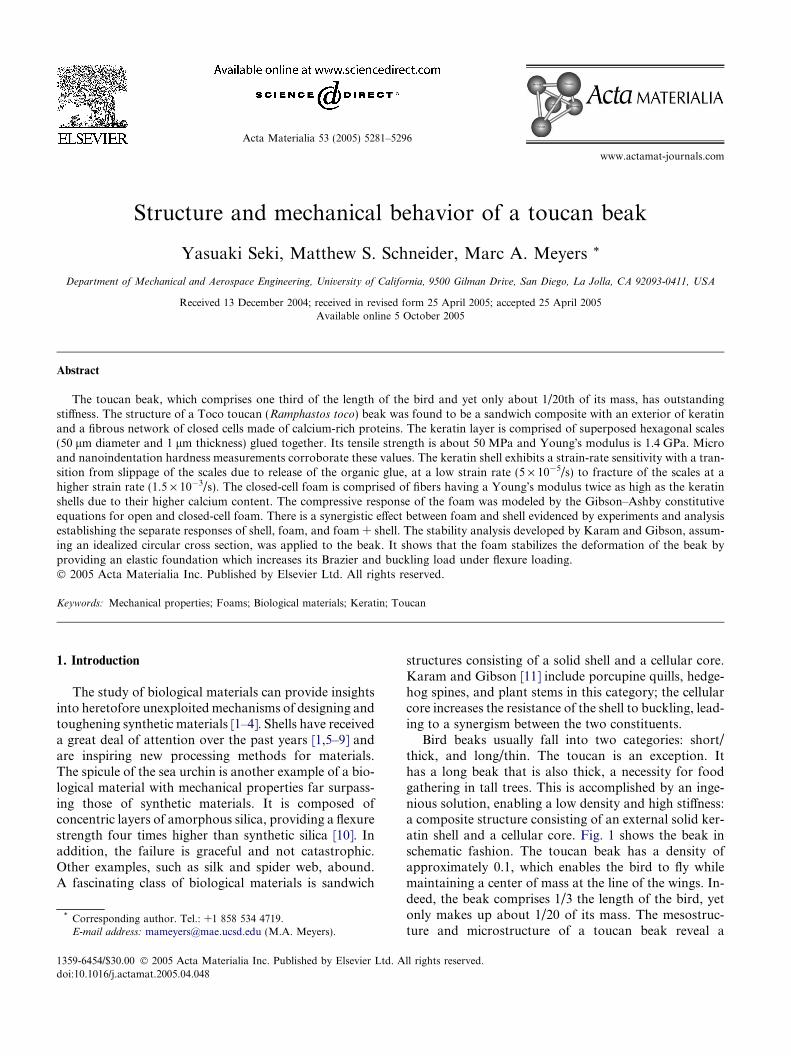
Bird beaks usually fall into two categories: short/thick, and long/thin. The toucan is an exception. Ithas a long beak that is also thick, a necessity for foodgathering in tall trees. This is accomplished by an inge-nious solution, enabling a low density and high stiffness:a composite structure consisting of an external solid ker-atin shell and a cellular core. Fig. 1 shows the beak inschematic fashion. The toucan beak has a density ofapproximately 0.1, which enables the bird to fly whilemaintaining a center of mass at the line of the wings. In-deed, the beak comprises 1/3 the length of the bird, yetonly makes up about 1/20 of its mass. The mesostruc-ture and microstructure of a toucan beak reveal a
Fig. 1. Schematic representation of toucan beak: (a) overall view;(b) foam consisting of membranes in a framework of fibers and(c) keratin shell scales.
5282 Y. Seki et al. / Acta Materialia 53 (2005) 5281–5296
material which is reminiscent of sandwich structures offunctionally graded materials, with components madeof foam covered by a hard surface layer. Therefore, thisbiological material serves as a useful source for researchand as an inspiration for structural design in engineer-
ing. This is the first study correlating the toucan beakstructure to its mechanical performance.
2. Experimental techniques
The toucan beak (Ramphastos toco) was obtainedafter the natural death of animal and stored at roomtemperature. Both the upper beak and lower beak wereused for mechanical tests and structural analysis. Theblack color region of the exterior beak was avoided be-cause there is a report on the effect of starling beak col-oration on hardness [12]. Humidity and temperaturewere measured to determine the environmental effects.
Specimen preparation for nanoindentation and micr-oindentation was the same. The toucan beak shell wascut into small pieces by knife and mounted in epoxy.The foam was attached to a glass plate by glue. Theexperimental set up was the same as the one used earlierfor hardness measurement of the starling beak [12]. ALECO M-400-H1 hardness testing machine with a load100 gf was used. The indenter was applied for 15 s, anda further 45 s was allowed to elapse before the diagonalsof the indentation were measured. Since nanoindentationis highly sensitive to the roughness of the sample, speci-mens were polished to 0.05 lm. Both the interior andexterior of beak were tested. Pictures of the samples be-fore and after the test were taken by scanning electronmicroscope (SEM). A Hysistron Triboindenter was usedto determine the reduced Young�s modulus and hardnessof the samples. Loads of 500 and 1000 lN (Berkovich-type indenter) were applied to specimens.
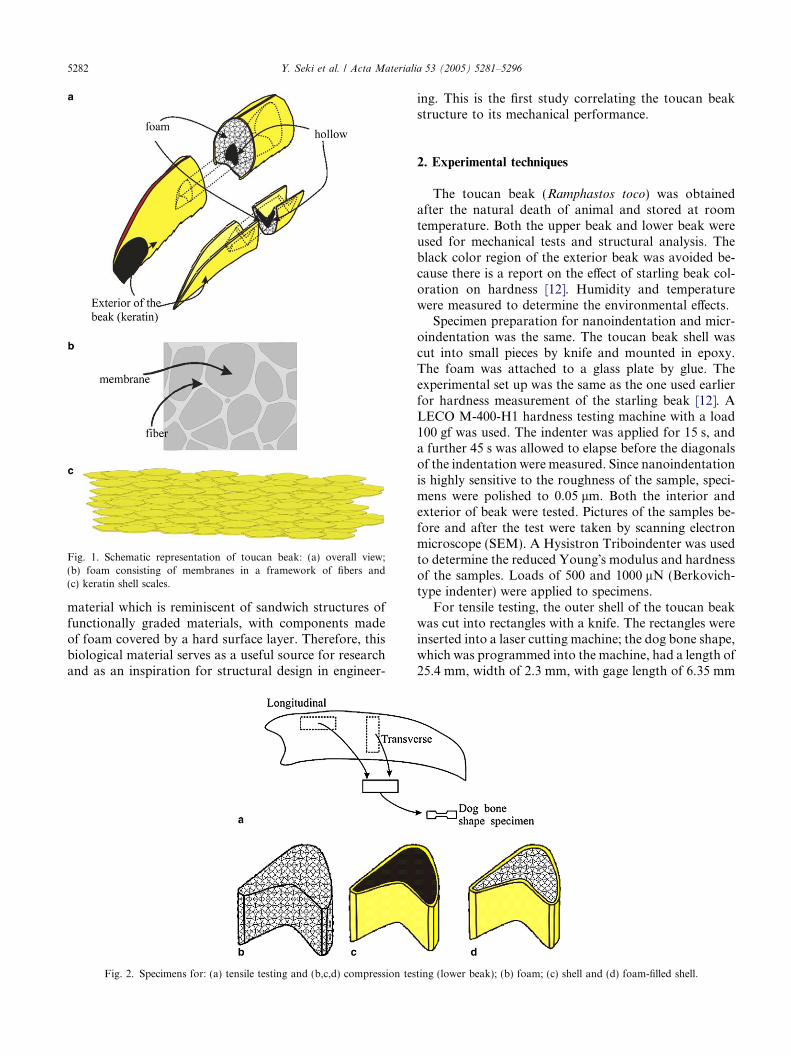
For tensile testing, the outer shell of the toucan beakwas cut into rectangles with a knife. The rectangles wereinserted into a laser cutting machine; the dog bone shape,which was programmed into the machine, had a length of25.4 mm, width of 2.3 mm, with gage length of 6.35 mm
Y. Seki et al. / Acta Materialia 53 (2005) 5281–5296 5283
and gage width of 0.5 mm. Longitudinal and transversespecimens were removed, as shown in Fig. 2(a). To avoidthe effect of curvature of samples, a preload of 25 N wasapplied before the test. A universal testing machineequipped with a 1000 N load cell was used. Displacementwas measured with an extensometer attached to the grips.The tests were carried out at room temperature andhumidity of approximately 50%. The specimens for com-pression testing of the foam were removed entirely (asone piece) from the beak. This is shown in Fig. 2(b).The crosshead speed was 1.27 mm/min. Slices of the tou-can beak were cut with a high-speed diamond saw.
The keratin exterior of the beak and foam werecoated with silver nitride and placed on a Philips SEMequipped with energy dispersive X-ray analysis (EDX)for observation and characterization.
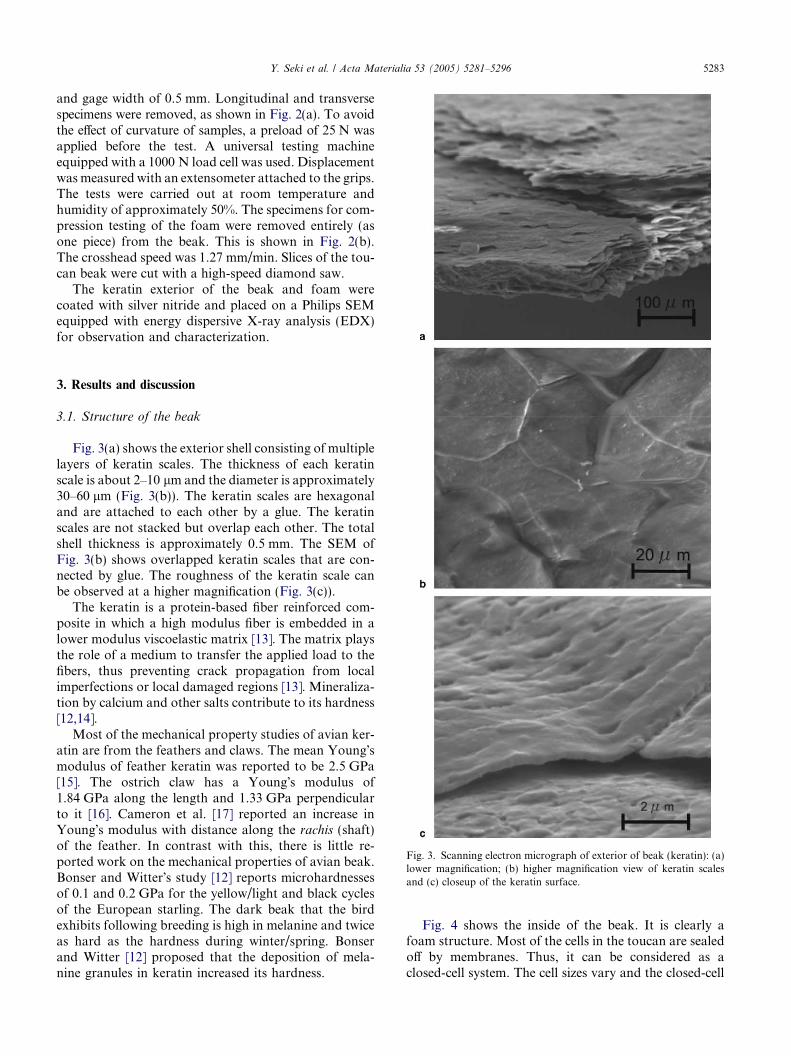
Fig. 3. Scanning electron micrograph of exterior of beak (keratin): (a)lower magnification; (b) higher magnification view of keratin scalesand (c) closeup of the keratin surface.
3. Results and discussion
3.1. Structure of the beak
Fig. 3(a) shows the exterior shell consisting of multiplelayers of keratin scales. The thickness of each keratinscale is about 2–10 lm and the diameter is approximately30–60 lm (Fig. 3(b)). The keratin scales are hexagonaland are attached to each other by a glue. The keratinscales are not stacked but overlap each other. The totalshell thickness is approximately 0.5 mm. The SEM ofFig. 3(b) shows overlapped keratin scales that are con-nected by glue. The roughness of the keratin scale canbe observed at a higher magnification (Fig. 3(c)).
The keratin is a protein-based fiber reinforced com-posite in which a high modulus fiber is embedded in alower modulus viscoelastic matrix [13]. The matrix playsthe role of a medium to transfer the applied load to thefibers, thus preventing crack propagation from localimperfections or local damaged regions [13]. Mineraliza-tion by calcium and other salts contribute to its hardness[12,14].
Most of the mechanical property studies of avian ker-atin are from the feathers and claws. The mean Young�smodulus of feather keratin was reported to be 2.5 GPa[15]. The ostrich claw has a Young�s modulus of1.84 GPa along the length and 1.33 GPa perpendicularto it [16]. Cameron et al. [17] reported an increase inYoung�s modulus with distance along the rachis (shaft)of the feather. In contrast with this, there is little re-ported work on the mechanical properties of avian beak.Bonser and Witter�s study [12] reports microhardnessesof 0.1 and 0.2 GPa for the yellow/light and black cyclesof the European starling. The dark beak that the birdexhibits following breeding is high in melanine and twiceas hard as the hardness during winter/spring. Bonserand Witter [12] proposed that the deposition of mela-nine granules in keratin increased its hardness.
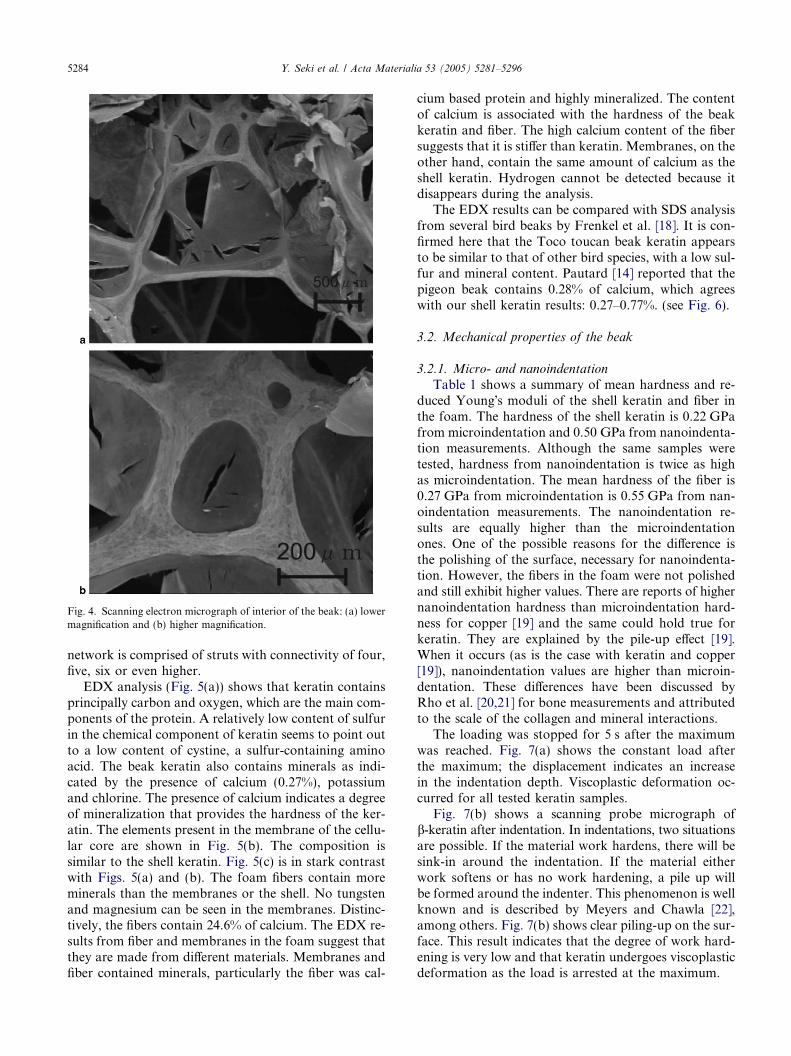
Fig. 4 shows the inside of the beak. It is clearly afoam structure. Most of the cells in the toucan are sealedoff by membranes. Thus, it can be considered as aclosed-cell system. The cell sizes vary and the closed-cell
Fig. 4. Scanning electron micrograph of interior of the beak: (a) lowermagnification and (b) higher magnification.
5284 Y. Seki et al. / Acta Materialia 53 (2005) 5281–5296
network is comprised of struts with connectivity of four,five, six or even higher.
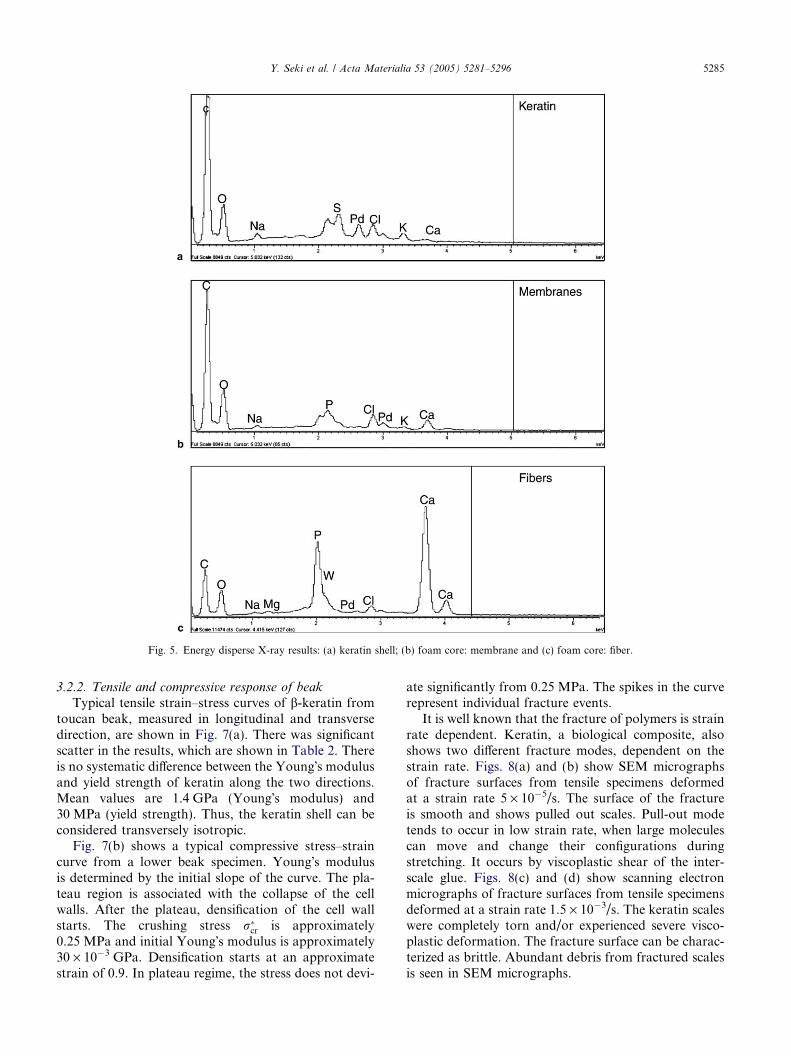
EDX analysis (Fig. 5(a)) shows that keratin containsprincipally carbon and oxygen, which are the main com-ponents of the protein. A relatively low content of sulfurin the chemical component of keratin seems to point outto a low content of cystine, a sulfur-containing aminoacid. The beak keratin also contains minerals as indi-cated by the presence of calcium (0.27%), potassiumand chlorine. The presence of calcium indicates a degreeof mineralization that provides the hardness of the ker-atin. The elements present in the membrane of the cellu-lar core are shown in Fig. 5(b). The composition issimilar to the shell keratin. Fig. 5(c) is in stark contrastwith Figs. 5(a) and (b). The foam fibers contain moreminerals than the membranes or the shell. No tungstenand magnesium can be seen in the membranes. Distinc-tively, the fibers contain 24.6% of calcium. The EDX re-sults from fiber and membranes in the foam suggest thatthey are made from different materials. Membranes andfiber contained minerals, particularly the fiber was cal-
cium based protein and highly mineralized. The contentof calcium is associated with the hardness of the beakkeratin and fiber. The high calcium content of the fibersuggests that it is stiffer than keratin. Membranes, on theother hand, contain the same amount of calcium as theshell keratin. Hydrogen cannot be detected because itdisappears during the analysis.
The EDX results can be compared with SDS analysisfrom several bird beaks by Frenkel et al. [18]. It is con-firmed here that the Toco toucan beak keratin appearsto be similar to that of other bird species, with a low sul-fur and mineral content. Pautard [14] reported that thepigeon beak contains 0.28% of calcium, which agreeswith our shell keratin results: 0.27–0.77%. (see Fig. 6).
3.2. Mechanical properties of the beak
3.2.1. Micro- and nanoindentation
Table 1 shows a summary of mean hardness and re-duced Young�s moduli of the shell keratin and fiber inthe foam. The hardness of the shell keratin is 0.22 GPafrom microindentation and 0.50 GPa from nanoindenta-tion measurements. Although the same samples weretested, hardness from nanoindentation is twice as highas microindentation. The mean hardness of the fiber is0.27 GPa from microindentation is 0.55 GPa from nan-oindentation measurements. The nanoindentation re-sults are equally higher than the microindentationones. One of the possible reasons for the difference isthe polishing of the surface, necessary for nanoindenta-tion. However, the fibers in the foam were not polishedand still exhibit higher values. There are reports of highernanoindentation hardness than microindentation hard-ness for copper [19] and the same could hold true forkeratin. They are explained by the pile-up effect [19].When it occurs (as is the case with keratin and copper[19]), nanoindentation values are higher than microin-dentation. These differences have been discussed byRho et al. [20,21] for bone measurements and attributedto the scale of the collagen and mineral interactions.
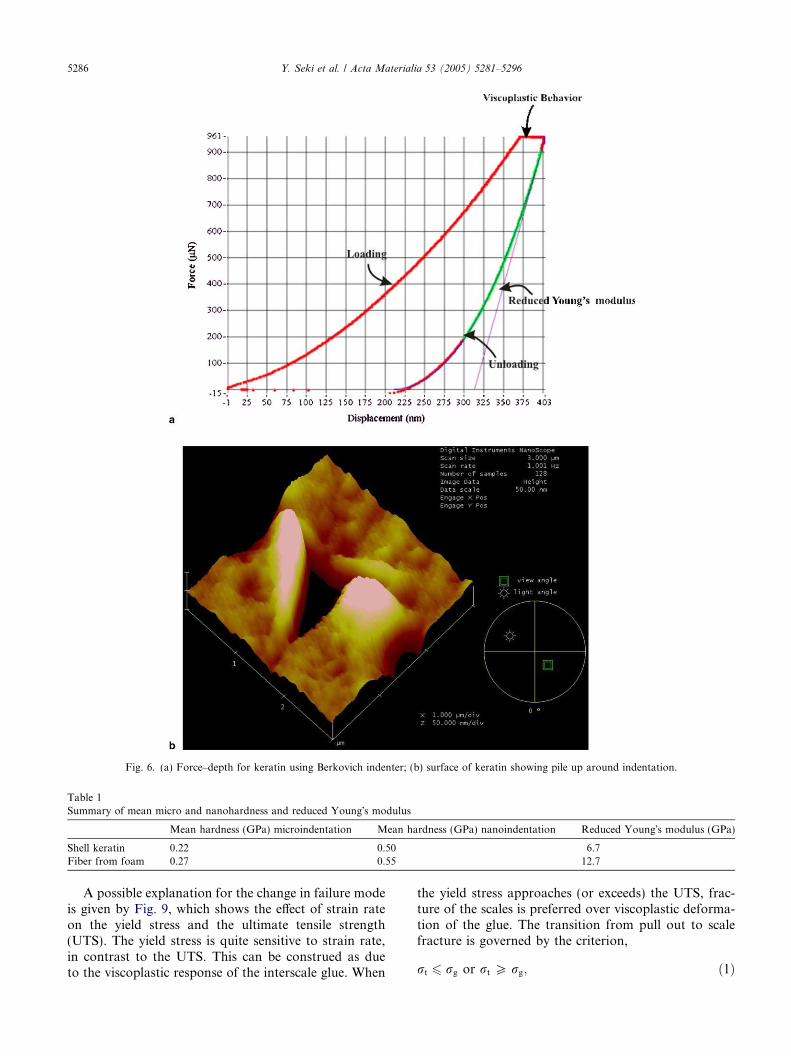
The loading was stopped for 5 s after the maximumwas reached. Fig. 7(a) shows the constant load afterthe maximum; the displacement indicates an increasein the indentation depth. Viscoplastic deformation oc-curred for all tested keratin samples.
Fig. 7(b) shows a scanning probe micrograph ofb-keratin after indentation. In indentations, two situationsare possible. If the material work hardens, there will besink-in around the indentation. If the material eitherwork softens or has no work hardening, a pile up willbe formed around the indenter. This phenomenon is wellknown and is described by Meyers and Chawla [22],among others. Fig. 7(b) shows clear piling-up on the sur-face. This result indicates that the degree of work hard-ening is very low and that keratin undergoes viscoplasticdeformation as the load is arrested at the maximum.
Fig. 5. Energy disperse X-ray results: (a) keratin shell; (b) foam core: membrane and (c) foam core: fiber.
Y. Seki et al. / Acta Materialia 53 (2005) 5281–5296 5285
3.2.2. Tensile and compressive response of beak
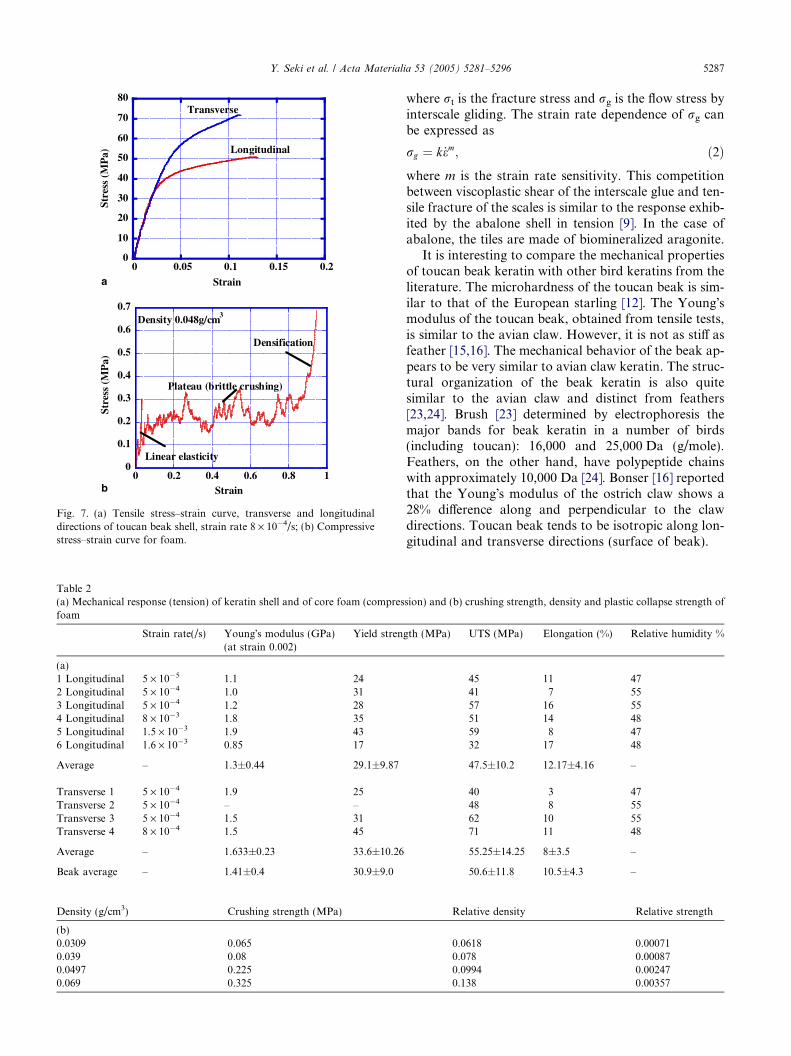
Typical tensile strain–stress curves of b-keratin fromtoucan beak, measured in longitudinal and transversedirection, are shown in Fig. 7(a). There was significantscatter in the results, which are shown in Table 2. Thereis no systematic difference between the Young�s modulusand yield strength of keratin along the two directions.Mean values are 1.4 GPa (Young�s modulus) and30 MPa (yield strength). Thus, the keratin shell can beconsidered transversely isotropic.
Fig. 7(b) shows a typical compressive stress–straincurve from a lower beak specimen. Young�s modulusis determined by the initial slope of the curve. The pla-teau region is associated with the collapse of the cellwalls. After the plateau, densification of the cell wallstarts. The crushing stress r�
cr is approximately0.25 MPa and initial Young�s modulus is approximately30 · 10�3 GPa. Densification starts at an approximatestrain of 0.9. In plateau regime, the stress does not devi-
ate significantly from 0.25 MPa. The spikes in the curverepresent individual fracture events.
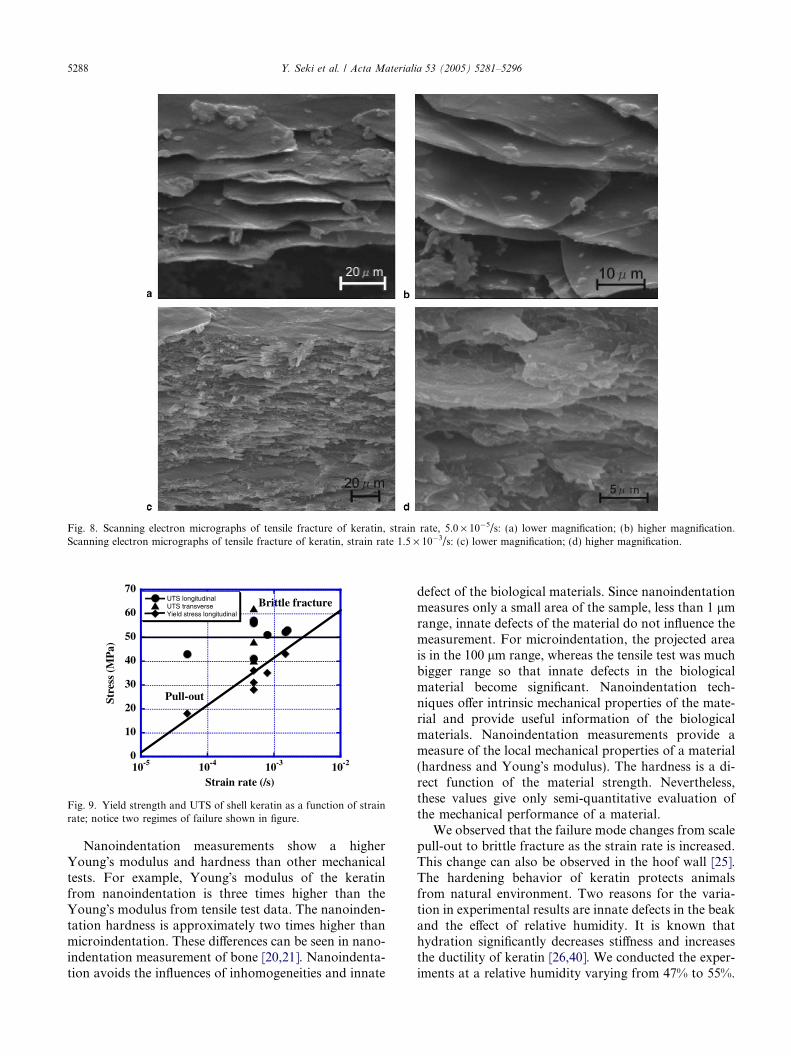
It is well known that the fracture of polymers is strainrate dependent. Keratin, a biological composite, alsoshows two different fracture modes, dependent on thestrain rate. Figs. 8(a) and (b) show SEM micrographsof fracture surfaces from tensile specimens deformedat a strain rate 5 · 10�5/s. The surface of the fractureis smooth and shows pulled out scales. Pull-out modetends to occur in low strain rate, when large moleculescan move and change their configurations duringstretching. It occurs by viscoplastic shear of the inter-scale glue. Figs. 8(c) and (d) show scanning electronmicrographs of fracture surfaces from tensile specimensdeformed at a strain rate 1.5 · 10�3/s. The keratin scaleswere completely torn and/or experienced severe visco-plastic deformation. The fracture surface can be charac-terized as brittle. Abundant debris from fractured scalesis seen in SEM micrographs.
t g t g
Fig. 6. (a) Force–depth for keratin using Berkovich indenter; (b) surface of keratin showing pile up around indentation.
Table 1Summary of mean micro and nanohardness and reduced Young�s modulus
Mean hardness (GPa) microindentation Mean hardness (GPa) nanoindentation Reduced Young�s modulus (GPa)
Shell keratin 0.22 0.50 6.7Fiber from foam 0.27 0.55 12.7
5286 Y. Seki et al. / Acta Materialia 53 (2005) 5281–5296
A possible explanation for the change in failure modeis given by Fig. 9, which shows the effect of strain rateon the yield stress and the ultimate tensile strength(UTS). The yield stress is quite sensitive to strain rate,in contrast to the UTS. This can be construed as dueto the viscoplastic response of the interscale glue. When
the yield stress approaches (or exceeds) the UTS, frac-ture of the scales is preferred over viscoplastic deforma-tion of the glue. The transition from pull out to scalefracture is governed by the criterion,
r 6 r or r P r ; ð1Þ
Table 2(a) Mechanical response (tension) of keratin shell and of core foam (compresfoam
Fig. 7. (a) Tensile stress–strain curve, transverse and longitudinaldirections of toucan beak shell, strain rate 8 · 10�4/s; (b) Compressivestress–strain curve for foam.
Y. Seki et al. / Acta Materialia 53 (2005) 5281–5296 5287
where rt is the fracture stress and rg is the flow stress byinterscale gliding. The strain rate dependence of rg canbe expressed as
rg ¼ k _em; ð2Þwhere m is the strain rate sensitivity. This competitionbetween viscoplastic shear of the interscale glue and ten-sile fracture of the scales is similar to the response exhib-ited by the abalone shell in tension [9]. In the case ofabalone, the tiles are made of biomineralized aragonite.
It is interesting to compare the mechanical propertiesof toucan beak keratin with other bird keratins from theliterature. The microhardness of the toucan beak is sim-ilar to that of the European starling [12]. The Young�smodulus of the toucan beak, obtained from tensile tests,is similar to the avian claw. However, it is not as stiff asfeather [15,16]. The mechanical behavior of the beak ap-pears to be very similar to avian claw keratin. The struc-tural organization of the beak keratin is also quitesimilar to the avian claw and distinct from feathers[23,24]. Brush [23] determined by electrophoresis themajor bands for beak keratin in a number of birds(including toucan): 16,000 and 25,000 Da (g/mole).Feathers, on the other hand, have polypeptide chainswith approximately 10,000 Da [24]. Bonser [16] reportedthat the Young�s modulus of the ostrich claw shows a28% difference along and perpendicular to the clawdirections. Toucan beak tends to be isotropic along lon-gitudinal and transverse directions (surface of beak).
sion) and (b) crushing strength, density and plastic collapse strength of
Fig. 9. Yield strength and UTS of shell keratin as a function of strainrate; notice two regimes of failure shown in figure.
5288 Y. Seki et al. / Acta Materialia 53 (2005) 5281–5296
Nanoindentation measurements show a higherYoung�s modulus and hardness than other mechanicaltests. For example, Young�s modulus of the keratinfrom nanoindentation is three times higher than theYoung�s modulus from tensile test data. The nanoinden-tation hardness is approximately two times higher thanmicroindentation. These differences can be seen in nano-indentation measurement of bone [20,21]. Nanoindenta-tion avoids the influences of inhomogeneities and innate
defect of the biological materials. Since nanoindentationmeasures only a small area of the sample, less than 1 lmrange, innate defects of the material do not influence themeasurement. For microindentation, the projected areais in the 100 lm range, whereas the tensile test was muchbigger range so that innate defects in the biologicalmaterial become significant. Nanoindentation tech-niques offer intrinsic mechanical properties of the mate-rial and provide useful information of the biologicalmaterials. Nanoindentation measurements provide ameasure of the local mechanical properties of a material(hardness and Young�s modulus). The hardness is a di-rect function of the material strength. Nevertheless,these values give only semi-quantitative evaluation ofthe mechanical performance of a material.
We observed that the failure mode changes from scalepull-out to brittle fracture as the strain rate is increased.This change can also be observed in the hoof wall [25].The hardening behavior of keratin protects animalsfrom natural environment. Two reasons for the varia-tion in experimental results are innate defects in the beakand the effect of relative humidity. It is known thathydration significantly decreases stiffness and increasesthe ductility of keratin [26,40]. We conducted the exper-iments at a relative humidity varying from 47% to 55%.
Y. Seki et al. / Acta Materialia 53 (2005) 5281–5296 5289
For 55% relative humidity, the Young�s modulus of ker-atin seemed slightly decreased. This effect will be system-atically investigated in the future.
3.3. Analysis of mechanical response
Two aspects of deformation are addressed in this sec-tion: elastoplastic collapse of the foam, which representsthe interior, and combined response of sandwichstructure.
3.3.1. Modeling of interior foam (Gibson–Ashby
constitutive equations)
The most significant feature of the cellular solid is therelative density, q*/qS (density of the cellular material,q*, divided by density of the solid material, qS). Gibsonand Ashby [27] provide an analytical treatment for themechanical behavior of a broad range of cellular mate-rials. The following equation governs relative densityof closed cell materials for q*/qS < 0.3:
q�
qS
¼ C1tl
� �; ð3Þ
where C1 is a numerical constant, t is uniform thickness,and l is the lateral dimension of the faces.
The toucan beak foam can be considered as a closedcell system. Deformation of the closed cells is more com-plicated than that of open cells. When open cell foamsare deformed, cell wall bending occurs. Deformationof closed cell involves not only rotation of cell wall,but also stretching of the membranes and internal gaspressure.
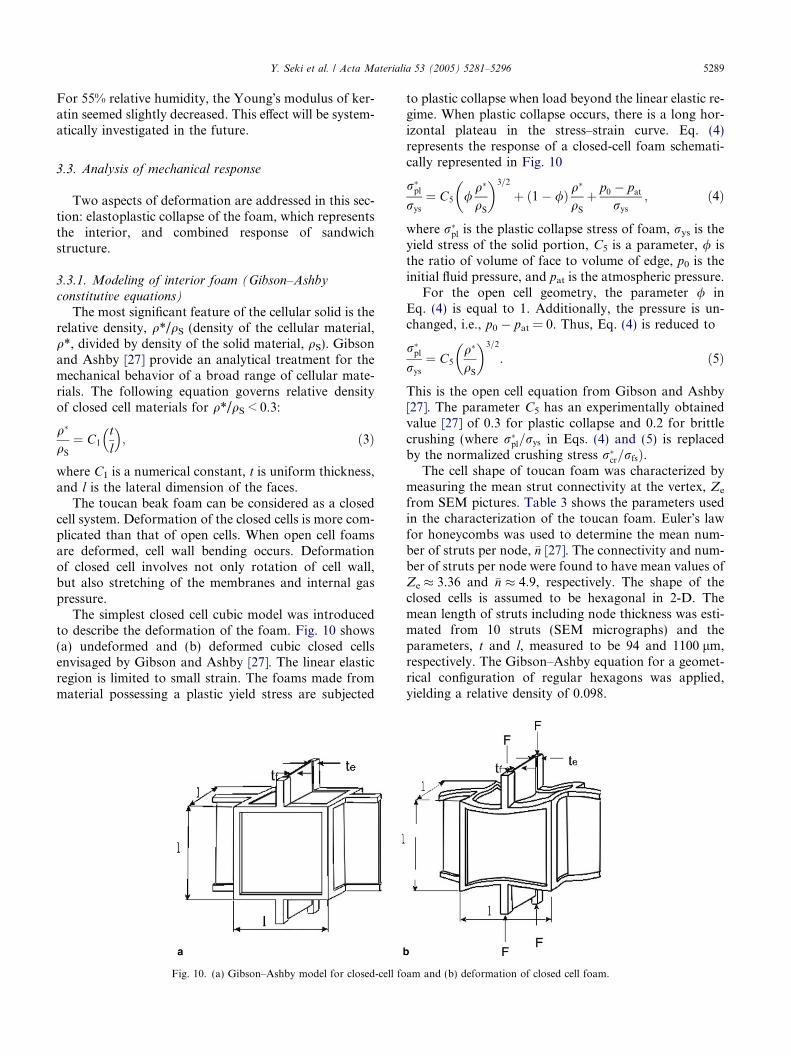
The simplest closed cell cubic model was introducedto describe the deformation of the foam. Fig. 10 shows(a) undeformed and (b) deformed cubic closed cellsenvisaged by Gibson and Ashby [27]. The linear elasticregion is limited to small strain. The foams made frommaterial possessing a plastic yield stress are subjected
Fig. 10. (a) Gibson–Ashby model for closed-cell fo
to plastic collapse when load beyond the linear elastic re-gime. When plastic collapse occurs, there is a long hor-izontal plateau in the stress–strain curve. Eq. (4)represents the response of a closed-cell foam schemati-cally represented in Fig. 10
r�pl
rys
¼ C5 /q�
qS
� �3=2
þ ð1� /Þ q�
qS
þ p0 � patrys
; ð4Þ
where r�pl is the plastic collapse stress of foam, rys is the
yield stress of the solid portion, C5 is a parameter, / isthe ratio of volume of face to volume of edge, p0 is theinitial fluid pressure, and pat is the atmospheric pressure.
For the open cell geometry, the parameter / inEq. (4) is equal to 1. Additionally, the pressure is un-changed, i.e., p0 � pat = 0. Thus, Eq. (4) is reduced to
r�pl
rys
¼ C5
q�
qS
� �3=2
. ð5Þ
This is the open cell equation from Gibson and Ashby[27]. The parameter C5 has an experimentally obtainedvalue [27] of 0.3 for plastic collapse and 0.2 for brittlecrushing (where r�
pl=rys in Eqs. (4) and (5) is replacedby the normalized crushing stress r�
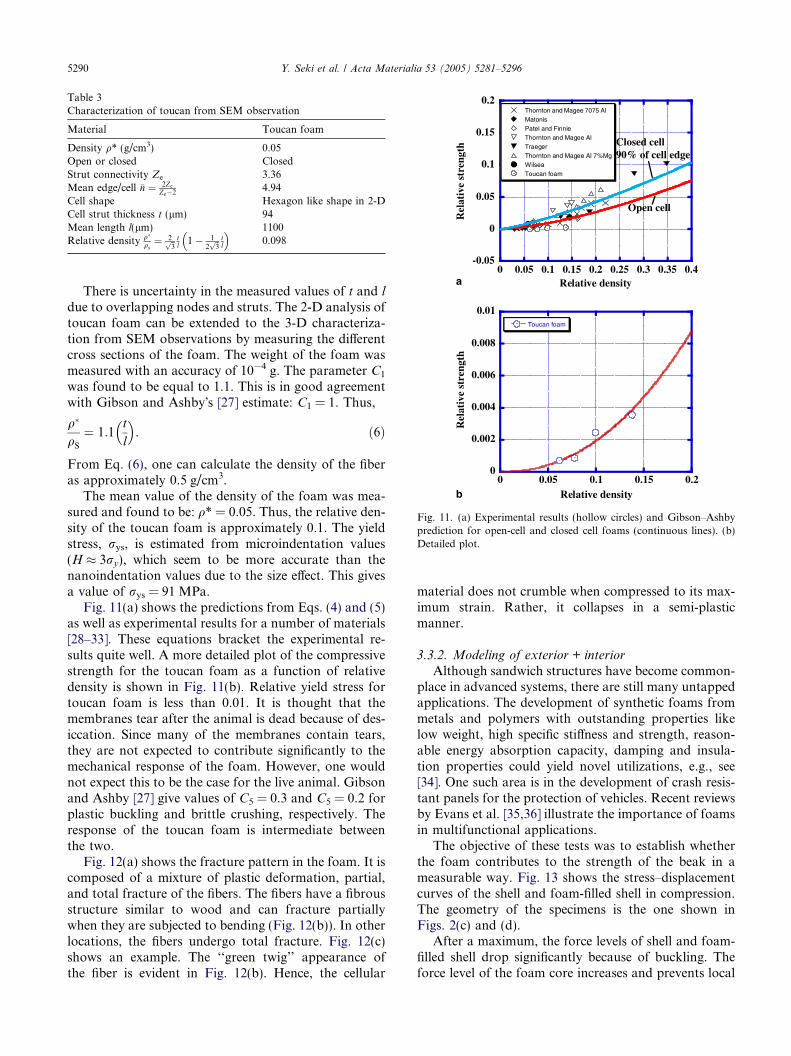
cr=rfsÞ.The cell shape of toucan foam was characterized by
measuring the mean strut connectivity at the vertex, Ze
from SEM pictures. Table 3 shows the parameters usedin the characterization of the toucan foam. Euler�s lawfor honeycombs was used to determine the mean num-ber of struts per node, �n [27]. The connectivity and num-ber of struts per node were found to have mean values ofZe � 3.36 and �n � 4:9, respectively. The shape of theclosed cells is assumed to be hexagonal in 2-D. Themean length of struts including node thickness was esti-mated from 10 struts (SEM micrographs) and theparameters, t and l, measured to be 94 and 1100 lm,respectively. The Gibson–Ashby equation for a geomet-rical configuration of regular hexagons was applied,yielding a relative density of 0.098.
am and (b) deformation of closed cell foam.
Table 3Characterization of toucan from SEM observation
Material Toucan foam
Density q* (g/cm3) 0.05Open or closed ClosedStrut connectivity Ze 3.36Mean edge/cell �n ¼ 2Ze
Ze�2 4.94Cell shape Hexagon like shape in 2-DCell strut thickness t (lm) 94Mean length l(lm) 1100Relative density q�
qs¼ 2ffiffi
3p t
l 1� 12ffiffi3
p tl
� �0.098
-0.05
0
0.05
0.1
0.15
0.2
0 0.05 0.1 0.15 0.2 0.25 0.3 0.35 0.4
Thornton and Magee 7075 AlMatonisPatel and FinnieThornton and Magee AlTraegerThornton and Magee Al 7%MgWilseaToucan foam
Rel
ativ
e st
reng
th
Relative density
Closed cell90% of cell edge
Open cell
0
0.002
0.004
0.006
0.008
0.01
0 0.05 0.1 0.15 0.2
Toucan foam
Rel
ativ
e st
reng
th
Relative density
a
b
Fig. 11. (a) Experimental results (hollow circles) and Gibson–Ashbyprediction for open-cell and closed cell foams (continuous lines). (b)Detailed plot.
5290 Y. Seki et al. / Acta Materialia 53 (2005) 5281–5296
There is uncertainty in the measured values of t and l
due to overlapping nodes and struts. The 2-D analysis oftoucan foam can be extended to the 3-D characteriza-tion from SEM observations by measuring the differentcross sections of the foam. The weight of the foam wasmeasured with an accuracy of 10�4 g. The parameter C1
was found to be equal to 1.1. This is in good agreementwith Gibson and Ashby�s [27] estimate: C1 = 1. Thus,
q�
qS
¼ 1:1tl
� �. ð6Þ
From Eq. (6), one can calculate the density of the fiberas approximately 0.5 g/cm3.
The mean value of the density of the foam was mea-sured and found to be: q* = 0.05. Thus, the relative den-sity of the toucan foam is approximately 0.1. The yieldstress, rys, is estimated from microindentation values(H � 3ry), which seem to be more accurate than thenanoindentation values due to the size effect. This givesa value of rys = 91 MPa.
Fig. 11(a) shows the predictions from Eqs. (4) and (5)as well as experimental results for a number of materials[28–33]. These equations bracket the experimental re-sults quite well. A more detailed plot of the compressivestrength for the toucan foam as a function of relativedensity is shown in Fig. 11(b). Relative yield stress fortoucan foam is less than 0.01. It is thought that themembranes tear after the animal is dead because of des-iccation. Since many of the membranes contain tears,they are not expected to contribute significantly to themechanical response of the foam. However, one wouldnot expect this to be the case for the live animal. Gibsonand Ashby [27] give values of C5 = 0.3 and C5 = 0.2 forplastic buckling and brittle crushing, respectively. Theresponse of the toucan foam is intermediate betweenthe two.
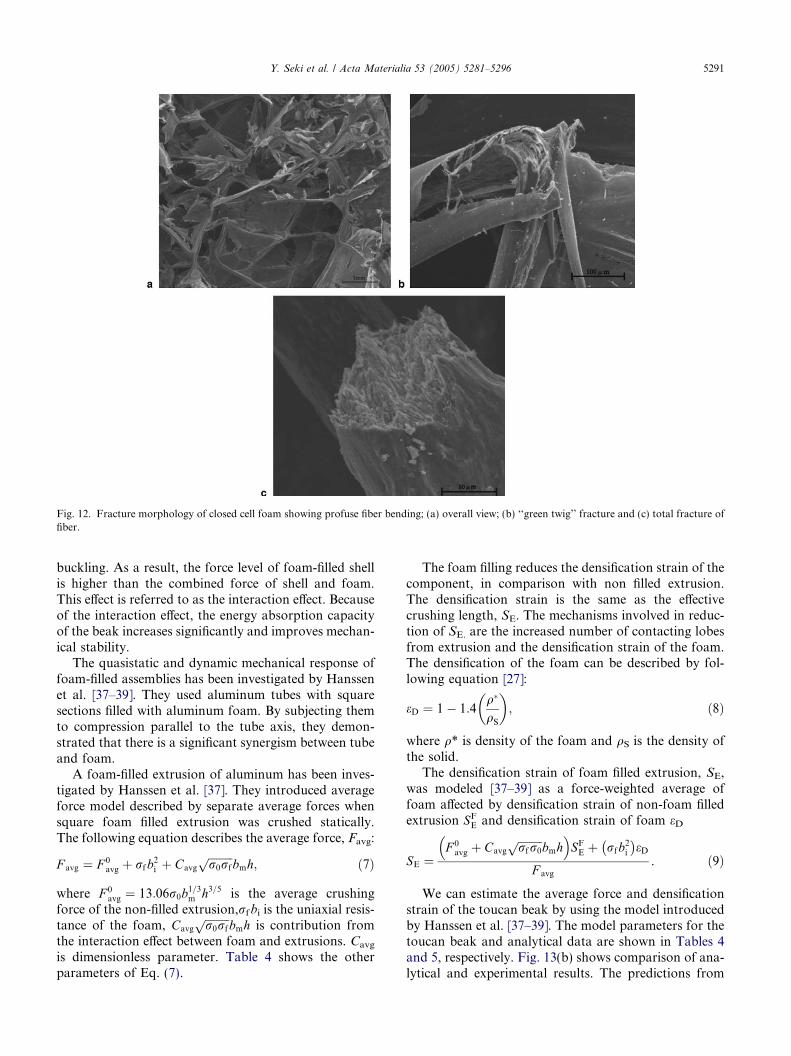
Fig. 12(a) shows the fracture pattern in the foam. It iscomposed of a mixture of plastic deformation, partial,and total fracture of the fibers. The fibers have a fibrousstructure similar to wood and can fracture partiallywhen they are subjected to bending (Fig. 12(b)). In otherlocations, the fibers undergo total fracture. Fig. 12(c)shows an example. The ‘‘green twig’’ appearance ofthe fiber is evident in Fig. 12(b). Hence, the cellular
material does not crumble when compressed to its max-imum strain. Rather, it collapses in a semi-plasticmanner.
3.3.2. Modeling of exterior + interior
Although sandwich structures have become common-place in advanced systems, there are still many untappedapplications. The development of synthetic foams frommetals and polymers with outstanding properties likelow weight, high specific stiffness and strength, reason-able energy absorption capacity, damping and insula-tion properties could yield novel utilizations, e.g., see[34]. One such area is in the development of crash resis-tant panels for the protection of vehicles. Recent reviewsby Evans et al. [35,36] illustrate the importance of foamsin multifunctional applications.
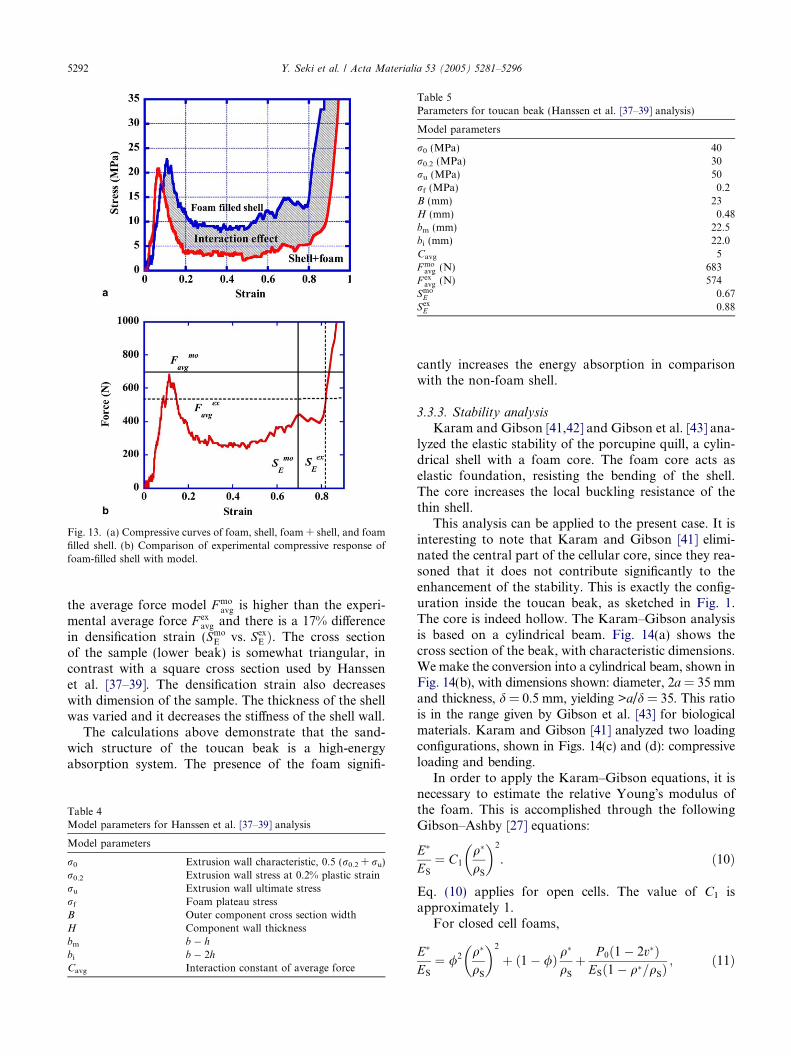
The objective of these tests was to establish whetherthe foam contributes to the strength of the beak in ameasurable way. Fig. 13 shows the stress–displacementcurves of the shell and foam-filled shell in compression.The geometry of the specimens is the one shown inFigs. 2(c) and (d).
After a maximum, the force levels of shell and foam-filled shell drop significantly because of buckling. Theforce level of the foam core increases and prevents local
Fig. 12. Fracture morphology of closed cell foam showing profuse fiber bending; (a) overall view; (b) ‘‘green twig’’ fracture and (c) total fracture offiber.
Y. Seki et al. / Acta Materialia 53 (2005) 5281–5296 5291
buckling. As a result, the force level of foam-filled shellis higher than the combined force of shell and foam.This effect is referred to as the interaction effect. Becauseof the interaction effect, the energy absorption capacityof the beak increases significantly and improves mechan-ical stability.
The quasistatic and dynamic mechanical response offoam-filled assemblies has been investigated by Hanssenet al. [37–39]. They used aluminum tubes with squaresections filled with aluminum foam. By subjecting themto compression parallel to the tube axis, they demon-strated that there is a significant synergism between tubeand foam.
A foam-filled extrusion of aluminum has been inves-tigated by Hanssen et al. [37]. They introduced averageforce model described by separate average forces whensquare foam filled extrusion was crushed statically.The following equation describes the average force, Favg:
F avg ¼ F 0avg þ rfb
2i þ Cavg
ffiffiffiffiffiffiffiffiffir0rf
pbmh; ð7Þ
where F 0avg ¼ 13:06r0b
1=3m h3=5 is the average crushing
force of the non-filled extrusion,rfbi is the uniaxial resis-tance of the foam, Cavg
ffiffiffiffiffiffiffiffiffir0rf
pbmh is contribution from
the interaction effect between foam and extrusions. Cavg
is dimensionless parameter. Table 4 shows the otherparameters of Eq. (7).
The foam filling reduces the densification strain of thecomponent, in comparison with non filled extrusion.The densification strain is the same as the effectivecrushing length, SE. The mechanisms involved in reduc-tion of SE. are the increased number of contacting lobesfrom extrusion and the densification strain of the foam.The densification of the foam can be described by fol-lowing equation [27]:
eD ¼ 1� 1:4q�
qS
� �; ð8Þ
where q* is density of the foam and qS is the density ofthe solid.
The densification strain of foam filled extrusion, SE,was modeled [37–39] as a force-weighted average offoam affected by densification strain of non-foam filledextrusion SF
E and densification strain of foam eD
SE ¼F 0
avg þ Cavgffiffiffiffiffiffiffiffiffirfr0
pbmh
� �SFE þ rfb
2i
� �eD
F avg
. ð9Þ
We can estimate the average force and densificationstrain of the toucan beak by using the model introducedby Hanssen et al. [37–39]. The model parameters for thetoucan beak and analytical data are shown in Tables 4and 5, respectively. Fig. 13(b) shows comparison of ana-lytical and experimental results. The predictions from
Fig. 13. (a) Compressive curves of foam, shell, foam + shell, and foamfilled shell. (b) Comparison of experimental compressive response offoam-filled shell with model.
Table 5Parameters for toucan beak (Hanssen et al. [37–39] analysis)
5292 Y. Seki et al. / Acta Materialia 53 (2005) 5281–5296
the average force model F moavg is higher than the experi-
mental average force F exavg and there is a 17% difference
in densification strain (SmoE vs. Sex
E Þ. The cross sectionof the sample (lower beak) is somewhat triangular, incontrast with a square cross section used by Hanssenet al. [37–39]. The densification strain also decreaseswith dimension of the sample. The thickness of the shellwas varied and it decreases the stiffness of the shell wall.
The calculations above demonstrate that the sand-wich structure of the toucan beak is a high-energyabsorption system. The presence of the foam signifi-
Table 4Model parameters for Hanssen et al. [37–39] analysis
bi b � 2hCavg Interaction constant of average force
cantly increases the energy absorption in comparisonwith the non-foam shell.
3.3.3. Stability analysisKaram and Gibson [41,42] and Gibson et al. [43] ana-
lyzed the elastic stability of the porcupine quill, a cylin-drical shell with a foam core. The foam core acts aselastic foundation, resisting the bending of the shell.The core increases the local buckling resistance of thethin shell.
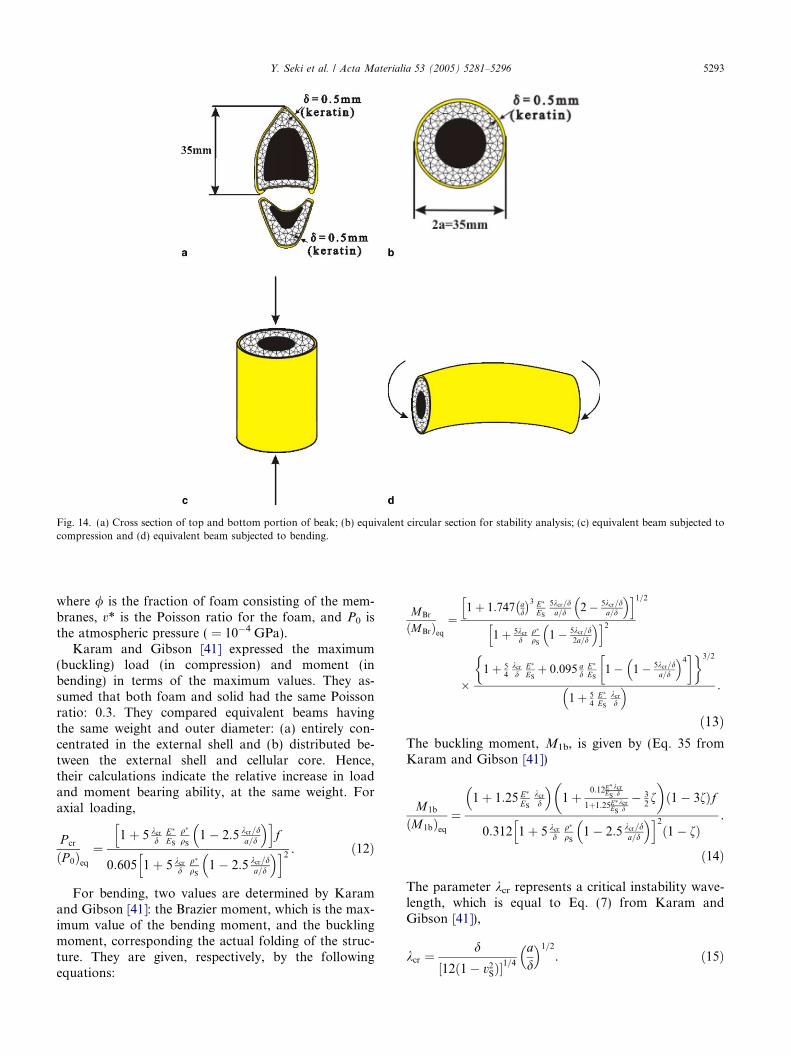
This analysis can be applied to the present case. It isinteresting to note that Karam and Gibson [41] elimi-nated the central part of the cellular core, since they rea-soned that it does not contribute significantly to theenhancement of the stability. This is exactly the config-uration inside the toucan beak, as sketched in Fig. 1.The core is indeed hollow. The Karam–Gibson analysisis based on a cylindrical beam. Fig. 14(a) shows thecross section of the beak, with characteristic dimensions.We make the conversion into a cylindrical beam, shown inFig. 14(b), with dimensions shown: diameter, 2a = 35 mmand thickness, d = 0.5 mm, yielding >a/d = 35. This ratiois in the range given by Gibson et al. [43] for biologicalmaterials. Karam and Gibson [41] analyzed two loadingconfigurations, shown in Figs. 14(c) and (d): compressiveloading and bending.
In order to apply the Karam–Gibson equations, it isnecessary to estimate the relative Young�s modulus ofthe foam. This is accomplished through the followingGibson–Ashby [27] equations:
E�
ES
¼ C1
q�
qS
� �2
. ð10Þ
Eq. (10) applies for open cells. The value of C1 isapproximately 1.
For closed cell foams,
E�
ES
¼ /2 q�
qS
� �2
þ 1� /ð Þ q�
qS
þ P 0 1� 2v�ð ÞES 1� q�=qSð Þ ; ð11Þ
Fig. 14. (a) Cross section of top and bottom portion of beak; (b) equivalent circular section for stability analysis; (c) equivalent beam subjected tocompression and (d) equivalent beam subjected to bending.
Y. Seki et al. / Acta Materialia 53 (2005) 5281–5296 5293
where / is the fraction of foam consisting of the mem-branes, v* is the Poisson ratio for the foam, and P0 isthe atmospheric pressure ( = 10�4 GPa).
Karam and Gibson [41] expressed the maximum(buckling) load (in compression) and moment (inbending) in terms of the maximum values. They as-sumed that both foam and solid had the same Poissonratio: 0.3. They compared equivalent beams havingthe same weight and outer diameter: (a) entirely con-centrated in the external shell and (b) distributed be-tween the external shell and cellular core. Hence,their calculations indicate the relative increase in loadand moment bearing ability, at the same weight. Foraxial loading,
P cr
P 0ð Þeq¼
1þ 5 kcrd
E�
ES
q�
qS1� 2:5 kcr=d
a=d
� �h if
0:605 1þ 5 kcrd
q�
qS1� 2:5 kcr=d
a=d
� �h i2 . ð12Þ
For bending, two values are determined by Karamand Gibson [41]: the Brazier moment, which is the max-imum value of the bending moment, and the bucklingmoment, corresponding the actual folding of the struc-ture. They are given, respectively, by the followingequations:
MBr
MBrð Þeq¼
1þ 1:747 ad
� �3 E�
ES
5kcr=da=d 2� 5kcr=d
a=d
� �h i
1þ 5kcrd
q�
qS1� 5kcr=d
2a=d
� �h i21=2
�1þ 5
4kcrd
E�
ESþ 0:095 a
dE�
ES1� 1� 5kcr=d
a=d
� �4� �3=2
1þ 54
E�
ES
kcrd
� � .
ð13ÞThe buckling moment, M1b, is given by (Eq. 35 fromKaram and Gibson [41])
M1b
M1bð Þeq¼
1þ 1:25 E�
ES
kcrd
� �1þ 0:12E
�ES
kcrd
1þ1:25E�
ESkcrd
� 32f
� �1� 3fð Þf
0:312 1þ 5 kcrd
q�
qS1� 2:5 kcr=d
a=d
� �h i21� fð Þ
.
ð14Þ
The parameter kcr represents a critical instability wave-length, which is equal to Eq. (7) from Karam andGibson [41]),
kcr ¼d
12 1� v2Sð Þ½ �1=4ad
� �1=2
. ð15Þ
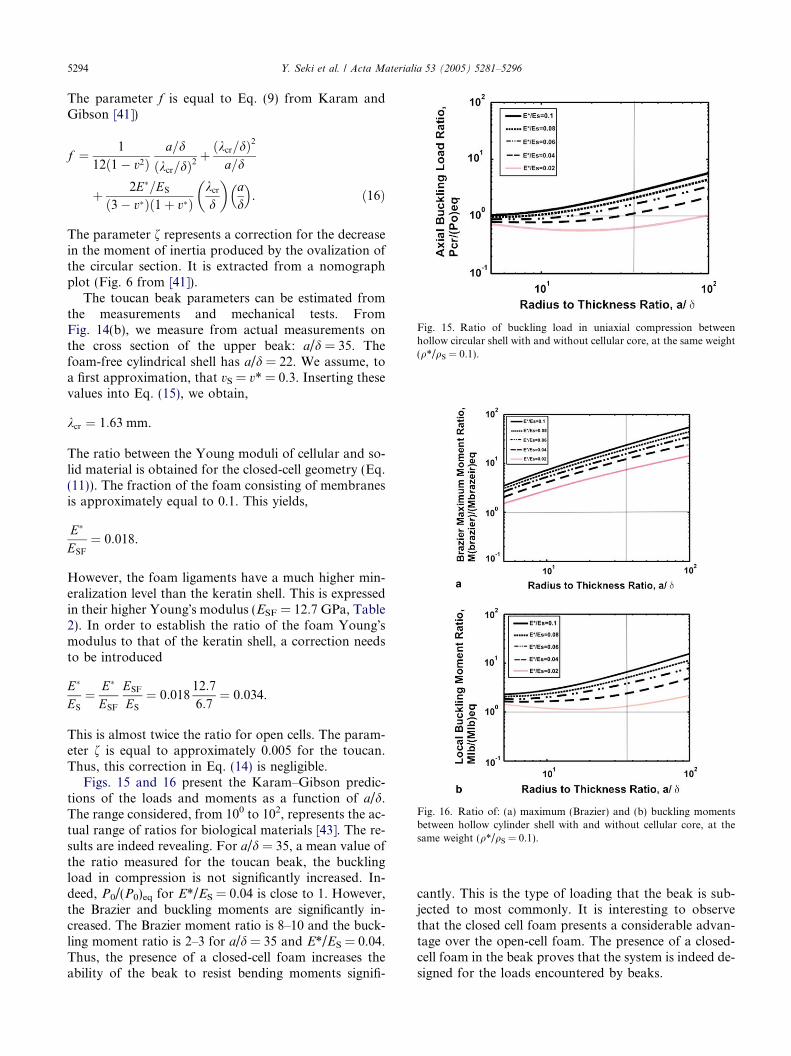
Fig. 15. Ratio of buckling load in uniaxial compression betweenhollow circular shell with and without cellular core, at the same weight(q*/qS = 0.1).
Fig. 16. Ratio of: (a) maximum (Brazier) and (b) buckling momentsbetween hollow cylinder shell with and without cellular core, at thesame weight (q*/qS = 0.1).
5294 Y. Seki et al. / Acta Materialia 53 (2005) 5281–5296
The parameter f is equal to Eq. (9) from Karam andGibson [41])
f ¼ 1
12 1� v2ð Þa=d
kcr=dð Þ2þ kcr=dð Þ2
a=d
þ 2E�=ES
3� v�ð Þ 1þ v�ð Þkcrd
� �ad
� �. ð16Þ
The parameter f represents a correction for the decreasein the moment of inertia produced by the ovalization ofthe circular section. It is extracted from a nomographplot (Fig. 6 from [41]).
The toucan beak parameters can be estimated fromthe measurements and mechanical tests. FromFig. 14(b), we measure from actual measurements onthe cross section of the upper beak: a/d = 35. Thefoam-free cylindrical shell has a/d = 22. We assume, toa first approximation, that vS = v* = 0.3. Inserting thesevalues into Eq. (15), we obtain,
kcr ¼ 1:63 mm.
The ratio between the Young moduli of cellular and so-lid material is obtained for the closed-cell geometry (Eq.(11)). The fraction of the foam consisting of membranesis approximately equal to 0.1. This yields,
E�
ESF
¼ 0:018.
However, the foam ligaments have a much higher min-eralization level than the keratin shell. This is expressedin their higher Young�s modulus (ESF = 12.7 GPa, Table2). In order to establish the ratio of the foam Young�smodulus to that of the keratin shell, a correction needsto be introduced
E�
ES
¼ E�
ESF
ESF
ES
¼ 0:01812:7
6:7¼ 0:034.
This is almost twice the ratio for open cells. The param-eter f is equal to approximately 0.005 for the toucan.Thus, this correction in Eq. (14) is negligible.
Figs. 15 and 16 present the Karam–Gibson predic-tions of the loads and moments as a function of a/d.The range considered, from 100 to 102, represents the ac-tual range of ratios for biological materials [43]. The re-sults are indeed revealing. For a/d = 35, a mean value ofthe ratio measured for the toucan beak, the bucklingload in compression is not significantly increased. In-deed, P0/(P0)eq for E*/ES = 0.04 is close to 1. However,the Brazier and buckling moments are significantly in-creased. The Brazier moment ratio is 8–10 and the buck-ling moment ratio is 2–3 for a/d = 35 and E*/ES = 0.04.Thus, the presence of a closed-cell foam increases theability of the beak to resist bending moments signifi-
cantly. This is the type of loading that the beak is sub-jected to most commonly. It is interesting to observethat the closed cell foam presents a considerable advan-tage over the open-cell foam. The presence of a closed-cell foam in the beak proves that the system is indeed de-signed for the loads encountered by beaks.
Y. Seki et al. / Acta Materialia 53 (2005) 5281–5296 5295
4. Conclusion
This study of the correlation between the mechanicalproperties and structure of the toucan beak reveals asynergism between the external keratin shell and a cellu-lar interior with a hollow core which optimizes the sta-bility of the structure. The following are the principalconclusions:
� The external shell is composed of keratin scales with adiameter of approximately 50 lm and thickness of1 lm. These keratin scales are glued together in astaggered pattern, leading to a total thickness of0.5 mm.
� The keratin shell exhibited a failure mode that wasstrain-rate dependent. At 5 · 10�5/s, failure occurredby pullout of the scales. At 1.5 · 10�3/s, failure tookplace by fracture of the scales. It is proposed that theviscoplastic response of the glue is responsible for thechange in failure mode.
� The foam that comprises the inside of the beak isclosed cell foam. The ligaments are made of a proteinrich in calcium, providing it with greater stiffness,whereas the membranes have a composition similarto the keratin shell. The toucan beak keratin has sim-ilar mechanical response and molecular structure toavian claw.
� The deformation behavior of the toucan foam incompression occurs by a mixture of brittle crushingand ductile bending ligaments. It was successfullymodeled by the by Gibson–Ashby constitutive equa-tion for closed and open cell configurations.
� The combined response of the shell and foam corewas compared with the analysis proposed by Hanssenet al. [37]. The analysis reveals that there is a synergybetween the shell and the foam, i.e., the energyabsorbed by the shell + foam assembly is higher thanthe sum of the energies absorbed by shell and foamseparately. We modeled interaction effect betweenfoam and shell by using model introduced by Hans-sen et al. [37].
� A stability analysis using the approach developed byKaram and Gibson [41] demonstrates that the com-pressive and bending buckling loads for the sandwichstructure of the beak are higher than a structure ofthe same weight having no foam (and a correspond-ingly higher shell thickness).
Acknowledgements
This research was inspired by a hunting trip taken byone of us (M.A.M.) 40 years ago. Walking through theforest with his father, the co-author found a toucan skel-eton. He lifted the beak and was struck by its light
weight and mechanical robustness. Hence, a posthu-mous acknowledgement is given to H. Meyers. Wethank Dr. Bimal Kad for providing the Universal Test-ing Machine and for generous help in carrying out themechanical tests in his laboratory. The authors thankRobert Bailey for help with tensile tests. A special grat-itude goes to Professor Franck Talke and his studentsY. Matsuda and Y. C. Yoon for enabling the nanoin-dentation tests. Franck Grignon provided valuable help.The authors thank Evelyn York for assisting scanningelectron microscopy and H. Jarmakani for generoushelp with the calculations. This research was partiallysupported by the Department of Energy through GrantsDEFG0398DP00212 and DEFG0300SF2202.
References
[1] Sarikaya M. Microsc Res Tech 1994;27:360–75.[2] Srinivasan AV, Haritos GK, Hedberg FL. Appl Mech Rev
1991;44:463–82.[3] Vincent JFV. Structural biomaterials. Princeton (NJ): Princeton
University Pres; 1991.[4] Baer E, Hiltner A, Morgan RJ. Phys Today 1992;45:60–7.[5] Mann S. Biomineralization. Oxford: Oxford University Press;
2001.[6] Laraia JV, Heuer AH. J Am Ceram Soc 1989;72:2177–9.[7] Menig R, Meyers MH, Meyers MA, Vecchio KS. Acta Mater
2000;48:2383–98.[8] Menig R, Meyers MH, Meyers MA, Vecchio KS. Mater Sci Eng
2001;A297:203–11.[9] Lin A, Meyers MA. Mater Sci and Eng 2005;390:27–418.[10] Mayer G, Sarikaya M. Exp Mech 2002;4:395.[11] Karam GN, Gibson LJ. Mater Sci Eng C 1994;2:113–32.[12] Bonser RHC, Witter MS. Condor 1993;95:736–8.[13] Fraser RD, Macrae TP. The mechanical properties of biological
[14] Pautard FGE. Nature 1963;199:531–5.[15] Bonser RHC, Purslow PP. J Exp Biol 1995;198:1029–33.[16] Bonser RHC. J Mater Sci Lett 2000;19:1039–40.[17] Cameron CJ, Wess TJ, Bonser RHC. J Struct Biol 2003;
143:118–23.[18] Frenkel MJ, Gillespies JM. Aust J Bio Sci 1976;29:467–79.[19] Qian L, Li M, Zhou Z, Yang H, Shi X. Surf Coat Technol
2005;195:264–71.[20] Rho JY, Roy ME, Tsui TY, Pharr,GM. In: Transactions of the
43th annual meeting of the Orthopaedic Research Society, SanFrancisco (CA); 1997. p. 811.
[21] Rho JY, Liisa KS, Zioupos P. Med Eng Phys 1998;20:92–102.[22] Meyers MA, Chawla KK. Mechanical metallurgy. NJ: Prentice
Hall; 1984. p. 619.[23] Brush AH. Biochem Syst Ecol 1986;14:547–51.[24] Brush AH, Wyld JA. Comp Biochem Physiol 1982;73B:313–25.[25] Kasapi MA, Gosline JM. J Exp Biol 1996;199:1133–46.[26] Bonser RHC. J Mater Sci Lett 2002;21:1563–4.[27] Gibson L, Ashby MF. Cellular solids: structure and properties.
2nd ed. Cambridge: Cambridge University Press; 1997.[28] Traeger RK. J Cell Plast 1967;3:405–18.[29] Matonis VA. Soc Plast Eng J 1964(September):1024.[30] Thornton PH, Magee CL. Metall Trans 1975;6A:1253.[31] Thornton PH, Magee CL. Metall Trans 1975;6A:1801.[32] Wilsea M, Johnson KL, Ashby MF. Int J Mech Sci 1975;17:457.
5296 Y. Seki et al. / Acta Materialia 53 (2005) 5281–5296
[33] Patel MR, Finnie I. J Mater 1970;5:909.[34] Band J, Dilger K. Einsatz struktureller polymer-schaume zur
optimierung von automobilkarossen. In: Wielage B, Leonhardt G,editors. Verbundwerkstoffe und Werkstoffverbunde. Wein-heim: Wiley-VCH; 2001. p. 507–11.