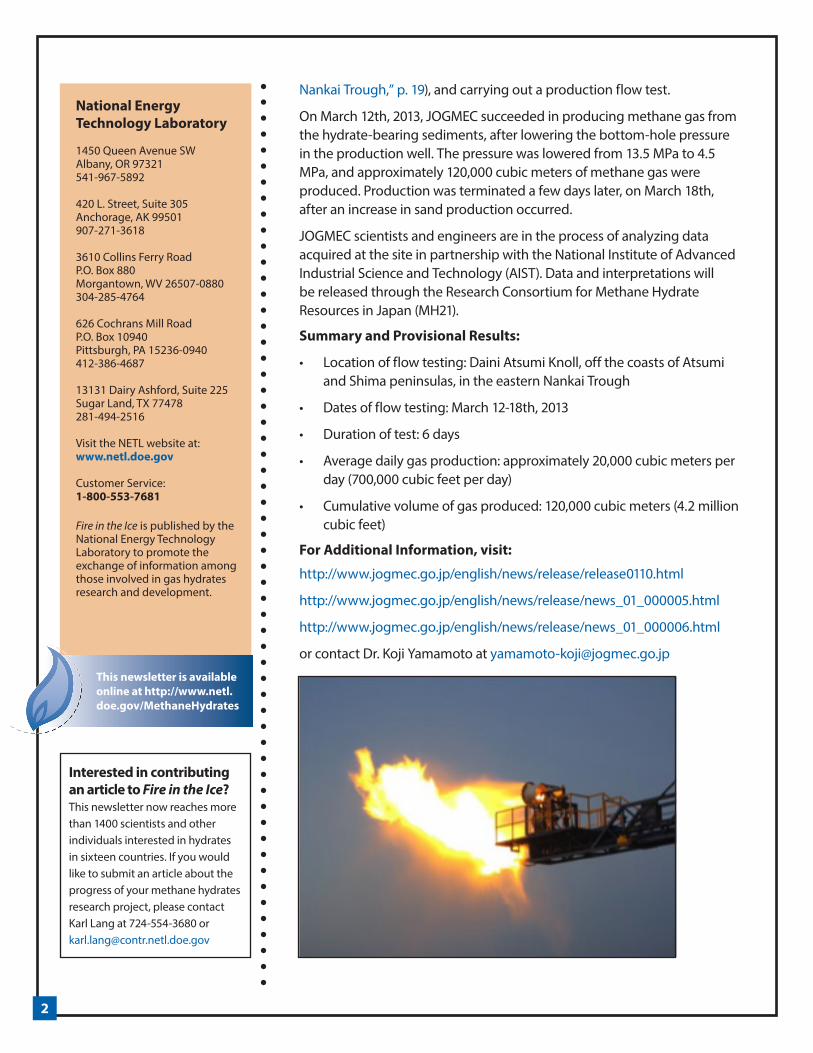
1 CONTENTS Japan Completes First Offshore Production Test ............................. 1 New Seismic Data Over Known Hydrate Occurrences in the Deepwater Gulf of Mexico......... 3 Gas Hydrate Reservoirs in the Offshore Caribbean Region of Colombia .......................................... 7 CSEM Survey of a Methane Vent Site, Offshore West Svalbard...12 Pressure Core Analysis Tools Used to Characterize Hydrate- Bearing Sediments from The Nankai Trough ..............................19 Using Noble Gas Signatures to Fingerprint Gas Streams Derived from Dissociating Methane Hydrate .......................................... 23 Announcements ...................... 27 • North Slope Oil and Gas Lands Set Aside for Methane Hydrate Research • 2014 Offshore Technology Conference to Have Sessions on Methane Hydrates • Gordon Research Conference on Gas Hydrate Systems • New Book on Hydrate Resources in the Deepwater Arctic Ocean Spotlight on Research .......... 30 J. Carlos Santamarina CONTACT Ray Boswell Technology Manager—Natural Gas Technologies, Strategic Center for Natural Gas and Oil 412-386-7614 [email protected]Methane Hydrate Newsletter 2013 Vol. 13, Issue 2 J APAN COMPLETES F IRST OFFSHORE METHANE HYDRATE PRODUCTION T EST —METHANE SUCCESSFULLY PRODUCED FROM DEEPWATER HYDRATE LAYERS To prove the applicability of depressurization as a feasible method for producing methane from hydrates in deepwater sediments, Japan Oil, Gas, and Metals National Corporation (JOGMEC) conducted the first offshore methane hydrate production test off the coast of Honshu Island this past March, with funding from the Ministry of Economic Trade and Industry. The production test site is located on the margin of the Daini Atsumi Knoll, off the coasts of Atsumi and Shima peninsulas, in the eastern Nankai Trough, Japan. The site was selected based on seismic and well data collected from 2001-2008 that indicate methane hydrate-rich sedimentary layers in this area. Field work for the production test began in early 2012 and was staged from the “Chikyu” drilling vessel. The field program included drilling a production well and two monitoring wells, acquiring extensive downhole data including pressure core samples (see related article, “Pressure Core Analysis Tools Used to Characterize Hydrate-bearing Sediments from the Figure 1. Methane gas flare resulting from methane hydrate de-pressurization test, Daini Atsumi Knoll, eastern Nankai Trough, Japan. Photo credit: JOGMEC
Transcript
1
CONTENTSJapan Completes First Offshore Production Test .............................1New Seismic Data Over Known Hydrate Occurrences in the Deepwater Gulf of Mexico .........3Gas Hydrate Reservoirs in the Offshore Caribbean Region of Colombia ..........................................7CSEM Survey of a Methane Vent Site, Offshore West Svalbard...12Pressure Core Analysis Tools Used to Characterize Hydrate-Bearing Sediments from The Nankai Trough ..............................19Using Noble Gas Signatures to Fingerprint Gas Streams Derived from Dissociating Methane Hydrate .......................................... 23Announcements ...................... 27• North Slope Oil and Gas Lands
Set Aside for Methane Hydrate Research
• 2014 Offshore Technology Conference to Have Sessions on Methane Hydrates
• Gordon Research Conference on Gas Hydrate Systems
• New Book on Hydrate Resources in the Deepwater Arctic Ocean
Spotlight on Research .......... 30 J. Carlos Santamarina
CONTACTRay Boswell Technology Manager—Natural Gas Technologies, Strategic Center for Natural Gas and Oil
Japan Completes First oFFshore methane hydrate produCtion test—methane suCCessFully produCed From deepwater hydrate layers
To prove the applicability of depressurization as a feasible method for producing methane from hydrates in deepwater sediments, Japan Oil, Gas, and Metals National Corporation (JOGMEC) conducted the first offshore methane hydrate production test off the coast of Honshu Island this past March, with funding from the Ministry of Economic Trade and Industry. The production test site is located on the margin of the Daini Atsumi Knoll, off the coasts of Atsumi and Shima peninsulas, in the eastern Nankai Trough, Japan. The site was selected based on seismic and well data collected from 2001-2008 that indicate methane hydrate-rich sedimentary layers in this area.
Field work for the production test began in early 2012 and was staged from the “Chikyu” drilling vessel. The field program included drilling a production well and two monitoring wells, acquiring extensive downhole data including pressure core samples (see related article, “Pressure Core Analysis Tools Used to Characterize Hydrate-bearing Sediments from the
Nankai Trough,” p. 19), and carrying out a production flow test.
On March 12th, 2013, JOGMEC succeeded in producing methane gas from the hydrate-bearing sediments, after lowering the bottom-hole pressure in the production well. The pressure was lowered from 13.5 MPa to 4.5 MPa, and approximately 120,000 cubic meters of methane gas were produced. Production was terminated a few days later, on March 18th, after an increase in sand production occurred.
JOGMEC scientists and engineers are in the process of analyzing data acquired at the site in partnership with the National Institute of Advanced Industrial Science and Technology (AIST). Data and interpretations will be released through the Research Consortium for Methane Hydrate Resources in Japan (MH21).
Summary and Provisional Results:
• Location of flow testing: Daini Atsumi Knoll, off the coasts of Atsumi and Shima peninsulas, in the eastern Nankai Trough
• Dates of flow testing: March 12-18th, 2013
• Duration of test: 6 days
• Average daily gas production: approximately 20,000 cubic meters per day (700,000 cubic feet per day)
• Cumulative volume of gas produced: 120,000 cubic meters (4.2 million cubic feet)
626 Cochrans Mill RoadP.O. Box 10940Pittsburgh, PA 15236-0940412-386-4687
13131 Dairy Ashford, Suite 225 Sugar Land, TX 77478 281-494-2516
Visit the NETL website at:www.netl.doe.gov
Customer Service:1-800-553-7681
Fire in the Ice is published by the National Energy Technology Laboratory to promote the exchange of information among those involved in gas hydrates research and development.
Interested in contributing an article to Fire in the Ice?This newsletter now reaches morethan 1400 scientists and otherindividuals interested in hydratesin sixteen countries. If you wouldlike to submit an article about theprogress of your methane hydratesresearch project, please contactKarl Lang at 724-554-3680 [email protected]
This newsletter is available online at http://www.netl.doe.gov/MethaneHydrates
new seismiC data aCquired over Known Gas hydrate oCCurrenCes in the deepwater GulF oF mexiCoBy Seth Haines, USGS, Denver, CO; Patrick Hart, USGS, Santa Cruz, CA; Carolyn Ruppel, USGS, Woods Hole, MA
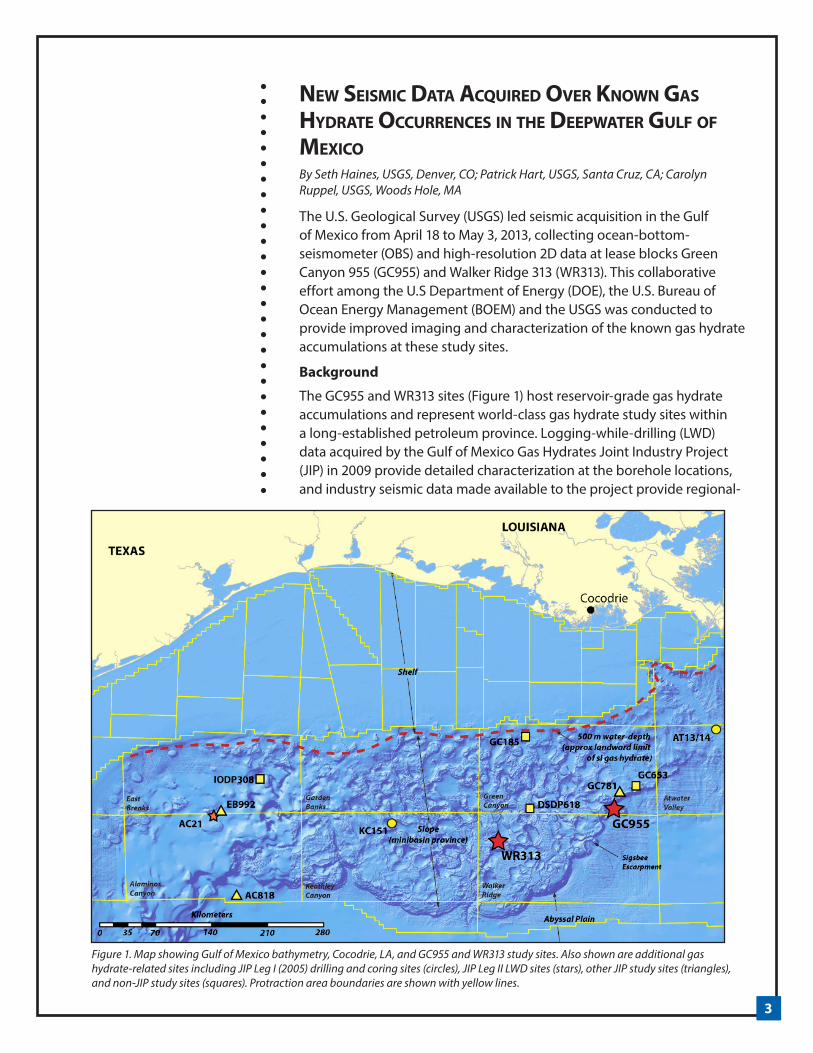
The U.S. Geological Survey (USGS) led seismic acquisition in the Gulf of Mexico from April 18 to May 3, 2013, collecting ocean-bottom-seismometer (OBS) and high-resolution 2D data at lease blocks Green Canyon 955 (GC955) and Walker Ridge 313 (WR313). This collaborative effort among the U.S Department of Energy (DOE), the U.S. Bureau of Ocean Energy Management (BOEM) and the USGS was conducted to provide improved imaging and characterization of the known gas hydrate accumulations at these study sites.
Background
The GC955 and WR313 sites (Figure 1) host reservoir-grade gas hydrate accumulations and represent world-class gas hydrate study sites within a long-established petroleum province. Logging-while-drilling (LWD) data acquired by the Gulf of Mexico Gas Hydrates Joint Industry Project (JIP) in 2009 provide detailed characterization at the borehole locations, and industry seismic data made available to the project provide regional-
Figure 1. Map showing Gulf of Mexico bathymetry, Cocodrie, LA, and GC955 and WR313 study sites. Also shown are additional gas hydrate-related sites including JIP Leg I (2005) drilling and coring sites (circles), JIP Leg II LWD sites (stars), other JIP study sites (triangles), and non-JIP study sites (squares). Protraction area boundaries are shown with yellow lines.
4
and local-scale structural and stratigraphic constraints on the presence of gas hydrates. The LWD data from GC955 indicate thick sand intervals (up to 99 m) containing gas hydrate saturations as high as 80%, and the data from WR313 indicate a sequence of thinner sands with gas hydrate saturations locally as high as 90%.
Significant questions remain regarding variations in the geometry, lithology, and gas hydrate saturation of the accumulations, and this prompted the DOE, the BOEM, and the USGS to implement a new seismic data acquisition program. Seafloor multicomponent seismic data were collected to provide valuable characterization information by recording both compressional (P) waves and shear (S) waves. In addition, dedicated high-resolution streamer seismic data were acquired to enable substantially more detailed interpretations of structural and stratigraphic features associated with the gas hydrate systems. The 2013 geophysical program is significant as a unique case where seismic acquisition has been specifically tailored to image and characterize confirmed reservoir-sand-hosted gas hydrate accumulations for which full research-level well log data sets exist.
2013 Seismic Acquisition
We conducted seismic acquisition aboard the R/V Pelican, a Universities National Oceanographic Laboratories System vessel owned and operated
Figure 3. Tim Kane and Peter Lemmond (OPSIP) deploying OBS from R/V Pelican.
Figure 2. Pete Dal Ferro (USGS) supervising air gun deployment from R/V Pelican stern. Two air guns (silver cylinders) are suspended below orange float buoys.
5
by the Louisiana Universities Marine Consortium, LUMCON. We used USGS-owned equipment augmented by borrowed and leased items as necessary. We employed a pair of 105/105 in3 generator/injector air guns (Figure 2) to provide seismic energy in the range of 50 to 250 Hz. We recorded seafloor data using a total of 25 OBS deployed via strategic free fall from the ship (Figure 3). We recorded 2D data using a 450-m 72-channel digital hydrophone streamer towed behind the vessel (Figure 4). The OBS were provided by the Woods Hole Oceanographic Institution (WHOI) Ocean-Bottom Seismometer Instrument Pool (OBSIP), which is administered by the National Science Foundation. These included 15 instruments owned and maintained by the USGS and were model D2, recording with a three-component geophone and a hydrophone at sampling rates up to 200 Hz. For one instrument at each study site, we used the range-finding capability of OBS’s acoustic transponder to estimate the drift occurring during free fall with the goal of achieving seafloor OBS positions within a few tens of meters of the desired locations, particularly for the instruments deployed at the JIP Leg II LWD boreholes. Air-gun operations were conducted under guidelines specified in an Incidental Harassment Authorization (IHA) issued to the USGS by the National Marine Fisheries Service. Two contracted Protected Species Visual Observers were onboard during the cruise to carry out monitoring and to ensure compliance with the IHA.
The R/V Pelican left its home port of Cocodrie, Louisiana, on April 18 following three days of equipment installation and preparation. After a 20-hour transit we deployed OBS at GC955. We acquired high-resolution 2D data and coincident OBS data and then retrieved the OBS. On April 26 we transited to WR313 where we repeated the acquisition procedures, deploying OBS, acquiring 2D seismic data, and retrieving the OBS. We completed data acquisition on May 2 and the R/V Pelican docked back in Cocodrie on May 3. The data acquisition effort was conducted safely and met the scientific objectives.
Figure 4. Eric Moore and Wayne Baldwin (USGS) retrieving seismic streamer on the back deck of the R/V Pelican.
6
SUGGESTED READINGCollett, T., and Boswell, R., editors, Thematic Set on Resource and Hazard Implications of Gas Hydrates in the Northern Gulf of Mexico: Results of the 2009 Joint Industry Project Leg II Drilling Expedition, J. Marine and Petroleum Geology, v. 34. pp. 1-223.
ACKNOWLEDGMENTSPartial financial support was provided by interagency agreements DE-FE0002911 with DOE and 10PG00239 with BOEM. We thank W. Shedd, M. Frye, R. Boswell, and other BOEM and DOE personnel for scientific advice that contributed to the success of the research cruise. Shipboard operations were successful due to the seamless cooperation among all personnel – LUMCON, WHOI, and USGS – and we thank each member of these groups for their many contributions. We thank Lamont-Doherty Earth Observatory Marine Operations for the loan of four air guns. Any use of trade product or firm names is for descriptive purposes only and does not imply endorsement by the U.S. Government.
Seismic Data
At GC955 we acquired 394 km of 2D streamer data, in a 50- to 250-m-spaced grid augmented by several 20-km-long transects that provided large offsets for the OBS. Seafloor recording was accomplished by a 2D array of 21 OBS at approximately 400 m spacing. At WR313, we acquired 450 km of streamer data (Figure 5) in a set of 11-km-long, 150- to 1,000-m-spaced dip lines, and 6- to 8-km-long, 500- to 1000-m-spaced strike lines. These were augmented by a set of 20-km-long lines that provided large offsets for a predominantly linear array of 25 400- to 800-m-spaced OBS deployed in the dip direction in and around WR313.
OBS and 2D streamer data processing is underway within the seismic group at the USGS Central Energy Resources Science Center in Denver. The 2D streamer data are displayed in Figure 5, with annotations showing the major hydrate-bearing intervals and a discontinuous BSR marked by amplitude truncations, amplitude reversals, and other features corresponding to the base of the gas hydrate stability zone.
Processed 2D streamer data will be archived at the USGS National Archive of Marine Seismic Surveys (http://walrus.wr.usgs.gov/NAMSS/). Raw, continuous recording OBS data and air gun shot OBS records are archived on the Incorporated Research Institutions for Seismology (IRIS) Data Management Center (http://www.iris.edu/dms/nodes/dmc/). All data will be made available to the research community following customary waiting periods.
2.5
3.0
3.5
4.0
Tw
o-w
ay tr
avel
tim
e [s
]
NW SE0 5 10
Distance [km] WR313-GWR313-H
“Blue”
“Ora
nge”
“Gre
en”
Fractured shale interval
Discontinuous BSR
Figure 5. Newly acquired 2D streamer data from WR313, with major hydrate-bearing intervals labeled, and approximate locations of JIP Leg II LWD wells identified. Well WR313-H is marked with a dashed line because it is approximately 750 m offset from this seismic line. A discontinuous BSR is visible as a set of aligned amplitude truncations and reversals and other features corresponding with the base of gas hydrate stability.
CharaCterization oF Gas hydrate reservoirs in the oFFshore Caribbean reGion oF ColombiaBy Andrés Eduardo Calle Ochoa, Instituto Colombiano del Petróleo, [email protected]
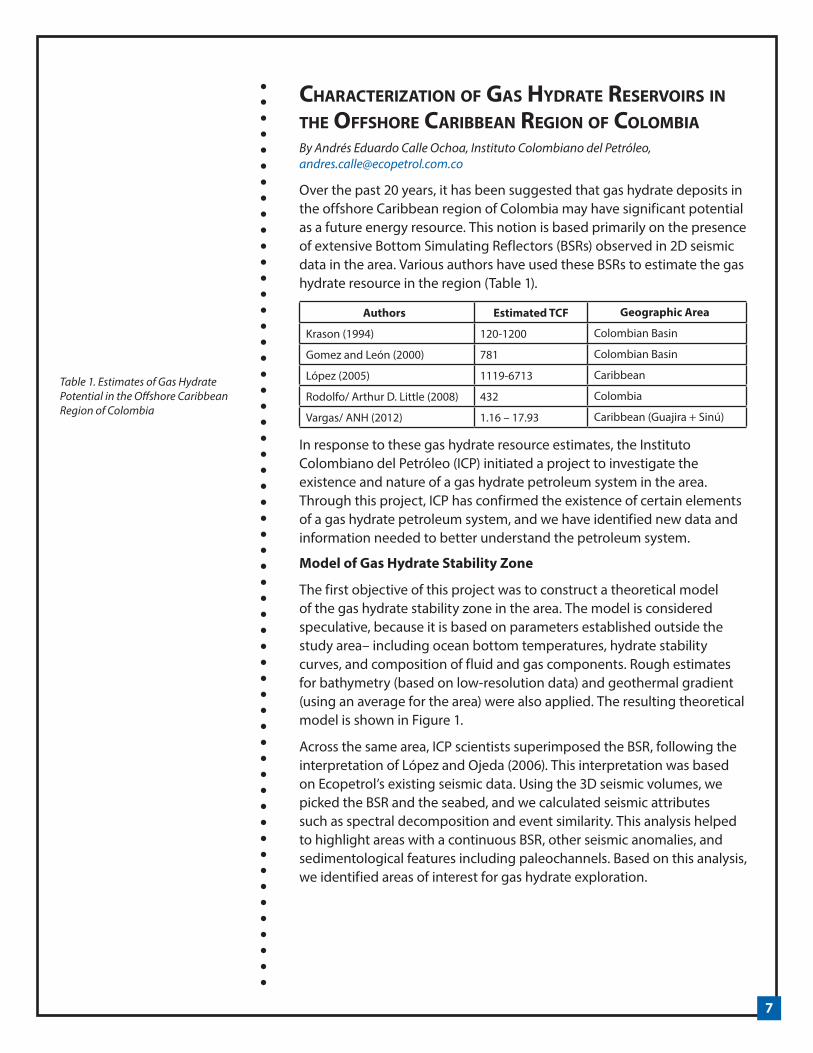
Over the past 20 years, it has been suggested that gas hydrate deposits in the offshore Caribbean region of Colombia may have significant potential as a future energy resource. This notion is based primarily on the presence of extensive Bottom Simulating Reflectors (BSRs) observed in 2D seismic data in the area. Various authors have used these BSRs to estimate the gas hydrate resource in the region (Table 1).
Authors Estimated TCF Geographic Area
Krason (1994) 120-1200 Colombian Basin
Gomez and León (2000) 781 Colombian Basin
López (2005) 1119-6713 Caribbean
Rodolfo/ Arthur D. Little (2008) 432 Colombia
Vargas/ ANH (2012) 1.16 – 17.93 Caribbean (Guajira + Sinú)
In response to these gas hydrate resource estimates, the Instituto Colombiano del Petróleo (ICP) initiated a project to investigate the existence and nature of a gas hydrate petroleum system in the area. Through this project, ICP has confirmed the existence of certain elements of a gas hydrate petroleum system, and we have identified new data and information needed to better understand the petroleum system.
Model of Gas Hydrate Stability Zone
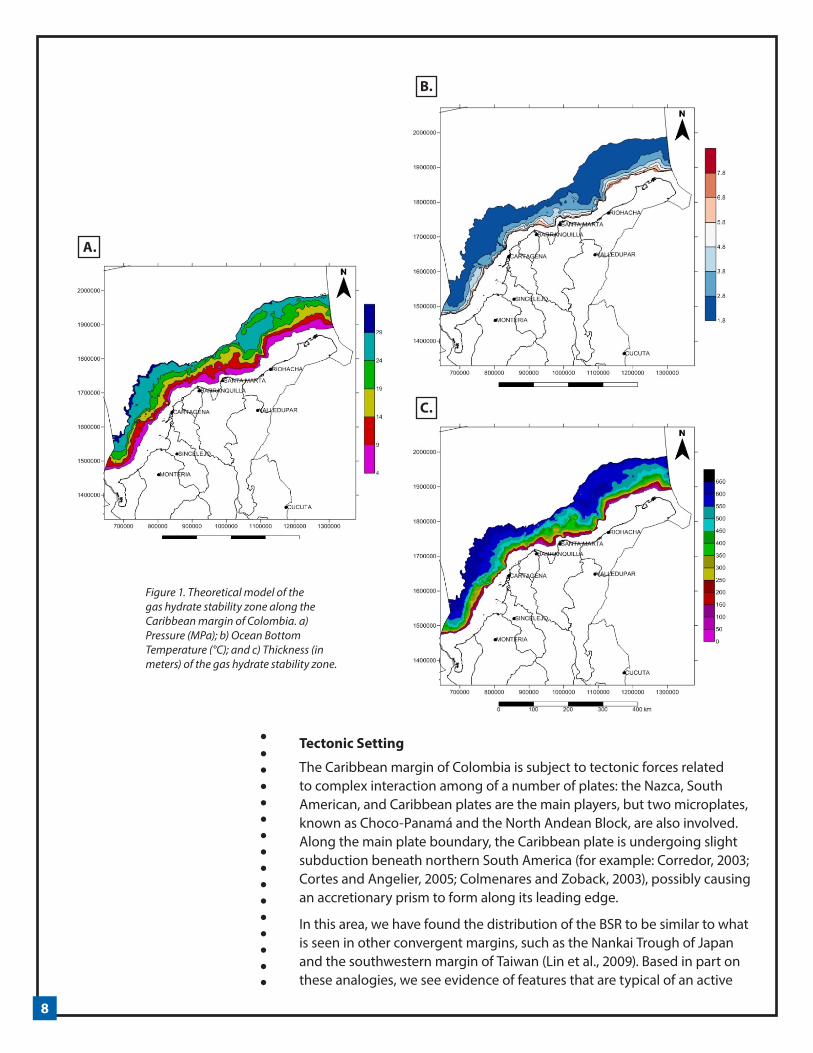
The first objective of this project was to construct a theoretical model of the gas hydrate stability zone in the area. The model is considered speculative, because it is based on parameters established outside the study area– including ocean bottom temperatures, hydrate stability curves, and composition of fluid and gas components. Rough estimates for bathymetry (based on low-resolution data) and geothermal gradient (using an average for the area) were also applied. The resulting theoretical model is shown in Figure 1.
Across the same area, ICP scientists superimposed the BSR, following the interpretation of López and Ojeda (2006). This interpretation was based on Ecopetrol’s existing seismic data. Using the 3D seismic volumes, we picked the BSR and the seabed, and we calculated seismic attributes such as spectral decomposition and event similarity. This analysis helped to highlight areas with a continuous BSR, other seismic anomalies, and sedimentological features including paleochannels. Based on this analysis, we identified areas of interest for gas hydrate exploration.
Table 1. Estimates of Gas Hydrate Potential in the Offshore Caribbean Region of Colombia
Figure 1. Theoretical model of the gas hydrate stability zone along the Caribbean margin of Colombia. a) Pressure (MPa); b) Ocean Bottom Temperature (°C); and c) Thickness (in meters) of the gas hydrate stability zone.
Tectonic Setting
The Caribbean margin of Colombia is subject to tectonic forces related to complex interaction among of a number of plates: the Nazca, South American, and Caribbean plates are the main players, but two microplates, known as Choco-Panamá and the North Andean Block, are also involved. Along the main plate boundary, the Caribbean plate is undergoing slight subduction beneath northern South America (for example: Corredor, 2003; Cortes and Angelier, 2005; Colmenares and Zoback, 2003), possibly causing an accretionary prism to form along its leading edge.
In this area, we have found the distribution of the BSR to be similar to what is seen in other convergent margins, such as the Nankai Trough of Japan and the southwestern margin of Taiwan (Lin et al., 2009). Based in part on these analogies, we see evidence of features that are typical of an active
A.
B.
C.
9
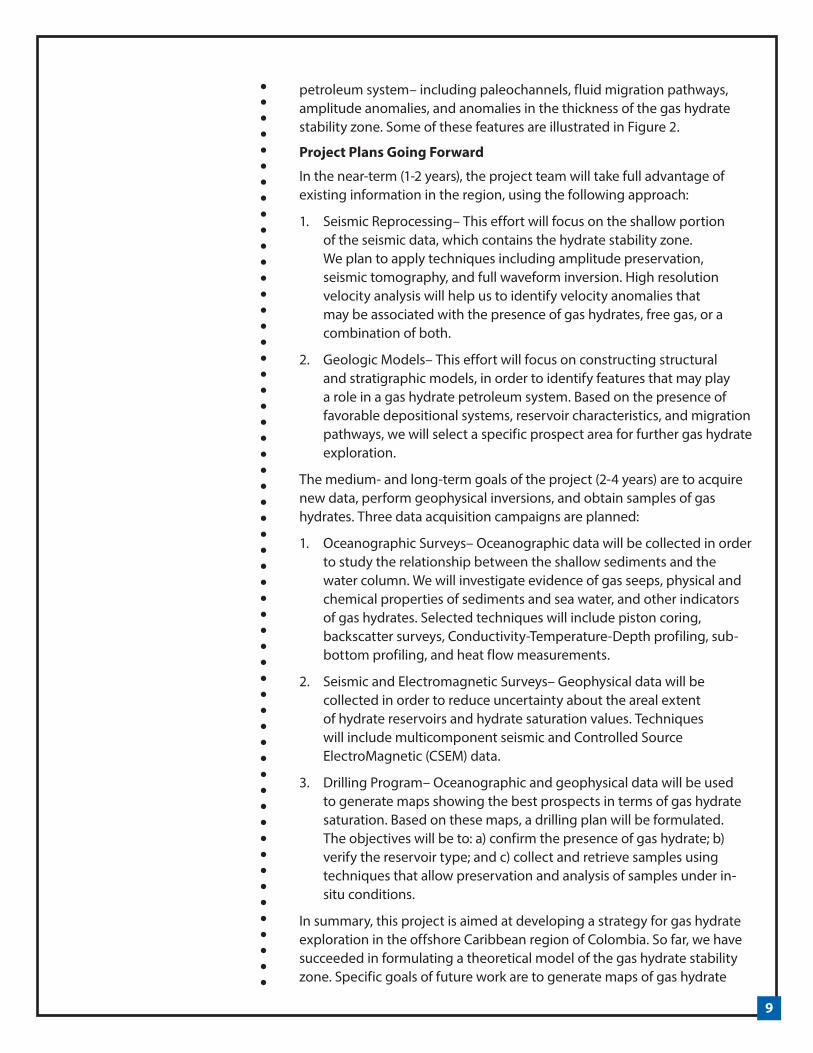
petroleum system– including paleochannels, fluid migration pathways, amplitude anomalies, and anomalies in the thickness of the gas hydrate stability zone. Some of these features are illustrated in Figure 2.
Project Plans Going Forward
In the near-term (1-2 years), the project team will take full advantage of existing information in the region, using the following approach:
1. Seismic Reprocessing– This effort will focus on the shallow portion of the seismic data, which contains the hydrate stability zone. We plan to apply techniques including amplitude preservation, seismic tomography, and full waveform inversion. High resolution velocity analysis will help us to identify velocity anomalies that may be associated with the presence of gas hydrates, free gas, or a combination of both.
2. Geologic Models– This effort will focus on constructing structural and stratigraphic models, in order to identify features that may play a role in a gas hydrate petroleum system. Based on the presence of favorable depositional systems, reservoir characteristics, and migration pathways, we will select a specific prospect area for further gas hydrate exploration.
The medium- and long-term goals of the project (2-4 years) are to acquire new data, perform geophysical inversions, and obtain samples of gas hydrates. Three data acquisition campaigns are planned:
1. Oceanographic Surveys– Oceanographic data will be collected in order to study the relationship between the shallow sediments and the water column. We will investigate evidence of gas seeps, physical and chemical properties of sediments and sea water, and other indicators of gas hydrates. Selected techniques will include piston coring, backscatter surveys, Conductivity-Temperature-Depth profiling, sub-bottom profiling, and heat flow measurements.
2. Seismic and Electromagnetic Surveys– Geophysical data will be collected in order to reduce uncertainty about the areal extent of hydrate reservoirs and hydrate saturation values. Techniques will include multicomponent seismic and Controlled Source ElectroMagnetic (CSEM) data.
3. Drilling Program– Oceanographic and geophysical data will be used to generate maps showing the best prospects in terms of gas hydrate saturation. Based on these maps, a drilling plan will be formulated. The objectives will be to: a) confirm the presence of gas hydrate; b) verify the reservoir type; and c) collect and retrieve samples using techniques that allow preservation and analysis of samples under in-situ conditions.
In summary, this project is aimed at developing a strategy for gas hydrate exploration in the offshore Caribbean region of Colombia. So far, we have succeeded in formulating a theoretical model of the gas hydrate stability zone. Specific goals of future work are to generate maps of gas hydrate
10
Figure 2. Seismic features along the Caribbean margin of Colombia. a) Thrusted – ridge type features showing anomalous variations in the hydrate stability zone and amplitudes adjacent to BSR; and b) Channel features in the gas hydrate stability zone, apparent in horizon slices and corresponding cross-line profiles.
A.
B.
11
reservoirs with associated gas hydrate saturations; verify the existence of hydrate-bearing reservoirs with drilling; and calculate the gas hydrate resource potential for the area from this information.
This project has benefitted from close cooperation among the following Ecopetrol scientists: Andrés Calle M.Sc. Geophysics; Zayra Pérez, M.Sc Physics; Herling Gonzalez, M. Sc Physics; Alejandro Silva, M.Sc Geology; and William Agudelo, Ph.D. Geophysics.
References
Arthur D. Little Inc., 2008. Evaluation of potential of unconventional energy resources in Colombia. Internal Report, Agencia Nacional de Hidrocarburos, Colombia.
Colmenares, L. and Zoback, M., 2003. Stress field and seismotectonics of northern South America. Geology, v. 31, no. 8, pp. 721-724.
Corredor, F., 2003. Seismic strain rates and distributed continental deformation in the northern Andes and three-dimensional seismotectonics of northwestern South America. Tectonophysics, v. 372, pp. 147–166.
Cortés, M. and Angelier, J., 2005. Current states of stress in the northern Andes as indicated by focal mechanisms of earthquakes. Tectonophysics, v. 403, pp. 29-58.
Gómez, C. and León, J., 2000. Recuperación de gas metano en yacimientos de hidratos de gas en la cuenca Colombia como futura fuente de energía. B.Sc. Thesis, Universidad Industrial de Santander.
Krason, J., 1994. Study of 21 marine basins indicates wide prevalence of hydrates. Offshore Magazine, v. 54, no. 8, pp. 34-35.
Lin, C.C. et al., 2009. Geological controls on BSR occurrences in the incipient arc-continent collision zone off southwest Taiwan. Marine and Petroleum Geology v. 26, pp. 1118–1131.
López, C., 2005. Determinación del gradiente geotérmico a partir del reflector simulador de fondo. B.Sc. Thesis, Universidad Industrial de Santander, Bucaramanga, 100 pp.
López, C. and Ojeda, G., 2006. Heat flow in the Colombian Caribbean from the BSR. Ciencia, Tecnología y Futuro, v. 3, no. 2, pp. 29-39.
Peláez, J. and Calle, A., 2012. Cálculo del espacio volumétrico teórico máximo en función de la zona de estabilidad de los hidratos de metano para el Caribe Colombiano. 11th Simposio Bolivariano - Exploración Petrolera en las Cuencas Subandinas. July 29th, 2012.
Vargas, C.A. 2012. Potencial de hidrocarburos en Colombia. Ronda Colombia 2012, Agencia Nacional de Hidrocarburos (ANH) – Universidad Nacional de Colombia, Bogotá.
12
Csem survey oF a methane vent site, oFFshore west svalbard By Bedanta Goswami, Karen Weitemeyer, Tim Minshull, Martin Sinha, and Graham Westbrook; National Oceanography Centre Southampton, University of Southampton, UK
0˚5˚ 10˚ 15˚
20˚75˚
76˚
77˚
78˚
79˚
80˚
Svalbard
Yermak Plateau
WSC
YSCNSC
Fram Strait
BarentsSea
Greenland Sea
100 km
Kongsfjorden
Trough
Isfjorden Trough
Bellsund Trough
Stor
fjord
en
Trou
gh
Vestnesa Ridge
Spitsbergen
TransformFault
Molloy
Ridg
e
Molloy TransformFault
Knip
ovich
Rid
ge
6˚42' 6˚48' 6˚54' 7˚00' 7˚06'
2 km
1350
1200
1050
OBE Receivers
Active Plume Site - 2008 discovery
CSEM Tow Line
Airgun Seismic Lines
Chirp frequency SYSIF Seismic Lines
V01
V02
V03V04
V05
V06
V07
V08
V09
V11
V14
CSEM_9CSEM_11
CSEM_10
2012_10
79˚00'
79˚02'
Depth (m)
Introduction
In July 2012, the scientific cruise JCR269B on RRS James Clarke Ross conducted two Controlled Source ElectroMagnetic (CSEM) surveys over the West Svalbard margin to complement previously collected seismic data. The objective was to evaluate hydrate and free gas saturations in the submarine sediments in this area.
Since the discovery of about 250 methane plumes emanating from the seabed of the West Svalbard continental margin in water depths shallower than the 400m bathymetry contour (Westbrook et al., 2009), this region has been the focus of extensive international research. The deepest methane seeps are located along the predicted landward edge of the Gas Hydrate Stability Zone (GHSZ). This has led to speculation that warming of the West Spitsbergen current over the past three decades has caused dissociation of shallow hydrate deposits in this area, which has, in
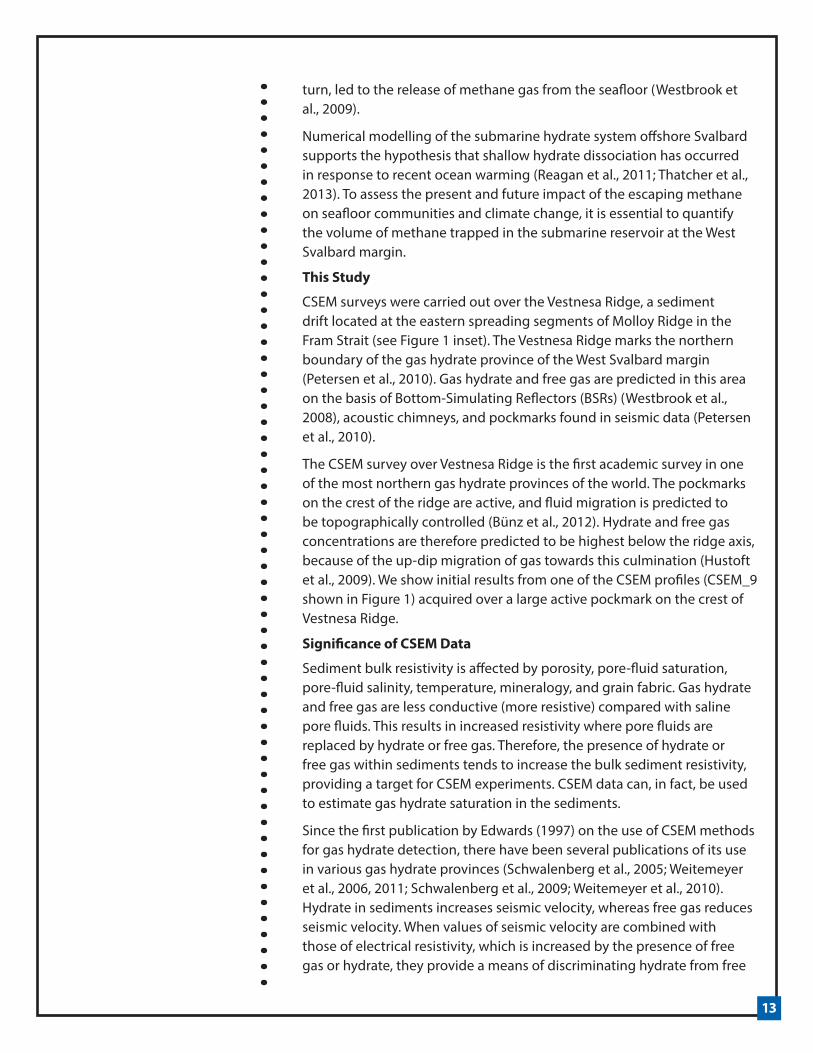
Figure 1. Map of Svalbard showing the location of the CSEM survey area at Vestnesa Ridge. 3 CSEM lines were acquired over a pockmark using 11 OBEs, 1 towed receiver, and the CSEM transmitter. High resolution seismic datasets coincident with acquired CSEM are also shown.
13
turn, led to the release of methane gas from the seafloor (Westbrook et al., 2009).
Numerical modelling of the submarine hydrate system offshore Svalbard supports the hypothesis that shallow hydrate dissociation has occurred in response to recent ocean warming (Reagan et al., 2011; Thatcher et al., 2013). To assess the present and future impact of the escaping methane on seafloor communities and climate change, it is essential to quantify the volume of methane trapped in the submarine reservoir at the West Svalbard margin.
This Study
CSEM surveys were carried out over the Vestnesa Ridge, a sediment drift located at the eastern spreading segments of Molloy Ridge in the Fram Strait (see Figure 1 inset). The Vestnesa Ridge marks the northern boundary of the gas hydrate province of the West Svalbard margin (Petersen et al., 2010). Gas hydrate and free gas are predicted in this area on the basis of Bottom-Simulating Reflectors (BSRs) (Westbrook et al., 2008), acoustic chimneys, and pockmarks found in seismic data (Petersen et al., 2010).
The CSEM survey over Vestnesa Ridge is the first academic survey in one of the most northern gas hydrate provinces of the world. The pockmarks on the crest of the ridge are active, and fluid migration is predicted to be topographically controlled (Bünz et al., 2012). Hydrate and free gas concentrations are therefore predicted to be highest below the ridge axis, because of the up-dip migration of gas towards this culmination (Hustoft et al., 2009). We show initial results from one of the CSEM profiles (CSEM_9 shown in Figure 1) acquired over a large active pockmark on the crest of Vestnesa Ridge.
Significance of CSEM Data
Sediment bulk resistivity is affected by porosity, pore-fluid saturation, pore-fluid salinity, temperature, mineralogy, and grain fabric. Gas hydrate and free gas are less conductive (more resistive) compared with saline pore fluids. This results in increased resistivity where pore fluids are replaced by hydrate or free gas. Therefore, the presence of hydrate or free gas within sediments tends to increase the bulk sediment resistivity, providing a target for CSEM experiments. CSEM data can, in fact, be used to estimate gas hydrate saturation in the sediments.
Since the first publication by Edwards (1997) on the use of CSEM methods for gas hydrate detection, there have been several publications of its use in various gas hydrate provinces (Schwalenberg et al., 2005; Weitemeyer et al., 2006, 2011; Schwalenberg et al., 2009; Weitemeyer et al., 2010). Hydrate in sediments increases seismic velocity, whereas free gas reduces seismic velocity. When values of seismic velocity are combined with those of electrical resistivity, which is increased by the presence of free gas or hydrate, they provide a means of discriminating hydrate from free
14
gas. Therefore, co-located measurements of seismic velocity and CSEM-derived resistivity provide valuable companion datasets that can be used to improve estimates of the submarine volume of methane gas and methane hydrate in the West Svalbard margin gas hydrate province.
CSEM Data Acquisition and Processing
Three CSEM profiles were acquired at Vestnesa Ridge during the scientific cruise JCR269B. The survey was carried out using a transmitter, called DASI – Deep-towed Active Source Instrument, eleven Ocean Bottom Electric-field (OBE) sensors, and a towed three-axis electric field receiver called Vulcan (Figure 2).
DASI (Figure 3) output a 1Hz square wave of 82A across a 100m dipole antenna. An Ultra-Short BaseLine (USBL) acoustic transponder mounted at the head of DASI and the dynamic global positioning system of the ship were used to obtain an accurate position, to within ±4 m .
The OBEs were deployed on the seafloor using the National Oceanography Centre Southampton’s mini remote underwater vehicle – Hydraulic Benthic Interactive Sampler (HyBIS) (Figure 4). The OBEs were released from HyBIS when it was 1m above the seafloor, and the USBL transponder mounted on HyBIS provided accurate location and depth of the deployed instrument. The video cameras from HyBIS also provided visual confirmation that the OBEs landed on flat seafloor once released. The OBEs recorded two horizontal and orthogonal components of the electric field.
Vulcan, the 3-axis electric field receiver, was towed 300 m behind the end of the transmitting antenna (Figure 2). It recorded the inline electric field (Ey) component along its 2m dipole and the crossline (Ex) and vertical
Figure 2. Layout of CSEM survey. Position of transmitter DASI, towed behind the ship was monitored using USBL. Tri-axis electric-field receiver, Vulcan, was towed 300m behind DASI antenna. The OBEs recorded the horizontal electric field component of the transmitted signal.(Adapted from Weitemeyer et al. 2010)
CSEM TransmitterDASI Towed Ex,Ey,Ez receiver,
VulcanNational Oceanography CentreNATURAL ENVIRONMENT RESEARCH COUNCIL
UNIVERSITY OFSouthampton
DASIDeep-towed Active Source Instrument
Sea�oor Electromagnetics Research
National Oceanography Centre, Southampton
National Oceanography Centre, SouthamptonUniversity of Southampton, Waterfront Campus,European Way, Southampton SO14 3ZH, U.K. http://noc.ac.uk
44(0)2380592011
Ship- RRS James Clarke RossGPS
USBL transducer
100 m 300 mocean-bottom electric �eld (OBE) receivers (Ex,Ey)
USBL transponder
15
(Ez) electric field components along 1m dipoles (Figure 3). Vulcan provides good resolution of the shallow sediments by capturing the higher frequency harmonics of the transmitted electromagnetic signal in addition to the fundamental and low frequency harmonics that the OBEs are able to capture.
We followed a method identical to Myer et al. (2011) for processing the recorded CSEM data. The time series data were converted by Fourier transform into the frequency domain, and the effects of the transmitter and receiver were removed to obtain the Earth’s transfer function, as a function of transmission time. Additional processing was performed to improve the signal to noise ratio of our data. The result is an electric-field response of the earth every 46m along the transmitter tow-line.
1D forward modelling for each transmitter-receiver location was carried out using the Dipole1D modelling code of Key (2009). The earth model consisted of an insulating air layer, conducting seawater layers, and a range of uniform half space resistivity for the marine sediments (0.3 to 100 Ohm-m). The Dipole1D modelling code computes the electric field observed at the receiver for a given input model.
Initial Results and Interpretation
The magnitude of the semi-major axis of the polarisation ellipse (Pmax) traced by the electric field vector was used to make preliminary observations (Figure 5). Pmax is the strongest component of the electric field and removes uncertainty related to receiver orientation and source-receiver geometry. 1D forward modelled electric field
DASIVulcan
USBL Transponder
Fibre Optic Information Cable& High Voltage Cable
Inline dipole (2 m)
Vertical dipole (1m)
Cross-line dipole (1m)
Figure 3. Towed receiver Vulcan and CSEM transmitter DASI set up and ready for deployment.
16
responses for various values of seafloor resistivity were compared with the recorded electric field data.
A strong resistivity anomaly exists over the pockmark in both the Vulcan and OBE datasets. The positive anomaly over the pockmark suggests that pore fluids within the chimney structure have been replaced by resistive material, such as hydrate or free gas.
The Vulcan data also show a good correlation between the smaller resistive anomalies and the smaller chimneys along the ridge flank (Figure 5). An increase in concentration of free gas or hydrate can be inferred for the chimney, since gas hydrate and free gas are both considerably more resistive than saline pore waters. High concentrations of hydrate are likely to inhibit upward fluid migration through the chimney and gas venting was discovered at the pockmarks overlying similar chimneys at the Vestnesa Ridge. This presents a strong argument for free gas being a major contributor to the observed resistivity anomaly below the pockmark. Assuming 1Ω-m as a likely estimate for the resistivity of the Vestnesa background sediments, and assuming an average sediment porosity of 50% (Chabert et al., 2011; Hyndman et al., 1999), the 1.5 Ω-m resistivity value in these sediments indicates that hydrate occupies some of the pores in the shallow sediments. This is supported by an independent interpretation of seismic reflection data from the same area (Hustoft et al., 2009).
HyBIS
Ocean Bottom Electric-fieldsensor (OBE)
12 m dipoles
Figure 4. OBE deployment using remote underwater vehicle - HyBIS during JCR269B.
17
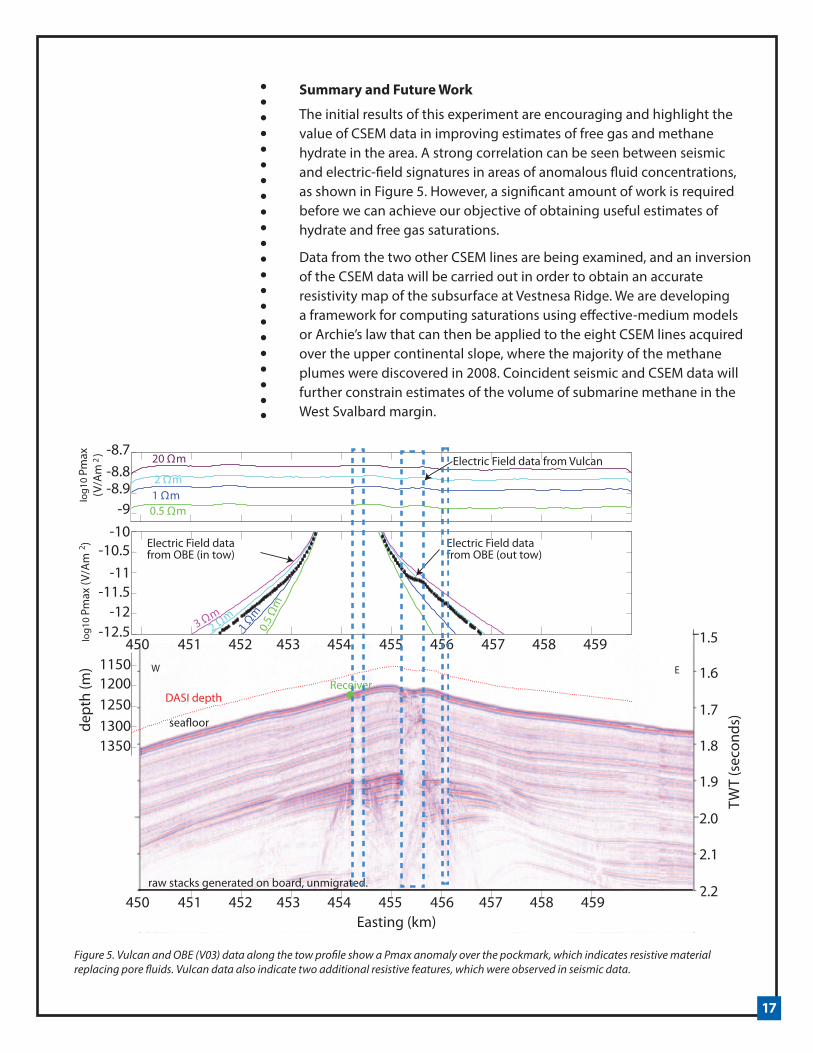
Summary and Future Work
The initial results of this experiment are encouraging and highlight the value of CSEM data in improving estimates of free gas and methane hydrate in the area. A strong correlation can be seen between seismic and electric-field signatures in areas of anomalous fluid concentrations, as shown in Figure 5. However, a significant amount of work is required before we can achieve our objective of obtaining useful estimates of hydrate and free gas saturations.
Data from the two other CSEM lines are being examined, and an inversion of the CSEM data will be carried out in order to obtain an accurate resistivity map of the subsurface at Vestnesa Ridge. We are developing a framework for computing saturations using effective-medium models or Archie’s law that can then be applied to the eight CSEM lines acquired over the upper continental slope, where the majority of the methane plumes were discovered in 2008. Coincident seismic and CSEM data will further constrain estimates of the volume of submarine methane in the West Svalbard margin.
Figure 5. Vulcan and OBE (V03) data along the tow profile show a Pmax anomaly over the pockmark, which indicates resistive material replacing pore fluids. Vulcan data also indicate two additional resistive features, which were observed in seismic data.
18
Suggested Reading
Bünz, S. et al., 2012. Active gas venting through hydrate-bearing sediments on the Vestnesa Ridge, offshore W-Svalbard. Marine Geology, 332-334, pp.189–197.
Chabert, A. et al., 2011. Characterization of a stratigraphically constrained gas hydrate system along the western continental margin of Svalbard from ocean bottom seismometer data. Journal of Geophysical Research, 116(B12), p.B12102.
Hustoft, S. et al., 2009. Gas hydrate reservoir and active methane-venting province in sediments on <20 Ma young oceanic crust in the Fram Strait, offshore NW-Svalbard. Earth and Planetary Science Letters, 284(1-2), pp.12–24.
Hyndman, R.D., Yuan, T. & Moran, K., 1999. The concentration of deep sea gas hydrates from downhole electrical resistivity logs and laboratory data. Earth and Planetary Science Letters, 172(1-2), pp.167–177.
Key, K., 2009. 1D inversion of multicomponent, multifrequency marine CSEM data: Methodology and synthetic studies for resolving thin resistive layers. Geophysics, 74(2), pp.F9–F20.
Myer, D., Constable, S. & Key, K., 2011. Broad-band waveforms and robust processing for marine. Geophys. J. Int, 184, pp.689–698.
Petersen, C.J. et al., 2010. High-resolution P-Cable 3D seismic imaging of gas chimney structures in gas hydrated sediments of an Arctic sediment drift. Marine and Petroleum Geology, 27(9), pp.1981–1994.
Reagan, M.T. et al., 2011. Contribution of oceanic gas hydrate dissociation to the formation of Arctic Ocean methane plumes. Journal of Geophysical Research, 116(C9), p.C09014.
Schwalenberg, K. et al., 2005. Marine gas hydrate electromagnetic signatures in Cascadia and their correlation with seismic blank zones. First Break, 23(April), pp.57–63.
Thatcher, K.E. et al., 2013. Methane release from warming-induced hydrate dissociation in the West Svalbard continental margin : Timing , rates , and geological controls. Journal of Geophysical Research, 118, pp.1–17.
Weitemeyer, K.A. et al., 2006. First results from a marine controlled-source electromagnetic survey to detect gas hydrates offshore Oregon. Geophysical Research Letters, 33(L03304), pp.1–4.
Weitemeyer, K. & Constable, S., 2010. Mapping shallow geology and gas hydrate with marine CSEM surveys. First Break, 28(June), pp.97–102.Westbrook, G.K. et al., 2009. Escape of methane gas from the seabed along the West Spitsbergen continental margin. Geophysical Research Letters, 36(15), pp.1–5.
Westbrook, G.K. et al., 2008. Estimation of gas hydrate concentration from multi-component seismic data at sites on the continental margins of NW Svalbard and the Storegga region of Norway. Marine and Petroleum Geology, 25(8), pp.744–758.
19
pressure Core analysis tools used to CharaCterize hydrate-bearinG sediments From the nanKai trouGhBy the Sapporo Scientific Team
Georgia Tech: S. Dai, J. Jang, M. Terzariol, E. Papadopoulos, and J.C. Santamarina
National Institute of Advanced Industrial Science and Technology (AIST): Y. Konno, J. Yoneda, and J. Nagao
Japan Oil, Gas and Metals National Corporation (JOGMEC): K. Suzuki, and T. Fujii
USGS: W.J. Winters, W. Waite, D. Mason, E. Bergeron
Introduction
The Pressure Core Characterization Tools (PCCT), a suite of instrumented pressure chambers developed at Georgia Tech (The PCCT Development Team, FITI, 12(2); Santamarina et al., 2012), were successfully deployed in Sapporo, Japan in January, 2013 to measure mechanical, hydraulic, electrical, and biologic properties of gas hydrate-bearing pressure cores recovered from the Eastern Nankai Trough in 2012 (Yamamoto et al., FITI, 12 (2)). This represents the first joint deployment of the PCCT devices and was made possible through international collaboration among scientists and engineers from Georgia Tech, the U.S. Geological Survey (USGS), the Japan Oil, Gas and Metals National Corporation (JOGMEC) and the National Institute of Advanced Industrial Science and Technology (AIST; Figure 1).
Eastern Nankai Trough Pressure-Core Samples
The Nankai Trough offshore Japan hosts large quantities of methane hydrate (Fujii et al., 2009). Coring and logging operations were conducted in the Eastern Nankai Trough from June 29 to July 4, 2012 by JOGMEC and the Japan Petroleum Exploration Company (JAPEX) in an effort to characterize the reservoir and prepare for methane hydrate production testing.
The sampling site is located on the north slope of Daini Atumi Knoll off Atsumi and Shima peninsulas, where geological and geophysical surveys and exploratory drilling had revealed sediments characterized by high gas hydrate saturations (Takahashi and Tsuji, 2005). The water depth at the site is nearly 1000 m, and hydrate-bearing sediments are found approximately 300 m below the seafloor within turbiditic, coarse-grained sediments.
Pressure-core specimens were collected using the Hybrid Pressure-Coring System (Hybrid PCS) operated from the Chikyu deep ocean-drilling vessel. Eight of the cores were recovered at close to in-situ pressure and transported to AIST in Sapporo. The core was extracted from the PCS under pressure, X-rayed by Geotek, Inc., and cut into ~1.2 m sections that were transferred to storage chambers pressurized to 20 MPa.
Pressure Core Characterization Using PCCT
Six months later, PCCT devices were deployed in AIST’s cold room (4°C) laboratories in Sapporo, and the pressure cores were transferred from
storage to undergo analysis. The PCCT were operated at 10 MPa during testing of the cores. Electronics and peripheral systems were located in adjacent monitoring areas for safety.
General Operation. A computer-controlled manipulator (Figure 2A) was used to move and transfer cores between chambers. The Instrumented Pressure Testing Chamber (IPTC) was mounted in series with the manipulator to measure properties along the core length, before the core was cut under pressure with a saw for further study in other PCCT chambers. Once loaded with cut specimens, the individual PCCT chambers were decoupled from the saw and moved to dedicated cold room spaces for additional measurements. Remaining core was then loaded into an IPTC built by AIST for monitoring sediment properties and gas release during controlled depressurization.
The IPTC. The IPTC (Figure 2A) is a long cylindrical chamber designed to measure physical properties of the core, while it is held within the hydrate stability field but at zero effective stress. The IPTC has 4 diametrically opposed ports arrayed along its length. The first port is used to drill holes through the core liner, while the remaining ports host sensors containing pinducers (to generate P-waves), bender elements (to generate S-waves), an electrical needle probe (to measure electrical resistivity), and a cone penetrometer (to measure undrained shear strength). The IPTC has previously been deployed to study pressure cores from the Gulf of Mexico, the Indian National Gas Hydrates Program (NGHP-01), and the first Ulleung Basin Gas Hydrate (UBGH-1) program.
The Effective Stress Chamber (ESC). Within the ESC (Figure 2B), specimens were confined within a flexible membrane and subjected to an effective stress of ~3MPa, equivalent to what they experienced in situ due to the weight of overlying sediments. Small-strain stiffness, compressibility, hydraulic conductivity, volume contraction upon dissociation, and hydrate saturation were measured.
The Direct Shear Chamber (DSC). The DSC (Figure 2C) was used to measure specimen compressibility and shear strength under the in-situ effective stress (~3MPa), before and after hydrate dissociation. Additionally, P-wave velocity and temperature data were gathered throughout the loading, shearing, and dissociation process. The DSC data were also analyzed to study creep and volume compaction upon dissociation.
Sub-sampling Tool for Biological Studies. This tool (Figure 2D) was used to collect and transfer multiple subsamples to bioreactors without contaminating them, while maintaining pressure and temperature conditions for hydrate stability. Nutrients for microorganisms were injected into the bioreactor using a high-pressure syringe. Cell counts were made, and the effects of depressurization rate on post-sampling biological activity were investigated.
In addition, monitored depressurization tests conducted in individual PCCT chambers provided precise estimates of hydrate saturation and valuable
21
Figure 1. The AIST, JOGMEC, Georgia Tech, and USGS team that conducted pressure core testing in Sapporo in January 2013. Front row, kneeling: Jun Yoneda (AIST). Front row, standing, left to right: Yoshihiro Konno (AIST), Jiro Nagao (AIST), Marco Terzariol (Georgia Tech), William Winters (USGS), Junbong Jang (Georgia Tech), Kiyofumi Suzuki (JOGMEC), Sheng Dai (Georgia Tech), Tetsuya Fujii (JOGMEC), and Emile Bergeron (USGS). Back row, standing, left to right: William Waite (USGS), Efthymios Papadopoulos (Georgia Tech), David Mason (USGS), and Carlos Santamarina (Georgia Tech). Photo Credit: USGS.
Figure 2. (A) AIST-built IPTC (foreground) attached to the manipulator (back right) in one of the cold rooms at AIST. The cold room was 7 m in length, slightly longer than the complete manipulator string. (B) Effective stress chamber, which is approximately 50 cm high including its ball valve assembly. (C) Direct shear chamber, which is approximately 1 m high including its ball valve assembly. (D) Biological subsampling chamber, the body of which is approximately 10 cm across, shown here with its ball valve assembly attached to the saw. Photo credits: USGS.
22
geophysical information that can be used in the interpretation of data from future field production projects.
Operations Summary
Pressure-core technology can be effectively used to retrieve natural hydrate-bearing sediments under in situ conditions. A decade ago, pressure cores could be X-rayed and then depressurized to estimate the volume of hydrate that had been present. With the development of the IPTC and the full suite of PCCT tools, it is now possible to measure a much more comprehensive suite of mechanical, hydraulic, electrical, and biological properties, as has been done successfully for these pressure cores from the Nankai Trough.
Results and Future Work
Data and interpretations from this study will be released through Japan’s Research Consortium for Methane Hydrate Resources (MH21), and initial results will be presented at the American Geophysical Union Conference in Dec., 2013. Based on experiences gained in Sapporo, the PCCT devices and their operation are being refined in preparation for future pressure-coring programs in deepwater marine and permafrost environments.
Acknowledgments
PCCT were developed with funding to Georgia Tech from the DOE/Chevron Joint Industry Project (JIP), with additional funds from the Joint Oceanographic Institutions, Inc. The JIP also funded the participation of the USGS and Georgia Tech teams in Sapporo. Some USGS developments on the IPTC were funded under Interagency Agreement DE-FE0002911.
Further Reading
Fujii, T., Nakamizu, M., Tsuji, Y., Namikawa, T., Okui, T., Kawasaki, M., Ochiai, K., Nishimura, M., and Takano, O., 2009. “Methane-hydrate occurrence and saturation confirmed from core samples, Eastern Nankai Trough, Japan.” in Collett, T., Johnson, A., Knapp, C., and Boswell, B. eds., Natural gas hydrates – Energy resource potential and associated geologic hazards: AAPG Memoir 89, 385-400.
The PCCT Development Team, 2012. “Pressure core characterization tools to enhance gas hydrate field programs.” Fire In The Ice, 12(2), 7-9.
Santamarina, J.C., Dai, S., Jang, J., and Terzariol, M., 2012. “Pressure core characterization tools for hydrate-bearing sediments.” Scientific Drilling, 14, 44-48.
Takahashi, H. and Tsuji, Y., 2005. “Multi-well exploration program in 2004 for natural hydrate in the Nankai-Trough offshore Japan.” Offshore Technology Conference 17162, 1-10.
Yamamoto, K., Inada, N., Kubo, S., Fujii, T., Suzuki, K., Konno, Y., and Shipboard Scientists, 2012. “Pressure core sampling in the Eastern Nankai Trough.” Fire In The Ice, 12(2), 1-6.
Yun, T.S., Narsilio, G., Santamarina, J.C., and Ruppel, C., 2006. Instrumented pressure testing chamber for characterizing sediment cores recovered at in situ hydrostatic pressure, Marine Geology, 229, 285-293 (doi: 10.1016/j.margeo.2006.03.012).
23
usinG noble Gas siGnatures to FinGerprint Gas streams derived From dissoCiatinG methane hydrateBy Andrew G. Hunt, Carolyn Ruppel, Laura Stern, and John Pohlman, US Geological Survey
Introduction
Based on the knowledge that noble gas molecules partition into the gas hydrate lattice in the order of their molecular weight, the USGS Gas Hydrates Project, in collaboration with the USGS Noble Gas Laboratory in Denver, is investigating the potential of noble gas signatures for fingerprinting gas streams derived from dissociating gas hydrates.
Many natural processes can lead to the emission of methane gas. A critical challenge is determining which gas streams originate from dissociating gas hydrates versus other sources. The challenge is particularly acute in permafrost settings, where an ardent scientific debate rages over whether methane leaking into the atmosphere is sourced from dissociating gas hydrates or from non-hydrate sources, which may include shallow microbial gas, microbial gas produced from degradation of newly thawed organic carbon, deep thermogenic reservoirs, and coalbeds.
Carbon isotopic signatures are of limited use in distinguishing between hydrate- and non-hydrate sources of gas streams, because gas hydrates often sequester methane with δ13C signatures similar to those of local thermogenic and/or microbial methane sources. Noble gas signatures, on the other hand, may provide a useful alternative tool for distinguishing methane gas sources.
Previous Work
Noble gas signatures of gas hydrates were previously studied by Dickens and Kennedy (2000) and Winckler et al. (2002), but not for the purposes of fingerprinting gas streams emitted from dissociating methane hydrates. These studies provide important background, but the samples experienced significant air contamination. Conflicting results also led to questions about the true nature of noble gas storage in the methane hydrate lattice.
Experimental Approach
Taking advantage of the special capabilities of the USGS Noble Gas Laboratory, which is equipped with a state-of-the-art gas extraction line, coupled with a noble gas mass spectrometer, we performed an initial investigation of the fractionation of noble gas compositions during the formation and dissociation of methane hydrate under controlled laboratory conditions. The full paper on this project was published as Hunt et al. (2013).
Methane hydrate was synthesized using a modified version of the ice seed method (Stern et al., 1996). The synthesis gas was a mixture of methane plus pressurized air with uniform noble gas content (air-like isotopic composition of Ne, Ar, Kr, and Xe). Two samples were synthesized concurrently: a control sample that was dissociated immediately, and a
24
companion sample that was stored in liquid nitrogen and used for later testing.
Our protocol was to collect gas from (1) the source mixture (initial gas); (2) excess gas in the sample chambers prior to hydrate formation; (3) excess gas after complete conversion to hydrate (final gas); and (4) gas released during step-wise dissociation. Following methane hydrate synthesis, the control sample was quickly vented (while ensuring no air contamination) to release all unreacted gas. The synthesized hydrate was then heated and dissociated over multiple steps. Aliquots of the released gas were collected after each step. The companion sample was vented and quenched in liquid nitrogen, wrapped in aluminum foil and stored for 9 months in liquid nitrogen, and then dissociated in a similar step-wise manner. Additional samples were later synthesized to verify the reproducibility of our results and to analyze the bulk composition of the hydrate.
Results
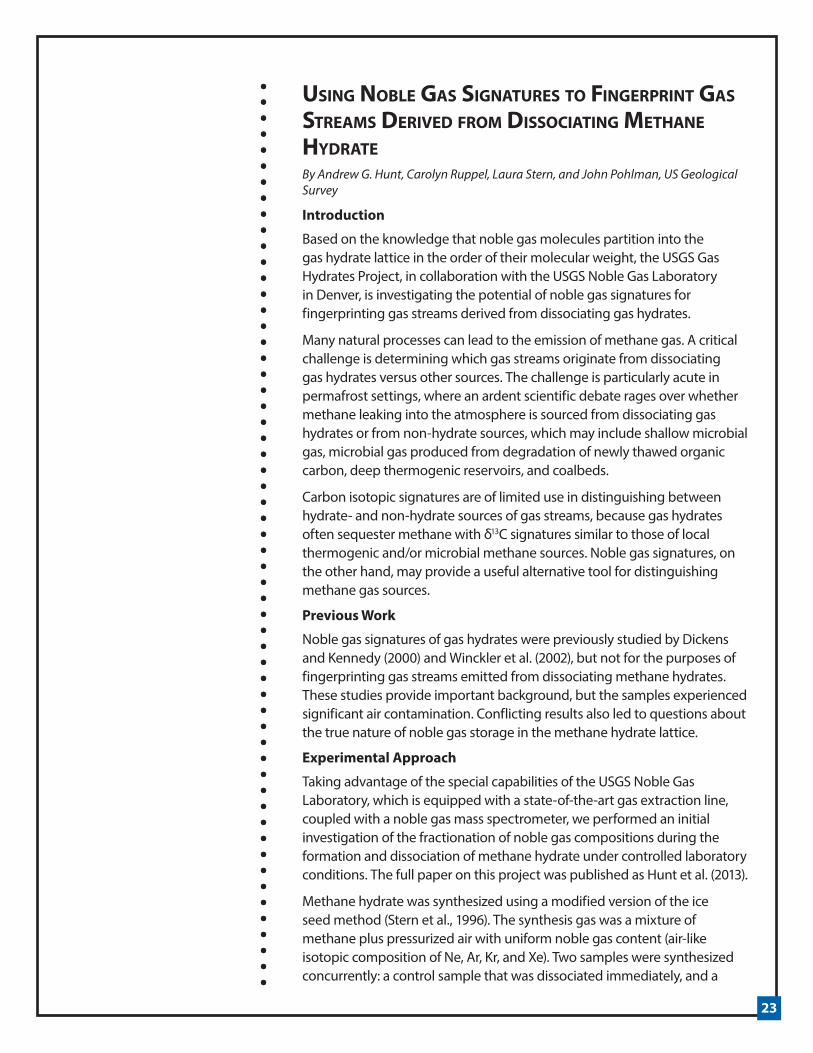
Analyses based on the control sample experiment show that noble gas fractionation occurs during the progressive dissociation of methane hydrate. We expected to observe uniform composition of the noble gases throughout the dissociation, but the results instead reveal a mass-dependent pattern of loss with progressive dissociation. The data suggest that lighter noble gases (4He, 20Ne, and 36Ar) fractionate from heavier noble gases (84Kr and 132Xe) early in dissociation (Figure 1a). The isotopic composition of each noble gas retained its original composition. Table 1 provides a possible explanation for the earlier release of He, Ne, and Ar, which are too small to stabilize cavities in Structure I gas hydrate.
Figure 1. Changes in noble gas compositions during step-wise dissociation (steps 1 to 8) of a methane hydrate control sample, and a companion sample that was stored in liquid nitrogen for 9 months. Fractions referred to on the axes are ratios of the concentrations of the indicated noble gas to that of argon in the sample, normalized by atmospheric argon. The initial gas is the synthesis mixture, while the final gas is the excess gas remaining after complete hydrate formation. (A) Relative concentrations of 4He and 20Ne during step-wise dissociation of the control sample are shown as red diamonds. The pattern of changing compositions indicates preferential loss of low molecular weight He first, followed by loss of higher molecular weight Ne. (B) Noble gas compositions during step-wise dissociation of the control sample (red; same dataset as shown in (A)) and the companion sample, which was stored in liquid nitrogen for 9 months (green symbols). The gas composition at the first dissociation step (1) for the stored sample is significantly different from that of the final gas, consistent with the loss of low molecular weight noble gases during storage.
25
The gas compositions from the companion sample indicate that a loss of lighter noble gases relative to the heavier gases occurred during storage in liquid nitrogen (Figure 1b). We postulate that low-molecular weight noble gases are preferentially lost from the hydrate lattice during storage, possibly due to reordering of the hydrate structure. Storage of samples in liquid nitrogen over a 9-month period had a demonstrable effect on the noble gas composition of the gas hydrate. These effects are likely to be more profound for samples undergoing longer-term storage.
Ideally, natural hydrate samples destined for noble gas analyses should therefore be degassed immediately, under conditions that limit air contamination and adhere to specific protocols. This approach was used by Ji-Hoon Kim of the Korean Institute of Geoscience and Mineral Resources and T. Collett of the USGS to provide us with samples during depressurization of a pressure core obtained during the second Korean drilling program (Ulleung Basin Gas Hydrates 2 or UBGH2).
Future Work
The USGS welcomes noble gas collaborations with researchers who have access to fresh subsurface hydrate samples and who are able to dissociate the samples at the field site according to specific protocols (contact: [email protected]).
The experiments that we have completed so far used gas hydrate formed from a free gas phase. Gas hydrate formation from dissolved gases could potentially alter the partitioning of noble gases in the hydrate lattice and thus the noble gas signatures during dissociation.
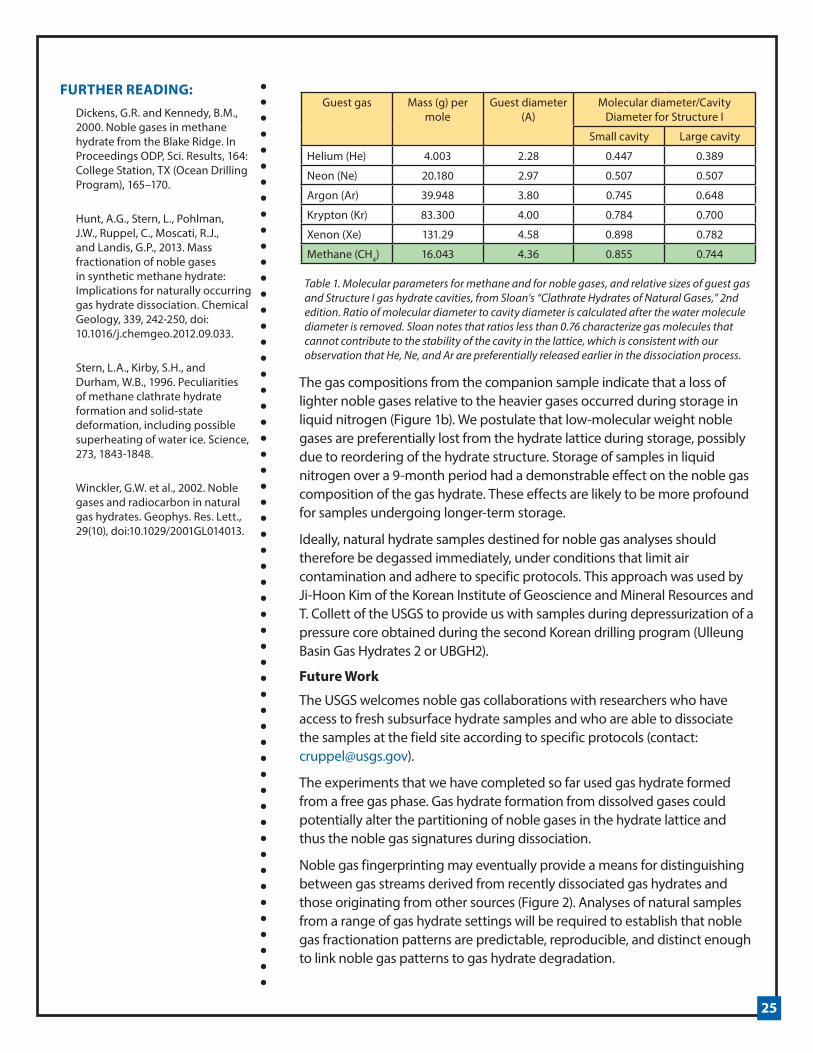
Noble gas fingerprinting may eventually provide a means for distinguishing between gas streams derived from recently dissociated gas hydrates and those originating from other sources (Figure 2). Analyses of natural samples from a range of gas hydrate settings will be required to establish that noble gas fractionation patterns are predictable, reproducible, and distinct enough to link noble gas patterns to gas hydrate degradation.
FURTHER READING:Dickens, G.R. and Kennedy, B.M., 2000. Noble gases in methane hydrate from the Blake Ridge. In Proceedings ODP, Sci. Results, 164: College Station, TX (Ocean Drilling Program), 165–170.
Hunt, A.G., Stern, L., Pohlman, J.W., Ruppel, C., Moscati, R.J., and Landis, G.P., 2013. Mass fractionation of noble gases in synthetic methane hydrate: Implications for naturally occurring gas hydrate dissociation. Chemical Geology, 339, 242-250, doi: 10.1016/j.chemgeo.2012.09.033.
Stern, L.A., Kirby, S.H., and Durham, W.B., 1996. Peculiarities of methane clathrate hydrate formation and solid-state deformation, including possible superheating of water ice. Science, 273, 1843-1848.
Winckler, G.W. et al., 2002. Noble gases and radiocarbon in natural gas hydrates. Geophys. Res. Lett., 29(10), doi:10.1029/2001GL014013.
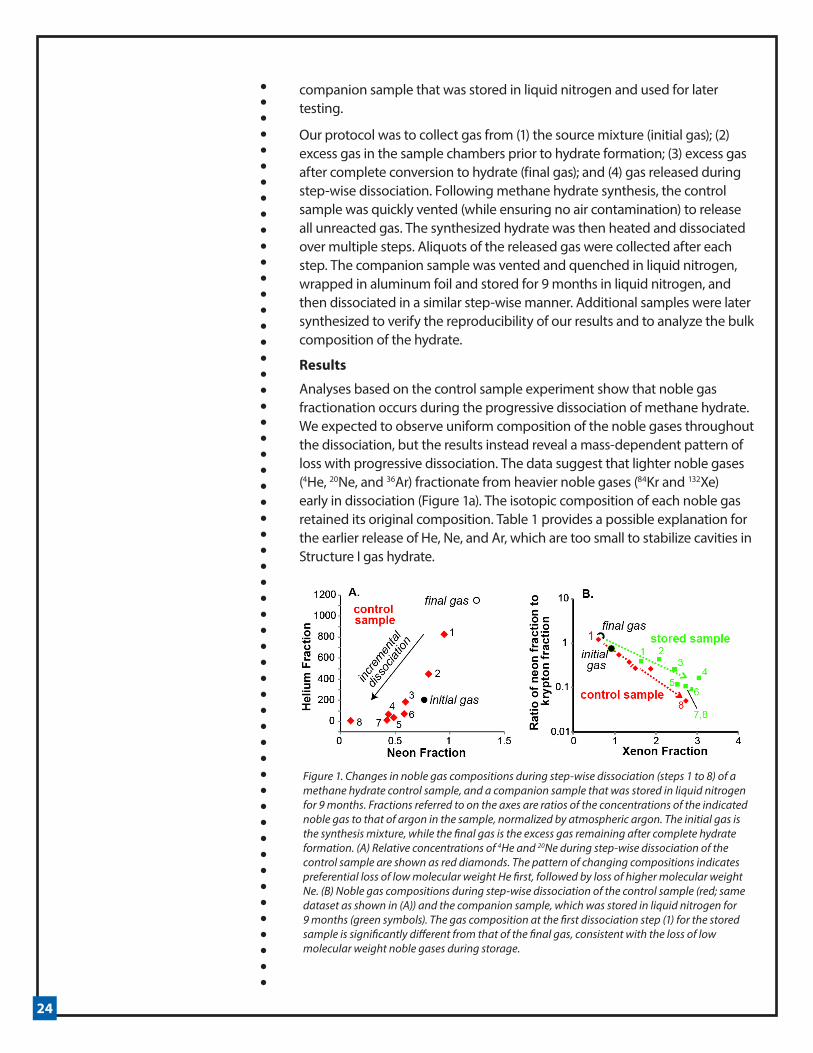
Guest gas Mass (g) per mole
Guest diameter (A)
Molecular diameter/Cavity Diameter for Structure I
Small cavity Large cavity
Helium (He) 4.003 2.28 0.447 0.389
Neon (Ne) 20.180 2.97 0.507 0.507
Argon (Ar) 39.948 3.80 0.745 0.648
Krypton (Kr) 83.300 4.00 0.784 0.700
Xenon (Xe) 131.29 4.58 0.898 0.782
Methane (CH4) 16.043 4.36 0.855 0.744
Table 1. Molecular parameters for methane and for noble gases, and relative sizes of guest gas and Structure I gas hydrate cavities, from Sloan’s “Clathrate Hydrates of Natural Gases,” 2nd edition. Ratio of molecular diameter to cavity diameter is calculated after the water molecule diameter is removed. Sloan notes that ratios less than 0.76 characterize gas molecules that cannot contribute to the stability of the cavity in the lattice, which is consistent with our observation that He, Ne, and Ar are preferentially released earlier in the dissociation process.
This work was supported in part by USGS-DOE interagency agreements DE-FE0002911 and DE-AI26-05NT42496. T. Lorenson provided instrumentation and assistance for degassing of hydrate samples. J. Pinkston helped with sample preparation and handling in Menlo Park. P. Warwick and colleagues in the USGS Energy Program provided coal bed gas samples from the 2009 Wainwright drilling program in 2009.
Figure 2. Compilation of noble gas signatures from various hydrocarbon streams, including our results for the control and stored synthetic methane hydrate samples from Figure 1. Axes are as defined in Figure 1. Square symbols denote gas hydrate samples that were stored in liquid nitrogen for varying lengths of time (9 months for our stored sample, to several years for the natural samples) prior to analysis. The Alaska coalbed and thermokarst lake gases were collected by the USGS from sites on the Alaskan North Slope in ~2009. The thermogenic oil and gas samples were analyzed by Torgerson and Kennedy in a 1999 study in Earth and Planetary Science Letters. Extensive discussion of the Blake Ridge and Hydrate Ridge analyses is given in Hunt et al. (2013).
27
Announcements
north slope oil and Gas lands set aside For methane hydrate researChThe State of Alaska Department of Natural Resources (DNR) is evaluating the potential of 11 tracts of state land on the North Slope for a long-term field test of methane hydrate production in cooperation with the U.S. Department of Energy (US DOE). The tracts will be deferred from the fall 2013 North Slope and Beaufort Sea lease sales to preserve the opportunity to evaluate them.
The 11 tracts were selected due to their potential to support methane hydrate research. However, if any of the tracts are found to be unnecessary for the research program, they will be offered in subsequent lease sales. The tracts share four characteristics: proximity to known methane hydrate deposits; location within zones with a probability for hydrate occurrence; proximity to existing North Slope infrastructure; and an unleased, unencumbered status. Alaska DNR will undertake further evaluation of the tracts to determine their suitability as research sites.
In April, Alaska DNR Commissioner Dan Sullivan and DOE Acting Assistant Secretary for Fossil Energy Chris Smith signed a Memorandum of Understanding (MOU) to foster and support unconventional fossil energy research in Alaska, including methane hydrates research. Identifying a suitable location for a long-term production test is an important step in furthering the research partnership between the State of Alaska and the US DOE.
The AK DNR and US DOE are weighing options for proceeding with research if hydrate prospects are confirmed on one or more of the tracts. These options include possible opportunities for private companies to partner with DNR and DOE on research. Activity associated with shallow hydrates research is unlikely to interfere with evaluation of deeper, conventional oil and gas potential on the deferred tracts.
A copy of the MOU between AK DNR and US DOE is available at http://dnr.alaska.gov/commis/priorities/Signed_MOU.pdf
For further information, please contact Alaska DNR Division of Oil and Gas Director Bill Barron, at (907) 269-8800.
2014 oFFshore teChnoloGy ConFerenCe to have sessions on methane hydratesThe Upcoming Offshore Technology Conference, to be held May 5-8, 2014 in Houston, TX will have several sessions dedicated to the latest developments in the evaluation of methane hydrate resources and associated geohazards. Session co-conveners George Moridis (Lawrence Berkeley National Laboratory), Tim Collett (US Geological Survey), and Ray Boswell (National Energy Technology Laboratory) are expecting multiple sessions with broad international participation.
For further information on the conference, please visit http://www.otcnet.org/2014/
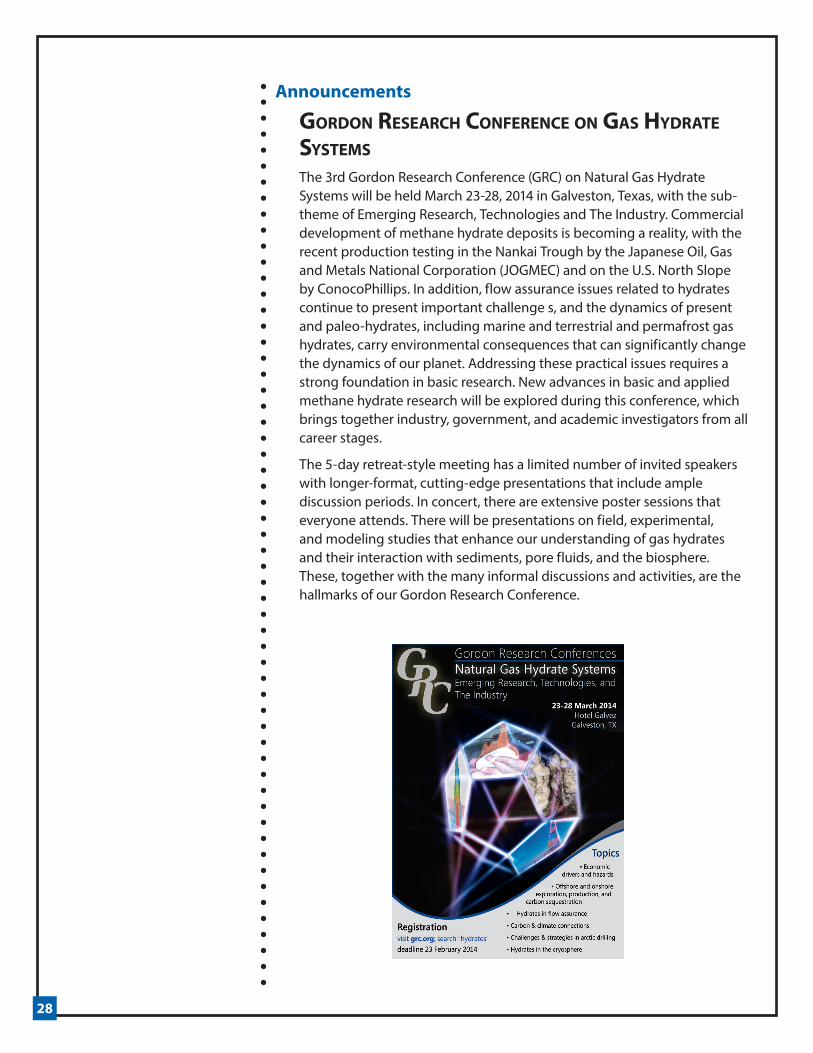
The 3rd Gordon Research Conference (GRC) on Natural Gas Hydrate Systems will be held March 23-28, 2014 in Galveston, Texas, with the sub-theme of Emerging Research, Technologies and The Industry. Commercial development of methane hydrate deposits is becoming a reality, with the recent production testing in the Nankai Trough by the Japanese Oil, Gas and Metals National Corporation (JOGMEC) and on the U.S. North Slope by ConocoPhillips. In addition, flow assurance issues related to hydrates continue to present important challenge s, and the dynamics of present and paleo-hydrates, including marine and terrestrial and permafrost gas hydrates, carry environmental consequences that can significantly change the dynamics of our planet. Addressing these practical issues requires a strong foundation in basic research. New advances in basic and applied methane hydrate research will be explored during this conference, which brings together industry, government, and academic investigators from all career stages.
The 5-day retreat-style meeting has a limited number of invited speakers with longer-format, cutting-edge presentations that include ample discussion periods. In concert, there are extensive poster sessions that everyone attends. There will be presentations on field, experimental, and modeling studies that enhance our understanding of gas hydrates and their interaction with sediments, pore fluids, and the biosphere. These, together with the many informal discussions and activities, are the hallmarks of our Gordon Research Conference.
29
AnnouncementsParticipants include geoscientists, microbiologists, physicists, and chemists, as well as energy, geotechnical, and chemical engineers. This conference specifically encourages intensive exchange and discussion of unpublished, state-of-the-art advances in gas hydrate sciences and allied disciplines.
This year we are also hosting a Gordon Research Seminar that brings early investigators and students together immediately before the conference. Early career researchers are encouraged to participate in this seminar, which will provide an excellent opportunity to initiate discussions among young researchers within a comfortable, peer-to-peer environment. We strongly encourage seminar participants to participate in the conference.
Applications for this meeting must be submitted by February 23, 2014.
new booK published on hydrate resourCes in the deepwater arCtiC oCeanMethane hydrate experts Michael Max, Art Johnson, and Bill Dillon have published a new book entitled “Natural Gas Hydrate – Arctic Ocean Deepwater Resource Potential.” The book begins with background information on Arctic tectonics and sedimentation and follows with detailed discussions of hydrate-specific topics. Included are chapters on the natural gas hydrate petroleum system in the Arctic, gas hydrate production factors, the path to commercialization, environmental and safety risk factors, and estimates of the natural gas hydrate resource base in the Arctic region. The book is available from Springer Publishing and is part of the series “Springer Briefs in Energy.”
For more information, please go to http://www.grc.org/programs.aspx?year=2014&program=naturalgas
Dr. J. Carlos Santamarina is a man who is not easy to label or categorize. He has established himself as an innovative and effective experimentalist, developing highly specialized instruments and methods to monitor the response of hydrate-bearing sediments to different thermal, chemical, and geomechanical conditions.
In the lab, Carlos and his team make careful observations of these processes at the microscopic scale. Yet, his thoughts are never far from the big picture. In fact, he is concerned with environmental challenges and energy sustainability at the global scale. He is continually asking questions like, “How can we use our scientific understanding of earth materials and systems to develop solutions to the most challenging problems that humanity has faced? How can we optimize our energy sustainability and minimize the impacts of our energy use on climate?” These are the types of questions that sparked his interest in methane hydrates.
Santamarina was born and raised in Córdoba, Argentina, the second largest city in Argentina. But, he is quick to point out that he spent long summer breaks at a remote farm in rural Argentina. The farm lacked electricity or running water. Santamarina remembers, “The farm workers and their families had not had a chance to learn to read and write, yet many were careful observers of natural phenomena and had developed great wisdom and profound understanding of the way things work.” Their example inspired Carlos to become an attentive observer of the natural world.
His parents certainly nurtured his interest in science. They gave him books with hundreds of math exercises to do every summer and paid him a few pennies for each problem completed correctly. One year, his father raised the bar and gave his son a book called “700 Science Experiments for Everyone,” compiled by the United Nations Educational, Scientific, and Cultural Organization (UNESCO). This book kept young Carlos engaged for years—carrying out experiments on bacteria, plants, ants, rocks, soils, distillation, freezing, surface tension, electromagnetic and sound waves. Santamarina says, “This book was incredible. I am still publishing work that builds on all of those concepts and experimental approaches!”
Santamarina also credits amazing teachers and professors for encouraging his scientific interests– especially L. Moll, his soil mechanics professor at the Universidad Nacional de Córdoba. Moll shared his broad knowledge in geotechnical engineering with his students and was unconditionally dedicated to the Geotechnical Research Group. More recently, Santamarina was persuaded by Carolyn Ruppel, renowned USGS scientist, to pursue research related to methane hydrates; this resulted in a productive and enriching collaboration.
People in the methane hydrates research world may not know that Santamarina did his PhD in fuzzy logic and artificial intelligence. He has kept this research alive, as a hobby focused on achieving a deeper understanding of the creative process in human beings. In a recent TED talk, he addresses the question of what factors enhance creativity and sustain ingenuity in science and engineering. In this work, he finds that the most important predictor of creativity in science is focused dedication. This is why, when asked for advice for young people who are considering a career in science, Santamarina says, “Put your heart and soul into what you do! Do not hold back.”
J. CARLOS SANTAMARINAProfessor of Civil and Environmental EngineeringGeorgia Institute of [email protected]
For those interested in Santamarina’s work on the nature of creativity, his TED talk on the subject can be viewed at: http://tedxtalks.ted.com/video/TEDxCreativeCoast-J-Carlos-Sant
The UNESCO book of 700 scientific experiments can be found at: http://www.arvindguptatoys.com/arvindgupta/700un1.pdf
Santamarina is a scientist, an engineer, and a philosopher, and he seems to jump across these academic boundaries without hesitation. He obviously finds satisfaction and freedom in exploring diverse topics. When not engaged in research, he enjoys long walks with his wife. For a man who loves his work and cherishes family and friends, these walks provide a sense of stretching time and a chance for regeneration.


![1 1 1 1 1 1 1 ¢ 1 1 1 - pdfs.semanticscholar.org€¦ · 1 1 1 [ v . ] v 1 1 ¢ 1 1 1 1 ý y þ ï 1 1 1 ð 1 1 1 1 1 x ...](https://static.documents.pub/doc/80x56/5f7bc722cb31ab243d422a20/1-1-1-1-1-1-1-1-1-1-pdfs-1-1-1-v-v-1-1-1-1-1-1-y-1-1-1-.jpg)


![1 $SU VW (G +LWDFKL +HDOWKFDUH %XVLQHVV 8QLW 1 X ñ 1 … · 2020. 5. 26. · 1 1 1 1 1 x 1 1 , x _ y ] 1 1 1 1 1 1 ¢ 1 1 1 1 1 1 1 1 1 1 1 1 1 1 1 1 1 1 1 1 1 1 1 1 1 1 1 1 1 1](https://static.documents.pub/doc/80x56/5fbfc0fcc822f24c4706936b/1-su-vw-g-lwdfkl-hdowkfduh-xvlqhvv-8qlw-1-x-1-2020-5-26-1-1-1-1-1-x.jpg)
![$1RYHO2SWLRQ &KDSWHU $ORN6KDUPD +HPDQJL6DQH … · 1 1 1 1 1 1 1 ¢1 1 1 1 1 ¢ 1 1 1 1 1 1 1w1¼1wv]1 1 1 1 1 1 1 1 1 1 1 1 1 ï1 ð1 1 1 1 1 3](https://static.documents.pub/doc/80x56/5f3ff1245bf7aa711f5af641/1ryho2swlrq-kdswhu-orn6kdupd-hpdqjl6dqh-1-1-1-1-1-1-1-1-1-1-1-1-1-1.jpg)


