Page 1
_______________________________________________________________________
Miami-Dade Water and Sewer Department
Ocean Outfall Legislation
Chapter 2008-232 Laws of Florida Wastewater
Disposal/Ocean Outfalls
[Section 403.086 (9), Florida Statutes
and Amendment CS/SB 444]
Compliance Plan
June 28, 2013
_______________________________________________________________________
Miami-Dade
Water and Sewer Department
P.O. Box 33-0316, Miami, FL 33233-0316
Page 3
i
Table of Contents
1.0 Executive Summary .................................................................................................... 1
2.0 Introduction ................................................................................................................ 3
2.1 Ocean Outfall Legislation ................................................................................. 3
2.2 Miami-Dade Water and Sewer Department (MDWASD) Requirements ......... 4
2.3 Plan Development Approach ........................................................................... 7
3.0 EPA Consent Decrees .................................................................................................. 8
4.0 Nutrient Reduction Plan ............................................................................................. 8
5.0 Flow Projections ....................................................................................................... 15
5.1 Population Projections ................................................................................... 15
5.2 Wastewater .................................................................................................... 15
5.3 Water.............................................................................................................. 18
6.0 Sea Level Rise (SLR), Storm Surge ............................................................................. 21
7.0 Alternatives Development and Evaluation ............................................................... 43
7.1 General ........................................................................................................... 43
7.2 Reuse .............................................................................................................. 43
7.2.1 OOL Requirement............................................................................ 43
7.2.2 Summary of Options ....................................................................... 43
7.2.3 Treatment Requirements ................................................................ 44
7.2.4 Evaluation ........................................................................................ 45
7.3 Wastewater .................................................................................................... 48
7.3.1 Wastewater Treatment ................................................................... 48
7.3.2 Ocean Outfall Discharges/HLD Capacities ...................................... 48
7.3.3 Alternatives Evaluated .................................................................... 49
7.3.4 Transmission System Analysis ......................................................... 50
7.3.5 Analysis Results ............................................................................... 50
7.3.6 Decommissioning of the CDWWTP ................................................. 52
7.3.7 Alternative Selection ....................................................................... 55
8.0 The Recommended Plan ........................................................................................... 67
8.1 General ........................................................................................................... 67
8.2 Descriptions of Facilities ................................................................................ 68
Page 4
ii
8.2.1 Reuse ............................................................................................... 68
8.2.2 Transmission ................................................................................... 68
8.2.3 Treatment........................................................................................ 70
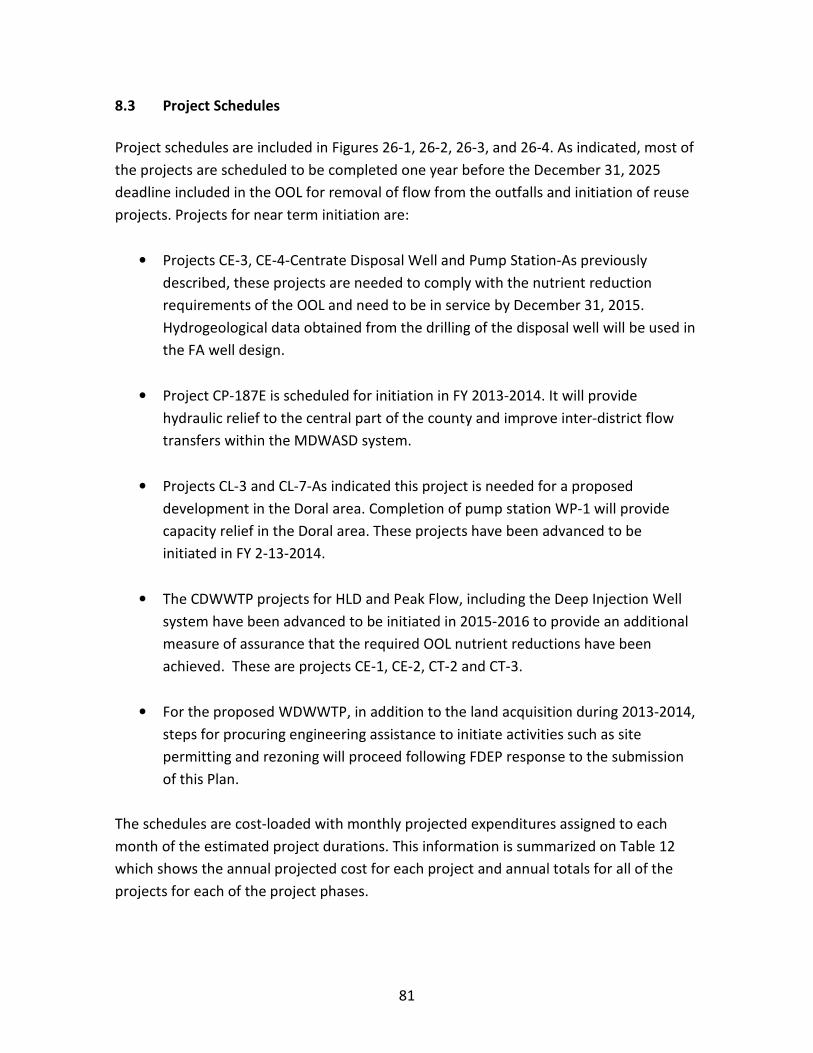
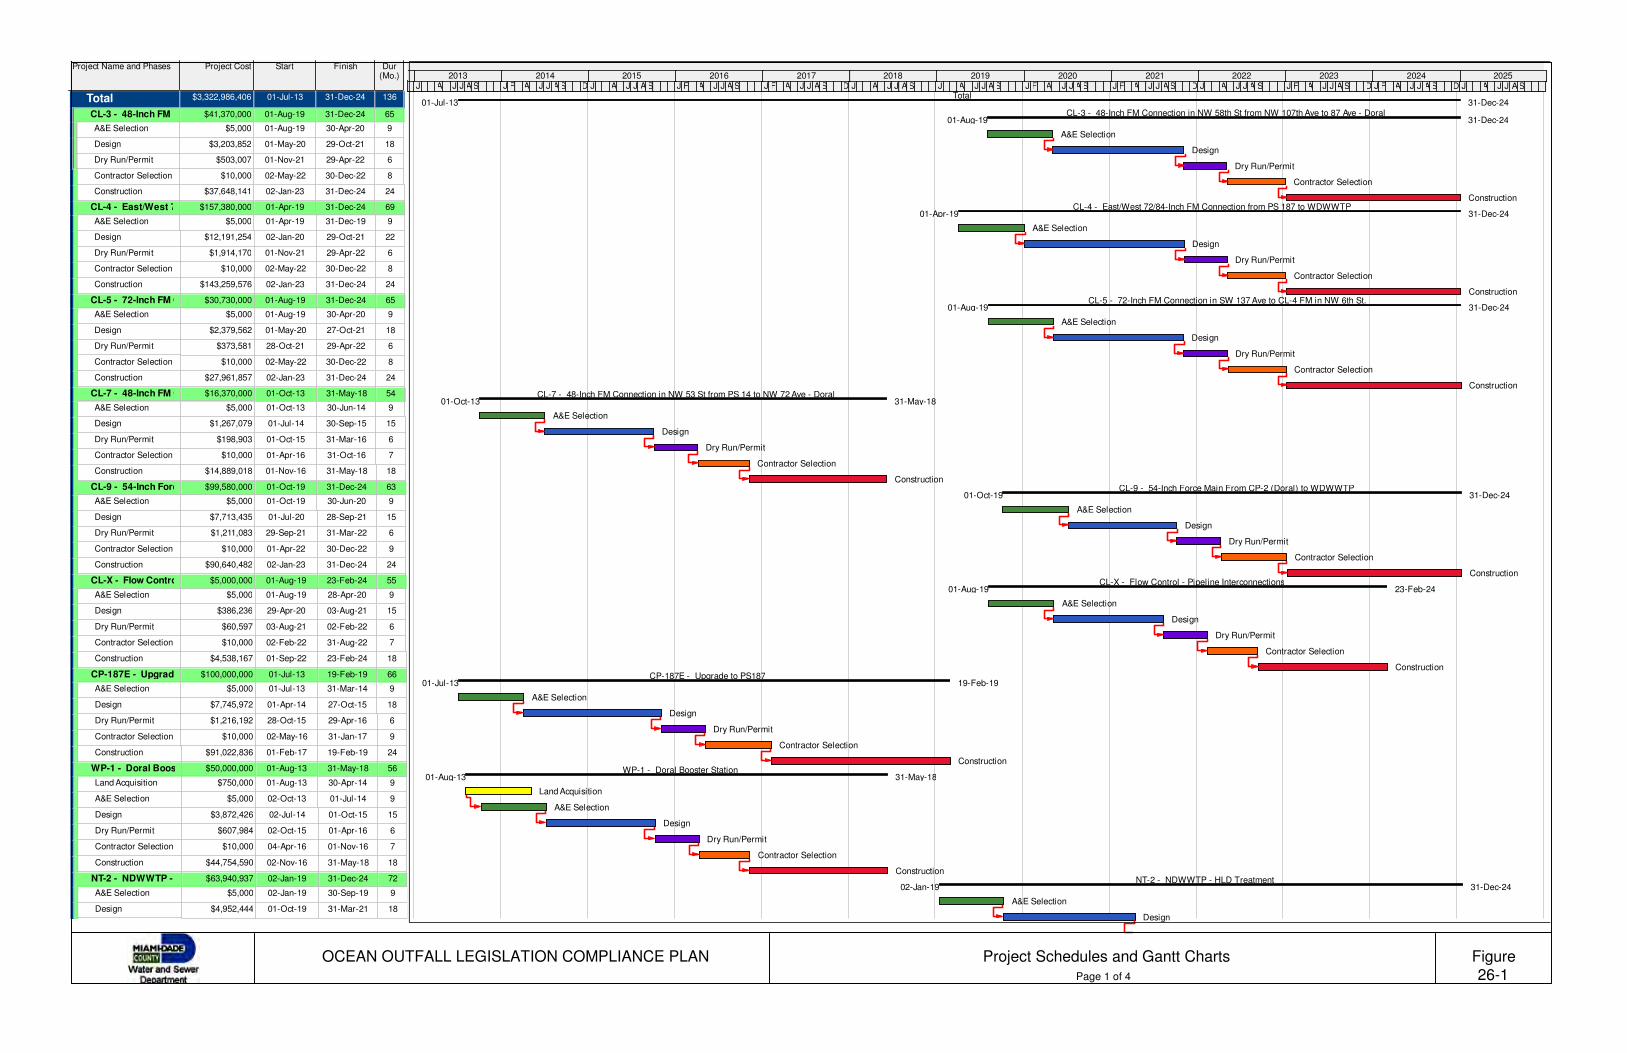
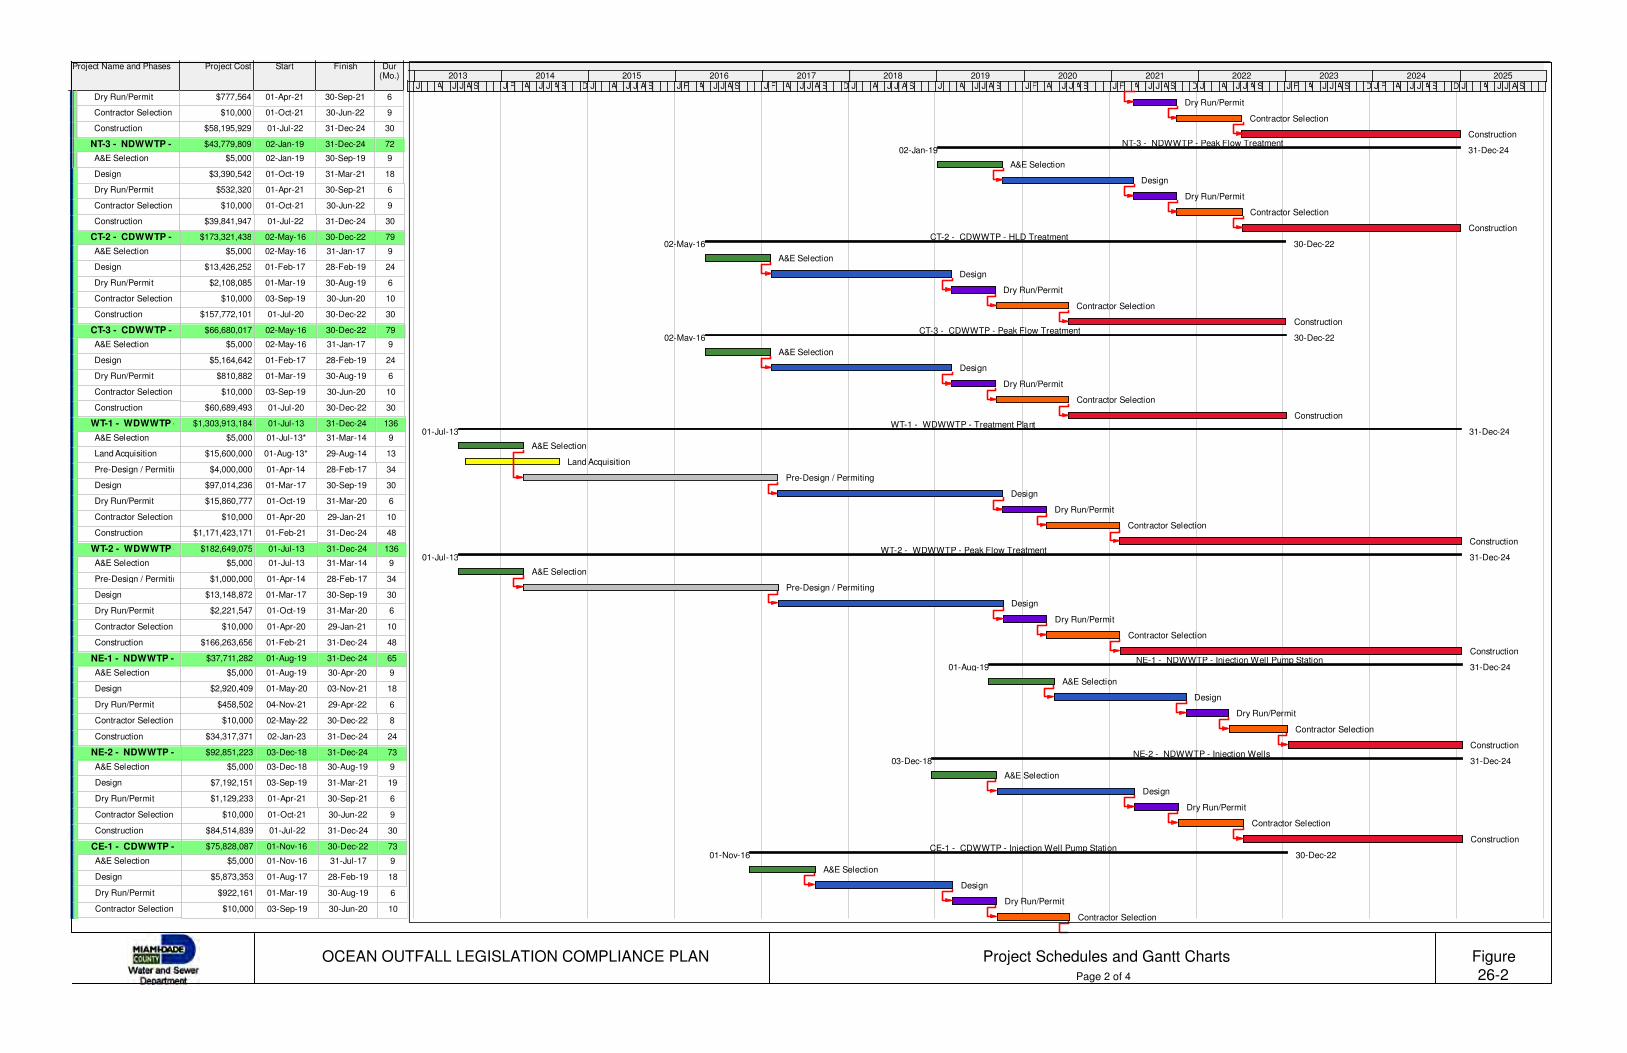
8.3 Project Schedules ........................................................................................... 81
8.4 Financial Plan ................................................................................................. 93
8.5 Public Meeting ............................................................................................... 94
Figures
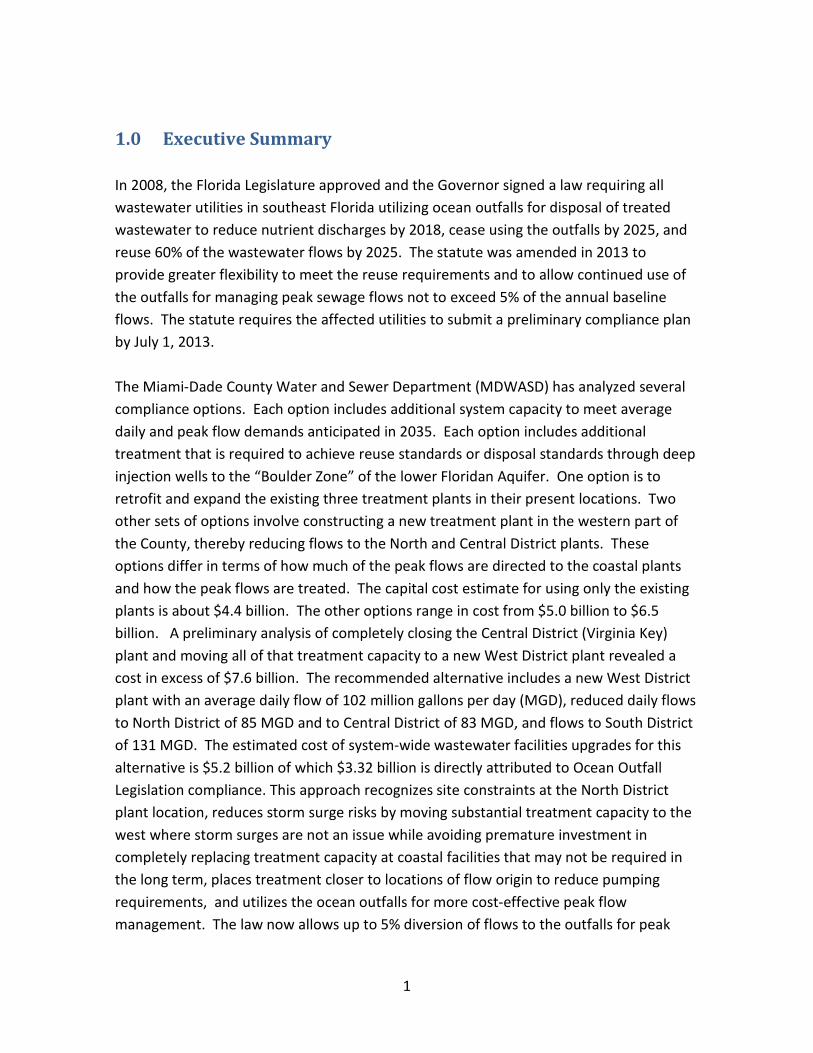
1 MDWASD Wastewater Facilities ............................................................................... 5
2 Nutrient Reduction Plan-Total Nitrogen ................................................................... 9
3 Nutrient Reduction Plan-Total Phosphorus ............................................................ 11
4 Centrate Disposal System Schematic ...................................................................... 13
5 MDWASD Alternative Water Supply (AWS) Projects .............................................. 19
6 Florida Regional Climate Change Compact-Sea Level Rise Projections .................. 23
7 NDWWTP-2 ft Sea Level Rise .................................................................................. 25
8 NDWWTP-3 ft Sea Level Rise .................................................................................. 27
9 CDWWTP-2 ft Sea Level Rise ................................................................................... 29
10 CDWWTP-3 ft Sea Level Rise ................................................................................... 31
11 SDWWTP-2 ft Sea Level Rise ................................................................................... 33
12 SDWWTP-3 ft Sea Level Rise ................................................................................... 35
13 NDWWTP-Storm Surge Analysis ............................................................................. 37
14 CDWWTP-Storm Surge Analysis .............................................................................. 39
15 SDWWTP-Storm Surge Analysis .............................................................................. 41
16 Wastewater System Alternatives Matrix ................................................................ 51
17 Alternative 1 Facilities ............................................................................................. 57
18 Alternative 2A-1-1,-2 Facilities ................................................................................ 59
19 Alternative 2A-2-1,-2 Facilities ................................................................................ 61
20 Alternative 2B-1 Facilities ....................................................................................... 63
21 Alternative 2B-2 Facilities ....................................................................................... 65
22 NDWWTP-Proposed Facilities ................................................................................. 73
23 CDWWTP-Proposed Facilities ................................................................................. 75
24 SDWWTP-Proposed Facilities .................................................................................. 77
25 WDWWTP-Preliminary Site Plan ............................................................................. 79
26-1 Project Schedules and Gantt Charts, Page 1 of 4 .................................................... 83
26-2 Project Schedules and Gantt Charts, Page 2 of 4 .................................................... 85
26-3 Project Schedules and Gantt Charts, Page 3 of 4 .................................................... 87
26-4 Project Schedules and Gantt Charts, Page 4 of 4 .................................................... 89
Page 5
iii
Tables
1 NDWWTP and CDWWTP Ocean Outfall Flows Calendar Years 2003 - 2007 ............... 4
2 Projected System-Wide Wastewater Flows and Design Capacities, Mgd ................. 17
3 Estimated Replacement Costs-MDWASD WWTPs Electrical and Instrumentation
Systems ...................................................................................................................... 22
4 Project Designation System ....................................................................................... 43
5 Treatment Levels for Various Types of Reuse ........................................................... 44
6 Potential Reuse Project Summary ............................................................................. 46
7 Feasibility for Various Types of Reuse ....................................................................... 47
8 Preliminary Opinion of Costs - Ocean Outfall Legislation-Compliance Plan
Alternatives ................................................................................................................ 53
9 Alternatives Ranked by Project Cost in Ascending Order .......................................... 56
10 OOL Compliance Plan Projects ................................................................................... 69
11 Wastewater Treatment Plant Design Parameters ..................................................... 71
12 OOL Projects-Annual Projected Expenditures by Project and Project Phases .......... 90
13 Comparison of Recommended Plan to Proposed MYCP ........................................... 93
Appendices
A Ocean Outfall Legislation-, Florida Statutes Chapter 2008-232-Section 403.086-
Wastewater Disposal/Ocean Outfalls
B Amendment to Ocean Outfall Legislation-Florida Statues Chapter 2013-31
C Joint Participation Agreement between Miami-Dade County and Florida Power &
Light Company Providing for Development of a Reclaimed Water Project
D Exhibit D-3, Capital Project Costs in 2012 dollars with a 3.2% inflation starting in
Fiscal Year from Consent Decree
E Flow Projections by Pump Station
F NDWWTP, CDWWTP Flow Analysis 2003-2012
G Detailed Alternative Cost Breakdowns
H WWTP Alternatives Flow Diagrams
I CDWWTP Decommissioning Transmission System and Cost Breakdown
J Floridan Aquifer Hydrogeological Model Results
K Doral Pump Station (CP-2) Potential Sites
L WDWWTP Site Selection Summary and Preliminary Site Fill Requirements and Cost
Estimate
M Public Meeting-Presentation and Sign-In List
Page 6
iv
Abbreviations
AADF Annual Average Daily Flow
AWS Alternative Water Supply
AWT Advanced Wastewater Treatment
BCC Board of County Commissioners
CBMYCP Capital Budget Multi-Year Capital Plan
CDWWTP Central District Wastewater Treatment Plant
CERP Comprehensive Everglades Restoration Plan
EPA Environmental Protection Agency
FA Floridan Aquifer
FDEP Florida Department of Environmental Protection
FPL Florida Power & Light Company
GIS Geographical Information System
IMP Integrated Master Plan
MIA Miami International Airport
Gpd gallons/day
HLD High Level Disinfection
LEC Lower East Coast
mgd million gallons/day
MBR membrane bioreactor
MDWASD Miami-Dade Water and Sewer Department
MF microfiltration
NOAA National Oceanic and Atmospheric Administration
NDWWTP North District Wastewater Treatment Plant
OOL Ocean Outfall Legislation
RDII Rainfall Dependent Infiltration/Inflow
RO Reverse Osmosis
SCADA Supervisory Control and Data Acquisition
SDWWTP South District Wastewater Treatment Plant
SFWMD South Florida Water Management District
SLR Sea Level Rise
TP Total Phosphorus
TN Total Nitrogen
TAZ Traffic Analysis Zone
UV Ultraviolet disinfection
WDWWTP West District Wastewater Treatment Plant
WTP Water Treatment Plant
WWTP Wastewater Treatment Plant
Page 7
1
1.0 Executive Summary
In 2008, the Florida Legislature approved and the Governor signed a law requiring all
wastewater utilities in southeast Florida utilizing ocean outfalls for disposal of treated
wastewater to reduce nutrient discharges by 2018, cease using the outfalls by 2025, and
reuse 60% of the wastewater flows by 2025. The statute was amended in 2013 to
provide greater flexibility to meet the reuse requirements and to allow continued use of
the outfalls for managing peak sewage flows not to exceed 5% of the annual baseline
flows. The statute requires the affected utilities to submit a preliminary compliance plan
by July 1, 2013.
The Miami-Dade County Water and Sewer Department (MDWASD) has analyzed several
compliance options. Each option includes additional system capacity to meet average
daily and peak flow demands anticipated in 2035. Each option includes additional
treatment that is required to achieve reuse standards or disposal standards through deep
injection wells to the “Boulder Zone” of the lower Floridan Aquifer. One option is to
retrofit and expand the existing three treatment plants in their present locations. Two
other sets of options involve constructing a new treatment plant in the western part of
the County, thereby reducing flows to the North and Central District plants. These
options differ in terms of how much of the peak flows are directed to the coastal plants
and how the peak flows are treated. The capital cost estimate for using only the existing
plants is about $4.4 billion. The other options range in cost from $5.0 billion to $6.5
billion. A preliminary analysis of completely closing the Central District (Virginia Key)
plant and moving all of that treatment capacity to a new West District plant revealed a
cost in excess of $7.6 billion. The recommended alternative includes a new West District
plant with an average daily flow of 102 million gallons per day (MGD), reduced daily flows
to North District of 85 MGD and to Central District of 83 MGD, and flows to South District
of 131 MGD. The estimated cost of system-wide wastewater facilities upgrades for this
alternative is $5.2 billion of which $3.32 billion is directly attributed to Ocean Outfall
Legislation compliance. This approach recognizes site constraints at the North District
plant location, reduces storm surge risks by moving substantial treatment capacity to the
west where storm surges are not an issue while avoiding premature investment in
completely replacing treatment capacity at coastal facilities that may not be required in
the long term, places treatment closer to locations of flow origin to reduce pumping
requirements, and utilizes the ocean outfalls for more cost-effective peak flow
management. The law now allows up to 5% diversion of flows to the outfalls for peak
Page 8
2
flow management, but this plan only requires 0.4% of flows on an annual basis to be
discharged after treatment through the outfalls.
Reduction of nutrient discharges is accomplished by continued use of four deep injection
wells at the North District plant, thereby diverting flows from the outfall, and the
construction of an industrial injection well at the Central District plant for disposal of
nutrient-rich water (centrate) coming from the centrifuge process used to remove water
from the sludge. This combination of nutrient diversion will meet the nutrient reduction
requirements with the industrial well in service by 2016.
The statute requires reuse of 117.5 million gallons of treated wastewater per day, by far
the largest volume of reuse of any utility in Florida. This will be accomplished through a
contract with Florida Power and Light to provide up to 90 MGD of reuse water for cooling
purposes at their Turkey Point facilities. An additional 27.5 MGD of reuse water will be
used to replenish the Floridan aquifer at the Central, South, and West District plants.
None of this reuse is needed to meet drinking water supply needs until at least 2035
according to current demand forecasts made by WASD and the South Florida Water
Management District, so there is no direct or immediate water supply benefit that will
occur. Pursuant to the amended statute, the affected utilities will review the proposed
reuse plans with the Florida Department of Environmental Protection (FDEP) and the
South Florida Water Management District (SFWMD), and FDEP will provide a report to the
Legislature by 2015 recommending any adjustments to the reuse requirements based
upon that review. This draft plan was presented to the community at an advertised
meeting on June 5, 2013. The recommended compliance option is technically feasible,
but very expensive (as are all of the options) in terms of the required treatment and
collection system changes. Detailed design and construction is likely to require an 8 to 10
year time period. While provisions were made in the outfall statute to give priority to
outfall projects for state project funding, state appropriations to fund water projects have
not yet materialized, and the mandate remains unfunded at the state level. Revenue
bonds will necessarily be the major funding source for these improvements in the
absence of state and federal assistance. A more detailed financial plan will be prepared
as part of the Consent Decree requirement for a financial plan as well as the
Department’s regular updates of the Multi-Year Capital Improvements Plan.
This preliminary plan will be reviewed by the FDEP to determine compliance with the
requirements of the statute. An update of the plan is due to FDEP no later than July 1,
2016. A more detailed implementation plan will need to be in place by that time,
including actual construction of some plan components, to assure that the 2025 deadline
is met.
Page 9
3
2.0 Introduction
2.1 Ocean Outfall Legislation
On June 30, 2008, Governor Charlie Crist signed Senate Bill 1302 related to wastewater
disposal/ocean outfalls (Section 403.086(9)). Subsequently, on June 24, 2013, present
Governor Rick Scott signed a revision to the Ocean Outfall Legislation. Main
requirements of the bill, described herein as OOL, as amended follow below. Parameters
as described relating to compliance with the OOL for the Miami-Dade Water and Sewer
Department (MDWASD) are tabulated in the next section. A copy of the OOL and
Amendment are included as Appendices A and B, respectively. Requirements are:
• The elimination of ocean outfalls that are being used for treated wastewater
disposal as a primary means of domestic wastewater discharge by December 31,
2025 with the following exceptions:
o Outfalls serving as a backup to a functioning reuse systems
o Peak flows may not cumulatively exceed 5 percent a facility’s baseline flow,
measured on a five year rolling average and are subject to applicable
secondary waste treatment and water quality-based effluent limitations
specified in department rules. Baseline flow is defined as “the annual average
flow of domestic wastewater discharging through the facility’s ocean outfall,
as determined by the department, using monitoring data available for
calendar years 2003 through 2007.”
• A functioning reuse system that reuses a minimum of 60 percent of the facility’s
baseline flow on an annual basis must be installed no later than December 31,
2025 at each domestic wastewater facility that discharges through an ocean
outfall. Provision is included for utilities with multiple outfalls (such as MDWASD
which operates two) that the 60 percent reuse requirement is applicable to the
combined flow of the facilities. The MDWASD outfalls are located at the North
and Central District Wastewater Treatment Plants (NDWWTP and CDWWTP).
MDWASD wastewater facilities are shown on Figure 1.
All regular domestic wastewater discharged through ocean outfalls must either meet
advanced wastewater treatment (AWT) and management by December 31, 2018, or an
equivalent reduction in the cumulative outfall loadings of total nitrogen (TN) and total
phosphorus (TP), between December 31, 2008 and December 31, 2025 which would be
Page 10
4
achieved if the AWT were fully implemented beginning December 31, 2018 and continued
through December 31, 2025.
• Submission of a Plan to the Florida Department of Environmental Protection
(FDEP) by July 1, 2013, describing how the outfalls will be eliminated from regular
use for wastewater disposal. This Compliance Plan is intended to meet this
requirement. The Plan must include:
o Technical, environmental, and economic feasibility of reuse
o Land acquisition
o Facilities necessary and costs to meet treatment requirements
o Cost comparison
o Financing plan
o Schedules
• By July 1, 2016 submission of a plan update with refinements in costs, actions, and
financing.
2.2 Miami-Dade Water and Sewer Department (MDWASD) Requirements
Discharges through the existing Ocean Outfalls at the North and Central District plants for
the calendar years 2003 through 2007 (baseline flows) and reuse requirements are
summarized on Table 1.
Table 1
NDWWTP and CDWWTP Ocean Outfall Flows, Mgd
Calendar Years 2003 through 2007
NDWWTP CDWWTP Total
2003 81.1 114.8 195.9
2004 73.8 113.1 186.9
2005 78.6 122.2 200.8
2006 78.5 109.3 187.8
2007 90.4 114.8 205.2
Average 81.0 114.8 195.8
Reuse Requirement,
60% 48.6 68.9 117.5*
*Reuse at any location within the MDWASD system to meet 117.5 mgd is acceptable.
Page 11
Fig
ure
1
M
DW
AS
D W
aste
wa
ter
Fa
cili
tie
s
OC
EA
N O
UT
FA
LL L
EG
ISL
AT
ION
CO
MP
LIA
NC
E P
LA
N
Page 13
7
• Note that MDWASD has entered into an Agreement with Florida Power & Light
Company (FPL) to provide 90 mgd of reclaimed water to existing unit 5 and
proposed units 6 and 7 at the FPL Turkey Point power generating complex. A copy
of the Joint Participation Agreement for this in included as Appendix C. The 2013
OOL Amendment allows for the establishment of the required reuse “within the
utility’s service area” so that based on crediting the 90 mgd reuse for FPL against
the 117.5 mgd requirement, an additional 27.5 mgd of reuse is required.
2.3 Plan Development Approach
Due to the extensive nature of the modifications necessary to comply with the OOL, the
analysis conducted for this Plan is in the form of a formal facilities master plan which
includes the following elements:
• Selection of Planning Horizon (Year 2035)
• Flow Projections
• Alternatives Development and Evaluation
• Plan Selection
• Implementation Plan, including Scheduling
• Financing Plan
The original approach was to develop the OOL Compliance Plan as part of an Integrated
Water, Wastewater, Reclaimed Water Master Plan. With recent population projections,
issued by the Miami-Dade County Regulatory and Economic Resources Department (RER),
Office of Sustainability, Planning and Economic Enhancement (SPEE), derived from the
2010 census, the 2035 projected county population has been reduced from 3,365,791 to
3,172,406. This represents a 5.7% decrease. With this reduction, it is anticipated that
water supply projects in addition to those already planned will not be needed over the
period through the year 2035. Figures regarding this follow a later section.
Based on the above, it was determined that the reuse component of the Compliance Plan
will not provide future water supply and that the integrated approach is not necessary.
The Integrated Master Plan (IMP) will proceed, however, in order to have respective
water and wastewater planning fully coordinated; based on the updated population
projections for both the water and wastewater systems with completion anticipated in
mid-2014.
Page 14
8
3.0 EPA Consent Decrees
On January 13, 1994 and September 11, 1995 respectively, the First Partial and
Second/Final Partial Consent Decrees were entered into with the EPA. MDWASD has
complied with all of the provisions of these Consent Decrees.
Subsequently, the peak flow criteria prescribed in SFPCD, paragraph 17, were
implemented and used to derive peak flow projections for the analyses of the collection
and transmission system alternatives including hydraulics computerized modeling to
evaluate the ability of each pump station to manage peak flows, identify peak design flow
rates for each pump station, and identify pump stations that fail to meet the criteria and
propose improvements.
At the end of 2011, EPA and WASD entered into discussions regarding the closing of the
remaining items in the original Consent Decrees and replacing them with a new Consent
Decree which would emphasize the rehabilitation of the existing system. This Consent
Decree was approved by the Miami-Dade Board of County Commissioners on May 21,
2013 and lodged on June 6, 1013. Rehabilitation projects with a total project cost of
$1,550,634,370 are part of the obligations under the new Consent Decree. A table from
the Consent Decree which enumerates the required projects is included as Appendix D.
These projects are separate from those which are required for compliance with the OOL
as described in Section 8 of this Compliance Plan.
4.0 Nutrient Reduction Plan
As described above, the OOL requires that all regular domestic wastewater discharged
through ocean outfalls must either meet advanced wastewater treatment (AWT) and
management by December 31, 2018, or an equivalent reduction in the cumulative outfall
loadings of total nitrogen and total phosphorus, between December 31, 2008, and
December 31, 2025 which would be achieved if the AWT had been implemented by
December 31, 2018. MDWASD has opted to meet this requirement by the second of the
two possible methods allowed achieving the equivalent reduction of nutrient loading to
the outfall.
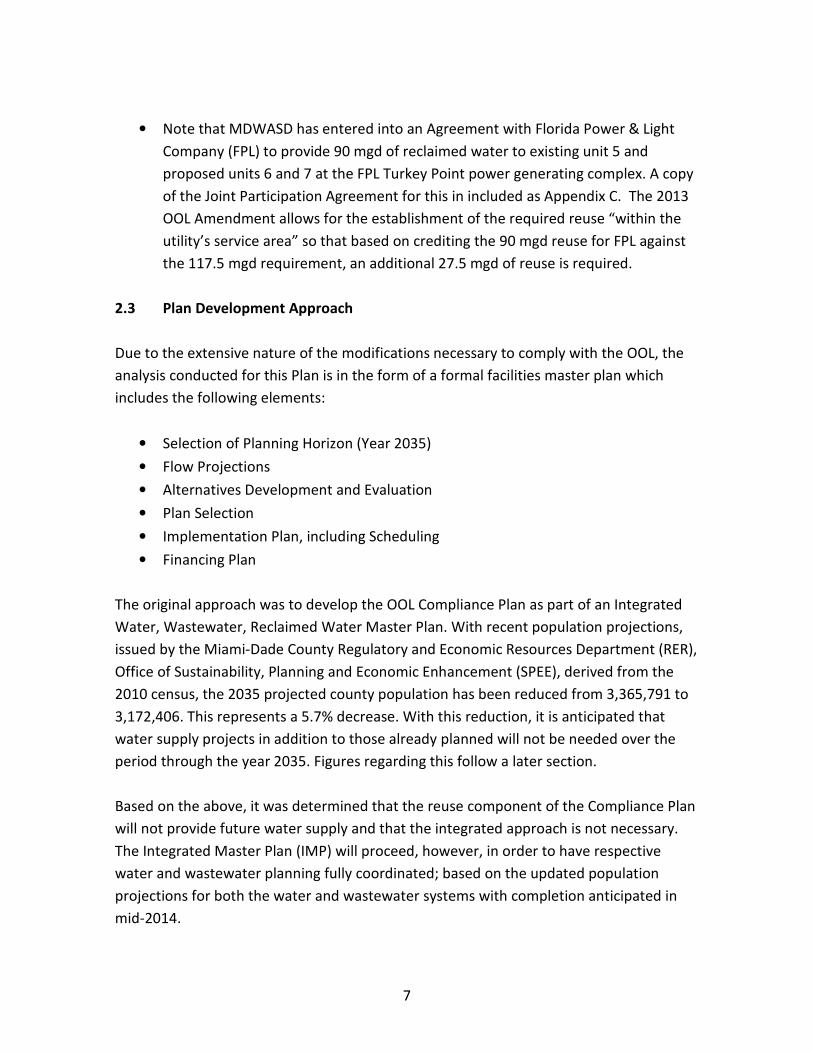
As shown on Figure 2, with the installation of the AWT on December 31, 2018, a total of
59,874,077 lbs of Total Nitrogen would have been diverted from the two MDWASD
outfalls from that date until the required December 31, 2025 closing of the outfalls. The
analogous information for the required phosphorus reduction is included on Figure 3.
Page 15
9
10,335,894
115,949,390
6,954,437
60,015,437
175,823,466
0
50,000,000
100,000,000
150,000,000
200,000,000
250,000,000
0
50,000,000
100,000,000
150,000,000
200,000,000
250,000,000
2009 2010 2011 2012 2013 2014 2015 2016 2017 2018 2019 2020 2021 2022 2023 2024 2025
Cu
mu
lati
ve T
N L
oad
ing
Div
ers
ion
fro
m O
utf
all
, lb
Cu
mu
lati
ve T
N L
oad
ing
an
d R
ed
ucti
on
, lb
59,874,077
Figure 2
Nutrient Removal Plan – Total Nitrogen OCEAN OUTFALL LEGISLATION
COMPLIANCE PLAN
Page 17
11
1,011,381
14,297,294
548,778
3,877,289
17,204,568
0
5,000,000
10,000,000
15,000,000
20,000,000
25,000,000
0
5,000,000
10,000,000
15,000,000
20,000,000
25,000,000
2009 2010 2011 2012 2013 2014 2015 2016 2017 2018 2019 2020 2021 2022 2023 2024 2025
Cu
mu
lati
ve T
P
Lo
ad
ing
Div
ers
ion
fro
m O
utf
all
, lb
Cu
mu
lati
ve T
P
Lo
ad
ing
an
d R
ed
ucti
on
, lb 2,907,273
Figure 3
Nutrient Removal Plan – Total Phosphorus OCEAN OUTFALL LEGISLATION
COMPLIANCE PLAN
Page 19
13
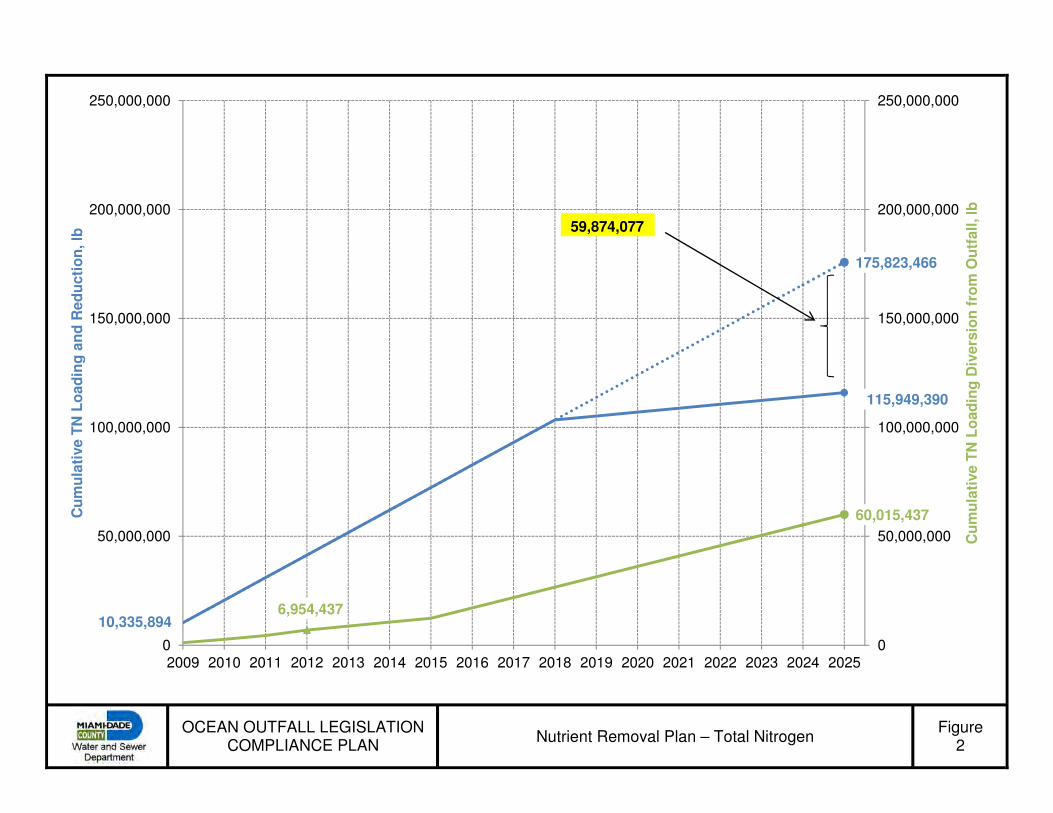
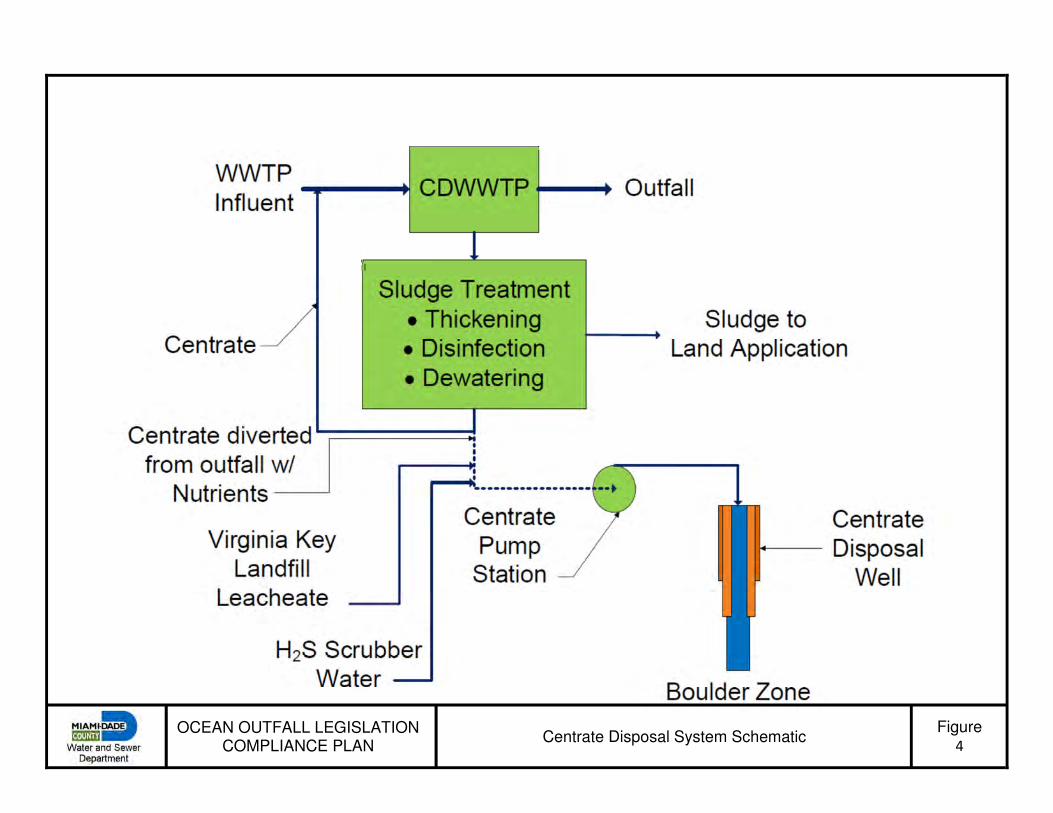
Figure 4
Centrate Disposal System Schematic OCEAN OUTFALL LEGISLATION
COMPLIANCE PLAN
Page 21
15
The total mass diversion from the outfalls for Total Phosphorus is as shown is 1,661,217
lbs. To obtain the equivalent nutrient diversion, MDWASD will:
• Maximize use of the existing Deep Injection Well system at the NDWWTP. As of
December 2012, there have been 6,954,437 lbs of TN and 548,777 lbs of TP
diverted from the outfall.
• Construct a disposal system at the CDWWTP for sludge dewatering centrifuge
centrate. Disposal will be via a deep injection well and pumping station. Centrate
will be combined with leachate from the adjacent landfill owned by the City of
Miami and hydrogen sulfide scrubber water from the CDWWTP. Injection of the
leachate requires construction of a Class I Industrial type well which does not
require the installation of High Level Disinfection treatment upstream. The
centrate disposal well and pump station system is scheduled to be in service by
January 1, 2016. A schematic of system is shown on Figure 4. The pumping station
and disposal well projects are incorporated in the overall project schedule on
Figure 26-3 included Section 8.0 below.
5.0 Flow Projections
5.1 Population Projections
The wastewater flow projections as described below are based on the Miami-Dade
County Regulatory and Economic Resources Department (RER) Planning Division
population projections of 3,365,791 for the year 2035. In February 2013, an updated
figure of 3,307,600 for the year 2040 based on the 2010 census was issued by RER
Planning Division. Using a straight-line proportion, this corresponds to a 3,172,406
population for the year 2035, a 5.7% decrease. Figures for employment which, as
described in the next section were used in forecasting wastewater flows, have not been
issued to date. Accordingly the previous value is used in the wastewater flow projections.
It is intended to revise the wastewater flow projections for use in the IMP, when the
updated employment figures are issued.
5.2 Wastewater
Annual average daily wastewater flows (AADF) were projected for all existing MDWASD
pump stations based on the following:
Page 22
16
• Miami-Dade County RER Planning Division population and employment
projections for year 2035. Projections are distributed spatially around the county
by Traffic Analysis Zones (TAZs).
• MDWASD pump station service areas (basins).
• Dry weather flows at existing stations with the use computations using
Supervisory Control and Data Acquisition (SCADA) historical influent flow.
• Estimates of population served in each pump station basin using septic tank
installation data distributed spatially in Geographic Information System (GIS).
• Estimates of Infiltration/Inflow (I/I) for each pump station basin using 24-hour
hydrographs developed from SCADA.
• Estimates of residential and non-residential flow using sewer billing information.
• Relationship between dry weather flows and AADF.
The MDWASD Geographic Information System (GIS) was instrumental in a number of
these steps in the development of the flow projections.
The following factors were incorporated into the projections:
• The effect of MDWASD water conservation programs (reduced discharges to
wastewater systems).
• Anticipated improvements in sewer design for future systems resulting in lower I/I
for new flows.
Flows from presently undeveloped areas were estimated using existing per capita
wastewater generation figures and population projections.
Based on the AADF flow projections and the observed system performance during a two-
year recurrence rain event from September 28th through September 30th, 2010; for each
existing and future pump station, a projected 72-hour hydrograph was developed for
each basin for the year 2035. This was accomplished with the following steps:
• Existing station with wet weather hydrograph:
o Subtracting the dry weather flow hydrograph from the total flow hydrograph
to obtain a 72-hour hydrograph of the station rainfall dependent
infiltration/inflow (RDII).
o In order to approximate the worst case with respect to the 2-year storm timing
within the diurnal pattern, shifting the RDII hydrograph to the time when the
peak flow occurred at the wastewater treatment plants (WWTPs).
o Adding the RDII hydrograph to the projected dry weather hydrograph.
• Existing stations without a wet weather hydrograph and future stations:
Page 23
17
o Grouping existing stations into categories based on flow ranges and averaging
flows for each hour over the 72-hour period.
o Unitizing the average wet weather hydrograph for each flow range (dividing
by the average flow) and then multiply the projected average dry weather
flow for each station to obtain the projected wet weather hydrograph.
With these procedures, a 72-hour wet weather hydrograph was generated for each
existing and future station for the year 2035 for input into the hydraulic model. Flows
from the MDWASD volume customers were developed using the same methodology
described for the MDWASD pump stations using billing history as the starting point. All of
the hydrographs were added together on an hour-by-hour basis in order to evaluate the
effect on plant flows. The summed hydrograph resulted in a peak hour/AADF ratio of
3.38. A factor of 3.0 was used for the projections to allow for dampening of peak flows
occurring on peak events to reflect storage in individual collection systems and major
gravity interceptors. This factor will be further evaluated with additional hydraulic
modeling which will be undertaken as part of the IMP.
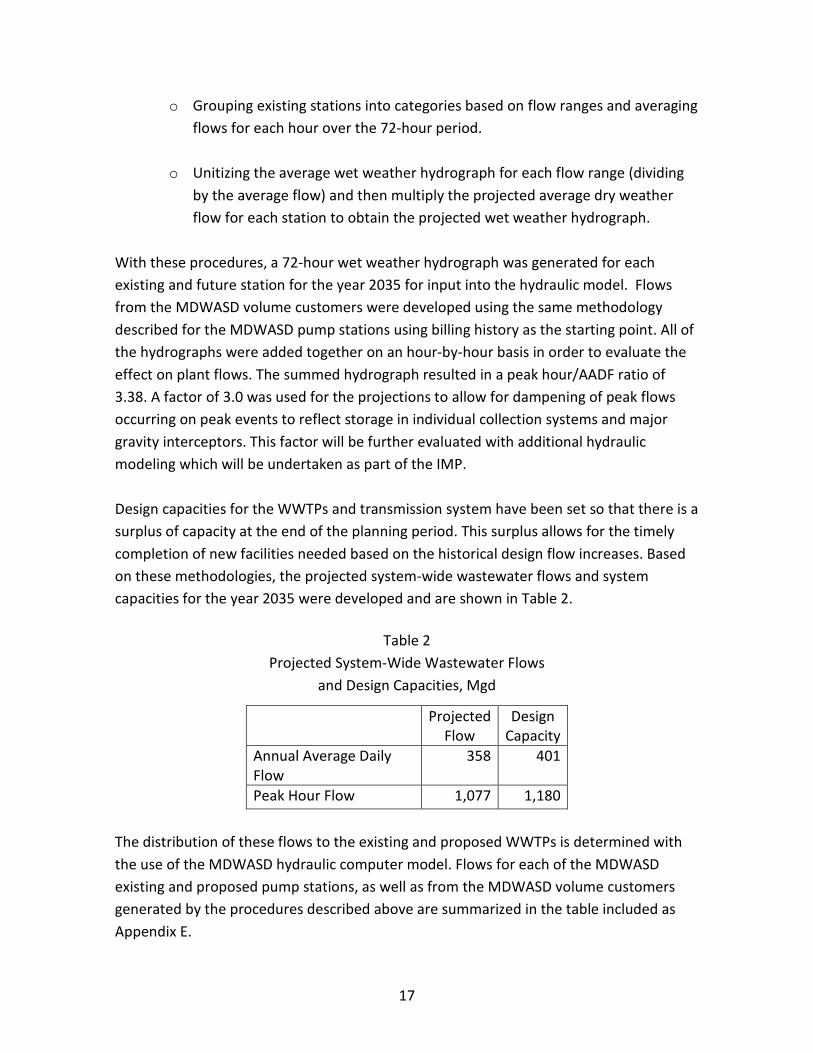
Design capacities for the WWTPs and transmission system have been set so that there is a
surplus of capacity at the end of the planning period. This surplus allows for the timely
completion of new facilities needed based on the historical design flow increases. Based
on these methodologies, the projected system-wide wastewater flows and system
capacities for the year 2035 were developed and are shown in Table 2.
Table 2
Projected System-Wide Wastewater Flows
and Design Capacities, Mgd
Projected
Flow
Design
Capacity
Annual Average Daily
Flow
358 401
Peak Hour Flow 1,077 1,180
The distribution of these flows to the existing and proposed WWTPs is determined with
the use of the MDWASD hydraulic computer model. Flows for each of the MDWASD
existing and proposed pump stations, as well as from the MDWASD volume customers
generated by the procedures described above are summarized in the table included as
Appendix E.
Page 24
18
5.3 Water
The current Lower East Coast Water Supply Plan flow projection for Miami-Dade County
for the year 2030 is 356 mgd. Projected to the year 2035, the planning horizon of this
Plan, this figure becomes 371 mgd. The present 20-year Water Use Permit from the
SFWMD includes water supply projects as follows:
Hialeah RO WTP 10 mgd
South Miami Heights WTP 20 mgd
As shown on Figure 5, with the completion of these projects and the 371 mgd flow
projection for the year 2035, no additional water supply projects are needed to meet
projected demands prior to year 2035. As a result, no reclaimed water projects necessary
to meet water supply needs.
Page 25
19
Figure 5
MDWASD Alternative Water Supply (AWS) Projects OCEAN OUTFALL LEGISLATION
COMPLIANCE PLAN
Page 27
21
6.0 Sea Level Rise (SLR), Storm Surge
Cost-effective compliance with the OOL requires consideration of the construction of
facilities at the existing MDWASD WWTPs in the east in the vicinities of the Intracoastal
Waterway, Atlantic Ocean, and Biscayne Bay. In developing these alternatives, MDWASD
considered the potential effects of sea level rise and storm surge at these sites to ensure
investments in any new facilities at those locations would be of value in the long term.
In this effort, MDWASD reviewed available information regarding these impacts and
retained a consultant to evaluate their effects at the existing WWTP sites.
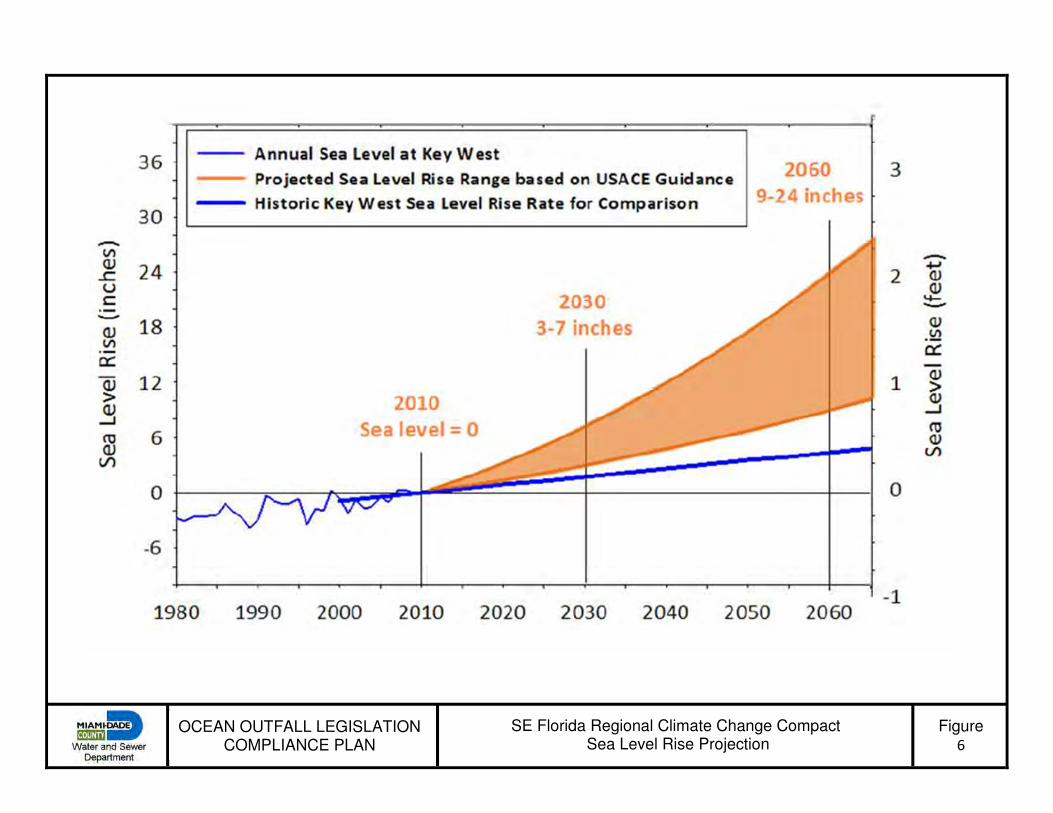
Miami-Dade County and three other counties in the region (Monroe, Broward, and Palm
Beach) have entered into a Compact to address climate change at the regional level. The
Compact has developed a Regional Climate Action Plan, which was completed in October
2012. The Compact recognized how critical it was for the region to be planning with the
same sea level rise projections. As a result, they developed the Unified Sea Level Rise
Projection, which is shown in Figure 6 below. These projections are based on the
historical water levels from Key West and the projections from United States Army Corps
of Engineers (USACE) 2009 Sea-Level Change Considerations for Civil Works Programs
(Circular 1165-2-211); which is modified from a National Research Council (NRC) Report,
referred to as the NRC curves. The Unified Projection anticipates a sea level rise of 9-24
inches by the year 2060. The USACE modified High NRC III projection predicts a sea level
rise of about 3 ft by 2075. On April 2, 2013, the Miami-Dade County Board of County
Commissioners accepted the Southeast Florida Regional Climate Action Plan.
On the basis that facilities would need to be completed by the year 2025 to meet the OOL
requirements and the useful life of wastewater treatment plant facilities is 50 years
(Source: USEPA Publication, “The Clean Water and Drinking Water Infrastructure Gap
Analysis”), 2075 has been set as the year when treatment near the coast must remain
viable in consideration of the threats from SLR and storm surge.
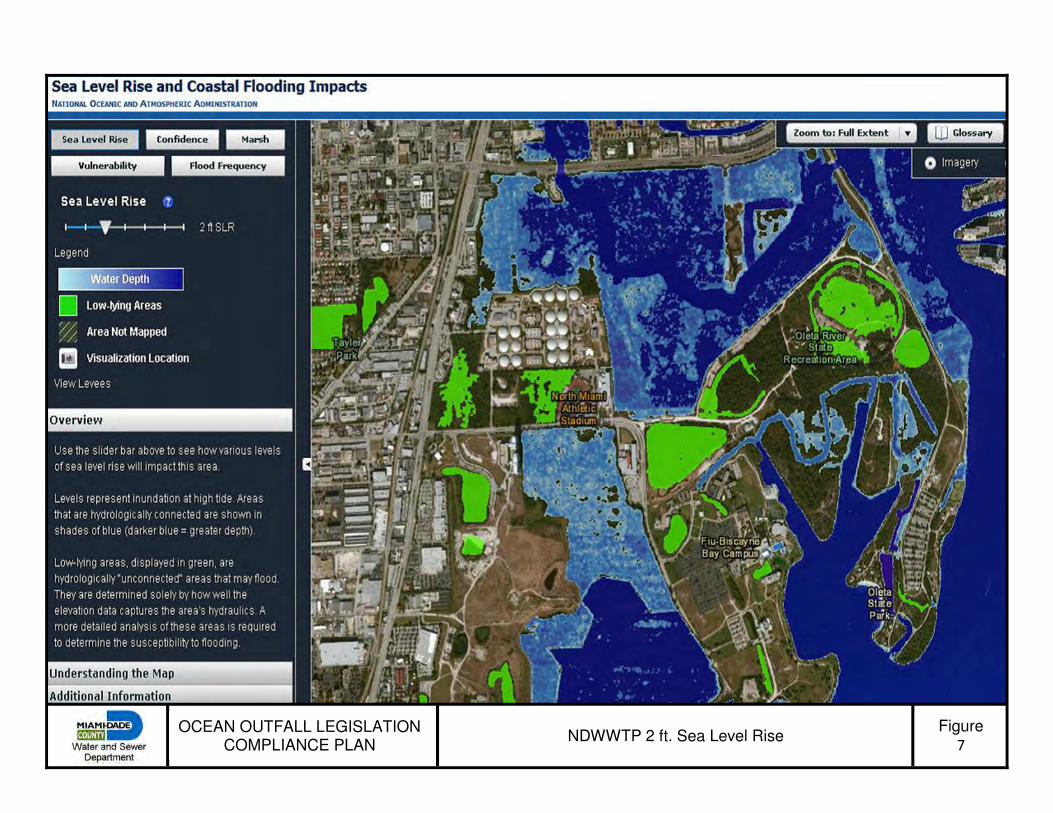
As the first step, to determine levels of inundation near the coast at the three MDWASD
treatment plant site due to sea level rise, the National Oceanic and Atmospheric
Administration (NOAA) Sea Level Rise Viewer was used. Information received is shown for
high range ends of 2 feet (2060) and 3 feet (2078) for the three plants on Figures 7
through 12. These figures show the plants to be at a sufficiently high elevation to avoid
inundation at the 2 and 3 feet SLR levels, assuming that ground water rises directly to sea
Page 28
22
level. Note that 3 FT. SLR has been included in the evaluation of existing outfalls in the
alternatives analyses which follow.
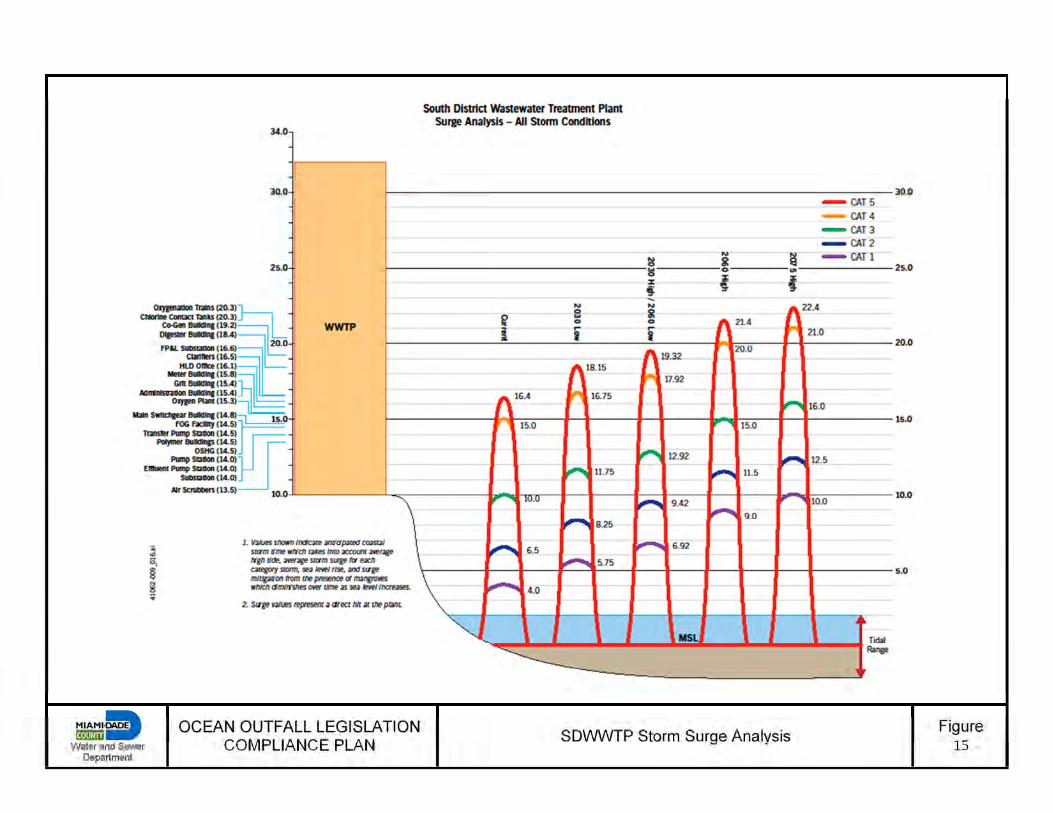
With regard to storm surge, the MDWASD consultant projected the storm surge effects of
Hurricane Andrew which made a direct hit on the SDWWTP in August 1992 onto the three
MDWASD plants at varying SLR’s with estimates of lesser storms also included. The
results of these analyses are shown on Figures 13 through 15. The elevations of the
treatment units shown at the left of the figures are from survey data and construction
drawings. The analysis shows the three existing wastewater treatment plants are already
vulnerable to storm surges and that the 3 ft. SLR does not increase this vulnerability
substantially. As was the case with Hurricane Andrew and the SDWWTP, and with the
experience in the New York area with Hurricane Sandy, storm surge results in damage
mostly to electrical and instrumentation/control systems. Structures and mechanical
equipment do not generally suffer much damage due to storm surges. The consultant has
made estimates of the replacement costs for all electrical and instrumentation equipment
at the 3 MDWASD plants as shown on Table 3.
Table 3
Estimated Replacement Costs-MDWASD WWTPs
Electrical and Instrumentation Systems
Electrical Instrument./Control Total
NDWWTP $51,851,000 $24,961,000 $76,812,000
CDWWTP $109,993,000 $57,596,000 $167,589,000
SDWWTP $29,753,000 $12,942,000 $42,695,000
The potential for these replacement costs in the event of the storm surges from direct
hits from major hurricanes does not warrant plant relocations and the $billions required
to replace capacity and redirect flows with major transmission system upgrades.
MDWASD has committed to a program to “harden” the existing WWTPs. Design for all of
the projects listed in the new Consent Decree will include an examination of existing
facilities for inclusion of features such as increasing the elevation of electrical and
instrumentation/control equipment and/or providing water tight enclosures to decrease
vulnerability to storm surges. In addition, MDWASD will proceed with a program to add
concrete walls at strategic plant locations to reduce effects of storm surge, the addition of
flood logs which are installed on an approaching storm, and watertight doors. The
consultant has estimated a total cost of $30,000,000 to install these items at all three
plants.
Page 29
23
Figure 6
SE Florida Regional Climate Change Compact Sea Level Rise Projection
OCEAN OUTFALL LEGISLATION COMPLIANCE PLAN
Page 31
25
Figure 7
NDWWTP 2 ft. Sea Level Rise OCEAN OUTFALL LEGISLATION
COMPLIANCE PLAN
Page 33
27
Figure 8
NDWWTP 3 ft. Sea Level Rise OCEAN OUTFALL LEGISLATION
COMPLIANCE PLAN
Page 35
29
Figure 9
CDWWTP 2 ft. Sea Level Rise OCEAN OUTFALL LEGISLATION
COMPLIANCE PLAN
Page 37
31
Figure 10
CDWWTP 3 ft. Sea Level Rise OCEAN OUTFALL LEGISLATION
COMPLIANCE PLAN
Page 39
33
Figure 11
SDWWTP 2 ft. Sea Level Rise OCEAN OUTFALL LEGISLATION
COMPLIANCE PLAN
Page 41
35
Figure 12
SDWWTP 3 ft. Sea Level Rise OCEAN OUTFALL LEGISLATION
COMPLIANCE PLAN
Page 43
37
Figure 13
NDWWTP Storm Surge Analysis
Page 45
39
Figure 14
CDWWTP Storm Surge Analysis
Page 47
41
Figure 15
SDWWTP Storm Surge Analysis
Page 49
43
7.0 Alternatives Development and Evaluation
7.1 General
Projects for the various alternatives have been designated with project numbers per the
system defined in Table 4.
Table 4
Project Designation System
First Letter Second Letter Number Suffix Letter
Suffix WW Collection District Project Type Project ID
N North L Transmission Line
1,2,3,…
E=Upgrade
to
existing
C Central P Pumping Station
S South T Treatment Plant Upgrade
W West E Effluent Disposal
R Reuse
Costs estimates for facilities identified are based on total project costs for similar facilities
where available with suitable contingency factors. Costs for recent similar projects have
been escalated using the Engineering News Record Construction Cost Index. Cost
estimates for pipeline construction include restoration and lump sum additions for major
crossings, such as highways, canals and railways. Also included are costs for site
acquisition, where necessary, engineering, legal and administrative costs. Costs for wet
weather treatment expansions at the regional wastewater treatment plants are based on
estimates provided in consultant preliminary engineering reports for the NDWWTP and
from equipment suppliers.
7.2 Reuse
7.2.1 OOL Requirement
As previously indicated in Table 1, the 60% of baseline flow reuse requirement is 117.5
mgd. With flow commitment to FPL of 90 mgd for cooling water makeup to the Turkey
Point facility, an additional 27.5 mgd of reuse is required.
7.2.2 Summary of Options
Reuse option examined in the Reuse Feasibility Study of April, 2007 included:
• Urban Irrigation
• Agricultural Irrigation
Page 50
44
• Industrial Reuse
• Aquifer Recharge via Rapid Infiltration Trenches (RITs)
• Saltwater Barriers
• Canal Recharge
• Wetland Application
• Satellite Treatment
• Potable Reuse
Recharge of the Floridan Aquifer is another reuse possibility which has been evaluated.
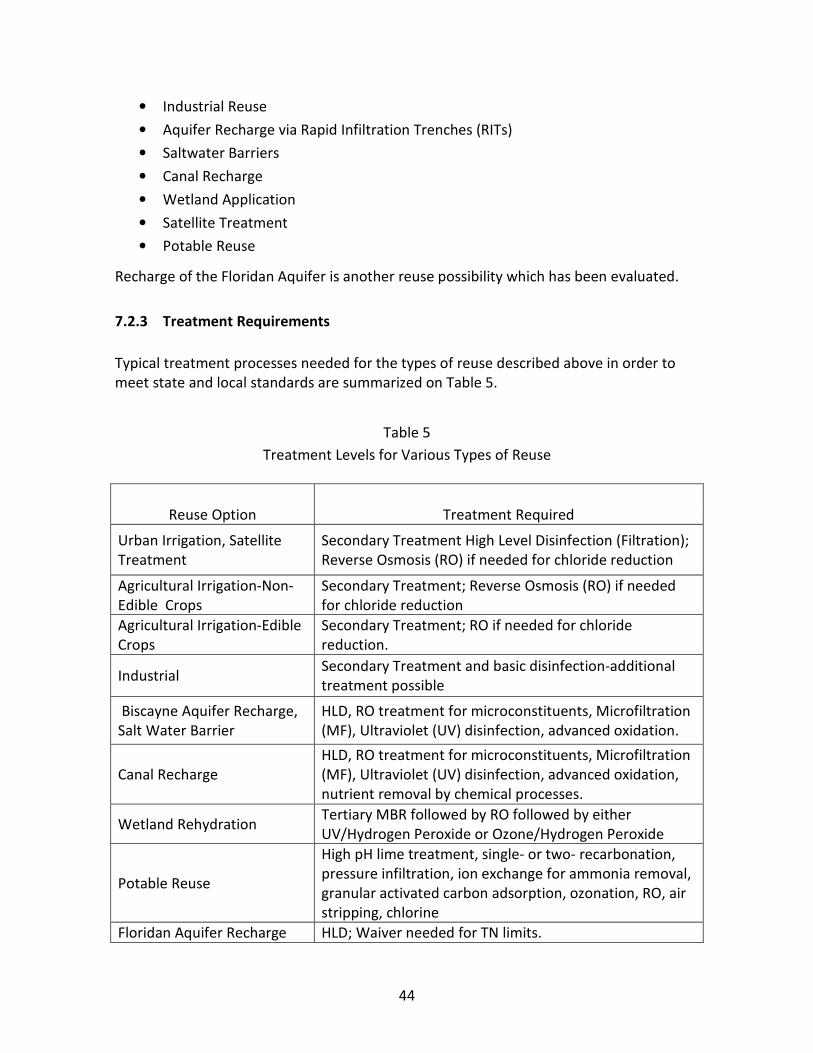
7.2.3 Treatment Requirements
Typical treatment processes needed for the types of reuse described above in order to
meet state and local standards are summarized on Table 5.
Table 5
Treatment Levels for Various Types of Reuse
Reuse Option Treatment Required
Urban Irrigation, Satellite
Treatment
Secondary Treatment High Level Disinfection (Filtration);
Reverse Osmosis (RO) if needed for chloride reduction
Agricultural Irrigation-Non-
Edible Crops
Secondary Treatment; Reverse Osmosis (RO) if needed
for chloride reduction
Agricultural Irrigation-Edible
Crops
Secondary Treatment; RO if needed for chloride
reduction.
Industrial Secondary Treatment and basic disinfection-additional
treatment possible
Biscayne Aquifer Recharge,
Salt Water Barrier
HLD, RO treatment for microconstituents, Microfiltration
(MF), Ultraviolet (UV) disinfection, advanced oxidation.
Canal Recharge
HLD, RO treatment for microconstituents, Microfiltration
(MF), Ultraviolet (UV) disinfection, advanced oxidation,
nutrient removal by chemical processes.
Wetland Rehydration Tertiary MBR followed by RO followed by either
UV/Hydrogen Peroxide or Ozone/Hydrogen Peroxide
Potable Reuse
High pH lime treatment, single- or two- recarbonation,
pressure infiltration, ion exchange for ammonia removal,
granular activated carbon adsorption, ozonation, RO, air
stripping, chlorine
Floridan Aquifer Recharge HLD; Waiver needed for TN limits.
Page 51
45
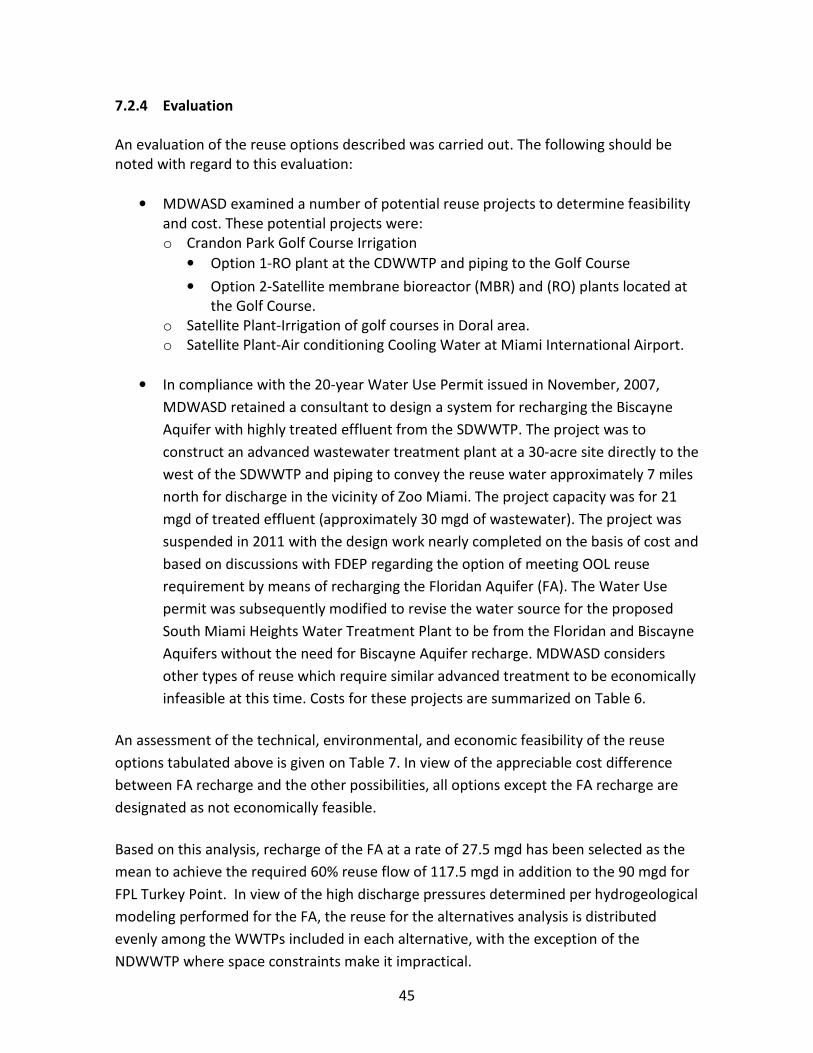
7.2.4 Evaluation
An evaluation of the reuse options described was carried out. The following should be
noted with regard to this evaluation:
• MDWASD examined a number of potential reuse projects to determine feasibility
and cost. These potential projects were:
o Crandon Park Golf Course Irrigation
• Option 1-RO plant at the CDWWTP and piping to the Golf Course
• Option 2-Satellite membrane bioreactor (MBR) and (RO) plants located at
the Golf Course.
o Satellite Plant-Irrigation of golf courses in Doral area.
o Satellite Plant-Air conditioning Cooling Water at Miami International Airport.
• In compliance with the 20-year Water Use Permit issued in November, 2007,
MDWASD retained a consultant to design a system for recharging the Biscayne
Aquifer with highly treated effluent from the SDWWTP. The project was to
construct an advanced wastewater treatment plant at a 30-acre site directly to the
west of the SDWWTP and piping to convey the reuse water approximately 7 miles
north for discharge in the vicinity of Zoo Miami. The project capacity was for 21
mgd of treated effluent (approximately 30 mgd of wastewater). The project was
suspended in 2011 with the design work nearly completed on the basis of cost and
based on discussions with FDEP regarding the option of meeting OOL reuse
requirement by means of recharging the Floridan Aquifer (FA). The Water Use
permit was subsequently modified to revise the water source for the proposed
South Miami Heights Water Treatment Plant to be from the Floridan and Biscayne
Aquifers without the need for Biscayne Aquifer recharge. MDWASD considers
other types of reuse which require similar advanced treatment to be economically
infeasible at this time. Costs for these projects are summarized on Table 6.
An assessment of the technical, environmental, and economic feasibility of the reuse
options tabulated above is given on Table 7. In view of the appreciable cost difference
between FA recharge and the other possibilities, all options except the FA recharge are
designated as not economically feasible.
Based on this analysis, recharge of the FA at a rate of 27.5 mgd has been selected as the
mean to achieve the required 60% reuse flow of 117.5 mgd in addition to the 90 mgd for
FPL Turkey Point. In view of the high discharge pressures determined per hydrogeological
modeling performed for the FA, the reuse for the alternatives analysis is distributed
evenly among the WWTPs included in each alternative, with the exception of the
NDWWTP where space constraints make it impractical.
Page 52
46
Table 6
Potential Reuse Project Summary
Project Description
Capacity,
1,000
gpd
Project Cost ($1,000)
Comment Total Cost/gpd
Crandon Park Golf Course
Irrigation-Option 1
Installation of treatment facilities
(HLD and RO for chloride reduction)
at the CDWWTP and pipeline to the
Golf Course
600 $17,100 $28.50
Issue of water quality with respect to
possible runoff to Biscayne Bay needs
to be addressed.
Crandon Park Golf Course
Irrigation-Option 2
Satellite WWTP to treat Key Biscayne
wastewater at the Golf Course (MBR
and RO for chloride reduction)
600 $11,700 $19.50
Issue of water quality with respect to
possible runoff to Biscayne Bay needs
to be addressed.
Doral Area Golf Course
Irrigation
Satellite MBR WWTP to provide
irrigation to 5 golf courses in close
proximity in the Doral area
3,888 $41,700 $11.33 Requires land procurement and WWTP
siting.
Miami International Airport
(MIA) Air Conditioning
Makeup Water
Satellite MBR WWTP to provide
makeup water to MIA central air
conditioning plant
600 $13,900 $23.17
Requires land procurement and WWTP
siting. Water quality needed for
makeup water could require additional
treatment.
Biscayne Aquifer Recharge
30 mgd Advanced Treatment Plant at
SDWWTP for recharge of the
Biscayne Aquifer to provide water
supply for proposed South Miami
Heights WTP
30,000 $312,000 $10.40
Actual project which was cancelled.
Costs include pipeline for discharge to
BA.
Floridan Aquifer Recharge
Cost for pump station, piping to wells
and Floridan Aquifer Wells for the
27.5 mgd OOL requirement
27,500 $76,674 $2.78
Cost for HLD treatment not included
since it is needed for effluent disposal
to injections wells per OOL. Waiver on
TN limit from FDEP required.
Page 53
47
Table 7
Feasibility for Various Types of Reuse
Reuse Option
Feasibility
Technical Environmental Economic
Urban Irrigation, Satellite Treatment Feasible Feasible Not Feasible
Agricultural Irrigation-Non-Edible
Crops
Not Feasible-Insufficient
demand Feasible Not Feasible
Agricultural Irrigation-Edible Crops Feasible Feasible Not Feasible
Industrial Dependent on application Feasible, depending on
application
Feasible, depending on
application
Biscayne Aquifer Recharge, Salt Water
Barrier Feasible-EPOCS, Flooding Feasible Not Feasible
Canal Recharge Feasible Feasible Not Feasible
Wetland Rehydration Feasible Requires Additional
Testing Not Feasible
Potable Reuse Feasible Feasible, public
perception Not Feasible
Floridan Aquifer Recharge Feasible Feasible Feasible
Page 54
48
7.3 Wastewater
7.3.1 Wastewater Treatment
In the development of treatment processes for alternatives considered, secondary
treatment is provided for all flow with further High Level Disinfection (HLD) treatment
(per the Florida Administrative Code, FAC, Chapter 62, 600.440(5)) for a portion as
described below. For peak wet weather flows, capacities of the biological reactors and
final settling tanks are exceeded at the projected flows for a number of the alternatives.
Where the biological reactor capacity is exceeded for peak wet weather flows, parallel
aeration tanks are provided. These basins would be activated on peak events and seeded
with biomas via return sludge from the normally operating process trains. Where the
secondary settling loading rates are exceeded (reflecting standard and conservative
loading rates as described below), parallel settling in the form of high-rate clarification is
included. Ballasted flocculation is a common system used in this application. This process
also would be activated for peak flow wet weather events.
The OOL Compliance Plan approach for managing the projected 1,180 mgd system-wide
peak flow is as follows:
Reuse 117.5 mgd
Boulder Zone Remainder less peak flow discharge through outfalls
With the exception of 71 mgd at the NDWWTP, HLD treatment will be provided for all
flow to be discharged into the Boulder Zone as described above. The NDWWTP operating
permit allows for discharge of 71 mgd to the Boulder Zone with the existing deep well
disposal system with secondary treatment only. Per OOL amendment, that flow which is
discharged through outfalls on peak flow events will receive secondary treatment only.
7.3.2 Ocean Outfall Discharges/HLD Capacities
As previously indicated, the OOL Amendment allows for the discharge of peak flows
through the existing ND and CD outfalls which do not cumulatively exceed 5 percent of a
facility’s baseline flow. Based on the baseline flows shown in Table 1 of 81.0 and 114.8
mgd for the NDWWTP and CDWWTP, respectively, the total cumulative volumes (five
year rolling average per OOL) which can be discharged through the outfalls are:
NDWWTP 1,478 mg or 4.0 mgd
CDWWTP 2,095 mg or 5.7 mgd
Page 55
49
A statistical analysis was performed on hourly flows at the NDWWTP and CDWWTP for
the 2003-2012 to set the capacities of HLD at these plants. The analysis indicated that at
HLD Design Capacity/AADF ratios of 1.5 for the NDWWTP and 1.7 for the CDWWTP result
in discharges out the outfalls of 2% of the annual hours and 0.4% of the accumulated
baseline flow. A table summarizing this analysis is given in Appendix F. These factors are
used in the development and costing of alternatives described below.
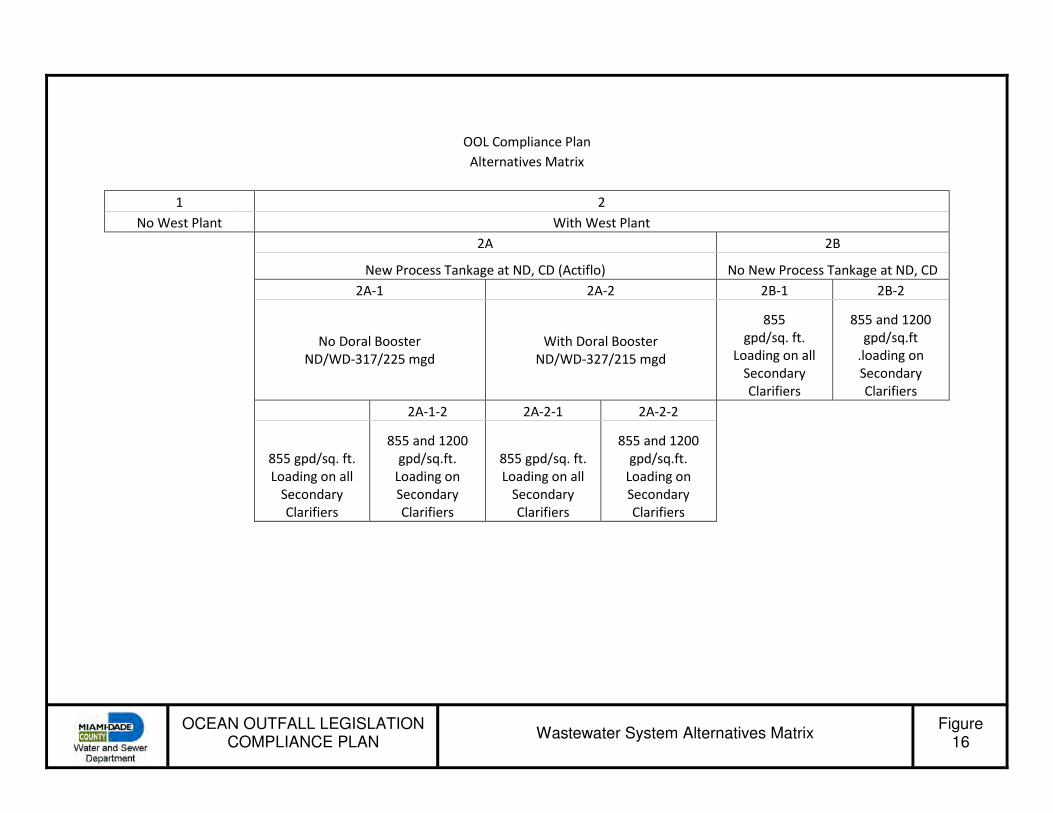
7.3.3 Alternatives Evaluated
Alternatives were developed through evaluation per the matrix shown on Figure 16.
Descriptions of the opposing alternatives and subalternatives are as follows:
• With (Alternative 2-) and without (1-) a proposed West District Wastewater
Treatment Plant.
• With (Subalt. A-) and without (B-) the transfer of additional peak wet weather
flow to the NDWWTP and CDWWTP. For the A- subalternative, additional
secondary treatment in the form of high rate clarification to be installed in
parallel with existing final settling tanks is included. Ballasted flocculation has
been selected as the basis for the evaluation due to its small footprint and
suitability for operation on a standby basis during peak wet weather events. For
the B- subalternative, no additional secondary treatment has been considered.
• With (Subalt -2-) and without (-1-) a booster station and force main connections
in the Doral area. (-1-, -2- under the A subalternative). This system allows for an
increased flow transfer to the NDWWTP and reduced peak flow pressures in the
Doral area. It also provides additional system flexibility with regard to flow
transfers between WWTPs.
• At the NDWWTP and CDWWTP, conservative loading on all secondary clarification
process units (Subalt. -1) or conservative loading only on those process units
followed by HLD treatment (Subalt. -2). The conservative loading (855 gpd/ft2) is
used to reduce the possibility of high discharge of solids to filters during a plant
upset. Use of this conservative loading for the entire plant increases the need of
additional peak flow capacity such as parallel ballasted flocculation for the A
subalternatives and reduces overall plant peak flow processing capacity for the B
subalternatives. For the -2 subalternatives, secondary clarifiers which are not
followed by HLD treatment are loaded with the standard 1,200 gpd/ ft2 , so that
Page 56
50
these subalternatives have dual (855 and 1,200 gpd/ ft2 ) settling tank loading
rates.
An alternative to decommission the CDWWTP was evaluated and not included in the
formal alternatives analysis due to excessive cost. This is described below.
7.3.4 Transmission System Analysis
The transmission system requirements for the five alternatives resulting from the
concepts described above were developed using the MDWASD InfoWorks, CS hydraulic
model. The model was set up for direct input of flows via 72-hour hydrographs as
described previously. For the cases where the system includes repumping, upstream
station flows were added to flows generated in a receiving station for input into the
transmission system. Flows for receiving pump stations are included in Appendix E as well
as a tabulation of upstream stations contributing to their flow. Booster stations were
modeled as screw pumps which simulate the operation of a properly-sized station, i.e. the
station pumps all influent flow while maintaining its suction pressure at the minimal set
point value irrespective of the pump station discharge pressure generated. These
pressures were adjusted to be within the standard maximum WASD operating pressures
mainly through the addition and size adjustment of additional downstream force mains.
In order to determine the adequacy of both the local and booster stations, flows and
pressures were taken from the model runs and applied to a separate spreadsheet where
the model operating conditions were compared to the station characteristic operating
curves. Stations where the model output exceeded the capacity of the station were
included in the Plan as an upgrade project.
7.3.5 Analysis Results
Based on the alternatives considered as described above, five transmission system
alternatives were developed, two of which are the same for the -1 and -2 subalternatives
with the conservative and dual secondary clarifier loading rates, so that a total of 7
overall alternatives have been analyzed.
The transmission system configurations were developed to process the 2035 projected
flows included in Table 3 based on projected wastewater flows distributed in MDWASD
service area and target average/peak flows at the WWTPs reflecting the following:
• Existing Plant configurations.
Page 57
51
OOL Compliance Plan
Alternatives Matrix
1 2
No West Plant With West Plant
2A 2B
New Process Tankage at ND, CD (Actiflo) No New Process Tankage at ND, CD
2A-1 2A-2 2B-1 2B-2
No Doral Booster
ND/WD-317/225 mgd With Doral Booster
ND/WD-327/215 mgd
855
gpd/sq. ft.
Loading on all
Secondary
Clarifiers
855 and 1200
gpd/sq.ft
.loading on
Secondary
Clarifiers
2A-1-2 2A-2-1 2A-2-2
855 gpd/sq. ft.
Loading on all
Secondary
Clarifiers
855 and 1200
gpd/sq.ft.
Loading on
Secondary
Clarifiers
855 gpd/sq. ft.
Loading on all
Secondary
Clarifiers
855 and 1200
gpd/sq.ft.
Loading on
Secondary
Clarifiers
Figure 16
Wastewater System Alternatives Matrix OCEAN OUTFALL LEGISLATION
COMPLIANCE PLAN
Page 58
52
• Long-range capacity reductions at the NDWWTP and CDWWTP due to proximity to
coasts.
• Use of existing outfalls for peak wet weather flows
• Treatment plant operation
• Minimizing of local pressures for optimal operation of local pump stations
• Provision of system flexibility and redundancy.
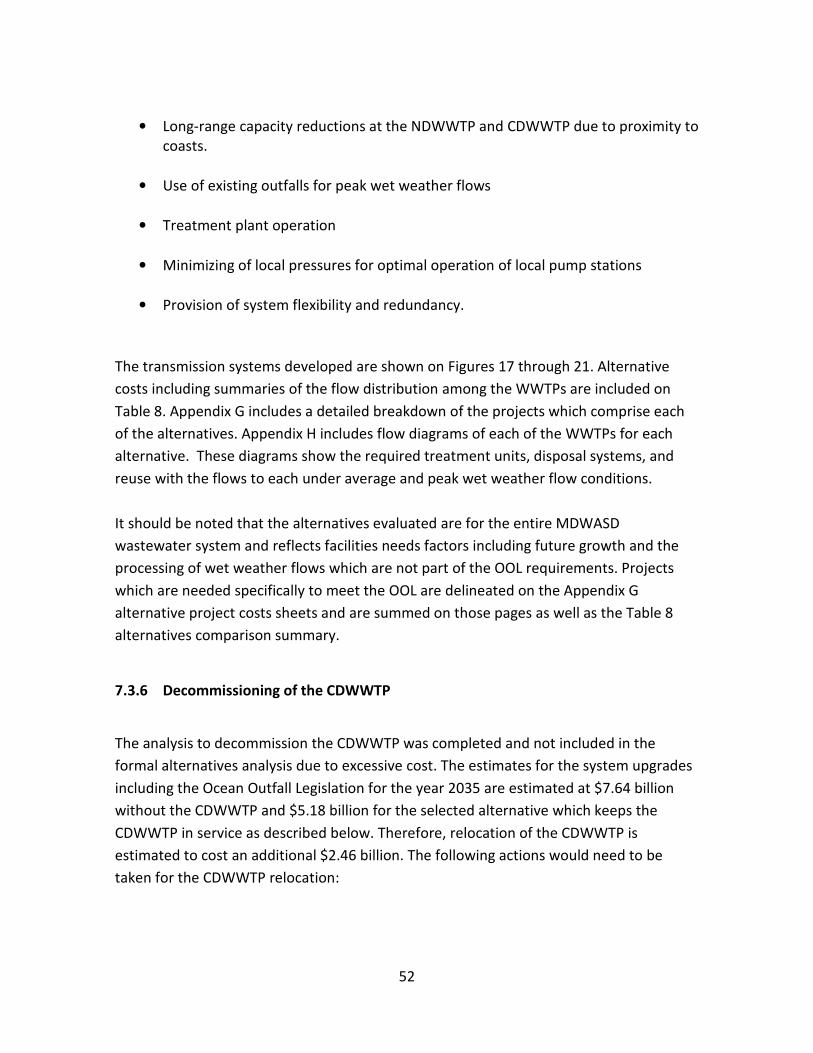
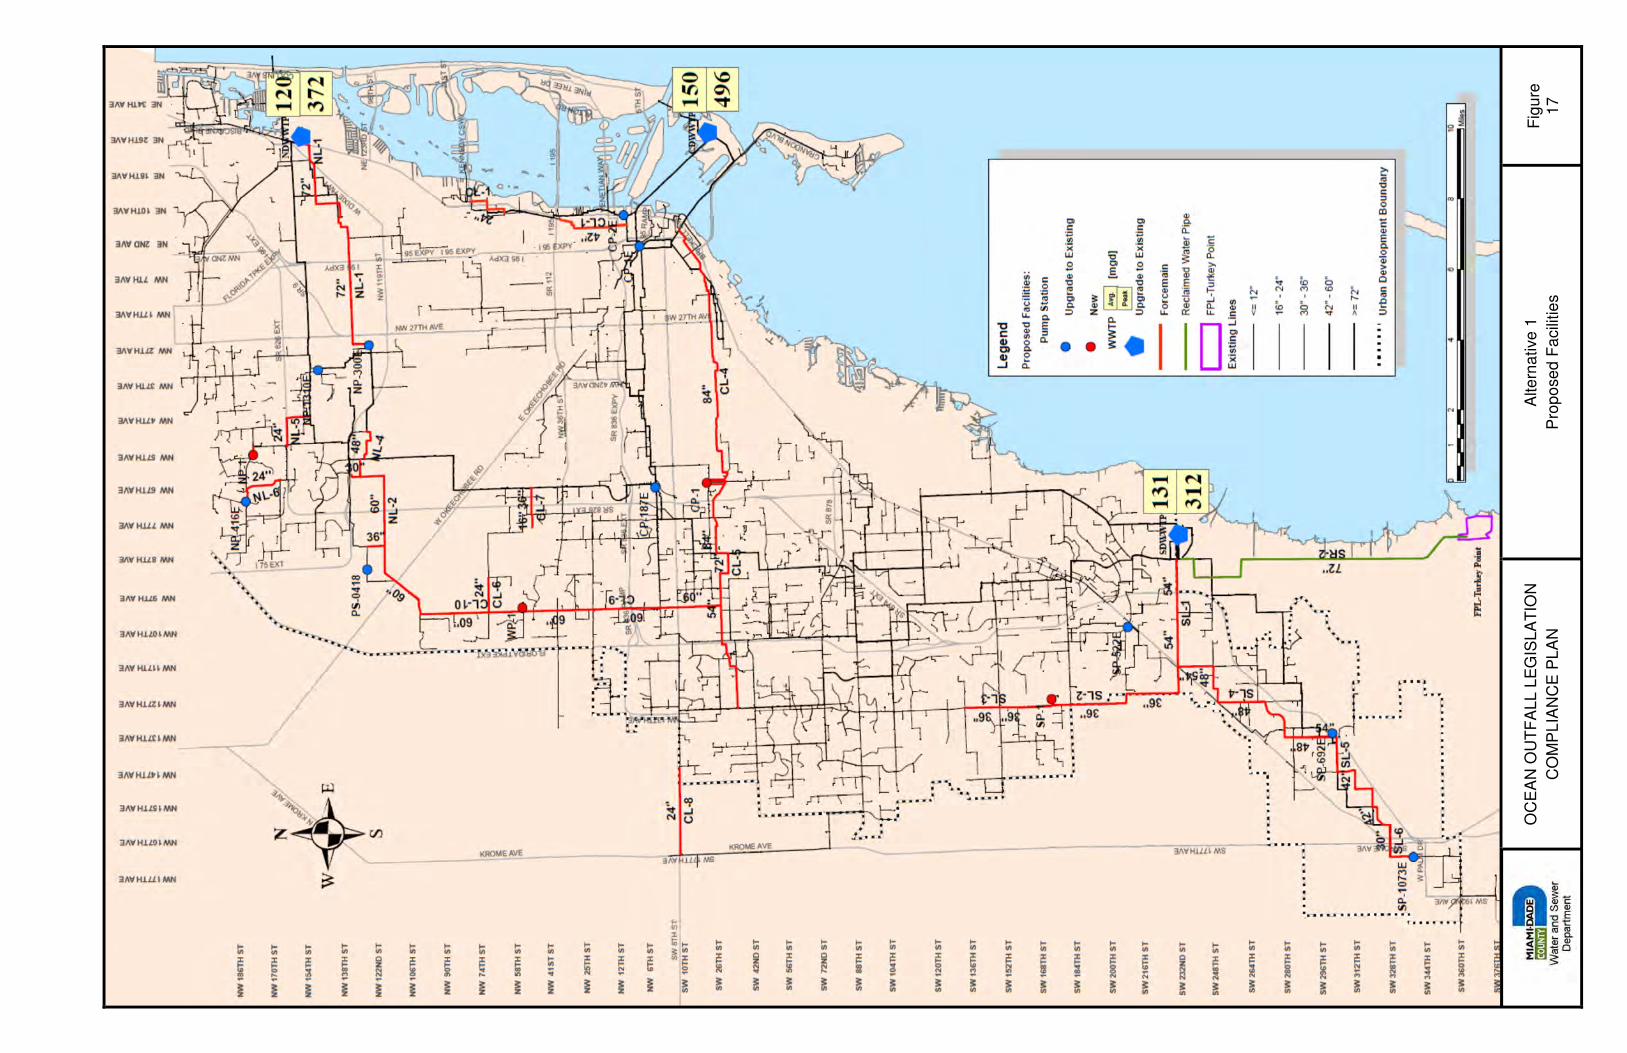
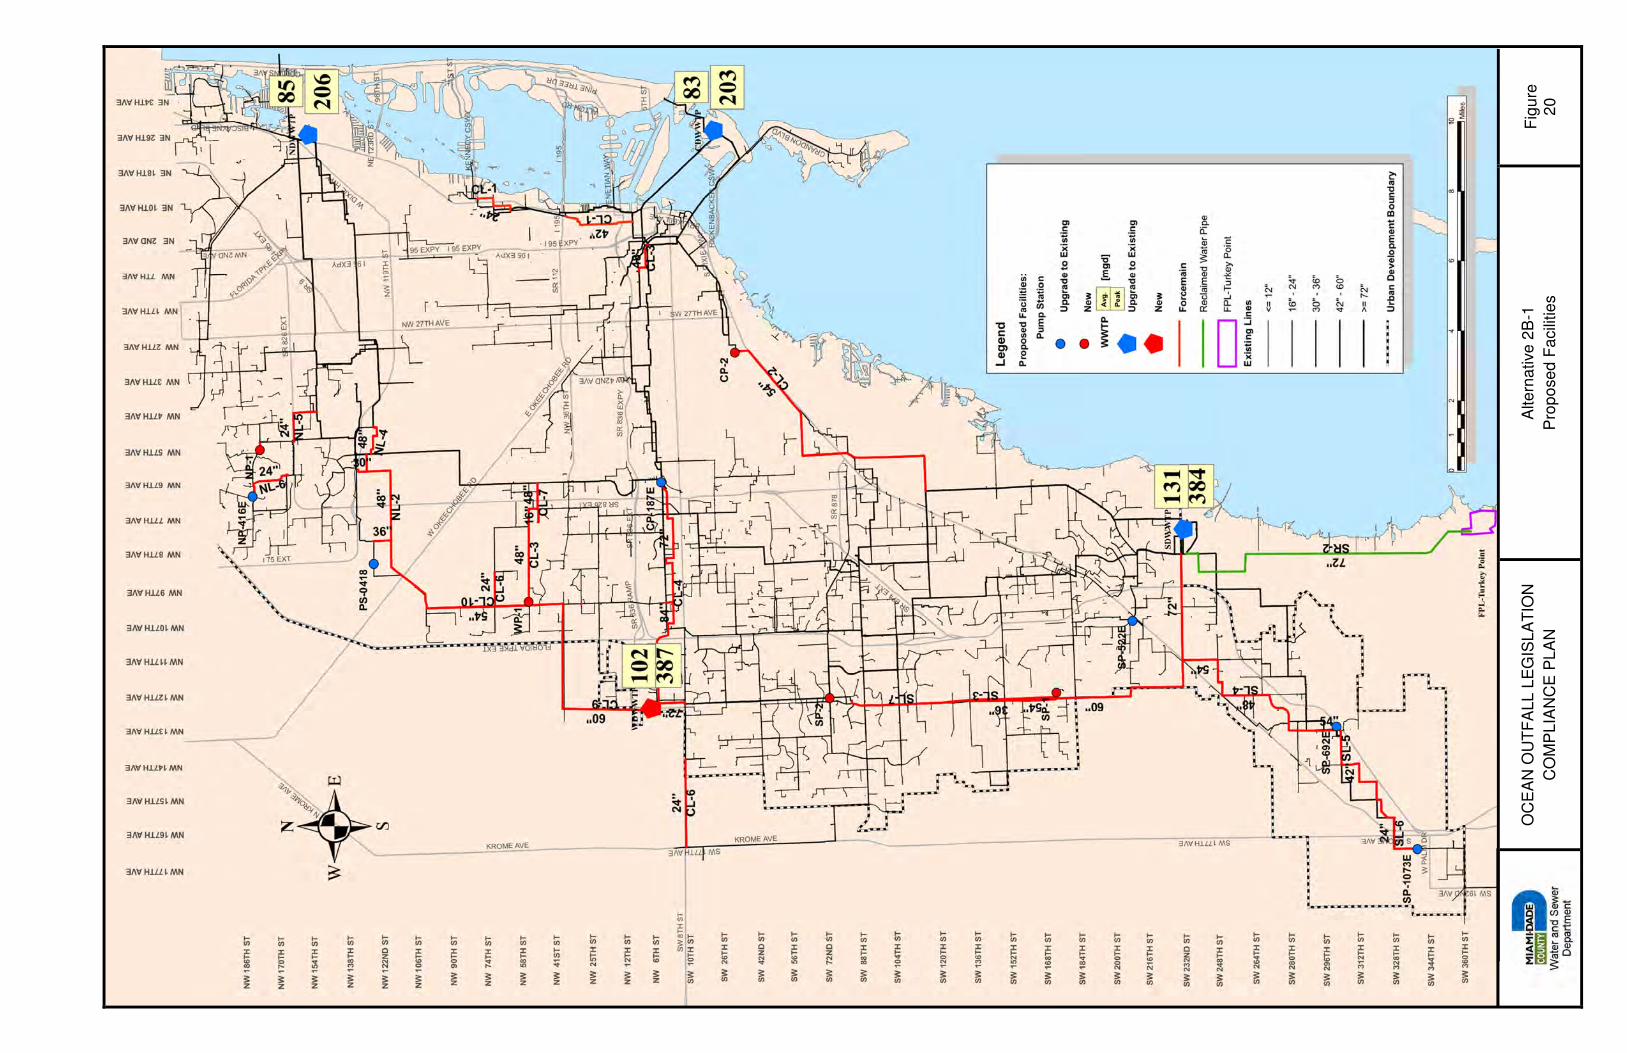
The transmission systems developed are shown on Figures 17 through 21. Alternative
costs including summaries of the flow distribution among the WWTPs are included on
Table 8. Appendix G includes a detailed breakdown of the projects which comprise each
of the alternatives. Appendix H includes flow diagrams of each of the WWTPs for each
alternative. These diagrams show the required treatment units, disposal systems, and
reuse with the flows to each under average and peak wet weather flow conditions.
It should be noted that the alternatives evaluated are for the entire MDWASD
wastewater system and reflects facilities needs factors including future growth and the
processing of wet weather flows which are not part of the OOL requirements. Projects
which are needed specifically to meet the OOL are delineated on the Appendix G
alternative project costs sheets and are summed on those pages as well as the Table 8
alternatives comparison summary.
7.3.6 Decommissioning of the CDWWTP
The analysis to decommission the CDWWTP was completed and not included in the
formal alternatives analysis due to excessive cost. The estimates for the system upgrades
including the Ocean Outfall Legislation for the year 2035 are estimated at $7.64 billion
without the CDWWTP and $5.18 billion for the selected alternative which keeps the
CDWWTP in service as described below. Therefore, relocation of the CDWWTP is
estimated to cost an additional $2.46 billion. The following actions would need to be
taken for the CDWWTP relocation:
Page 59
53
Table 8
Preliminary Opinion of Costs – Ocean Outfall Legislation – Compliance Plan
ALTERNATIVE 1 2A-1-1 2A-1-2 2A-2-1 2A-2-2 2B-1 2B-2
DESCRIPTION All Wastewater Treatment at
Existing WWTPs New WDWWTP New WDWWTP New WDWWTP New WDWWTP New WDWWTP New WDWWTP
New Peak Flow Treatment ND & CD ND & CD ND & CD ND & CD
NDWWTP Peak Flow Higher Lower (No Doral Booster) Lower (No Doral Booster) Higher (Doral Booster) Higher (Doral Booster) Lower Lower
Reuse FPL Cooling Water from SD FPL Cooling Water from SD FPL Cooling Water from SD FPL Cooling Water from SD FPL Cooling Water from SD FPL Cooling Water from SD FPL Cooling Water from SD
FA Recharge at SD & WD FA Recharge at SD, CD & WD FA Recharge at SD, CD & WD FA Recharge at SD, CD & WD FA Recharge at SD, CD & WD FA Recharge at SD, CD & WD FA Recharge at SD, CD & WD
Sec. Clarifier Loading Lower Lower Dual Dual Dual Lower Dual
FACILITY DESIGN FLOW (MGD) Design Capacity
AADF Wet Weather
Peak Design Capacity
AADF Wet Weather
Peak Design Capacity
AADF Wet Weather
Peak Design Capacity
AADF Wet Weather
Peak Design Capacity
AADF Wet Weather
Peak Design Capacity
AADF Wet Weather
Peak Design Capacity
AADF Wet Weather
Peak
ND WWTP 120 372 85 317 85 317 85 327 85 327 85 206 85 262
CD WWTP 150 496 83 333 83 333 83 333 83 333 83 203 83 234
SD WWTP 131 312 131 305 131 305 131 305 131 305 131 384 131 300
WD WWTP -- -- 102 225 102 225 102 215 102 215 102 387 102 384
TOTALS 401 1180 401 1180 401 1180 401 1180 401 1180 401 1180 401 1180
WWTP PROJECTS COSTS
Wastewater Transmission Mains $ 1,050,810,000 $ 778,190,000 $ 778,190,000 $ 908,450,000 $ 908,450,000 $ 1,103,210,000 $ 882,540,000
Regional Pumping Stations $ 513,000,000 $ 280,000,000 $ 280,000,000 $ 330,000,000 $ 330,000,000 $ 430,000,000 $ 330,000,000
Local PS & FM $ 435,940,000 $ 405,500,000 $ 405,500,000 $ 402,730,000 $ 402,730,000 $ 423,490,000 $ 422,100,000
Existing WWTP Upgrades $ 225,498,271 $ 225,498,271 $ 225,498,271 $ 225,498,271 $ 225,498,271 $ 225,498,271 $ 225,498,271
HLD Treatment $ 446,921,798 $ 264,988,378 $ 264,988,378 $ 264,988,378 $ 264,988,378 $ 374,662,299 $ 258,213,082
Peak Flow Treatment $ 474,480,116 $ 162,322,061 $ 103,724,471 $ 169,057,417 $ 110,459,826 $ 70,152,794 $ --
Deep Injection Well Systems $ 678,401,362 $ 398,301,858 $ 398,301,858 $ 398,301,858 $ 398,301,858 $ 536,569,449 $ 395,427,405
Biosolids Class AA Improvements $ 437,416,999 $ 328,506,077 $ 328,506,077 $ 328,506,077 $ 328,506,077 $ 328,506,077 $ 328,506,077
Storm Surge Protection $ 30,000,000 $ 30,000,000 $ 30,000,000 $ 30,000,000 $ 30,000,000 $ 30,000,000 $ 30,000,000
New WD WWTP $ -- $ 1,306,538,763 $ 1,306,538,763 $ 1,303,913,184 $ 1,303,913,184 $ 1,420,214,970 $ 1,418,875,809
Peak Flow Treatment $ -- $ 207,572,177 $ 207,572,177 $ 182,649,075 $ 182,649,075 $ 540,184,615 $ 533,259,171
Deep Injection Well System $ -- $ 384,044,843 $ 384,044,843 $ 378,295,936 $ 378,295,936 $ 662,879,587 $ 661,154,915
Biosolids Class AA Improvements $ -- $ 150,731,533 $ 150,731,533 $ 150,731,533 $ 150,731,533 $ 150,731,533 $ 150,731,533
FACILITIES SUBTOTAL 1 $ 4,292,468,545 $ 4,922,193,963 $ 4,863,596,372 $ 5,073,121,729 $ 5,014,524,139 $ 6,296,099,596 $ 5,636,306,264
REUSE SYSTEM COSTS
FPL Reclaimed Water Pipeline $ 95,000,000 $ 95,000,000 $ 95,000,000 $ 95,000,000 $ 95,000,000 $ 95,000,000 $ 95,000,000
FA Pump Station, Wells and Piping $ 76,674,149 $ 76,674,149 $ 76,674,149 $ 76,674,149 $ 76,674,149 $ 76,674,149 $ 76,674,149
FACILITIES SUBTOTAL 2 $ 171,674,149 $ 171,674,149 $ 171,674,149 $ 171,674,149 $ 171,674,149 $ 171,674,149 $ 171,674,149
OOL COMPLIANCE COSTS $ 2,301,987,320 $ 3,222,626,227 $ 3,164,028,636 $ 3,265,633,993 $ 3,322,986,402 $ 4,162,311,350 $ 3,923,110,029
ANNUAL O&M COSTS (1) $ 376,991,611 $ 404,277,177 $ 402,952,582 $ 403,995,827 $ 402,671,232 $ 410,588,772 $ 408,779,731
TOTAL CAPITAL COSTS (2) $ 4,464,142,695 $ 5,093,868,112 $ 5,035,270,522 $ 5,244,795,878 $ 5,186,198,288 $ 6,467,773,745 $ 5,807,980,413
1. Annual Operation and Maintenance Costs include 2% inflation increase per year for total capital projects by year 2035. 2. Total Capital Costs include the cost of capacity to year 2035 demand in addition to the Ocean Outfall Legislation (OOL) Compliance Costs. All project costs include land acquisition where necessary, engineering, legal and administrative costs.
ND - North District Wastewater Treatment Plant FPL - Florida Power & Light Turkey Point Facility Low - 855 gpd/sf loading rate on secondary clarification followed by HLD
CD - Central District Wastewater Treatment Plant HLD - High Level Disinfection Dual - 855 gpd/sf loading rate on secondary clarification followed by HLD and 1200 gpd/sf for peak flow to Ocean Outfall
SD - South District Wastewater Treatment Plant OOL - Ocean Outfall Legislation
WD - West District Wastewater Treatment Plant
Page 61
55
• Construct the New West District Wastewater Treatment Plant, but at a higher
capacity than planned (185 MGD average & 425 MGD peak), including all the
additional treatment and disposal capacity
• Decommission the Central District WWTP and construct a Booster Station at the
site, to move the flows from Miami Beach (includes Bal Harbor, Bay Harbor
Islands, Indian Creek, & Surfside), Village of Key Biscayne, and Virginia Key to the
mainland.
• Construct a pipeline from the existing 102” pipeline (in Brickell area) to the West
District WWTP (about 15 miles of 72” to 84” pipelines)
• Construct intermediate Booster Station at Barnes Park
• New 54” pipeline to reroute Coral Gables flows
• Construct new pipeline to transfer the North District WWTP Sludge from Pump
Station No. 2 (located at 390 N. RIVER DR NW, by American Airlines Arena) to
West District WWTP
A system map and detailed cost estimated for facilities for this option are included in
Appendix I.
7.3.7 Alternative Selection
Project, operation, and maintenance costs for facilities for each of the alternatives,
tabulated in Table 8 in the previous section, are listed in ascending order of cost in Table
9 by total project cost.
Alternative 1, which does not include a fourth WWTP in the west, though somewhat less
costly overall; is not recommended, primarily to avoid expansion of the existing North
District and Central District facilities to obtain treatment capacity for future growth.
Alternative 1 also requires substantially more large diameter force mains through highly
populated areas of the county.
Page 62
56
Table 9
Alternatives Ranked by Project Cost in Ascending Order
Difference from Lowest
Alt. Total Project Cost Amount Percent
1 $ 4,464,142,695 $ - 0.0%
2A-1-2 $ 5,035,270,522 $ 571,127,827 12.8%
2A-1-1 $ 5,093,868,112 $ 629,725,418 14.1%
2A-2-2 $ 5,186,198,288 $ 722,055,593 16.2%
2A-2-1 $ 5,244,795,878 $ 780,653,184 17.5%
2B-2 $ 5,807,980,413 $ 1,343,837,718 30.1%
2B-1 $ 6,467,773,745 $ 2,003,631,050 44.9%
The advantages of the establishment of the West District Wastewater Treatment Plant
include:
• Allows for use of state-of-the-art treatment technology for capacity needed for
future growth and to replace capacity transferred from NDWWTP and CDWWTP.
Cost estimates are based on the membrane bioreactor (MBR) process.
• Site location is suitable for possible groundwater recharge for the Alexander Orr
Water Treatment plant wellfields in the future.
• Site location at the farthest location from the existing WWTPs allows for pressure
relief in the transmission system to improve system operation during wet weather
events.
• Establishment of a fourth treatment plant away from the coast reduced the
overall system vulnerability to storm surge and SLR.
The B alternatives are based on no construction of additional secondary treatment
capacity at the NDWWTP and CDWWTP, for treating peak wet weather flows for
discharge via the existing outfalls, requires the shifting of higher peak wet weather flows
to the proposed West District WWTP. This results in substantially higher costs to provide
Page 63
Fig
ure
1
7
Alte
rna
tive
1
Pro
po
sed
Fa
cili
tie
s
OC
EA
N O
UT
FA
LL L
EG
ISL
AT
ION
CO
MP
LIA
NC
E P
LA
N
Page 65
Fig
ure
1
8
Alte
rna
tive
2A
-1-1
, -2
Pro
po
sed
Fa
cili
tie
s
OC
EA
N O
UT
FA
LL L
EG
ISL
AT
ION
CO
MP
LIA
NC
E P
LA
N
Page 67
Fig
ure
1
9
Alte
rna
tive
2A
-2-1
, -2
Pro
po
sed
Fa
cili
tie
s
OC
EA
N O
UT
FA
LL L
EG
ISL
AT
ION
CO
MP
LIA
NC
E P
LA
N
Page 69
Fig
ure
2
0
Alte
rna
tive
2B
-1
Pro
po
sed
Fa
cili
tie
s
OC
EA
N O
UT
FA
LL L
EG
ISL
AT
ION
CO
MP
LIA
NC
E P
LA
N
Page 71
Fig
ure
2
1
Alte
rna
tive
2B
-2
Pro
po
sed
Fa
cili
tie
s
OC
EA
N O
UT
FA
LL L
EG
ISL
AT
ION
CO
MP
LIA
NC
E P
LA
N
Page 73
67
deep injection well and HLD treatment at the WDWWTP, which is not necessary with the
use of the existing outfalls for the peak flow discharges. Substantially more cost for
transmission facilities to effect the flow transfer to the WDWWTP are also included for
Alternative 2B-1 which reflects the lower design peak flows at the existing plants due to
the conservative treatment unit loadings. Based on cost, the B alternatives are not
selected.
Of the remaining A alternatives, A2-2-2 is selected as the Plan for OOL compliance due to
the following:
• Its cost is within several percent of the lowest of the A alternatives. This is
considered to be within the accuracy of the cost estimates.
• It includes a measure of redundancy and flexibility which is not included in the
lowest cost A alternative system (2A-1-2) due to the proposed Doral Pumping
Station and associated force mains (Projects WP-1, CL-7, and CL-9). This system
can be used to transfer flows to and from North District and provides additional
major influent to the WDWWTP (CL-9). The selected alternative includes the cost
of oversizing 54-in CL-9 force main to the WDWWTP, which is not included in the
Alternative 2A-1-2.
8.0 The Recommended Plan
8.1 General
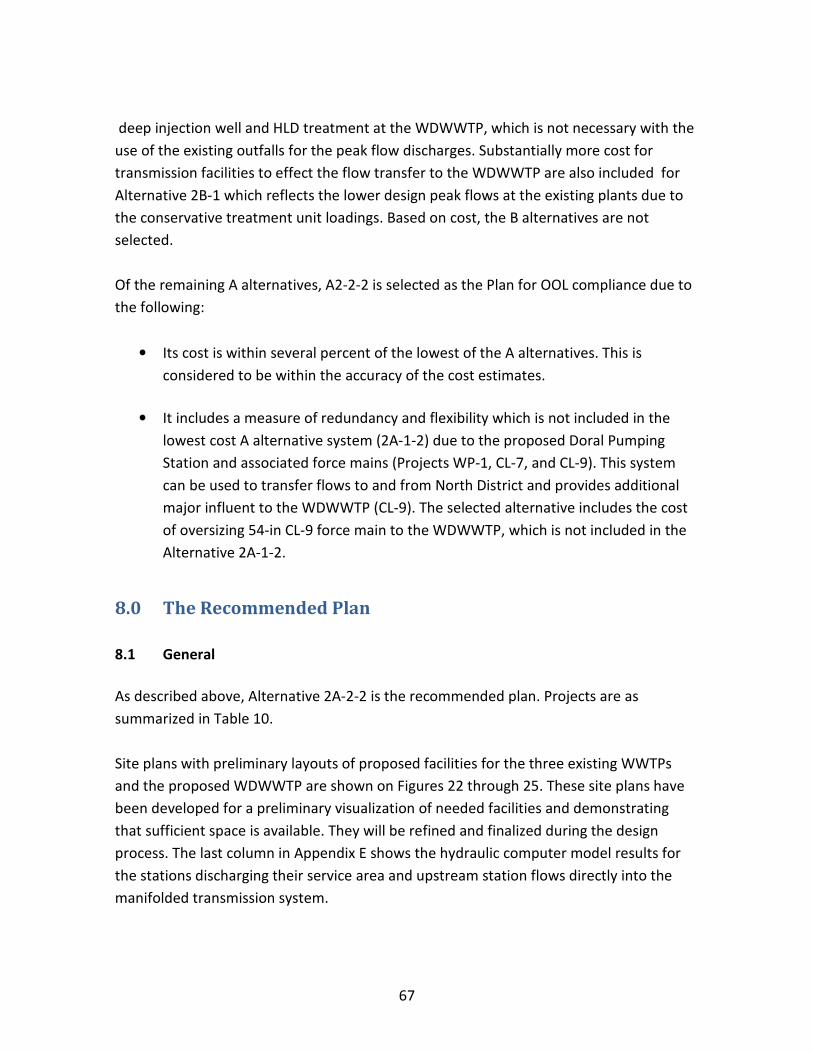
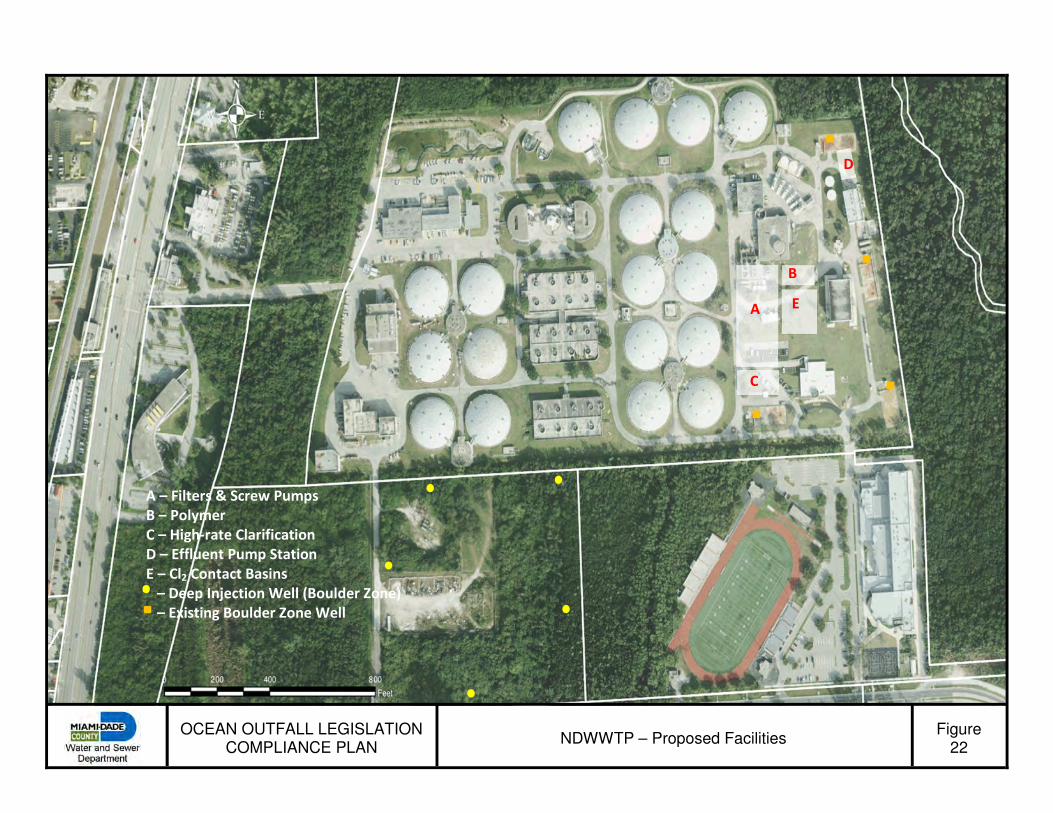
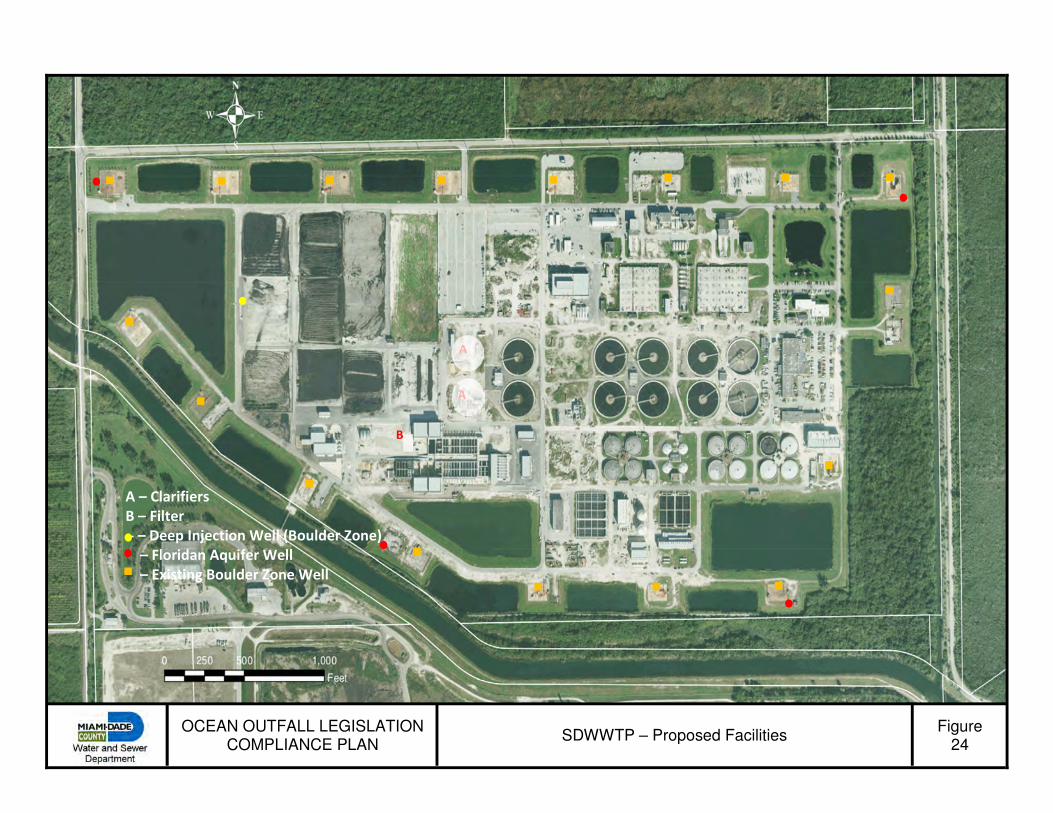
As described above, Alternative 2A-2-2 is the recommended plan. Projects are as
summarized in Table 10.
Site plans with preliminary layouts of proposed facilities for the three existing WWTPs
and the proposed WDWWTP are shown on Figures 22 through 25. These site plans have
been developed for a preliminary visualization of needed facilities and demonstrating
that sufficient space is available. They will be refined and finalized during the design
process. The last column in Appendix E shows the hydraulic computer model results for
the stations discharging their service area and upstream station flows directly into the
manifolded transmission system.
Page 74
68
8.2 Descriptions of Facilities
8.2.1 Reuse
Reuse for the recommended Plan is based on equal capacities at the existing CDWWTP
and SDWWTP and proposed WDWWTP. For the 27.5 mgd system-wide requirement, this
results in 9.2 mgd per plant. For this flow, 4 wells per WWTP, which includes one standby
well at each WWTP, are included in the Plan. Hydrogeological modeling of the Floridan
Aquifer (FA) was conducted to obtain estimated operating pressures with above flows at
the plant locations. A description of the model and the analyses results is included in
Appendix J. The equal flow distribution between the WWTPs and well design flows will be
refined as hydrogeological information is obtained from test wells and further
hydrogeological modeling is done. For the CDWWTP, this information will be obtained
during the drilling of the centrate disposal well (Project CE-4). Due to the high pressures
which can be developed with the injection of recharge water to the FA, preliminary siting
of the wells has been set with maximum separation distances on the various plant sites.
8.2.2 Transmission
• CP-187E-Upgrade to Pump Station 187
The station will boost local flow and transfer flows between districts as it currently
does. The station structure will allow for pumping units to be installed below
grade to allow for improved operation in flow transfers during dry weather
conditions. The station will be constructed on the site of existing PS 187 if
possible. An additional site in the vicinity will be obtained and interconnecting
piping provided between it and PS 187 if necessary.
• CL-4-East/West 72/84-Inch Force Main Interconnection from PS 187 to WDWWTP
Force main will carry the largest flow to the proposed WDWWTP. The route
parallels W. Flagler St.
• WP-1 Doral Booster Station
Station will booster local Doral area flow. For flexibility, the station will be
configured to reverse flow direction so as to transfer flows between districts,
directing local flow in either or both directions simultaneously. Timing for
construction of the station with the CL-7 force main will precede other
Page 75
69
Compliance Plan Projects to provide pressure relief in the Doral area. See next
bullet. Several potential sites for this station are shown in Appendix K.
Table 10
OOL Compliance Plan Projects
No. Description Project Cost
CL-3 48-INCH FM CONNECTION IN NW 58 ST FROM NW 107 AVE TO 87 AVE - DORAL $ 41,370,000
CL-4 EAST/WEST 72/84-INCH FM CONNECTION FROM PS 187 TO WDWWTP $ 157,380,000
CL-5 72-INCH FM CONNECTION IN SW 137 AVE TO CL-4 FM IN NW 6TH ST $ 30,730,000
CL-7 48-INCH FM CONNECTION IN NW 53 ST FROM PS 14 TO NW 72 AVE - DORAL $ 16,370,000
CL-9 54-INCH FORCE MAIN FROM WP-1 (DORAL) TO WDWWTP $ 99,580,000
CL-X FLOW CONTROL - PIPELINE INTERCONNECTIONS $ 5,000,000
CP-187E UPGRADE TO PS187 $ 100,000,000
WP-1 DORAL BOOSTER STATION $ 50,000,000
NT-2 NDWWTP - HLD TREATMENT $ 63,940,937
NT-3 NDWWTP - PEAK FLOW TREATMENT $ 43,779,809
CT-2 CDWWTP - HLD TREATMENT $ 173,321,438
CT-3 CDWWTP - PEAK FLOW TREATMENT $ 66,680,017
WT-1 WDWWTP - TREATMENT PLANT $ 1,303,913,184
WT-2 WDWWTP - PEAK FLOW TREATMENT $ 182,649,075
NE-1 NDWWTP - INJECTION WELL PUMP STATION $ 37,711,282
NE-2 NDWWTP - INJECTION WELLS $ 92,851,223
CE-1 CDWWTP - INJECTION WELL PUMP STATION $ 75,828,087
CE-2 CDWWTP - INJECTION WELLS $ 167,132,202
CE-3 CDWWTP - CENTRATE DISPOSAL PUMP STATION $ 20,000,000
CE-4 CDWWTP - CENTRATE DISPOSAL WELL $ 20,000,000
SE-1 SDWWTP - INJECTION WELL PUMP STATION $ 6,208,820
SE-2 SDWWTP - INJECTION WELLS $ 18,570,245
WE-1 WDWWTP - INJECTION WELL PUMP STATION $ 118,312,512
WE-2 WDWWTP - INJECTION WELLS $ 259,983,425
CR-1 CDWWTP - FLORIDAN AQUIFER RECHARGE $ 25,558,050
SR-1 SDWWTP - FLORIDAN AQUIFER RECHARGE $ 25,558,050
SR-2 SDWWTP - FPL RECLAIMED WATER PIPELINE $ 95,000,000
WR-1 WDWWTP - FLORIDAN AQUIFER RECHARGE $ 25,558,050
Total $ 3,322,986,402
• CL-7, CL-9-Pump Station WP-1 Interconnection Piping
The CL-7 project coincides with a local Master Planning project to connect the
Downtown Doral development to the existing 48-in force in Milam Dairy Road
Page 76
70
(NW 72nd Ave. The CL-7 project will be coordinated with this project and advanced
to provide pressure relief to the Doral area.
• CL-5-72-Inch Force Main Connection in SW 137th Ave to CL-4 Force Main in NW 6th
St.
This project will connect the existing 54-inch force main in the FPL easement
paralleling SW 137th Ave to the WDWWTP. A connection will be made to the 24-in
east/west force main in SW 8th St. so that flows from this local area can be
discharged to the WDWWTP.
8.2.3 Treatment
Design AADF and peak weather flows with resulting treatment plant design parameters
for selected alternative are summarized on Table 11.
General features of the wastewater treatment components of the Compliance Plan are as
follows:
• NDWWTP (Figure 22)
MDWASD owns 27.5 acres of land at the southwest portion of the present WWTP
property. The preliminary plan is to locate the Boulder Zone deep injection wells
along the periphery of that area. The remaining facilities are shown at the eastern
side of the existing plant to minimize transfer of flows back and forth to the
available 27.5 acre parcel.
• CDWWTP (Figure 23)
The plan is to operate Plant 2, the newer of the two process streams for normal
operation and to activate Plant 1 with biomass seeding from Plant 1 during peak
wet weather events. With this scheme, the filtration system is located in the
northeast corner of the site in the decommissioned sludge drying beds in the
vicinity of the Plant 2 effluent. The high rate clarification will be located in the
location of the decommissioned Plant 1 aeration basins. This will require
demolition of a portion of these tanks. This location is optimal for wet weather
discharges through the outfall. The deep injections wells are arranged along the
periphery of the sludge drying beds and the FA wells sited with maximum spacing
as shown.
Page 77
71
Table 11
Wastewater Treatment Plant Design Parameters
WWTP ND CD SD WD
Design Flows (Mgd) AADF 85 83 131 102
Peak 327 333 305 215
HLD/AADF Ratio 1.5 1.7 - -
HLD Capacity
Exist. 51 0 285 -
Proposed 57 141 20 2152
Total 57 141 305 215
Peak Effluent Flows,
Mgd
DIW-HLD 57 132 295.83 205.8
DIW-No HLD 71 0 0 0
Outfall 199 192 - -
Reuse-FA 0 9.2 9.2 9.2
Reuse-FPL - - 90 -
Number of
Deep Injection Wells
Exist. 4 0 17 -
Proposed 5 9 1 14
Total 9 9 18 14
Number of FA Wells 0 4 4 4
1Existing HLD (filtration) capacity at ND to be replaced.
2MBR proposed for HLD at WDWWTP
3Includes backup to 90 mgd reuse flow to FPL
• SDWWTP (Figure 24)
All effluent is discharged to deep injection wells at this plant so that HLD
treatment is required for the peak wet weather flow. In order to maintain the
conservative 855 gpd/ft2 loading on the secondary clarifiers at the increased peak
flow projected for the plant, an additional two final clarifiers are included. The
recently-completed HLD facility at the SDWWTP was laid out for expansion and an
additional filter has been added. FA wells are sited with maximum spacing.
• WDWWTP (Figure 25)
A preliminary site plan is shown. The 245-acre site has been selected via a formal
site selection procedure. The site is located west of NW 137th Ave at NW 6th St.
Funding is included in the proposed 2013-2019 Capital Budget Multi-Year Capital
Plan (CBMYCP) the purchase of the site. A description of the activities completed
to date with regard to the site selection process and figures showing candidate
sites evaluated and the selected site are included as Appendix L. Also included in
Appendix L is a consultant preliminary assessment of site design elevation and site
development requirements.
Page 78
72
Page intentionally left blank
Page 79
73
Figure
22 NDWWTP – Proposed Facilities
OCEAN OUTFALL LEGISLATION COMPLIANCE PLAN
A – Filters & Screw Pumps
B – Polymer
C – High-rate Clarification
D – Effluent Pump Station
E – Cl2 Contact Basins
– Deep Injection Well (Boulder Zone)
– Existing Boulder Zone Well
B
A
C
E
D
Page 81
75
Figure 23
CDWWTP – Proposed Facilities OCEAN OUTFALL LEGISLATION
COMPLIANCE PLAN
A – High-rate Clarification
B – Polymer
C – Filters & Screw Pumps
D – Cl2 Contact Basins
E – Effluent Pump Station
– Deep Injection Well (Boulder Zone)
– Floridan Aquifer Well
– Centrate Disposal Well
– Centrate Disposal Pump Station
B
A
C
D
E
Page 83
77
A
A
B
A – Clarifiers
B – Filter
- – Deep Injection Well (Boulder Zone)
– Floridan Aquifer Well
– Existing Boulder Zone Well
Figure 24
SDWWTP – Proposed Facilities OCEAN OUTFALL LEGISLATION
COMPLIANCE PLAN
Page 85
79
Figure 25
WDWWTP – Proposed Facilities OCEAN OUTFALL LEGISLATION
COMPLIANCE PLAN
. – Deep Injection Wells (Boulder Zone)
. – Floridan Aquifer Wells
A – Pre-treatment
B – MBR
C – Cl2 Contact Basin
D – Effluent Pump
E – Odor Control
F – Emergency Generators
G – Co-engines
H – Thickening
I – Dewatering
J – Digesters
K – High-rate Clarification
L – On-site Cl2 Generation
M – Maintenance Building
N – Administration Building
O – Class AA Biosolids
E
E
J
M
H I
G
F
D
L
K
B
A N
C
A O
Page 87
81
8.3 Project Schedules
Project schedules are included in Figures 26-1, 26-2, 26-3, and 26-4. As indicated, most of
the projects are scheduled to be completed one year before the December 31, 2025
deadline included in the OOL for removal of flow from the outfalls and initiation of reuse
projects. Projects for near term initiation are:
• Projects CE-3, CE-4-Centrate Disposal Well and Pump Station-As previously
described, these projects are needed to comply with the nutrient reduction
requirements of the OOL and need to be in service by December 31, 2015.
Hydrogeological data obtained from the drilling of the disposal well will be used in
the FA well design.
• Project CP-187E is scheduled for initiation in FY 2013-2014. It will provide
hydraulic relief to the central part of the county and improve inter-district flow
transfers within the MDWASD system.
• Projects CL-3 and CL-7-As indicated this project is needed for a proposed
development in the Doral area. Completion of pump station WP-1 will provide
capacity relief in the Doral area. These projects have been advanced to be
initiated in FY 2-13-2014.
• The CDWWTP projects for HLD and Peak Flow, including the Deep Injection Well
system have been advanced to be initiated in 2015-2016 to provide an additional
measure of assurance that the required OOL nutrient reductions have been
achieved. These are projects CE-1, CE-2, CT-2 and CT-3.
• For the proposed WDWWTP, in addition to the land acquisition during 2013-2014,
steps for procuring engineering assistance to initiate activities such as site
permitting and rezoning will proceed following FDEP response to the submission
of this Plan.
The schedules are cost-loaded with monthly projected expenditures assigned to each
month of the estimated project durations. This information is summarized on Table 12
which shows the annual projected cost for each project and annual totals for all of the
projects for each of the project phases.
Page 88
82
Page intentionally left blank
Page 89
Project Name and Phases Project Cost Start Finish Dur(Mo.)
Total $3,322,986,406 01-Jul-13 31-Dec-24 136
CL-3 - 48-Inch FM Connection in NW 58th St from NW 107th Ave to 87 Ave - Doral$41,370,000 01-Aug-19 31-Dec-24 65
A&E Selection $5,000 01-Aug-19 30-Apr-20 9
Design $3,203,852 01-May-20 29-Oct-21 18
Dry Run/Permit $503,007 01-Nov-21 29-Apr-22 6
Contractor Selection $10,000 02-May-22 30-Dec-22 8
Construction $37,648,141 02-Jan-23 31-Dec-24 24
CL-4 - East/West 72/84-Inch FM Connection from PS 187 to WDWWTP$157,380,000 01-Apr-19 31-Dec-24 69
A&E Selection $5,000 01-Apr-19 31-Dec-19 9
Design $12,191,254 02-Jan-20 29-Oct-21 22
Dry Run/Permit $1,914,170 01-Nov-21 29-Apr-22 6
Contractor Selection $10,000 02-May-22 30-Dec-22 8
Construction $143,259,576 02-Jan-23 31-Dec-24 24
CL-5 - 72-Inch FM Connection in SW 137 Ave to CL-4 FM in NW 6th St.$30,730,000 01-Aug-19 31-Dec-24 65
A&E Selection $5,000 01-Aug-19 30-Apr-20 9
Design $2,379,562 01-May-20 27-Oct-21 18
Dry Run/Permit $373,581 28-Oct-21 29-Apr-22 6
Contractor Selection $10,000 02-May-22 30-Dec-22 8
Construction $27,961,857 02-Jan-23 31-Dec-24 24
CL-7 - 48-Inch FM Connection in NW 53 St from PS 14 to NW 72 Ave - Doral$16,370,000 01-Oct-13 31-May-18 54
A&E Selection $5,000 01-Oct-13 30-Jun-14 9
Design $1,267,079 01-Jul-14 30-Sep-15 15
Dry Run/Permit $198,903 01-Oct-15 31-Mar-16 6
Contractor Selection $10,000 01-Apr-16 31-Oct-16 7
Construction $14,889,018 01-Nov-16 31-May-18 18
CL-9 - 54-Inch Force Main From CP-2 (Doral) to WDWWTP$99,580,000 01-Oct-19 31-Dec-24 63
A&E Selection $5,000 01-Oct-19 30-Jun-20 9
Design $7,713,435 01-Jul-20 28-Sep-21 15
Dry Run/Permit $1,211,083 29-Sep-21 31-Mar-22 6
Contractor Selection $10,000 01-Apr-22 30-Dec-22 9
Construction $90,640,482 02-Jan-23 31-Dec-24 24
CL-X - Flow Control - Pipeline Interconnections$5,000,000 01-Aug-19 23-Feb-24 55
A&E Selection $5,000 01-Aug-19 28-Apr-20 9
Design $386,236 29-Apr-20 03-Aug-21 15
Dry Run/Permit $60,597 03-Aug-21 02-Feb-22 6
Contractor Selection $10,000 02-Feb-22 31-Aug-22 7
Construction $4,538,167 01-Sep-22 23-Feb-24 18
CP-187E - Upgrade to PS187$100,000,000 01-Jul-13 19-Feb-19 66
A&E Selection $5,000 01-Jul-13 31-Mar-14 9
Design $7,745,972 01-Apr-14 27-Oct-15 18
Dry Run/Permit $1,216,192 28-Oct-15 29-Apr-16 6
Contractor Selection $10,000 02-May-16 31-Jan-17 9
Construction $91,022,836 01-Feb-17 19-Feb-19 24
WP-1 - Doral Booster Station$50,000,000 01-Aug-13 31-May-18 56
Land Acquisition $750,000 01-Aug-13 30-Apr-14 9
A&E Selection $5,000 02-Oct-13 01-Jul-14 9
Design $3,872,426 02-Jul-14 01-Oct-15 15
Dry Run/Permit $607,984 02-Oct-15 01-Apr-16 6
Contractor Selection $10,000 04-Apr-16 01-Nov-16 7
Construction $44,754,590 02-Nov-16 31-May-18 18
NT-2 - NDWWTP - HLD Treatment$63,940,937 02-Jan-19 31-Dec-24 72
A&E Selection $5,000 02-Jan-19 30-Sep-19 9
Design $4,952,444 01-Oct-19 31-Mar-21 18
J A J J A S J F A J J A S D J A J J A S J F A J J A S J F A J J A S D J A J J A S J A J J A S J F A J J A S J F A J J A S D J A J J A S J F A J J A S D J F A J J A S D J A J J A S2013 2014 2015 2016 2017 2018 2019 2020 2021 2022 2023 2024 2025
01-Jul-13 31-Dec-24Total
01-Aug-19 31-Dec-24CL-3 - 48-Inch FM Connection in NW 58th St from NW 107th Ave to 87 Ave - Doral
A&E Selection
Design
Dry Run/Permit
Contractor Selection
Construction
01-Apr-19 31-Dec-24CL-4 - East/West 72/84-Inch FM Connection from PS 187 to WDWWTP
A&E Selection
Design
Dry Run/Permit
Contractor Selection
Construction
01-Aug-19 31-Dec-24CL-5 - 72-Inch FM Connection in SW 137 Ave to CL-4 FM in NW 6th St.
A&E Selection
Design
Dry Run/Permit
Contractor Selection
Construction
01-Oct-13 31-May-18CL-7 - 48-Inch FM Connection in NW 53 St from PS 14 to NW 72 Ave - Doral
A&E Selection
Design
Dry Run/Permit
Contractor Selection
Construction
01-Oct-19 31-Dec-24CL-9 - 54-Inch Force Main From CP-2 (Doral) to WDWWTP
A&E Selection
Design
Dry Run/Permit
Contractor Selection
Construction
01-Aug-19 23-Feb-24CL-X - Flow Control - Pipeline Interconnections
A&E Selection
Design
Dry Run/Permit
Contractor Selection
Construction
01-Jul-13 19-Feb-19CP-187E - Upgrade to PS187
A&E Selection
Design
Dry Run/Permit
Contractor Selection
Construction
01-Aug-13 31-May-18WP-1 - Doral Booster Station
Land Acquisition
A&E Selection
Design
Dry Run/Permit
Contractor Selection
Construction
02-Jan-19 31-Dec-24NT-2 - NDWWTP - HLD Treatment
A&E Selection
Design
OCEAN OUTFALL LEGISLATION COMPLIANCE PLAN
Project Schedules and Gantt ChartsPage 1 of 4
Figure 26-1
Page 91
Project Name and Phases Project Cost Start Finish Dur(Mo.)
Dry Run/Permit $777,564 01-Apr-21 30-Sep-21 6
Contractor Selection $10,000 01-Oct-21 30-Jun-22 9
Construction $58,195,929 01-Jul-22 31-Dec-24 30
NT-3 - NDWWTP - Peak Flow Treatment$43,779,809 02-Jan-19 31-Dec-24 72
A&E Selection $5,000 02-Jan-19 30-Sep-19 9
Design $3,390,542 01-Oct-19 31-Mar-21 18
Dry Run/Permit $532,320 01-Apr-21 30-Sep-21 6
Contractor Selection $10,000 01-Oct-21 30-Jun-22 9
Construction $39,841,947 01-Jul-22 31-Dec-24 30
CT-2 - CDWWTP - HLD Treatment$173,321,438 02-May-16 30-Dec-22 79
A&E Selection $5,000 02-May-16 31-Jan-17 9
Design $13,426,252 01-Feb-17 28-Feb-19 24
Dry Run/Permit $2,108,085 01-Mar-19 30-Aug-19 6
Contractor Selection $10,000 03-Sep-19 30-Jun-20 10
Construction $157,772,101 01-Jul-20 30-Dec-22 30
CT-3 - CDWWTP - Peak Flow Treatment$66,680,017 02-May-16 30-Dec-22 79
A&E Selection $5,000 02-May-16 31-Jan-17 9
Design $5,164,642 01-Feb-17 28-Feb-19 24
Dry Run/Permit $810,882 01-Mar-19 30-Aug-19 6
Contractor Selection $10,000 03-Sep-19 30-Jun-20 10
Construction $60,689,493 01-Jul-20 30-Dec-22 30
WT-1 - WDWWTP - Treatment Plant$1,303,913,184 01-Jul-13 31-Dec-24 136
A&E Selection $5,000 01-Jul-13* 31-Mar-14 9
Land Acquisition $15,600,000 01-Aug-13* 29-Aug-14 13
Pre-Design / Permiting $4,000,000 01-Apr-14 28-Feb-17 34
Design $97,014,236 01-Mar-17 30-Sep-19 30
Dry Run/Permit $15,860,777 01-Oct-19 31-Mar-20 6
Contractor Selection $10,000 01-Apr-20 29-Jan-21 10
Construction $1,171,423,171 01-Feb-21 31-Dec-24 48
WT-2 - WDWWTP - Peak Flow Treatment$182,649,075 01-Jul-13 31-Dec-24 136
A&E Selection $5,000 01-Jul-13 31-Mar-14 9
Pre-Design / Permiting $1,000,000 01-Apr-14 28-Feb-17 34
Design $13,148,872 01-Mar-17 30-Sep-19 30
Dry Run/Permit $2,221,547 01-Oct-19 31-Mar-20 6
Contractor Selection $10,000 01-Apr-20 29-Jan-21 10
Construction $166,263,656 01-Feb-21 31-Dec-24 48
NE-1 - NDWWTP - Injection Well Pump Station$37,711,282 01-Aug-19 31-Dec-24 65
A&E Selection $5,000 01-Aug-19 30-Apr-20 9
Design $2,920,409 01-May-20 03-Nov-21 18
Dry Run/Permit $458,502 04-Nov-21 29-Apr-22 6
Contractor Selection $10,000 02-May-22 30-Dec-22 8
Construction $34,317,371 02-Jan-23 31-Dec-24 24
NE-2 - NDWWTP - Injection Wells$92,851,223 03-Dec-18 31-Dec-24 73
A&E Selection $5,000 03-Dec-18 30-Aug-19 9
Design $7,192,151 03-Sep-19 31-Mar-21 19
Dry Run/Permit $1,129,233 01-Apr-21 30-Sep-21 6
Contractor Selection $10,000 01-Oct-21 30-Jun-22 9
Construction $84,514,839 01-Jul-22 31-Dec-24 30
CE-1 - CDWWTP - Injection Well Pump Station$75,828,087 01-Nov-16 30-Dec-22 73
A&E Selection $5,000 01-Nov-16 31-Jul-17 9
Design $5,873,353 01-Aug-17 28-Feb-19 18
Dry Run/Permit $922,161 01-Mar-19 30-Aug-19 6
Contractor Selection $10,000 03-Sep-19 30-Jun-20 10
J A J J A S J F A J J A S D J A J J A S J F A J J A S J F A J J A S D J A J J A S J A J J A S J F A J J A S J F A J J A S D J A J J A S J F A J J A S D J F A J J A S D J A J J A S2013 2014 2015 2016 2017 2018 2019 2020 2021 2022 2023 2024 2025
Dry Run/Permit
Contractor Selection
Construction
02-Jan-19 31-Dec-24NT-3 - NDWWTP - Peak Flow Treatment
A&E Selection
Design
Dry Run/Permit
Contractor Selection
Construction
02-May-16 30-Dec-22CT-2 - CDWWTP - HLD Treatment
A&E Selection
Design
Dry Run/Permit
Contractor Selection
Construction
02-May-16 30-Dec-22CT-3 - CDWWTP - Peak Flow Treatment
A&E Selection
Design
Dry Run/Permit
Contractor Selection
Construction
01-Jul-13 31-Dec-24WT-1 - WDWWTP - Treatment Plant
A&E Selection
Land Acquisition
Pre-Design / Permiting
Design
Dry Run/Permit
Contractor Selection
Construction
01-Jul-13 31-Dec-24WT-2 - WDWWTP - Peak Flow Treatment
A&E Selection
Pre-Design / Permiting
Design
Dry Run/Permit
Contractor Selection
Construction
01-Aug-19 31-Dec-24NE-1 - NDWWTP - Injection Well Pump Station
A&E Selection
Design
Dry Run/Permit
Contractor Selection
Construction
03-Dec-18 31-Dec-24NE-2 - NDWWTP - Injection Wells
A&E Selection
Design
Dry Run/Permit
Contractor Selection
Construction
01-Nov-16 30-Dec-22CE-1 - CDWWTP - Injection Well Pump Station
A&E Selection
Design
Dry Run/Permit
Contractor Selection
OCEAN OUTFALL LEGISLATION COMPLIANCE PLAN
Project Schedules and Gantt ChartsPage 2 of 4
Figure 26-2
Page 93
Project Name and Phases Project Cost Start Finish Dur(Mo.)
Construction $69,017,573 01-Jul-20 30-Dec-22 30
CE-2 - CDWWTP - Injection Wells$167,132,202 01-Nov-16 30-Dec-22 73
A&E Selection $5,000 01-Nov-16 31-Jul-17 9
Design $12,946,766 01-Aug-17 28-Feb-19 18
Dry Run/Permit $2,032,798 01-Mar-19 30-Aug-19 6
Contractor Selection $10,000 03-Sep-19 30-Jun-20 10
Construction $152,137,638 01-Jul-20 30-Dec-22 30
CE-3 - CDWWTP - Centrate Disposal Pump Station$20,000,000 01-Jul-13 30-Dec-15 29
Design $1,553,299 01-Jul-13 31-Dec-13 6
Dry Run/Permit $243,059 02-Jan-14 30-Apr-14 4
Contractor Selection $10,000 01-May-14 31-Oct-14 6
Construction $18,193,642 03-Nov-14 30-Dec-15 13
CE-4 - CDWWTP - Centrate Disposal Well$20,000,000 01-Jul-13 30-Dec-15 29
Design $1,553,299 01-Jul-13 31-Dec-13 6
Dry Run/Permit $243,059 02-Jan-14 30-Apr-14 4
Contractor Selection $10,000 01-May-14 31-Oct-14 6
Construction $18,193,642 03-Nov-14 30-Dec-15 13
SE-1 - SDWWTP - Injection Well Pump Station$6,208,820 03-Dec-20 31-Dec-24 49
A&E Selection $5,000 03-Dec-20 31-Aug-21 9
Design $479,884 01-Sep-21 31-Aug-22 12
Dry Run/Permit $75,301 01-Sep-22 28-Feb-23 6
Contractor Selection $10,000 01-Mar-23 29-Sep-23 7
Construction $5,638,635 02-Oct-23 31-Dec-24 15
SE-2 - SDWWTP - Injection Wells$18,570,245 01-Feb-21 31-Dec-24 48
A&E Selection $5,000 01-Feb-21 29-Oct-21 9
Design $1,437,534 01-Nov-21 29-Jul-22 9
Dry Run/Permit $225,667 01-Aug-22 31-Jan-23 6
Contractor Selection $10,000 01-Feb-23 29-Sep-23 8
Construction $16,892,044 02-Oct-23 31-Dec-24 15
WE-1 - WDWWTP - Injection Well Pump Station$118,312,512 03-Jun-19 27-Dec-24 67
A&E Selection $5,000 03-Jun-19 28-Feb-20 9
Design $9,164,660 02-Mar-20 31-Aug-21 18
Dry Run/Permit $1,438,948 01-Sep-21 28-Feb-22 6
Contractor Selection $10,000 01-Mar-22 28-Dec-22 10
Construction $107,693,904 29-Dec-22 27-Dec-24 24
WE-2 - WDWWTP - Injection Wells$259,983,425 03-Dec-18 31-Dec-24 73
A&E Selection $5,000 03-Dec-18 30-Aug-19 9
Design $20,140,036 03-Sep-19 05-Mar-21 18
Dry Run/Permit $3,162,255 08-Mar-21 31-Aug-21 6
Contractor Selection $10,000 01-Sep-21 30-Jun-22 10
Construction $236,666,134 01-Jul-22 31-Dec-24 30
CR-1 - CDWWTP - Floridan Aquifer Recharge$25,558,050 01-Aug-19 31-Dec-24 65
A&E Selection $5,000 01-Aug-19 30-Apr-20 9
Design $1,978,886 01-May-20 29-Oct-21 18
Dry Run/Permit $310,668 01-Nov-21 29-Apr-22 6
Contractor Selection $10,000 02-May-22 30-Dec-22 8
Construction $23,253,496 02-Jan-23 31-Dec-24 24
SR-1 - SDWWTP - Floridan Aquifer Recharge$25,558,050 01-Aug-19 31-Dec-24 65
A&E Selection $5,000 01-Aug-19 30-Apr-20 9
Design $1,978,886 01-May-20 29-Oct-21 18
Dry Run/Permit $310,668 01-Nov-21 29-Apr-22 6
Contractor Selection $10,000 02-May-22 30-Dec-22 8
Construction $23,253,496 02-Jan-23 31-Dec-24 24
J A J J A S J F A J J A S D J A J J A S J F A J J A S J F A J J A S D J A J J A S J A J J A S J F A J J A S J F A J J A S D J A J J A S J F A J J A S D J F A J J A S D J A J J A S2013 2014 2015 2016 2017 2018 2019 2020 2021 2022 2023 2024 2025
Construction
01-Nov-16 30-Dec-22CE-2 - CDWWTP - Injection Wells
A&E Selection
Design
Dry Run/Permit
Contractor Selection
Construction
01-Jul-13 30-Dec-15CE-3 - CDWWTP - Centrate Disposal Pump Station
Design
Dry Run/Permit
Contractor Selection
Construction
01-Jul-13 30-Dec-15CE-4 - CDWWTP - Centrate Disposal Well
Design
Dry Run/Permit
Contractor Selection
Construction
03-Dec-20 31-Dec-24SE-1 - SDWWTP - Injection Well Pump Station
A&E Selection
Design
Dry Run/Permit
Contractor Selection
Construction
01-Feb-21 31-Dec-24SE-2 - SDWWTP - Injection Wells
A&E Selection
Design
Dry Run/Permit
Contractor Selection
Construction
03-Jun-19 27-Dec-24WE-1 - WDWWTP - Injection Well Pump Station
A&E Selection
Design
Dry Run/Permit
Contractor Selection
Construction
03-Dec-18 31-Dec-24WE-2 - WDWWTP - Injection Wells
A&E Selection
Design
Dry Run/Permit
Contractor Selection
Construction
01-Aug-19 31-Dec-24CR-1 - CDWWTP - Floridan Aquifer Recharge
A&E Selection
Design
Dry Run/Permit
Contractor Selection
Construction
01-Aug-19 31-Dec-24SR-1 - SDWWTP - Floridan Aquifer Recharge
A&E Selection
Design
Dry Run/Permit
Contractor Selection
Construction
OCEAN OUTFALL LEGISLATION COMPLIANCE PLAN
Project Schedules and Gantt ChartsPage 3 of 4
Figure 26-3
Page 95
Project Name and Phases Project Cost Start Finish Dur(Mo.)
SR-2 - SDWWTP - FPL Reclaimed Water Pipeline$95,000,000 01-Jul-20 31-Jul-20 1
Construction $95,000,000 01-Jul-20 31-Jul-20 1
WR-1 - WDWWTP - Floridan Aquifer Recharge$25,558,050 01-Aug-19 31-Dec-24 65
A&E Selection $5,000 01-Aug-19 30-Apr-20 9
Design $1,978,886 01-May-20 29-Oct-21 18
Dry Run/Permit $310,668 01-Nov-21 29-Apr-22 6
Contractor Selection $10,000 02-May-22 30-Dec-22 8
Construction $23,253,496 02-Jan-23 31-Dec-24 24
J A J J A S J F A J J A S D J A J J A S J F A J J A S J F A J J A S D J A J J A S J A J J A S J F A J J A S J F A J J A S D J A J J A S J F A J J A S D J F A J J A S D J A J J A S2013 2014 2015 2016 2017 2018 2019 2020 2021 2022 2023 2024 2025
01-Jul-20 31-Jul-20SR-2 - SDWWTP - FPL Reclaimed Water Pipeline
Construction
01-Aug-19 31-Dec-24WR-1 - WDWWTP - Floridan Aquifer Recharge
A&E Selection
Design
Dry Run/Permit
Contractor Selection
Construction
OCEAN OUTFALL LEGISLATION COMPLIANCE PLAN
Project Schedules and Gantt ChartsPage 4 of 4
Figure 26-4
Page 97
91
Table 12
Ocean Outfall Legislation Projects – Compliance plan – Annual Projected Expenditures by Project and Project Phase October 1, 2012 – September 30, 2025
No Project Name Project Cost
2012/2013 2013/2014 2014/2015 2015/2016 2016/2017 2017/2018 2018/2019 2019/2020 2020/2021 2021/2022 2022/2023 2023/2024 2024/2025
1 CL-3 - 48-Inch FM Connection in NW 58th St from NW 107th Ave to 87 Ave - Doral $41,370,000
$294 $327,761 $2,863,276 $528,257 $8,674,326 $28,301,016 $675,070
2 CL-4 - East/West 72/84-Inch FM Connection from PS 187 to WDWWTP $157,380,000
$4,203 $3,460,196 $8,677,151 $1,976,603 $33,001,374 $107,691,681 $2,568,792
3 CL-5 - 72-Inch FM Connection in SW 137 Ave to CL-4 FM in NW 6th St. $30,730,000
$294 $247,397 $2,125,036 $393,145 $6,443,141 $21,019,603 $501,385
4 CL-7 - 48-Inch FM Connection in NW 53 St from PS 14 to NW 72 Ave - Doral $16,370,000
$58,901 $1,213,178 $208,698 $10,211,966 $4,677,257
5 CL-9 - 54-Inch Force Main From CP-2 (Doral) to WDWWTP $99,580,000
$317,406 $7,402,864 $1,217,574 $20,880,241 $68,136,638 $1,625,278
6 CL-X - Flow Control - Pipeline Interconnections $5,000,000
$303 $71,255 $329,170 $86,903 $4,071,920 $440,448
7 CP-187E - Upgrade to PS187 $100,000,000
$917 $1,194,075 $6,520,860 $1,257,903 $14,857,486 $72,942,230 $3,226,529
8 WP-1 - Doral Booster Station $50,000,000
$44,759 $865,138 $3,716,300 $618,988 $30,586,306 $14,168,510
9 NT-2 - NDWWTP - HLD Treatment $63,940,937
$5,000 $4,110,529 $1,619,479 $610,675 $28,394,801 $28,599,779 $600,675
10 NT-3 - NDWWTP - Peak Flow Treatment $43,779,809
$5,000 $2,814,150 $1,108,712 $421,232 $19,439,575 $19,579,907 $411,232
11 CT-2 - CDWWTP - HLD Treatment $173,321,438
$3,295 $2,103,777 $10,804,138 $2,628,223 $1,570,555 $75,923,251 $78,688,531 $1,599,668
12 CT-3 - CDWWTP - Peak Flow Treatment $66,680,017
$3,295 $810,303 $4,156,000 $1,011,021 $610,233 $29,205,060 $30,268,767 $615,337
13 WT-1 - WDWWTP - Treatment Plant $1,303,913,184
$411,564 $15,323,559 $2,039,781 $1,745,937 $6,325,259 $66,680,522 $24,092,614 $15,868,177 $36,406,123 $348,951,145 $610,423,800 $168,079,740 $7,564,964
14 WT-2 - WDWWTP - Peak Flow Treatment $182,649,075
$917 $36,614 $509,945 $436,484 $866,930 $9,037,577 $3,265,404 $2,228,947 $5,169,463 $49,527,698 $86,639,308 $23,856,069 $1,073,718
15 NE-1 - NDWWTP - Injection Well Pump Station $37,711,282
$294 $294,182 $2,612,823 $484,342 $7,907,100 $25,797,196 $615,346
16 NE-2 - NDWWTP - Injection Wells $92,851,223
$41,141 $6,114,051 $2,171,191 $882,328 $41,236,252 $41,533,931 $872,328
17 CE-1 - CDWWTP - Injection Well Pump Station $75,828,087
$79,346 $5,290,478 $1,430,785 $692,612 $33,212,707 $34,422,381 $699,776
18 CE-2 - CDWWTP - Injection Wells $167,132,202
$168,883 $11,661,922 $3,153,855 $1,514,820 $73,211,829 $75,878,353 $1,542,539
19 CE-3 - CDWWTP - Centrate Disposal Pump Station $20,000,000
$805,003 $1,001,039 $17,315,644 $878,314
20 CE-4 - CDWWTP - Centrate Disposal Well $20,000,000
$805,003 $1,001,039 $17,315,644 $878,314
21 SE-1 - SDWWTP - Injection Well Pump Station $6,208,820
$9,045 $478,186 $82,954 $5,404,813 $233,822
22 SE-2 - SDWWTP - Injection Wells $18,570,245
$4,938 $1,478,523 $194,739 $16,191,567 $700,477
23 WE-1 - WDWWTP - Injection Well Pump Station $118,312,512
$1,944 $2,334,689 $6,877,869 $1,402,984 $25,426,787 $80,460,963 $1,807,277
24 WE-2 - WDWWTP - Injection Wells $259,983,425
$111,000 $17,871,632 $5,324,763 $2,452,667 $115,473,502 $116,307,089 $2,442,771
25 CR-1 - CDWWTP - Floridan Aquifer Recharge $25,558,050
$294 $204,244 $1,768,526 $329,219 $5,358,594 $17,480,214 $416,959
26 SR-1 - SDWWTP - Floridan Aquifer Recharge $25,558,050
$294 $204,244 $1,768,526 $329,219 $5,358,594 $17,480,214 $416,959
27 SR-2 - SDWWTP - FPL Reclaimed Water Pipeline $95,000,000
$95,000,000
28 WR-1 - WDWWTP - Floridan Aquifer Recharge $25,558,050
$294 $204,244 $1,768,526 $329,219 $5,358,594 $17,480,214 $416,959
Total $3,322,986,406
$2,068,164 $19,480,365 $48,631,351 $6,031,227 $66,010,257 $199,418,636 $38,978,784 $156,061,323 $299,560,330 $631,137,949 $1,028,822,923 $803,841,082 $22,944,014
No Phase Name Project Cost
2012/2013 2013/2014 2014/2015 2015/2016 2016/2017 2017/2018 2018/2019 2019/2020 2020/2021 2021/2022 2022/2023 2023/2024 2024/2025
1 Land Acquisition $16,350,000 $455,406 $15,894,594
2 Land Acquisition $16,350,000 $455,406 $15,894,594
3 Design $289,439,532 $1,612,757 $3,566,403 $14,000,064 $4,248,440 $10,354,498 $107,630,639 $35,751,870 $56,658,304 $46,431,793 $8,927,070 $257,694
4 Pre-Design, Planning $5,000,000 $162,654 $2,549,726 $2,182,421 $105,198
5 A&E Selection $125,000 $2,751 $22,249 $6,590 $13,410 $28,211 $41,789 $9,938 $62
6 Design $245,054,853 $1,610,007 $2,895,381 $11,450,337 $36,350 $10,235,890 $107,630,639 $29,849,733 $38,534,191 $40,764,314 $2,048,011
7 Dry Run / Permit $39,259,679 $486,118 $2,023,079 $5,873,926 $18,082,324 $5,657,541 $6,878,998 $257,694
8 Construction $3,017,196,874 $19,369 $34,631,288 $1,782,787 $55,655,758 $91,787,997 $3,226,914 $99,403,020 $253,128,538 $622,210,879 $1,028,565,230 $803,841,082 $22,944,014
9 Contractor Selection $270,000 $19,369 $631 $26,159 $3,841 $385 $54,414 $5,305 $121,199 $38,697
10 Construction $3,016,926,874 $34,630,656 $1,756,628 $55,651,918 $91,787,997 $3,226,529 $99,348,605 $253,123,233 $622,089,680 $1,028,526,533 $803,841,082 $22,944,014
Total $3,322,986,406
$2,068,164 $19,480,365 $48,631,351 $6,031,227 $66,010,257 $199,418,636 $38,978,784 $156,061,323 $299,560,330 $631,137,949 $1,028,822,923 $803,841,082 $22,944,014
NDWWTP - North District Wastewater Treatment Plant FPL - Florida Power & Light
CDWWTP - Central District Wastewater Treatment Plant HLD - High Level Disinfection
SDWWTP - South District Wastewater Treatment Plant OOL - Ocean Outfall Legislation
WDWWTP - West District Wastewater Treatment Plant
Page 99
93
8.4 Financial Plan
The MDWASD water and wastewater rates are set annually as part of the County’s
budgeting process. Each year, the MDWASD prepares a budget that includes estimated
water and wastewater flows, expenses, revenues and rates necessary to meet cash flow
and debt service requirements. Rates are set on an annual basis as the budget is
approved. Future rate requirements are estimated and submitted with the proposed
Capital Budget and Multi-Year Capital Plan (CBMYCP) over the 6-year horizon each year,
with only the next year’s rates approved by the Miami-Dade County Board of County
Commissioners (BCC).
The present proposed budget includes the following five year retail rate adjustments:
2013-2014 8% (Approved by BCC on June 4, 2013)
2014-2015 6%
2015-2016 6%
2016-2017 5%
2017-2018 5%
Wholesale rates are computed based on cost recovery. An estimated 4% annual increase
is included in the rate computations. These projected retail and wholesale rate increases
were based on preliminary estimates for compliance with the Ocean Outfall legislation
(OOL) prior to the completion of this report. Table 13 shows the latest proposed CBMYP,
submitted to the Office of Management and Budget (OMB) on June 7, 2013, together
with adjustments based on the implementation of the selected alternative. Note that the
OOL figure for compliance is slightly higher than estimated with a reduction in the overall
wastewater total. The CBMYCP and rate adjustments are reviewed for updates and
prepared annually for budget submittal.
Table 13
Proposed Wastewater Capital Budget and Multi-Year Capital Plan Adjustments
CBMYCP FY2013-FY2019 OOL Compliance
Plan
OOL - Project 1040 $ 2,987,929,371
OOL - Other related projects $ 249,729,972
OOL - Total $ 3,237,659,343 $ 3,322,986,402
Total CBMYCP $ 8,559,724,151 $ 8,300,252,126
Page 100
94
The primary means of funding the needed projects will be revenue bonds supported
through rate adjustments including the rate increases indicated above. Funding via the
State of Florida revolving loan fund will also be sought, in addition to any grants that may
become available.
8.5 Public Meeting
A public meeting was held at the MDWASD Douglas Road Headquarters on June 5, 2013
to present the draft Plan for public comments. The presentation given at the meeting and
sign-in sheet are included as Appendix M.