Page 1
SW 8TH ST
S D
IXIE
HW
Y
FL
OR
IDA
TP
KE
EX
T
NW
27
TH
AV
E
SW
17
7T
H A
VE
BIS
CA
YN
E B
LV
D
SR
82
6 E
XT
INGRAHAM HWY
CO
LL
INS
AV
E
W O
KEEC
HO
BEE RD
I 195
SR
874
EX
T
SW
CA
RD
SO
UN
D R
D
I 75
EX
T
SR 112
N K
RO
ME
AVE
KR
OM
E A
VE
SR 9
SR 878
NW 36TH ST
NW 119TH ST
I 95
EX
PY
GRATIGNY PKWY
NW
2N
D A
VE
SW
27
TH
AV
E
SW 392ND ST SW
19
2N
D A
VE
ALT
ON
RD
BR
ICK
EL
L A
VE
NE 79TH ST
N K
RO
ME
AV
E
SR 826 EXT
KR
OM
E A
VE
CO
LL
INS
AV
E
S D
IXIE
HW
Y
I 95
EX
PY
Miami-Dade CountyDepartment of Planning & Zoning
Planning Research Section
111 NW 1st StreetSuite 1220
Miami, Florida 33128-1972www.miamidade.gov/planzone
April, 2009
Miami-Dade County Facts
Income
Employment
Population
Housing
Page 2
MIAMI-DADE COUNTY FACTS - 2009
A Compendium of Selected Statistics
Research Section
Department of Planning and Zoning
Stephen P. Clark Center
111 N.W. lst Street, Suite 1220
Miami, Florida 33128-1972
305-375-2845
This report is also available on the Department of Planning and Zoning web site.
http://www.miamidade.gov/planzone/planning_research.asp
Page 3
Introductory Material Page
Map of Miami-Dade County 1
Map of Commission Districts 2
Map of Municipalities in Miami-Dade County 3
I. Population
Resident Population, Miami-Dade County by Municipality, 1900-2007 4
Resident Population & Population Change, Miami-Dade County, 1900-2009 5
Population Projections, Components of Change, Miami-Dade County, 1990 to 2030 6
Births and Deaths, Miami-Dade County, 1971-2007 7
Population by Race and Hispanic Origin, Miami-Dade County, 1930-2020 8
Population by Race and Hispanic Origin, Miami MSA, 1960-2000 9
Map of Population Densities by Race and Ethnicity, 2000 10
Population by Race and Hispanic Origin, All Ages and 18 Years and Over, Miami-Dade County, 2000 11
Black Population, Miami-Dade County by Municipality, 2000 12
Black Population, Selected Cities, Miami-Dade County, 1950-2000 13
Map - Where Blacks Live - 2000 14
Hispanic Origin Population, Selected Metropolitan Areas in Florida, 1970, 1980, 1990 and 2000 15
Municipal Population by Percent Hispanic, 1970, 1980, 1990 and 2000 16
Map - Where Hispanics Live - 2000 17
Population by Race and Hispanic Origin, Miami-Dade County by Municipality, 2000 18
Persons of Hispanic Origin by Country of Origin, (including Central and South America), Miami-Dade County,
Florida, 1990, 2000-2007
19
White Population, Miami-Dade County, 2000 20
Black Population, Miami-Dade County, 2000 20
Some Other Race Population, Miami-Dade County, 2000 21
Asian Population, Miami-Dade County, 2000 21
American Indian and Alaskan Native Population, Miami-Dade County, 2000 22
Native Hawaiian and Other Pacific Island Population, Miami-Dade County, 2000 22
Percent Distribution of Population of Two or More Races, Miami-Dade County and the United States 23
Place of Birth for the Foreign-Born Population, Miami-Dade County, 2000 24
Population by Age, 1970, 1980, 1990 and 2000, Miami-Dade County 27
Population Under 18 Years and 65 Years and Over, Miami-Dade County by Municipality, 2000 28
Marital Status of Persons by Sex, 1970, 1980, 1990 and 2000 29
Households and Families by Type, 1980, 1990 and 2000 29
Land Area & Population Density by Acreage & Square Miles, Miami-Dade County by Municipality, 2007 30
Miami-Dade County Public Schools, Enrollment by Grade, 1996-97, 1997-98, 1998-99, 1999-00, 2000-01, 2001-02,
2002-03, 2003-04, 2004-05, 2005-06, 2006-07, and 2007-08
31
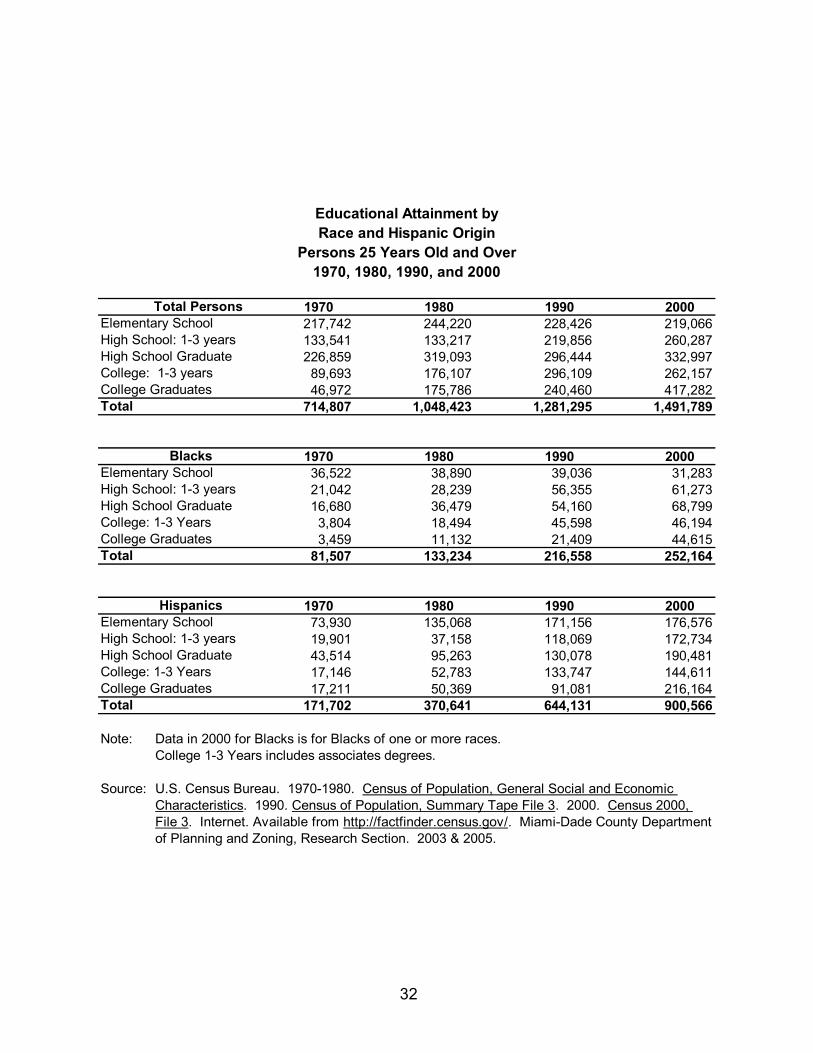
Educational Attainment by Race and Hispanic Origin, Persons 25 Years Old and Over, 1970, 1980, 1990 and 2000 32
II. Housing
Housing Units, 1960, 1970, 1980, 1990 and 2000, Miami-Dade County by Municipality 33
Selected Housing Characteristics, 1960, 1970, 1980, 1990 and 2000, Miami-Dade County, Florida 34
Home Sales - Single Family 1980-2004; Condominiums 1980-2004 35
Existng Unit Sales - Homes 1993-2008; Condominiums 2005-2008 35
Table of Contents
Page 4
III. Labor Force and Employment Page
Nonagricultural Employment by Industry, Miami-Miami Beach-Kendall Metro Division 2003-2007 36
Labor Force Status, Miami-Dade County, Florida 2003-2007 36
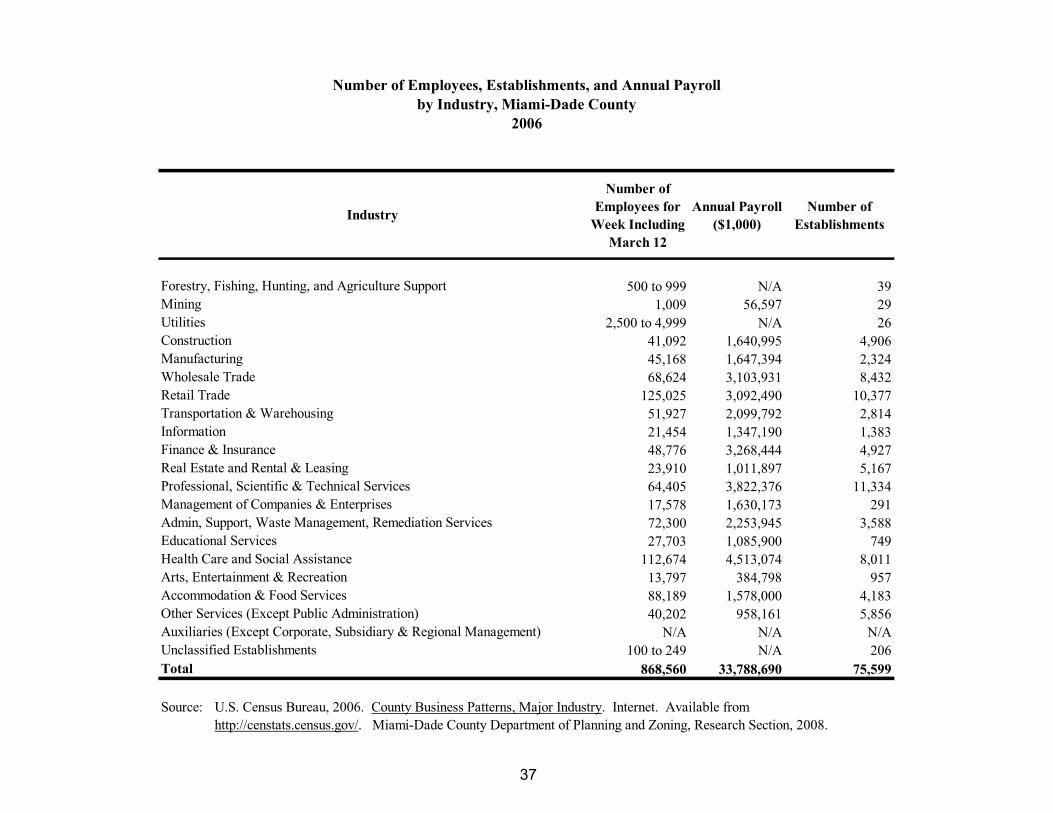
Number of Employees, Establishments, and Annual Payroll by Industry, 2006, Miami-Dade County 37
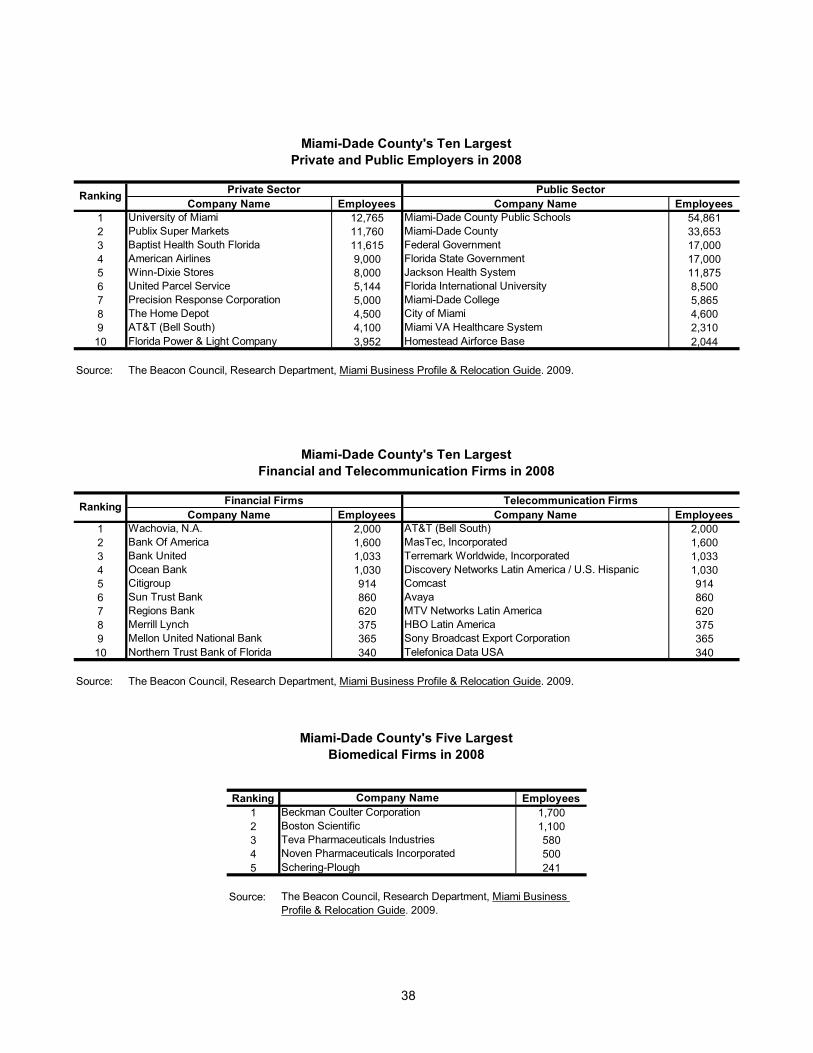
Miami-Dade County's Ten Largest Private and Public Employers in 2008 38
Miami-Dade County's Ten Largest Financial and Telecommunication Firms in 2008 38
Miami-Dade County's Five Largest Biomedical Firms in 2008 38
Employment by Occupation, Miami-Dade County, 1970, 1980, and 1990 39
Employment by Occupation and Gender, Miami-Dade County, 2000 & 2007 39
Employment by Industry, Miami-Dade County, 1970, 1980, and 1990 40
Employment by Industry, Miami-Dade County 2000 & 2007 40
IV. Income
Personal Income by Major Source, 2001 - 2006 41
Earnings by Broad Industrial Sector, 2001 - 2006 41
Income Distribution, Families and Households, 1979, 1989, 1999, and 2007 43
Per Capita Personal Income, 1981-2006 (Current $) 43
V. Other Economic Informaton
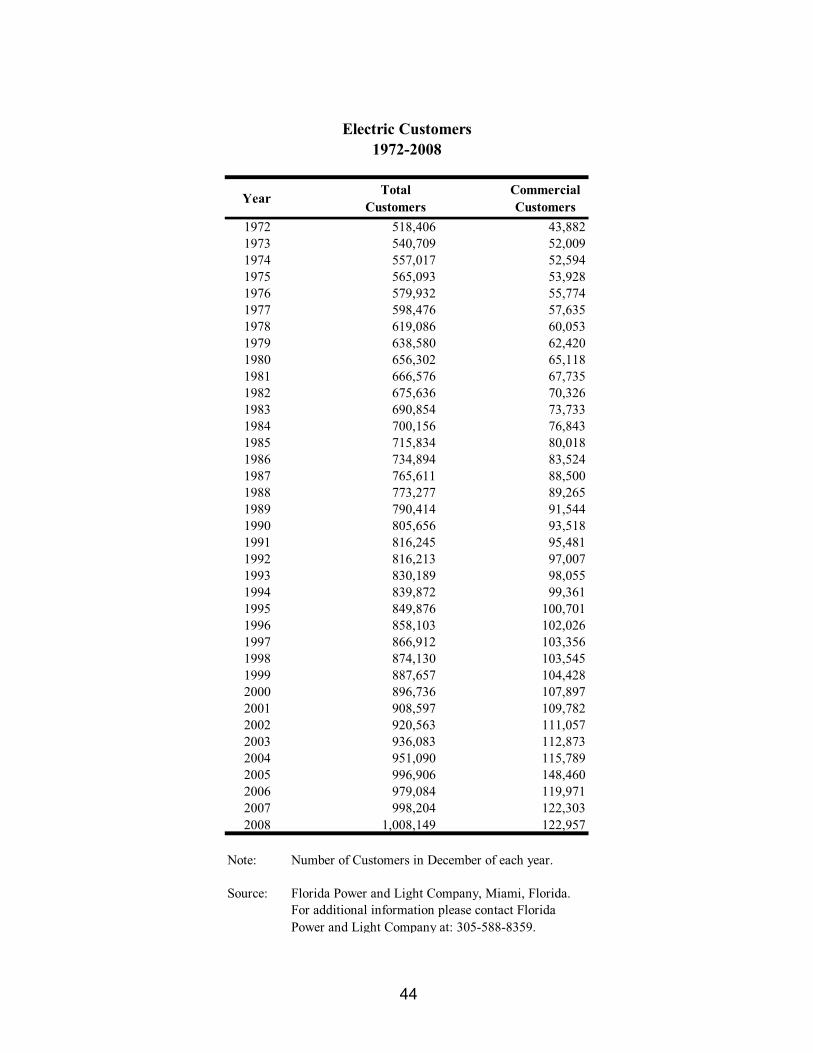
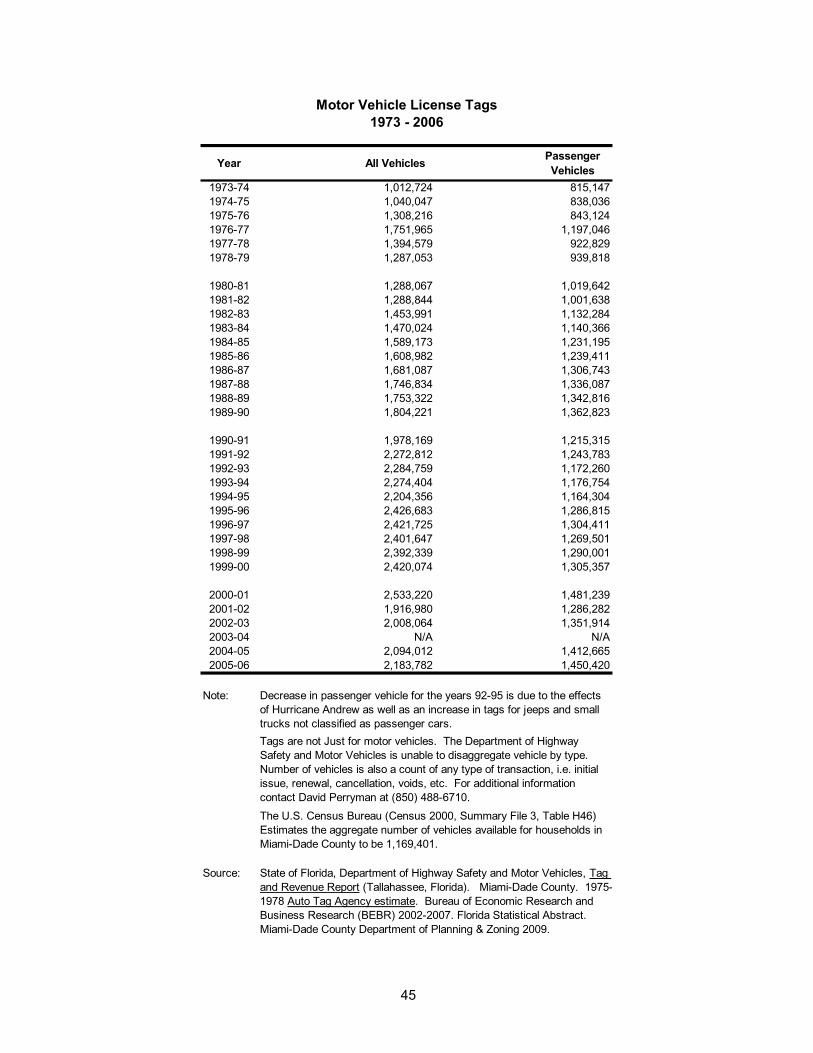
Electric Customers 1972-2008 44
Motor Vehicle License Tags 1973-2006 45
Passenger and Cargo - Port of Miami and Miami International Airport, 1971-2008 46
Florida Price Level Index for Selected Counties, 2003-2008 47
Miami CMSA (Miami-Dade County) Consumer Price Index 1977-2008 48
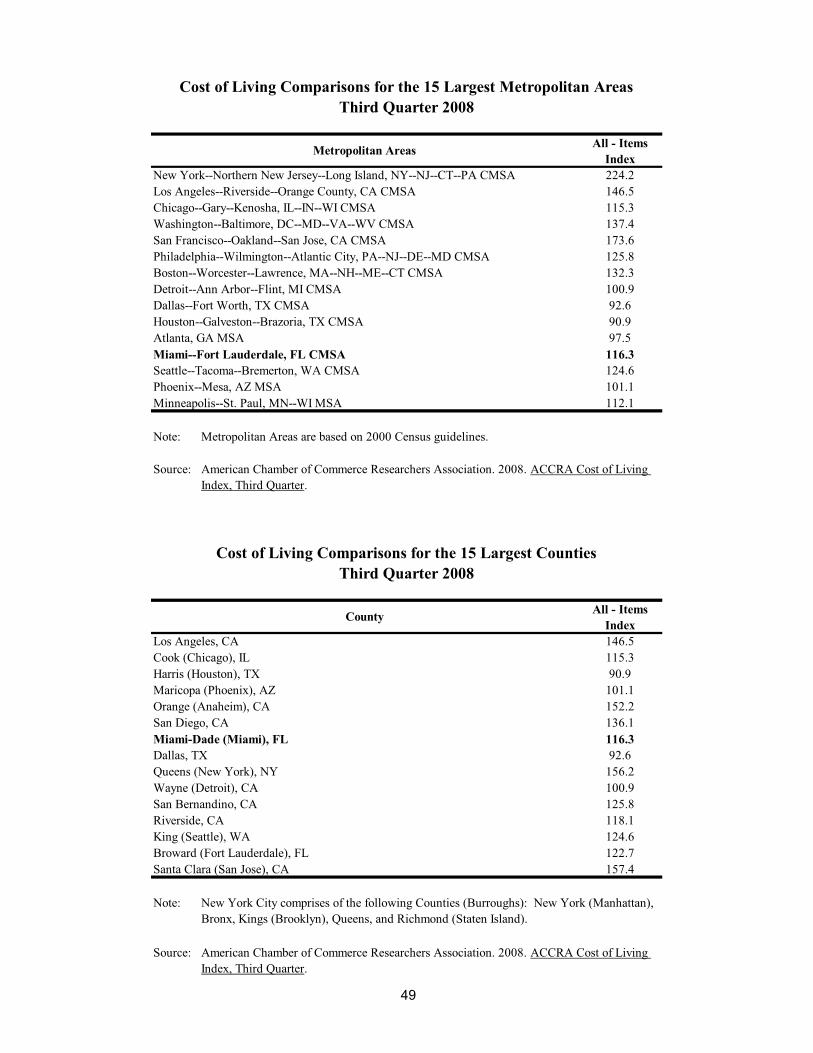
Cost of Living Comparisons for the 15 Largest Metropolitan Areas, Third Quarter 2008 49
Cost of Living Comparisons for the 15 Largest Counties, Third Quarter 2008 49
VI. Other Information
Millages Applicable to Property Tax Assessments for 2008 50
Miami-Dade County Hospitals and Licensed Beds, 2008 51
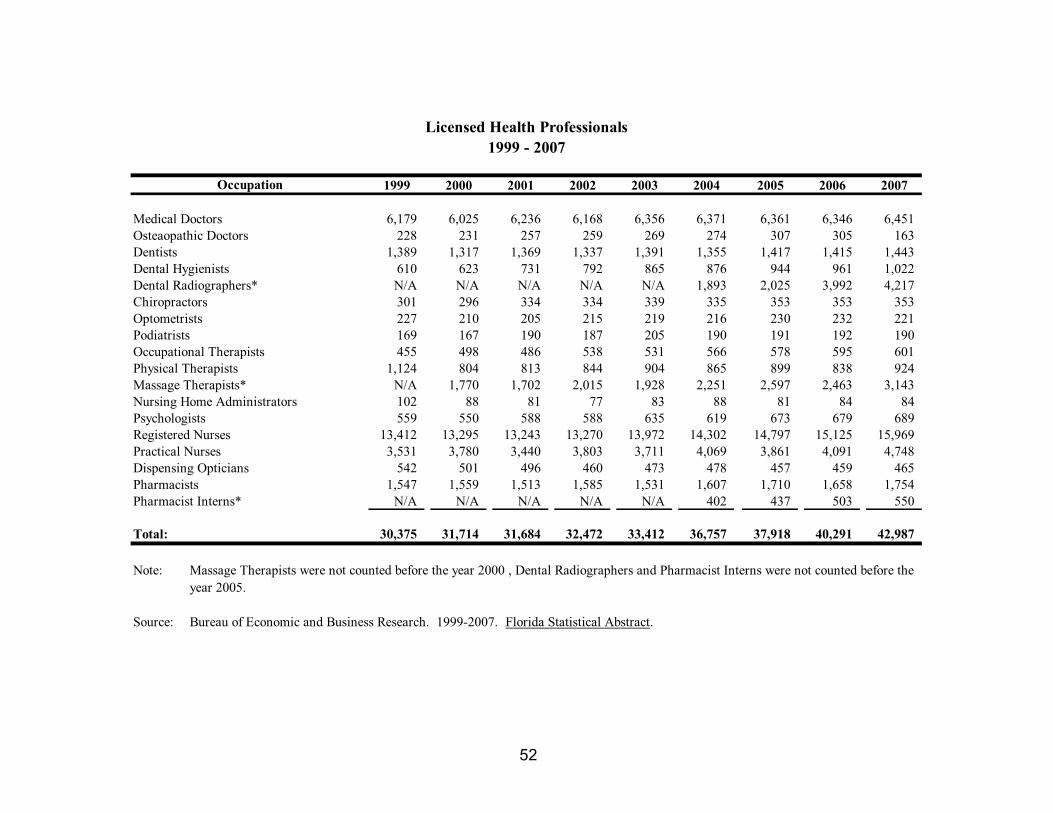
Licensed Health Professionals, 1999 - 2007 52
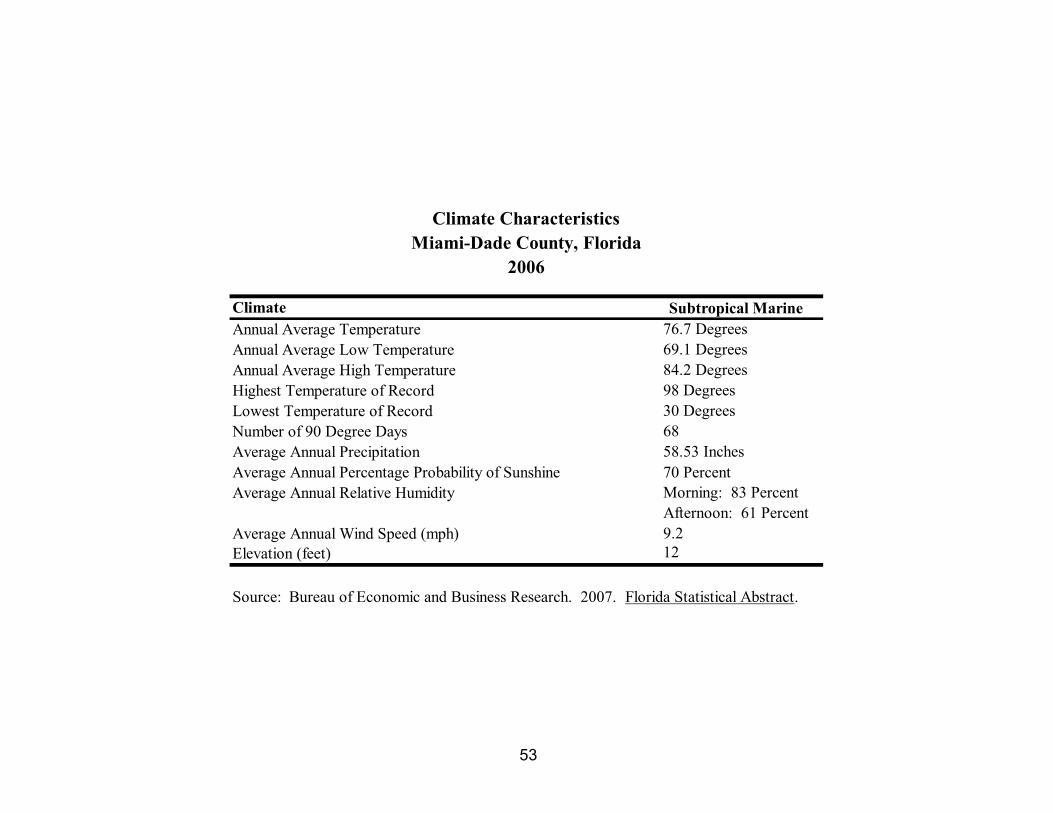
Climate Characteristics, Miami-Dade County, Florida 2006 53
Parks and Recreational Areas, 2009 54
Inventory of Land Uses in Miami-Dade County, Inside and Outside the Urban Development Boundary (UDB), 2004, 2006, and 2008 55
Directory of Federal, State, County, Local and Private Agencies 56
Table of Contents (continued)
Page 5
SR 826 EX
I 95
SR 821 E
T
SW 8TH ST
SW 248TH ST
NW
27
TH
AV
SW 216TH ST
BIS
CA
YN
E B
D
SW 184TH ST
SW
11
7T
H A
V
FLORID
A T
P
SW 88TH ST
SR
821
HY N
W 2
2N
D A
V
SR
27 H
Y
SW
21
7T
H A
V
SW 152ND ST
SW
13
7T
H A
V
NW
7T
H A
V
SW 72ND ST
CO
LL
INS
AV
SW
67
TH
AV
W FLAGLER ST
SR 836 EX
NW
17
TH
AV
SW 264TH ST
SR
874
EX
NW 36TH ST
W O
KEECHOBEE RD
S D
IXIE
HY
I 75 E
X
SW 40TH ST
SW 288TH ST
SW
16
7T
H A
V
I 95 E
X
SW
14
7T
H A
V
SW
18
7T
H A
V
NE
2N
D A
V
ALT
ON
RD
N M
IAM
I AV
SW 24TH ST
SW 200TH ST
SW 328TH ST
NW 183RD ST
PA
LM
AV
SW 112TH STW
4
TH
AV N
W 3
2N
D A
V
SW
16
2N
D A
V
NW 135TH ST
SW
57
TH
AV
SW 272ND ST
NW 167TH ST
N K
RO
ME A
VE
4T
H A
V
E 8
TH
AV
NW 199TH ST
INGRAHAM HY
SW
17
7T
H A
V
NE
6T
H A
V
NE
10
TH
AV
SW 256TH ST
SW
87
TH
AV
NW
11
7T
H A
V
SW
18
2N
D A
V
SW
97
TH
AV
SW 104TH ST
SW
37
TH
AV
NW 58TH ST
NW 25TH ST
SW
77
TH
AV
SW 320TH ST
W 1
2T
H A
V
SW 168TH ST
OLD
CA
RD
SO
UN
D R
D
SW
42
ND
AV
NW
37
TH
AV
NW
67
TH
AV
NW
57
TH
AV
SW 56TH ST
NW 46TH ST
W 1
6T
H A
V
SW
10
2N
D A
V
NW 79TH ST
NW 54TH ST
NW
87
TH
AV
SW 268TH ST
NW 62ND ST
NW
72
ND
AV
NW 103RD ST
W D
IXIE
HY
NE 135TH ST
SW 32ND ST
PORT BD
SW 280TH ST
SW 296TH ST
NW 119TH ST
SR 9 EX
NW
2N
D A
V
W
8T
H A
V
SW 360TH ST
SW 344TH ST
SW
27
TH
AV
SW 80TH ST
SW
72
ND
AV
NW 12TH ST
SW
12
7T
H A
V
SW 26TH ST
SW 144TH ST
NW 191ST ST
SR
821
SW
15
2N
D A
V
NW 175TH ST
NW 20TH ST
PIN
E T
RE
E D
R
NW 28TH ST
SW 304TH ST
NW 215TH ST
SW 232ND ST
NW 186TH ST
SW 1ST ST
SW 48TH ST
JULIA TUTTLE CY
SW
22
ND
AV
SW
14
2N
D A
V
NW
42
ND
AV
SW 128TH STSW 120TH ST
NW 14TH ST
SW
32
ND
AV
NW
10
7T
H A
V
SW
17
TH
AV
NW 106TH ST
SR
821
EX
RIC
KENBACKER C
Y
HA
RD
ING
AV
NW
12
TH
AV
79TH STCY
NW 71ST ST
NW
79
TH
AV
SW
62
ND
AV
NW
77
TH
CT
SW 64TH ST
SW
15
7T
H A
V
SW
11
2T
H A
V
LU
DL
AM
DR
SW
10
7T
H A
V
SW
13
2N
D A
V
SW 312TH ST
112TH HY
GR
AN
AD
A B
D
SW
12
2N
D A
V
SW 18TH ST
SW 96TH ST
LUCY ST
MARLIN RD
SW 16TH ST
SW 160TH ST
CR
AN
DO
N B
D
E 49TH ST
NW 207TH ST
96TH ST
SW 94TH ST
NW 41ST ST
SW
82
ND
AV
SW
92
ND
AV
BRICKELL A
V
NE 215TH ST
OC
EA
N B
D
NW 127TH ST
E 65TH ST
27
TH
HY
NW 173RD DR
EA
ST
DR
JANN AV
NW
92
ND
AV
SE 24TH ST
NW 202ND ST
OL
D C
UT
LE
R R
D
NE 185TH ST
NE 123RD ST
WA
SH
ING
TO
N A
V
E 57TH ST
E PALM DR
NE 8TH ST
W 2
0T
H A
V
GR
IFF
ING
BD
BAILES RD
NW 7TH ST
NW
6
TH
AV
SW 78TH ST
NE 205TH TE
CU
RTIS
S P
Y
SW
19
7T
H A
V
SW
20
2N
D A
V
SW 174TH ST
BY
RO
N A
V
NE 175TH STNW 178TH ST
NE 96TH ST
NW
60
TH
AV
NW 6TH ST
NE 15TH ST
SW
85
TH
AV
SW 240TH ST
SW 211TH ST
NW 74TH ST
SW 376TH ST
63RD ST
SW
145T
H A
V
SW 7TH ST
W 9TH ST
SW 104TH ST
SW 160TH ST
NW
17
TH
AV
FL
OR
IDA
TP
SW
11
7T
H A
V
SW
15
7T
H A
V
SW 344TH ST
SW 120TH ST
SW 8TH ST
NW 6TH ST
SW
12
2N
D A
V
SW 128TH ST
S D
IXIE
HY
NW
57
TH
AV
SW 256TH ST
NW 207TH ST
SW 112TH ST
SW 8TH ST
SW
11
2T
H A
V
NW 215TH ST
SW 328TH ST
SW 320TH ST
SW 328TH ST
SW
19
7T
H A
V
SW 296TH ST
SW 304TH ST
NW
2N
D A
V
SW 280TH ST
SW
15
7T
H A
V
NW 20TH ST
SR
821
ET
GR
AN
AD
A B
D
SW 312TH ST
SW
12
7T
H A
V
I 95 E
X
NW 7TH ST
OL
D C
UT
LE
R R
D
SW
12
2N
D A
V
27
TH
HY
SW 232ND ST
NW
7T
H A
V
/
Department of Planning & Zoning Research Section
November, 2008
0 2 41Miles
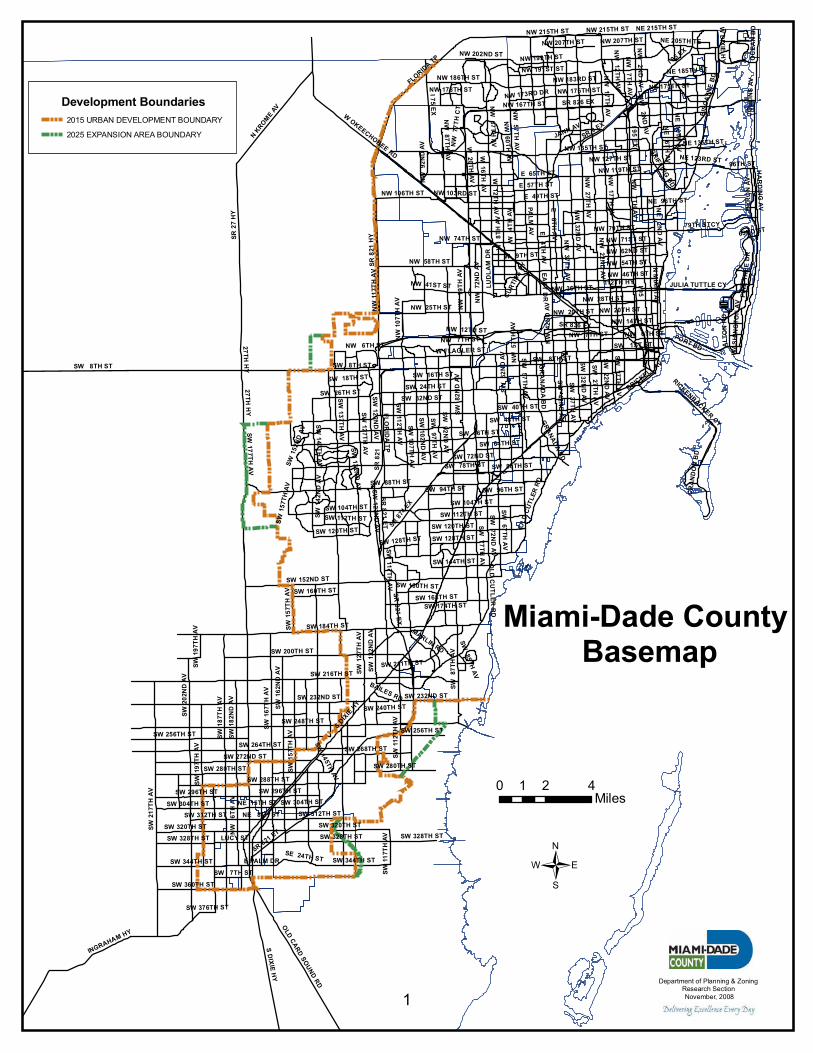
Development Boundaries
2015 URBAN DEVELOPMENT BOUNDARY
2025 EXPANSION AREA BOUNDARY
Miami-Dade County Basemap
1
Page 6
/
Department of Planning & Zoning Research Section November, 2008
0 2 41Miles
1
2
3
4
5
6
7
89
10
11
12
13
Miami-Dade CountyCommission Districts
Barbara J. Jordan Carlos A. Gimenez
District 1 District 7
Dorrin D. Rolle Katy Sorrenson
District 2 District 8
Audrey M. Edmonson Sen. Javier D. Souto
District 3 District 10
Sally A. Heyman Joe A. Martinez
District 4 District 11
Bruno A. Barreiro Jose "Pepe" Diaz, Vice Chair
District 5 District 12
Rebeca Sosa Natacha Seijas
District 6 District 13
County Attorney
Board of County Commissioners
Carlos Alvarez
Mayor
Miami-Dade County
Dennis C. Moss, Chairman
District 9
Harvey Ruvin
Clerk of Courts
George Burgess
County Manager
Murray Greenburg
2
Page 7
SW 8TH ST
SW 72ND ST
FL
OR
IDA
TP
KE
EX
T
NW
27
TH
AV
E
SW 88TH ST
SW 216TH ST
SW
17
7T
H A
VE
SW 184TH ST
SW
11
7T
H A
VE
SW 56TH ST
SW 152ND ST
BIS
CA
YN
E B
LV
D
NW 36TH ST
SW
20
2N
D A
VE
SW
21
7T
H A
VE
W FLAGLER ST
SR
826
EX
T
I 195
SW
67
TH
AV
E
SW 40TH ST
CO
LL
INS
AV
E
W O
KEEC
HO
BEE R
D
NW 12TH ST
SW 264TH ST
SR
874
EXT
SW 200TH ST
SW 288TH ST
NW 7TH ST
SW
57
TH
AV
E
NW
22
ND
AV
E
I 95 E
XP
Y
I 75 E
XT
S D
IXIE
HW
Y
SW 24TH ST
SW
12
7T
H A
VE
NW
17
TH
AV
E
SW
16
7T
H A
VE
SW 272ND ST
SW
14
7T
H A
VE
NW
32
ND
AV
E
SW
19
7T
H A
VE
NW
10
7T
H A
VE
NW 167TH ST
NW 183RD ST
N M
IAM
I AV
E
NW 135TH ST
OLD
CU
TL
ER
RD
W 4
TH
AV
E
SW 104TH ST
SW
15
7T
H A
VE
NW 199TH ST
SW 344TH ST
PA
LM
AV
E
E 4
TH
AV
E
E 8
TH
AV
E
SW 328TH ST
SR 9
NW 58TH ST
N K
RO
ME A
VE
NW 25TH ST
SW
87
TH
AV
E
KR
OM
E A
VE
NW
37
TH
AV
E
NE
6T
H A
VE
SR 878
SW
CA
RD
SO
UN
D R
D
SW
97
TH
AV
E
SW
18
2N
D A
VE
ALT
ON
RD
SW
92
ND
AV
E
SW 168TH ST
SW 42ND ST
W 1
2T
H A
VE
SW
11
2T
H A
VE
NW 46TH ST
NW 54TH ST
NW 62ND ST
SW 280TH ST
SR 836 EXT
SW 268TH ST
NW
57
TH
AV
E
NW
67
TH
AV
E
SW 232ND ST
W 1
6T
H A
VE
NE 135TH ST
SW 32ND ST
NW
47
TH
AV
E
SW 47TH ST
SW 296TH ST
NW 119TH ST
SW
77
TH
AV
E
SW 7TH ST
SR 934
GR
AN
AD
A B
LV
D
SW
72
ND
AV
E
GRATIGNY PKWY
NW 186TH ST
NW
72
ND
AV
E
SW
13
7T
H A
VE
SW 144TH ST
NW 191ST ST
NW 154TH ST
NW 175TH ST
SW
27
TH
AV
E
SW 1ST ST
PIN
E T
RE
E D
R
NW 28TH ST
W D
IXIE
HW
Y
NW
2N
D A
VE
SW 26TH ST
SW 304TH ST
NW 215TH ST
SW
37
TH
AV
E
SW
19
2N
D A
VE
SW 120TH ST
SW
62
ND
AV
E
NW 14TH ST
SW
22
ND
AV
E
SW 248TH ST
PORT BLVD
NE 79TH ST
SW 16TH ST
NW
11
4T
H A
VE
W 2
8T
H A
VE
INGRAHAM HWY
LU
DL
AM
DR
SW 18TH ST
S MIA
MI A
VE
CARIB
BEAN B
LVD
SW 256TH ST
SW
32
ND
AV
E
SW 320TH ST
HA
RD
ING
AV
E
SW 160TH ST
SW 392ND ST
E 49TH ST
SW
13
2N
D A
VE
NE 125TH ST
SW
10
7T
H A
VE
SW 96TH ST
W 8
TH
AV
E
NW 143RD ST
SW 112TH ST
SW 3
RD AVE
NW 207TH ST
SW 94TH ST
SW 80TH ST
NW 90TH ST
NE
15T
H A
VE
ME
RID
IAN
AV
E
SW
42
ND
AV
E
NW
42
ND
AV
E
CR
AN
DO
N B
LV
D
NE 215TH ST
NW 127TH ST
NW 6TH ST
NW
6T
H A
VE
NW 21ST ST
SW 376TH ST
I 95
EXT
NW 138TH ST
SW
18
7T
H A
VE
SW
20
7T
H A
VE
E 57TH ST
SR 836 EXPY
NE 8TH ST
NW N RIVER DR
LE
NA
PE
DR
SW
16
2N
D A
VE
JANN AVE
SW 186TH ST
I 395 EXPY
W PALM DR
W 2
4T
H A
VE
NW 74TH ST
W 2
0T
H A
VE
DEE
R R
UN
NW 103RD STNW 106TH ST
NE
18T
H A
VE
SW 220TH ST
E MOWRY DR
NW 202ND ST
NW
13
7T
H A
VE
SW 47TH TER
SW
12
2N
D A
VE
NE 199TH ST
BY
RO
N A
VE
NE 183RD ST
NW 203RD ST
W 9TH ST
63RD ST
SW
82
ND
AV
E
NE
2N
D A
VE
SE
12T
H A
VE
E PALM DR
SW
15
2N
D A
VE
SW
14
2N
D A
VE
SW 174TH ST
SW 360TH ST
SW 6TH ST
NW
7T
H A
VE
SW
10
2N
D A
VE
NE
10T
H A
VE
SW 160TH ST
OLD
CU
TL
ER
RD
SW 328TH ST
NE
6T
H A
VE
SW 88TH ST
W 4
TH
AV
E
SW 7TH ST
SW
87
TH
AV
E
SW 280TH ST
SW
19
7T
H A
VE
SW 344TH ST
SW
12
2N
D A
VE
SW 320TH ST
SW
82
ND
AV
E
SW
13
7T
H A
VE
SW
10
7T
H A
VE
SW 328TH ST SW 328TH ST
SW 200TH ST
SW 112TH ST
SW 104TH ST
SW 16TH ST
NW 215TH ST
S D
IXIE
HW
Y
SW
13
7T
H A
VE
SW
16
7T
H A
VE
NW 7TH ST
SW
37
TH
AV
E
W 8
TH
AV
E
NE
2N
D A
VE
SW 112TH ST
SW 96TH ST
S M
IAM
I AV
E
SW
10
2N
D A
VE
SW 232ND ST
SW
15
7T
H A
VE
SW
15
7T
H A
VE
SW
12
7T
H A
VE
SR
826
EX
T
SW 280TH ST
KR
OM
E A
VE
SW
13
7T
H A
VE
SW
72
ND
AV
E
/
Department of Planning & Zoning Research Section
November, 2008
0 2 41Miles
1
2
3
4
5
35
34
33
26
6
7
8
910
11
12
13
14
15
16
17
18
19
20
21
22
23
24
25
27
28
29
30
31
32
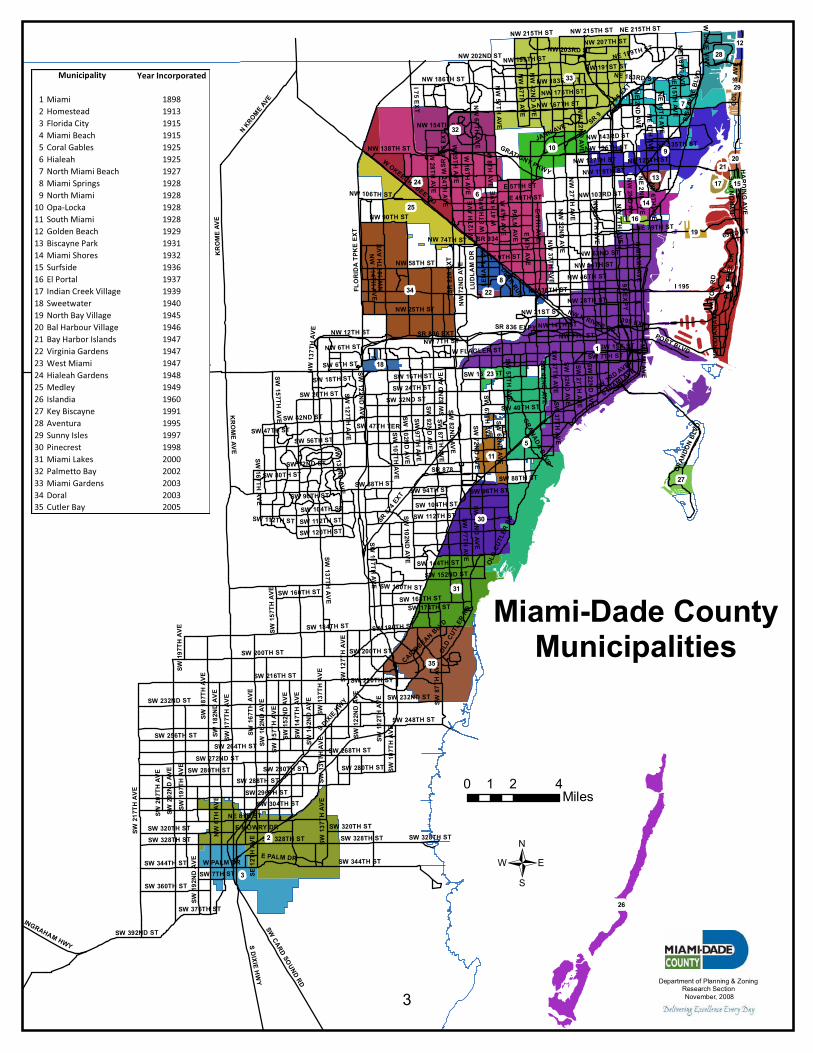
Miami-Dade CountyMunicipalities
Year Incorporated
1 Miami 1898
2 Homestead 1913
3 Florida City 1915
4 Miami Beach 1915
5 Coral Gables 1925
6 Hialeah 1925
7 North Miami Beach 1927
8 Miami Springs 1928
9 North Miami 1928
10 Opa-Locka 1928
11 South Miami 1928
12 Golden Beach 1929
13 Biscayne Park 1931
14 Miami Shores 1932
15 Surfside 1936
16 El Portal 1937
17 Indian Creek Village 1939
18 Sweetwater 1940
19 North Bay Village 1945
20 Bal Harbour Village 1946
21 Bay Harbor Islands 1947
22 Virginia Gardens 1947
23 West Miami 1947
24 Hialeah Gardens 1948
25 Medley 1949
26 Islandia 1960
27 Key Biscayne 1991
28 Aventura 1995
29 Sunny Isles 1997
30 Pinecrest 1998
31 Miami Lakes 2000
32 Palmetto Bay 2002
33 Miami Gardens 2003
34 Doral 2003
35 Cutler Bay 2005
Municipality
3
Page 8
SW 8TH ST
S D
IXIE
HW
Y
FL
OR
IDA
TP
KE
EX
T
NW
27T
H A
VE
SW
177
TH
AV
E
BIS
CA
YN
E B
LV
D
SR
82
6 E
XT
INGRAHAM HWY
CO
LL
INS
AV
E
W O
KEEC
HO
BEE R
D
I 195
SR
874 E
XT
SW
CA
RD
SO
UN
D R
D
I 95
EX
PY
I 75
EX
T
SR 836 EXT
N K
RO
ME A
VE
KR
OM
E A
VE
SR
9
SR 878
NW 36TH STSR 112
NW 119TH ST
GRATIGNY PKWY
NW
2N
D A
VE
SW
27T
H A
VE
SW 392ND ST
SW
192
ND
AV
E
ALT
ON
RD
96TH ST
BR
ICK
ELL A
VE
NE 79TH ST
SR 836 EXPY
NW 215TH ST
S D
IXIE
HW
Y
KR
OM
E A
VE
SR 826 EXT
I 95
EX
PY
N K
RO
ME
AV
E
CO
LL
INS
AV
E
Section I:
Population
Miami-Dade County Facts
Page 9
Miami 1,681 5,471 29,571 110,637 172,172 249,276 259,035 291,688 330,050 334,859 350,865 346,446 380,446 358,548 364,075 362,470 386,882 395,434
Homestead ----- ----- 1,307 2,319 3,154 4,573 6,848 9,152 11,160 13,674 20,322 20,668 22,179 26,866 30,712 31,909 38,396 57,605
Florida City ----- ----- 355 452 753 1,547 3,037 4,114 5,770 5,133 5,365 6,174 6,315 5,806 6,290 7,843 8,787 9,318
Miami Beach ----- ----- 644 6,494 28,012 46,282 50,981 63,145 81,030 87,072 90,391 96,298 96,913 92,639 93,366 87,933 93,535 93,721
Coral Gables ----- ----- ----- 5,697 8,294 19,837 29,210 34,793 39,850 42,494 43,908 43,241 42,281 40,091 40,973 42,249 44,561 44,604
Hialeah ----- ----- ----- 2,600 3,958 19,676 43,135 66,972 84,450 102,452 125,051 145,254 158,796 188,004 195,750 226,419 230,407 228,528
Miami Springs ----- ----- ----- 402 998 5,108 10,138 11,229 13,400 13,279 13,339 12,350 12,053 13,268 13,226 13,712 13,824 13,643
Opa-Locka ----- ----- ----- 339 497 5,271 9,392 9,810 10,590 11,902 13,715 14,460 14,658 15,283 15,454 14,951 15,439 15,359
South Miami ----- ----- ----- 1,160 2,408 4,809 7,600 9,846 11,410 11,780 11,959 10,944 10,742 10,404 10,514 10,741 10,578 10,561
North Miami ----- ----- ----- ----- 1,978 10,734 23,463 28,708 35,500 34,767 44,473 42,566 42,575 49,998 51,973 59,880 60,312 60,275
North Miami Beach ----- ----- ----- 520 871 2,129 12,161 21,405 26,950 30,544 36,491 36,553 36,381 35,359 36,227 40,786 41,131 40,942
Golden Beach ----- ----- ----- 36 83 156 249 413 490 849 893 612 627 774 800 919 963 951
Biscayne Park ----- ----- ----- ----- 500 2,009 2,833 2,911 3,090 2,717 2,767 3,088 3,070 3,068 3,190 3,269 3,328 3,328
Miami Shores Village ----- ----- ----- 612 1,956 5,086 7,839 8,865 10,000 9,425 9,617 9,244 9,100 10,084 10,442 10,380 10,486 10,323
Surfside ----- ----- ----- ----- 295 1,852 2,592 3,157 4,320 3,614 3,891 3,763 3,943 4,108 4,170 4,909 5,614 5,775
El Portal ----- ----- ----- ----- 365 1,371 1,994 2,079 2,150 2,068 2,150 2,055 1,985 2,457 2,506 2,505 2,539 2,523
Indian Creek Village ----- ----- ----- ----- 35 44 56 60 70 82 89 103 107 44 45 33 56 59
Sweetwater ----- ----- ----- ----- ----- 230 327 645 1,050 3,357 6,570 8,251 9,515 13,909 14,717 14,226 14,373 14,326
North Bay Village ----- ----- ----- ----- ----- 198 1,247 2,006 4,220 4,831 4,536 4,920 4,703 5,383 5,535 6,733 6,498 5,736
Bal Harbour ----- ----- ----- ----- ----- 325 334 727 1,160 2,038 2,118 2,973 3,012 3,045 3,091 3,305 3,185 3,058
West Miami ----- ----- ----- ----- ----- 4,043 5,158 5,296 5,770 5,494 6,022 6,076 5,904 5,727 5,751 5,863 5,844 5,724
Bay Harbor Island ----- ----- ----- ----- ----- 520 1,716 3,249 4,540 4,619 4,700 4,869 4,845 4,703 4,774 5,146 5,212 5,148
Virginia Gardens ----- ----- ----- ----- ----- 235 1,554 2,159 2,530 2,524 2,612 2,098 2,166 2,212 2,197 2,348 2,366 2,354
Hialeah Gardens ----- ----- ----- ----- ----- ----- 188 172 210 492 1,103 2,700 5,443 7,713 9,412 19,297 20,523 20,491
Medley ----- ----- ----- ----- ----- 106 132 112 200 351 572 537 540 663 711 1,098 1,132 1,132
Islandia ----- ----- ----- ----- ----- ----- ----- ----- 30 8 8 12 12 13 16 6 6 6
Key Biscayne ----- ----- ----- ----- ----- ----- ----- ----- ----- ----- ----- ----- ----- ----- 9,333 10,507 11,425 11,433
Aventura ----- ----- ----- ----- ----- ----- ----- ----- ----- ----- ----- ----- ----- ----- ----- 25,267 28,500 30,383
Pinecrest ----- ----- ----- ----- ----- ----- ----- ----- ----- ----- ----- ----- ----- ----- ----- 19,055 19,460 19,382
Sunny Isles Beach ----- ----- ----- ----- ----- ----- ----- ----- ----- ----- ----- ----- ----- ----- ----- 15,315 16,703 18,747
Miami Lakes ----- ----- ----- ----- ----- ----- ----- ----- ----- ----- ----- ----- ----- ----- ----- 22,676 24,741 27,027
Palmetto Bay ----- ----- ----- ----- ----- ----- ----- ----- ----- ----- ----- ----- ----- ----- ----- 23,801 24,795 25,156
Miami Gardens ----- ----- ----- ----- ----- ----- ----- ----- ----- ----- ----- ----- ----- ----- ----- 100,809 105,457 109,200
Doral ----- ----- ----- ----- ----- ----- ----- ----- ----- ----- ----- ----- ----- ----- ----- 21,000 30,331 34,472
Cutler Bay ----- ----- ----- ----- ----- ----- ----- ----- ----- ----- ----- ----- ----- ----- ----- 30,315 30,315 40,468
Unincorporated 3,274 6,462 10,876 11,687 41,410 109,667 222,558 352,334 455,420 537,367 634,466 799,526 880,940 1,036,925 1,078,571 1,005,687 1,104,371 1,095,100
County Total 4,955 11,933 42,753 142,955 267,739 495,084 703,777 935,047 1,145,410 1,267,792 1,437,993 1,625,781 1,759,251 1,937,094 2,013,821 2,253,362 2,422,075 2,462,292
Note:
Source:
1991
1995
1996
1997
2000
Miami Lakes incorporated in December, 2000. Palmetto Bay incorporated in September, 2002. Miami Gardens incorporated in May 2003. Doral incorporated in June 2003. Cutler Bay Incorporated in November 2005.
State of Florida, Census 1955. University of Florida, Bureau of Economic and Business Research, 1966, 1975, 1985, 1995, 2005, and 2007. U.S. Census Bureau; 1900-1990 Decennial Census, Census of Population, General Population Characteristics; Census 2000, Summary
File 1; generated by Miami-Dade County Department of Planning and Zoning, Research Section, 2009.
2002
2003
2003
2005
1937
1949
1960
1939
1940
1945
1946
1947
1947
1947
1948
1927
1929
1931
1932
1935
1925
1926
1926
1926
1926
1896
1913
1915
1915
1925
20071980 1985 1990 1995 2000
Resident Population, Miami-Dade County Florida
by Municipality, 1900-2007
1940 1950 1955 1960 1965 1970 1975Year
IncorporatedMunicipality 1900 1910 1920 1930 2005
4
Page 10
Resident
PopulationChange
Annual
Percent
Change
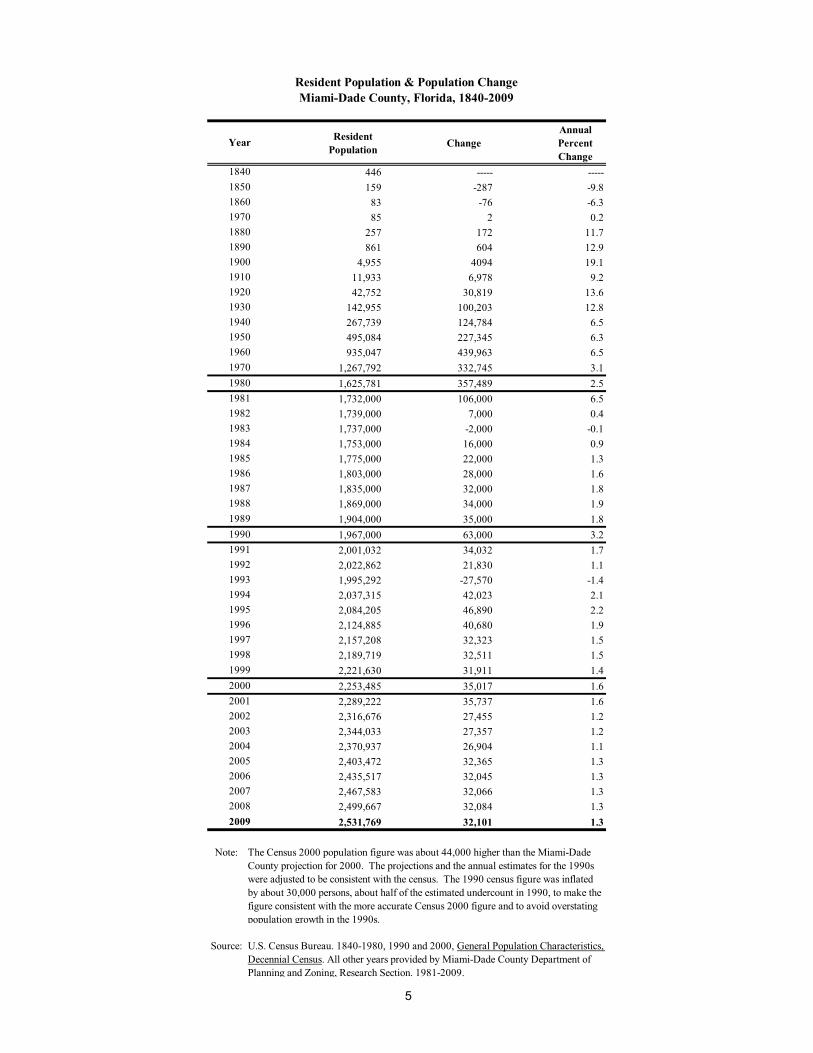
446 ----- -----
159 -287 -9.8
83 -76 -6.3
85 2 0.2
257 172 11.7
861 604 12.9
4,955 4094 19.1
11,933 6,978 9.2
42,752 30,819 13.6
142,955 100,203 12.8
267,739 124,784 6.5
495,084 227,345 6.3
935,047 439,963 6.5
1,267,792 332,745 3.1
1,625,781 357,489 2.5
1,732,000 106,000 6.5
1,739,000 7,000 0.4
1,737,000 -2,000 -0.1
1,753,000 16,000 0.9
1,775,000 22,000 1.3
1,803,000 28,000 1.6
1,835,000 32,000 1.8
1,869,000 34,000 1.9
1,904,000 35,000 1.8
1,967,000 63,000 3.2
2,001,032 34,032 1.7
2,022,862 21,830 1.1
1,995,292 -27,570 -1.4
2,037,315 42,023 2.1
2,084,205 46,890 2.2
2,124,885 40,680 1.9
2,157,208 32,323 1.5
2,189,719 32,511 1.5
2,221,630 31,911 1.4
2,253,485 35,017 1.6
2,289,222 35,737 1.6
2,316,676 27,455 1.2
2,344,033 27,357 1.2
2,370,937 26,904 1.1
2,403,472 32,365 1.3
2,435,517 32,045 1.3
2,467,583 32,066 1.3
2,499,667 32,084 1.3
2,531,769 32,101 1.3
Note:
Source:
1992
1993
1994
1995
1996
1997
1998
1999
2000
2001
2009
The Census 2000 population figure was about 44,000 higher than the Miami-Dade
County projection for 2000. The projections and the annual estimates for the 1990s
were adjusted to be consistent with the census. The 1990 census figure was inflated
by about 30,000 persons, about half of the estimated undercount in 1990, to make the
figure consistent with the more accurate Census 2000 figure and to avoid overstating
population growth in the 1990s.
U.S. Census Bureau. 1840-1980, 1990 and 2000, General Population Characteristics,
Decennial Census. All other years provided by Miami-Dade County Department of
Planning and Zoning, Research Section. 1981-2009.
2002
2003
2004
2005
2006
2007
2008
1988
1989
1990
1991
1982
1983
1984
1985
1986
1987
1950
1960
1970
1980
1981
Resident Population & Population Change
Miami-Dade County, Florida, 1840-2009
1910
1920
1930
1850
1840
Year
1940
1860
1970
1880
1890
1900
5
Page 11
Resident
Population
Population
ChangeNet Migration
Natural
Increase
Resident
Births
Resident
Deaths
Net
Immigration
Domestic
Migration
1,967,000 29,310 14,660 14,650 33,180 18,530 22,440 -7,780
2,001,032 34,032 17,844 16,188 34,242 18,054 22,690 -4,846
2,022,862 21,830 6,462 15,368 33,304 17,936 12,147 -5,685
1,995,292 -27,570 -41,971 14,401 32,846 18,445 3,426 -45,397
2,037,315 42,023 27,677 14,346 33,030 18,684 39,690 -12,013
2,084,205 46,889 32,712 14,177 32,707 18,530 50,690 -17,978
2,124,885 40,680 27,663 13,017 32,028 19,011 44,690 -17,027
2,157,208 32,323 19,074 13,249 31,708 18,459 38,690 -19,616
2,189,719 32,511 19,523 12,988 31,384 18,396 36,511 -16,988
2,221,630 31,911 19,038 12,873 31,594 18,721 36,524 -17,486
2,253,485 35,017 21,183 13,834 32,300 18,466 45,905 -24,722
2,289,222 35,737 22,354 13,383 32,425 19,042 45,824 -23,470
2,316,676 27,455 13,508 13,947 32,131 18,184 40,302 -26,794
2,344,033 27,357 13,175 14,182 32,551 18,369 36,479 -23,304
2,370,937 26,904 13,212 13,692 32,045 18,353 38,663 -25,451
2,403,472 32,365 18,534 14,001 32,365 18,364 38,723 -20,189
2,435,517 32,045 17,306 14,545 35,104 20,559 41,171 -23,864
2,467,583 32,066 17,210 15,128 35,855 20,727 41,747 -24,537
2,499,667 32,084 17,114 14,778 35,669 20,891 42,323 -25,209
2,531,769 32,101 17,018 14,892 35,945 21,053 42,899 -25,881
2,563,885 32,116 16,922 15,004 36,216 21,212 43,476 -26,554
2,596,014 32,129 16,826 15,114 36,483 21,369 44,052 -27,226
2,628,155 32,140 16,730 15,222 36,744 21,522 44,628 -27,898
2,660,304 32,150 16,634 15,328 37,002 21,673 45,204 -28,571
2,692,461 32,157 16,538 15,432 37,254 21,822 45,781 -29,243
2,724,623 32,162 16,442 15,535 37,502 21,967 46,357 -29,915
2,756,788 32,165 16,345 15,635 37,745 22,110 46,933 -30,588
2,788,954 32,166 16,249 15,733 37,983 22,250 47,509 -31,260
2,821,119 32,165 16,153 15,829 38,216 22,387 48,085 -31,932
2,853,282 32,162 16,057 15,924 38,445 22,521 48,662 -32,604
2,885,439 32,158 15,961 16,016 38,669 22,653 49,238 -33,277
2,917,590 32,151 15,865 16,106 38,887 22,781 49,814 -33,949
2,949,731 32,142 15,769 16,194 39,101 22,907 50,390 -34,621
2,981,861 32,130 15,673 16,280 39,310 23,030 50,967 -35,294
3,013,979 32,117 15,577 16,364 39,514 23,150 51,543 -35,966
3,046,081 32,102 15,481 16,446 39,713 23,267 52,119 -36,638
3,078,165 32,084 15,385 16,526 39,906 23,381 52,695 -37,311
3,110,230 32,065 15,289 16,603 40,095 23,492 53,271 -37,983
3,142,273 32,043 15,192 16,679 40,279 23,600 53,848 -38,655
3,174,293 32,020 15,096 16,752 40,458 23,705 54,424 -39,328
3,206,287 31,994 15,000 16,824 40,631 23,807 55,000 -40,000
33,295 25,511 7,784 18,451 10,667 NA NA
35,800 32,025 3,775 18,311 14,536 NA NA
30,731 20,163 10,568 27,882 17,314 36,717 -13,423
28,648 14,712 13,936 32,452 18,516 32,213 -17,501
31,023 16,635 14,355 34,031 19,675 41,161 -24,525
32,155 16,394 15,577 37,604 22,027 46,645 -30,251
32,085 15,433 16,477 39,789 23,312 52,407 -36,974
Note:
Source:
Population Projections
Components of Change
Miami-Dade County, Florida, 1990 to 2030
Ten-Year Annual Average Change, 1961 to 2020
1996
1997
1998
1999
2026
2027
2028
2029
2030
Year Ending
March 31
2006
2007
1990 population was adjusted for undercount.
U.S. Census Bureau, 1960-2000, Decennial Census. Post 2000 figures provided by Miami-Dade County Planning & Zoning Department,
Research Section. 2007.
1990
1991
1992
1993
1994
1995
2011-2020
2011
2000
2001
2002
2003
2004
2005
2008
2009
2010
2023
2012
2013
2014
2015
2016
2017
2018
2019
2020
2021
2022
1991-2000
2001-2010
2021-2030
2024
2025
Decade
1961-1970
1971-1980
1981-1990
6
Page 12
Number Per 1,000 Number Per 1,000
20,086 15.6 13,206 10.2
19,353 14.5 13,872 10.4
17,639 12.7 14,596 10.5
17,643 12.3 14,030 9.8
17,390 11.9 14,570 10.0
16,468 11.2 14,500 9.8
17,310 11.5 14,138 9.4
17,818 11.6 14,988 9.8
18,749 12.0 15,204 9.7
20,653 12.8 16,251 10.1
22,796 13.6 17,239 10.3
24,508 14.1 16,505 9.5
25,650 14.8 16,665 9.6
26,405 15.1 16,470 9.4
26,962 15.3 17,229 9.8
28,344 15.8 17,073 9.5
29,477 16.2 17,359 9.5
32,148 17.4 18,243 9.9
33,330 17.7 18,704 9.9
34,423 17.8 18,191 9.4
33,481 16.9 17,806 9.0
32,772 16.3 18,324 9.1
33,069 16.5 18,808 9.4
32,913 16.3 18,313 9.1
32,089 15.6 19,181 9.3
31,843 15.1 18,501 8.8
31,302 14.6 18,333 8.6
31,631 14.6 18,583 8.5
31,484 14.3 19,133 8.7
32,300 14.4 18,466 8.3
32,425 14.1 19,042 8.3
32,131 13.8 18,184 7.8
32,551 13.8 18,369 7.8
32,045 13.4 18,353 7.7
32,365 13.3 18,364 7.6
33,739 13.8 18,210 7.5
34,286 13.9 17,949 7.3
18,311 18.0 14,536 14.2
28,404 22.2 17,368 13.8
32,288 15.5 18,545 8.9
32,792 13.7 18,353 7.7
Note:
Source:
Figures for 1971 to 1987 are for fiscal years ending March 31. Figures for
1988 to 2006 are for calendar years.
The rates are based on midyear population estimates by Miami-Dade County
Department of Planning and Zoning. Annual average rates for the four time
periods are means of the annual rates.
Florida of Health, Office of Vital Statistics. 1996-2007. Vital Statistics
Report. Internet. Available from http://www.doh.state.fl.us/. Statistics ans
quarterly data also taken from Vital News and Quarterly Vital Statistics
Report. Miami-Dade County Department of Planning & Zoning, Research
Section, 2009.
1971
1972
1973
1974
Annual Average
1975
1976
1977
1978
1979
1980
1981
1982
Births And Deaths
Miami-Dade County, Florida
1971- 2007
Births Deaths
1983
1984
1985
1986
1987
1988
1989
1998
1999
1990
1991
1992
1993
1994
1991-2000
2000-2007
Year
2005
2006
2007
1971-1980
1981-1990
2000
2001
2002
2003
2004
1995
1996
1997
7
Page 13
White Black
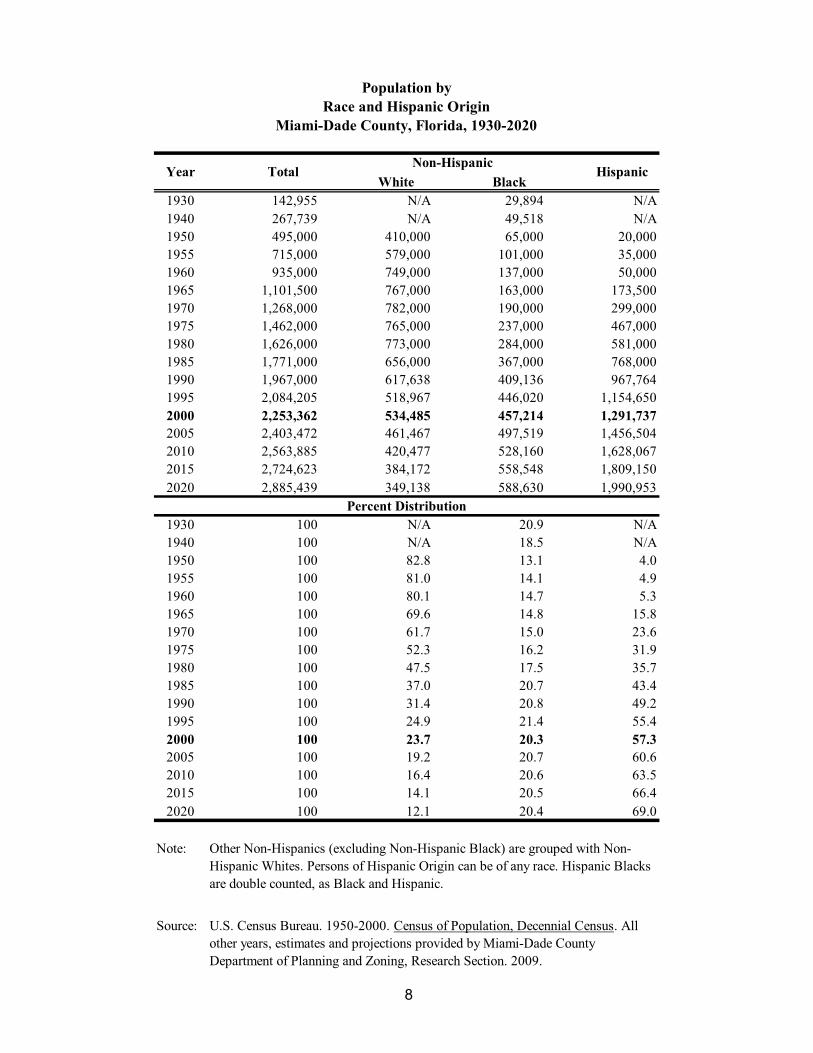
1930 142,955 N/A 29,894 N/A
1940 267,739 N/A 49,518 N/A
1950 495,000 410,000 65,000 20,000
1955 715,000 579,000 101,000 35,000
1960 935,000 749,000 137,000 50,000
1965 1,101,500 767,000 163,000 173,500
1970 1,268,000 782,000 190,000 299,000
1975 1,462,000 765,000 237,000 467,000
1980 1,626,000 773,000 284,000 581,000
1985 1,771,000 656,000 367,000 768,000
1990 1,967,000 617,638 409,136 967,764
1995 2,084,205 518,967 446,020 1,154,650
2000 2,253,362 534,485 457,214 1,291,737
2005 2,403,472 461,467 497,519 1,456,504
2010 2,563,885 420,477 528,160 1,628,067
2015 2,724,623 384,172 558,548 1,809,150
2020 2,885,439 349,138 588,630 1,990,953
1930 100 N/A 20.9 N/A
1940 100 N/A 18.5 N/A
1950 100 82.8 13.1 4.0
1955 100 81.0 14.1 4.9
1960 100 80.1 14.7 5.3
1965 100 69.6 14.8 15.8
1970 100 61.7 15.0 23.6
1975 100 52.3 16.2 31.9
1980 100 47.5 17.5 35.7
1985 100 37.0 20.7 43.4
1990 100 31.4 20.8 49.2
1995 100 24.9 21.4 55.4
2000 100 23.7 20.3 57.3
2005 100 19.2 20.7 60.6
2010 100 16.4 20.6 63.5
2015 100 14.1 20.5 66.4
2020 100 12.1 20.4 69.0
Note:
Source:
Other Non-Hispanics (excluding Non-Hispanic Black) are grouped with Non-
Hispanic Whites. Persons of Hispanic Origin can be of any race. Hispanic Blacks
are double counted, as Black and Hispanic.
U.S. Census Bureau. 1950-2000. Census of Population, Decennial Census. All
other years, estimates and projections provided by Miami-Dade County
Department of Planning and Zoning, Research Section. 2009.
Percent Distribution
Non-Hispanic
Population by
Race and Hispanic Origin
Miami-Dade County, Florida, 1930-2020
Year Total Hispanic
8
Page 14
Total HispanicBlack Non-
Hispanic
White & Other
Non-Hispanic
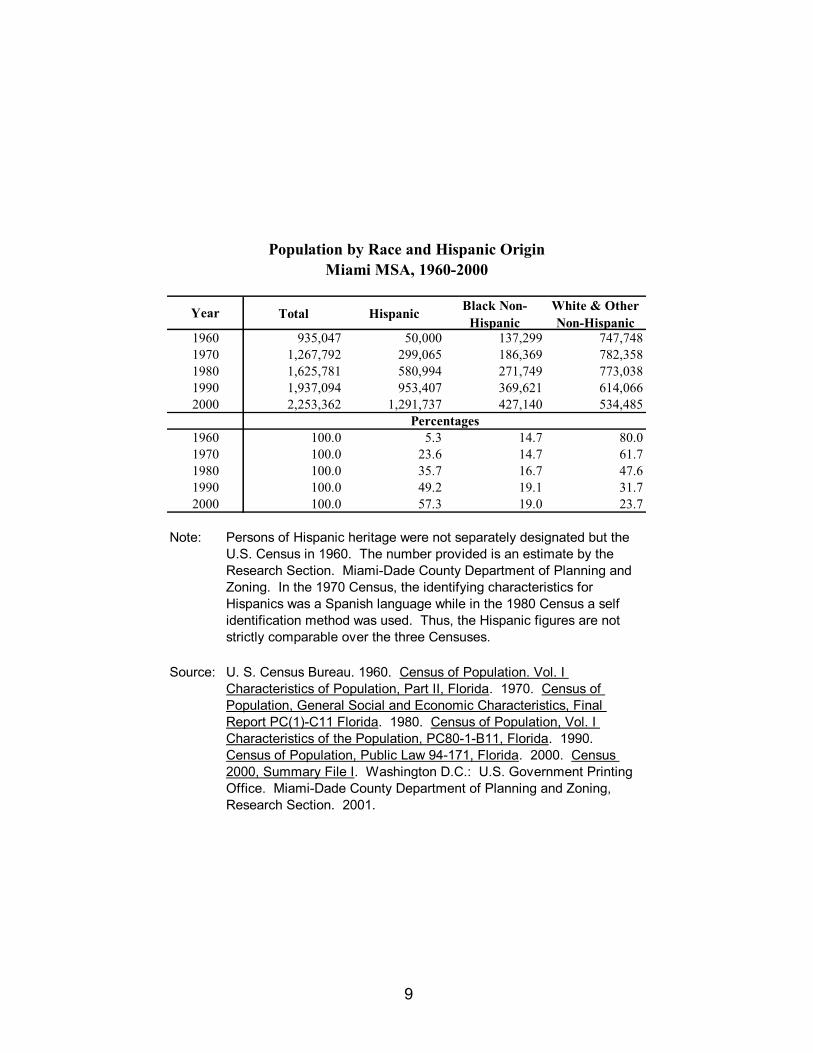
935,047 50,000 137,299 747,748
1,267,792 299,065 186,369 782,358
1,625,781 580,994 271,749 773,038
1,937,094 953,407 369,621 614,066
2,253,362 1,291,737 427,140 534,485
100.0 5.3 14.7 80.0
100.0 23.6 14.7 61.7
100.0 35.7 16.7 47.6
100.0 49.2 19.1 31.7
100.0 57.3 19.0 23.7
Note:
Source:
Population by Race and Hispanic Origin
Miami MSA, 1960-2000
Persons of Hispanic heritage were not separately designated but the
U.S. Census in 1960. The number provided is an estimate by the
Research Section. Miami-Dade County Department of Planning and
Zoning. In the 1970 Census, the identifying characteristics for
Hispanics was a Spanish language while in the 1980 Census a self
identification method was used. Thus, the Hispanic figures are not
strictly comparable over the three Censuses.
U. S. Census Bureau. 1960. Census of Population. Vol. I
Characteristics of Population, Part II, Florida. 1970. Census of
Population, General Social and Economic Characteristics, Final
Report PC(1)-C11 Florida. 1980. Census of Population, Vol. I
Characteristics of the Population, PC80-1-B11, Florida. 1990.
Census of Population, Public Law 94-171, Florida. 2000. Census
2000, Summary File I. Washington D.C.: U.S. Government Printing
Office. Miami-Dade County Department of Planning and Zoning,
Research Section. 2001.
Year
1960
1970
1980
1990
2000
1960
1970
1980
1990
2000
Percentages
9
Page 15
MIAMI-DADE COUNTY, FLORIDA
2000 POPULATION DENSITIES
0 1 2 3 4
Miles
DEPARTMENT OF PLANNING & ZONING
PLANNING RESEARCH SECTION
©
FEBRUARY 2007
Block Group Data2000 POPULATION DENSITIES
Persons per Square Mile0 to 4,999 Persons5,000 to 7,499 Persons7,5000 to 9,999 Persons10,000 to 12,499 Persons12,500 Persons or More
10
Page 16
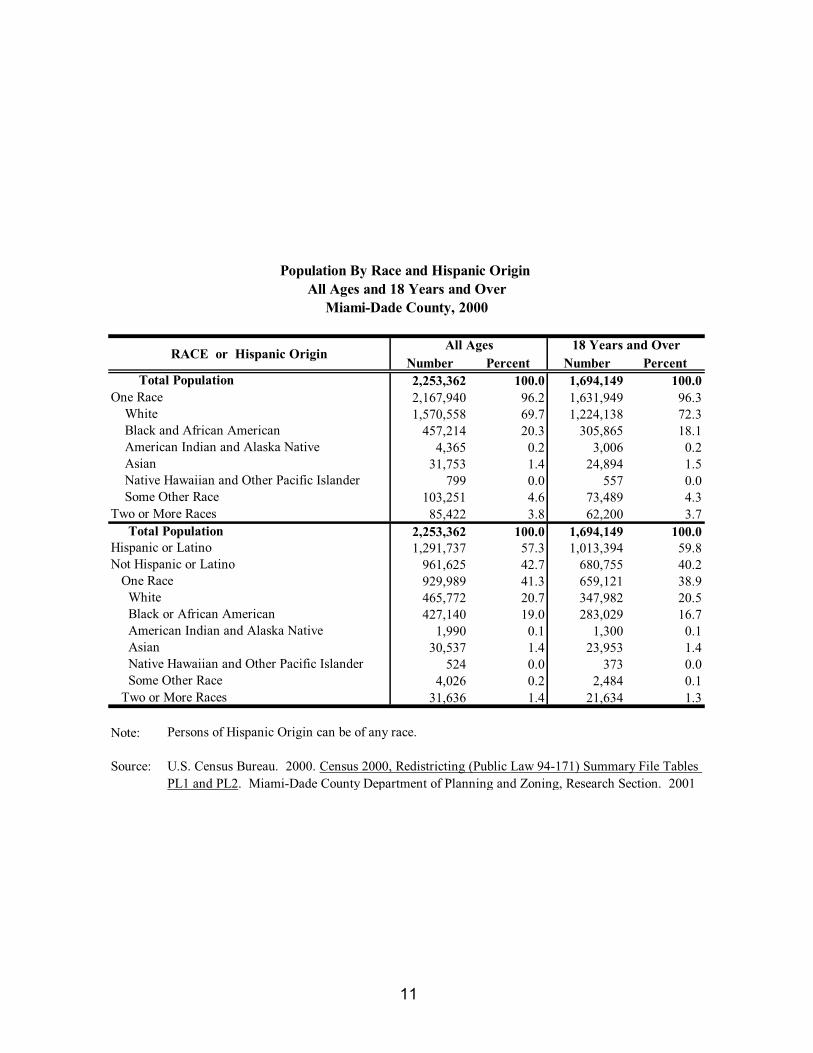
Number Percent Number Percent
2,253,362 100.0 1,694,149 100.0
2,167,940 96.2 1,631,949 96.3
1,570,558 69.7 1,224,138 72.3
457,214 20.3 305,865 18.1
4,365 0.2 3,006 0.2
31,753 1.4 24,894 1.5
799 0.0 557 0.0
103,251 4.6 73,489 4.3
85,422 3.8 62,200 3.7
2,253,362 100.0 1,694,149 100.0
1,291,737 57.3 1,013,394 59.8
961,625 42.7 680,755 40.2
929,989 41.3 659,121 38.9
465,772 20.7 347,982 20.5
427,140 19.0 283,029 16.7
1,990 0.1 1,300 0.1
30,537 1.4 23,953 1.4
524 0.0 373 0.0
4,026 0.2 2,484 0.1
31,636 1.4 21,634 1.3
Note:
Source:
Not Hispanic or Latino
One Race
White
Native Hawaiian and Other Pacific Islander
Some Other Race
Two or More Races
Population By Race and Hispanic Origin
Miami-Dade County, 2000
18 Years and OverAll Ages
All Ages and 18 Years and Over
RACE or Hispanic Origin
U.S. Census Bureau. 2000. Census 2000, Redistricting (Public Law 94-171) Summary File Tables
PL1 and PL2. Miami-Dade County Department of Planning and Zoning, Research Section. 2001
Persons of Hispanic Origin can be of any race.
Total Population
One Race
White
Black and African American
American Indian and Alaska Native
Asian
Two or More Races
Black or African American
American Indian and Alaska Native
Asian
Native Hawaiian and Other Pacific Islander
Some Other Race
Total Population
Hispanic or Latino
11
Page 17
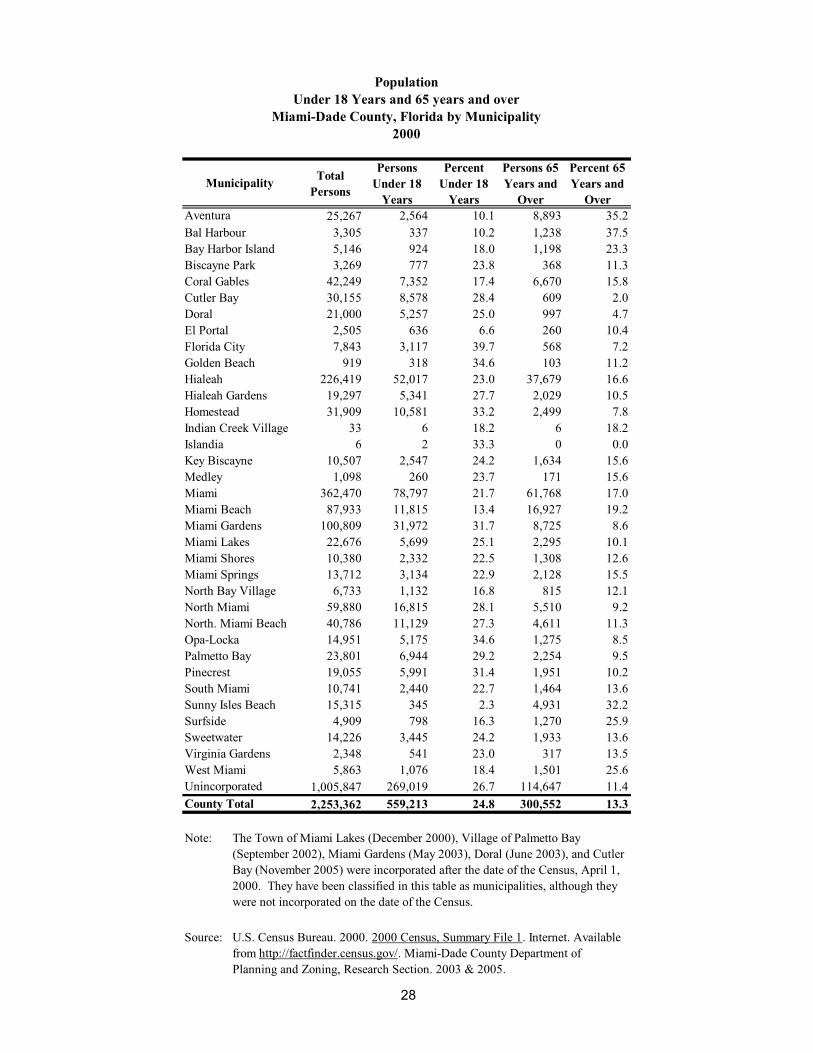
Number Percent Number Percent
25,267 499 2.0 430 1.7
3,305 60 1.8 54 1.6
5,146 123 2.4 92 1.8
3,269 653 20.0 605 18.5
42,249 1,518 3.6 1,394 3.3
30,155 233 0.8 3,641 12.1
21,000 718 3.4 587 2.8
2,505 1,663 66.4 1,537 61.4
7,843 4,777 60.9 4,445 56.7
919 5 0.5 3 0.0
226,419 6,580 2.9 5,453 2.4
19,297 416 2.2 348 1.8
31,909 7,977 25.0 7,194 22.5
33 0 0.0 0 0.0
6 0 0.0 0 0.0
10,507 65 0.6 48 0.5
1,098 88 8.0 80 7.3
362,470 87,857 24.2 80,858 22.3
87,933 4,218 4.8 3,548 4.0
100,809 81,699 81.0 79,704 79.1
22,676 729 3.2 635 2.8
10,380 2,816 27.1 2,541 24.5
13,712 335 2.4 280 2.0
6,733 399 5.9 344 5.1
59,880 34,778 58.1 32,867 54.9
40,786 17,066 41.8 15,895 39.0
14,951 10,705 71.6 10,412 69.6
23,801 2,044 8.6 1,856 7.8
19,055 410 2.2 327 1.7
10,741 2,716 25.3 2,653 24.7
15,315 344 2.2 311 2.0
4,909 74 1.5 63 1.3
14,226 156 1.1 126 0.9
2,348 78 3.3 53 2.3
5,863 70 1.2 48 0.8
1,005,847 215,146 21.4 198,782 19.8
2,253,362 487,015 21.6 457,214 20.3
Note:
Source: U.S. Census Bureau. 2000. Census 2000, Summary File 1. Internet. Available
from http://factfinder.census.gov/. Miami-Dade County Planning and Zoning
Department, Research Section. 2009.
Pinecrest
South Miami
Sunny Isles Beach
Surfside
Sweetwater
Virginia Gardens
West Miami
Unincorporated
County Total
Six percent of Blacks were of two or more races in Miami-Dade County.
The Town of Miami Lakes (December 2000), the Village of Palmetto Bay
(September 2002), Miami Gardens (May 2003), Doral (June 2003), and Cutler
Bay (November 2005) were incorporated after the date of the Census, April 1,
2000. They have been classified in this table as municipalities, although they
were not incorporated on the date of the Census.
Palmetto Bay
Medley
Miami
Miami Beach
Miami Gardens
Miami Lakes
Miami Shores
Miami Springs
North Bay Village
North Miami
North Miami Beach
Opa-Locka
Key Biscayne
Coral Gables
Cutler Bay
Doral
El Portal
Florida City
Golden Beach
Hialeah
Hialeah Gardens
Homestead
Indian Creek Village
Islandia
Biscayne Park
Black Population
Miami-Dade County, Florida by Municipality, 2000
Black BlackTotal
PersonsMunicipality
Aventura
Bal Harbour
Bay Harbor Island
(of one or more races) (of only one race)
12
Page 18
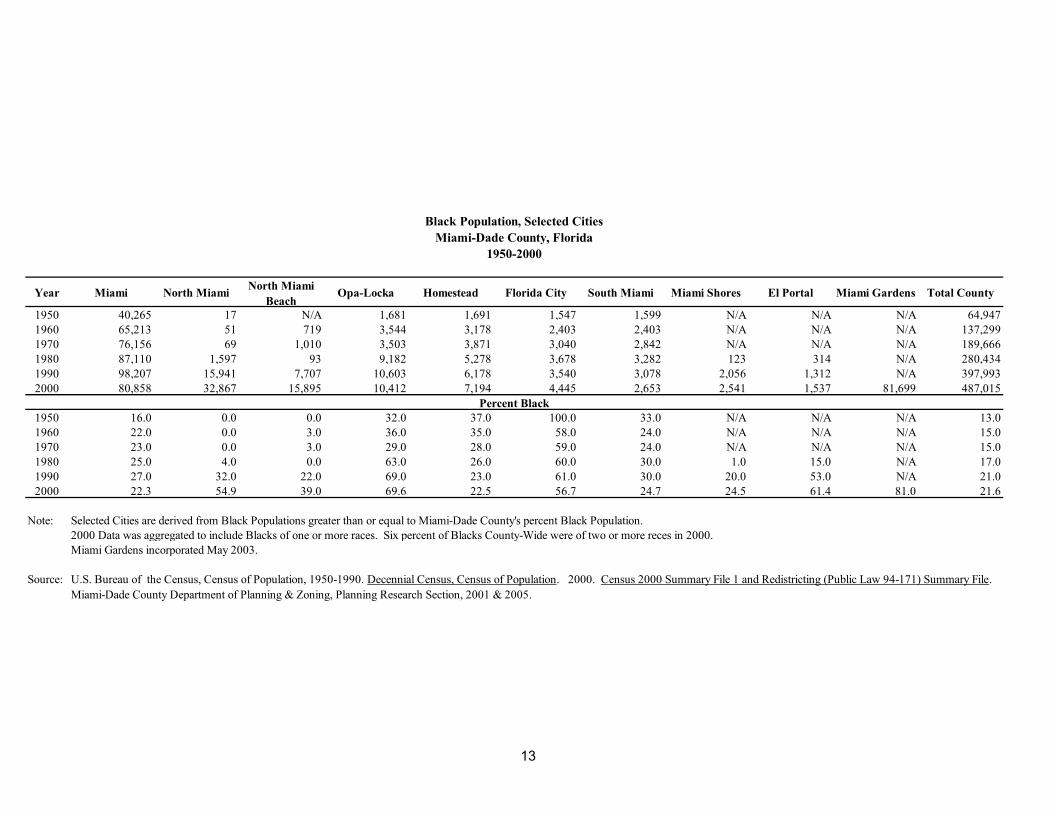
Year Miami North MiamiNorth Miami
BeachOpa-Locka Homestead Florida City South Miami Miami Shores El Portal Miami Gardens Total County
1950 40,265 17 N/A 1,681 1,691 1,547 1,599 N/A N/A N/A 64,947
1960 65,213 51 719 3,544 3,178 2,403 2,403 N/A N/A N/A 137,299
1970 76,156 69 1,010 3,503 3,871 3,040 2,842 N/A N/A N/A 189,666
1980 87,110 1,597 93 9,182 5,278 3,678 3,282 123 314 N/A 280,434
1990 98,207 15,941 7,707 10,603 6,178 3,540 3,078 2,056 1,312 N/A 397,993
2000 80,858 32,867 15,895 10,412 7,194 4,445 2,653 2,541 1,537 81,699 487,015
1950 16.0 0.0 0.0 32.0 37.0 100.0 33.0 N/A N/A N/A 13.0
1960 22.0 0.0 3.0 36.0 35.0 58.0 24.0 N/A N/A N/A 15.0
1970 23.0 0.0 3.0 29.0 28.0 59.0 24.0 N/A N/A N/A 15.0
1980 25.0 4.0 0.0 63.0 26.0 60.0 30.0 1.0 15.0 N/A 17.0
1990 27.0 32.0 22.0 69.0 23.0 61.0 30.0 20.0 53.0 N/A 21.0
2000 22.3 54.9 39.0 69.6 22.5 56.7 24.7 24.5 61.4 81.0 21.6
Note:
Source:
2000 Data was aggregated to include Blacks of one or more races. Six percent of Blacks County-Wide were of two or more reces in 2000.
Miami Gardens incorporated May 2003.
U.S. Bureau of the Census, Census of Population, 1950-1990. Decennial Census, Census of Population. 2000. Census 2000 Summary File 1 and Redistricting (Public Law 94-171) Summary File.
Miami-Dade County Department of Planning & Zoning, Planning Research Section, 2001 & 2005.
Percent Black
Black Population, Selected Cities
Miami-Dade County, Florida
1950-2000
Selected Cities are derived from Black Populations greater than or equal to Miami-Dade County's percent Black Population.
13
Page 19
I95
SR826EX
SR821ET
SW 248TH ST
SW 216TH ST
NW
27THAV
BISCAYNEBD
FLORIDATP
SW 184TH ST
SW
117THAV
SR821HY
SW 88TH ST
NW
22NDAV
SR27HY
SR 836 EX
SW
217THAV
COLLINSAV
SW 152ND ST
SW
137THAV
SW 72ND ST
SW 8TH ST
NW
7THAV
W FLAGLER ST
SW
67THAV
SR874EX
SW 264TH ST
NW
17THAV
NW 36TH ST
I75EX
SW 40TH ST
SW 288TH ST
I 95EX
SW
167THAV
SW
147THAV
SW
187THAV
ALTONRD
NE
2NDAV
NMIAMIAV
SW 24TH ST
SW 200TH ST
SW 328TH ST
PALMAV
NW 183RD ST
SW 112TH ST
NW
32NDAV
SW
162NDAV
NW 135TH ST
SW 272ND ST
W4THAV
SW
57THAV
NW 167TH STNKROMEAV
NW 199TH ST
E4THAV
E8THAV
SW 256TH ST
NE
6THAV
NE
10THAV
SW
87THAV
NW
117THAV
SW
182NDAV
SW
97THAV
SW 104TH ST
NW 58TH ST
NW 25TH ST
SDIXIE
HY
SW
37THAV
SW 320TH ST
SW
77THAV
SW 168TH ST
W12THAV
SW
42NDAV
NW
37THAV
NW
67THAV
NW
57THAV
SW 56TH ST
NW 46TH ST
SW
102NDAV
NW 79TH ST
NW 54TH ST
SW 268TH ST
NW
87THAV
W16THAV
NW 62ND ST
NW
47THAV
OLDDIXIEHY
NW
72NDAV
W
OKEECHOBEERD
SR821
NW 103RD ST
PORTBD
WDIXIE
HY
SW 32ND ST
SW 280TH ST
SW 296TH ST
NW 119TH ST
SW 47TH ST
SR9EX
SW 136TH ST
NW
2NDAV
SW 360TH ST
SW 344TH ST
SW 80TH ST
SW
27THAV
W8THAV
SW
72NDAV
NW 12TH ST
SW 26TH ST
NE 163RD ST
SW
127THAV
PINETREEDR
SW 144TH ST
NW 191ST ST
NW 175TH ST
SW
152NDAV
SW
192NDAV
SW
177THAV
NW 20TH ST
NW 95TH ST
SW 304TH ST
NW 28TH ST
JULIA TUTTLE CY
NW 215TH ST
SW 232ND ST
NW 186TH ST
W 60TH ST
SW 1ST ST
OLDCARDSOUNDRD
SW
142NDAV
SW
22NDAV
NW
42NDAV
SW 128TH ST
SW 120TH ST
OPA LOCKA BD
CARIBBEANBD
NW 14TH ST
SW
32NDAV
NW
107THAV
RICKENBACKER
CY
SR821EX
SW
17THAV
NW 106TH ST
HARDINGAV
ALI BABAAV
79TH STCY
LUDLAMDR NW
12THAV
GRANADABD
NW 71ST ST
NW
79THAV
SW
62NDAV
SW
157THAV
SW 312TH ST
SW
132NDAV
SW
107THAV
SW
112THAV
SW
122NDAV
LUCY ST
SW 96TH ST
NW
SOUTHRIVERDR
SW 392ND ST
CRANDONBD
MERIDIANAV
SW 16TH ST
E 9TH ST
SW 160TH ST
E 49TH ST
NW 143RD ST
SW 68TH ST
NW
97THAV
96TH ST
NW 207TH ST
E 17TH ST
BRICKELLAV
I 195
SW 94TH ST
OCEANBD
NW 41ST ST
LENAPEDR
SW
82NDAV
SW
92NDAV
MAIN
HY
NE 215TH ST
I 395 EX
NW 127TH ST
EASTDR
HIALEAH DR
E 65TH ST
OLDCUTLERRD
JANN
AV
NW
92NDAV
SE 24TH ST
NW 202ND ST
NE
22NDAV
NBAYRD
E 57TH ST
GRIFFINGBD
BAILESRD
NFLAGLERAV
E PALM DR
SW 62ND ST
NW 7TH ST
NE
18THAV
SW 78TH ST
NE 205TH TE
NW
36THAV
OPA LOCKAEX
NW 154TH ST
SW
197THAV
NW 169TH ST
SW
202NDAV
SW 174TH ST
W28THAV
NW 178TH ST
UNNAMED
NW 15TH ST
DEERRUN
NE 96TH ST
NW 6TH ST
NE 103RD ST
SW 240TH ST
SW 211TH ST
SW 74THST
63RDST
SW 376TH ST
GRAND CANAL DR
NE
14THAV
SW 7TH ST
SW 6TH ST
W 76TH ST
CORTEZST
NE 171ST ST
SW 328TH ST
NW 7TH ST
NW
57THAV
SW
187THAV
SW 8TH ST
SW 344TH ST
SW
152NDAV
NW 215TH ST
SW
97THAV
SDIXIEHY
SW 16TH ST
NW 7TH ST
SW
197THAV
SW
122NDAV
UNNAMED
SW 104TH ST
NW
2NDAV
SW
112THAV
NW
12THAV
NE
6THAV
SW
72NDAV
SW
122NDAV
NW 7TH ST
NE
2NDAV
SW 120TH ST
SW 256TH ST
SW 232ND ST
SW 296TH ST
SW
147THAV
NW
7THAV
OLDCUTLERRD
SW 320TH ST
SW
157THAV
SW
87THAV
SW 280TH ST
NW 207TH ST
SW 256TH ST
SW
127THAV
SR821ET
SW152NDAV
SW
137THAV
SW
62NDAV
SW 112TH ST
SW
107THAV
SW
117THAV
SW 328TH ST
SW
147THAV
SW
157THAV
UNNAMED
SW 312TH ST
!" !#$"$%&'()*+,-&./(0!$"
12%0%&3/"'45&/!6%
! " # $
%&'()
$%7"0+ %*+&(.&7/"**!*8&9&:(*!*8
0%5%"0'2&5%'+!(*
*+,-.//" 0
WHERE BLACKS LIVE
2000 Census Tract Data
Percent Black
50.0% - 84.9%
UNDER 25%
85% AND OVER
25% - 49.9%
14
Page 20
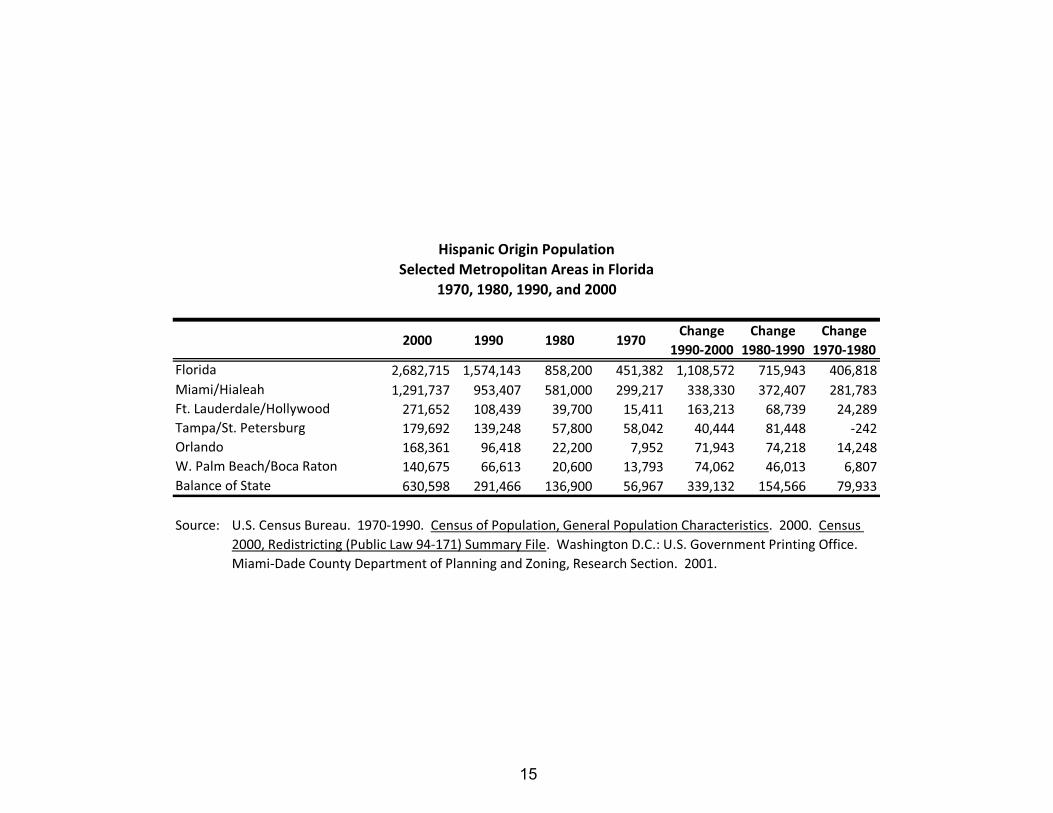
2000 1990 1980 1970Change
1990-2000
Change
1980-1990
Change
1970-1980
2,682,715 1,574,143 858,200 451,382 1,108,572 715,943 406,818
1,291,737 953,407 581,000 299,217 338,330 372,407 281,783
271,652 108,439 39,700 15,411 163,213 68,739 24,289
179,692 139,248 57,800 58,042 40,444 81,448 -242
168,361 96,418 22,200 7,952 71,943 74,218 14,248
140,675 66,613 20,600 13,793 74,062 46,013 6,807
630,598 291,466 136,900 56,967 339,132 154,566 79,933
Source:
Hispanic Origin Population
Selected Metropolitan Areas in Florida
1970, 1980, 1990, and 2000
U.S. Census Bureau. 1970-1990. Census of Population, General Population Characteristics. 2000. Census
2000, Redistricting (Public Law 94-171) Summary File. Washington D.C.: U.S. Government Printing Office.
Miami-Dade County Department of Planning and Zoning, Research Section. 2001.
Florida
Miami/Hialeah
Ft. Lauderdale/Hollywood
Tampa/St. Petersburg
Orlando
W. Palm Beach/Boca Raton
Balance of State
15
Page 21
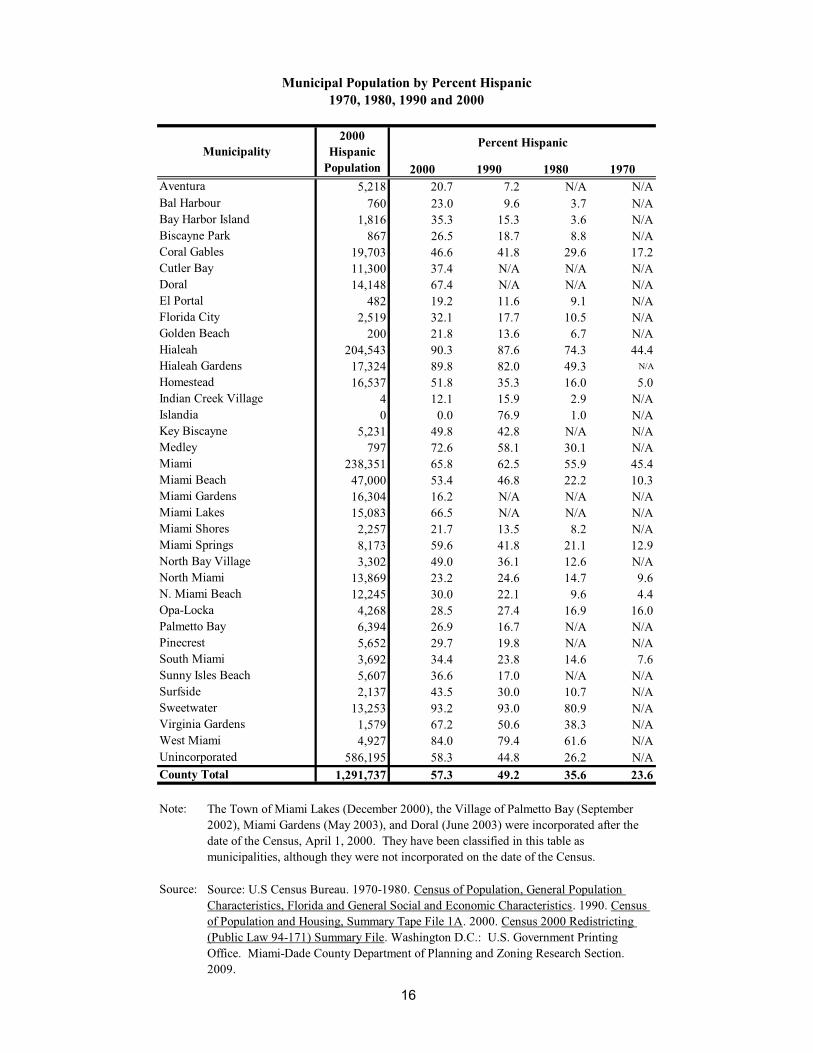
2000 1990 1980 1970
5,218 20.7 7.2 N/A N/A
760 23.0 9.6 3.7 N/A
1,816 35.3 15.3 3.6 N/A
867 26.5 18.7 8.8 N/A
19,703 46.6 41.8 29.6 17.2
11,300 37.4 N/A N/A N/A
14,148 67.4 N/A N/A N/A
482 19.2 11.6 9.1 N/A
2,519 32.1 17.7 10.5 N/A
200 21.8 13.6 6.7 N/A
204,543 90.3 87.6 74.3 44.4
17,324 89.8 82.0 49.3 N/A
16,537 51.8 35.3 16.0 5.0
4 12.1 15.9 2.9 N/A
0 0.0 76.9 1.0 N/A
5,231 49.8 42.8 N/A N/A
797 72.6 58.1 30.1 N/A
238,351 65.8 62.5 55.9 45.4
47,000 53.4 46.8 22.2 10.3
16,304 16.2 N/A N/A N/A
15,083 66.5 N/A N/A N/A
2,257 21.7 13.5 8.2 N/A
8,173 59.6 41.8 21.1 12.9
3,302 49.0 36.1 12.6 N/A
13,869 23.2 24.6 14.7 9.6
12,245 30.0 22.1 9.6 4.4
4,268 28.5 27.4 16.9 16.0
6,394 26.9 16.7 N/A N/A
5,652 29.7 19.8 N/A N/A
3,692 34.4 23.8 14.6 7.6
5,607 36.6 17.0 N/A N/A
2,137 43.5 30.0 10.7 N/A
13,253 93.2 93.0 80.9 N/A
1,579 67.2 50.6 38.3 N/A
4,927 84.0 79.4 61.6 N/A
586,195 58.3 44.8 26.2 N/A
1,291,737 57.3 49.2 35.6 23.6
Note:
Source:
Sweetwater
Virginia Gardens
West Miami
Unincorporated
County Total
Miami Beach
Surfside
Miami Lakes
Miami Shores
Miami Springs
North Bay Village
North Miami
N. Miami Beach
Opa-Locka
Palmetto Bay
Pinecrest
South Miami
Sunny Isles Beach
Indian Creek Village
Islandia
Key Biscayne
Medley
Miami
The Town of Miami Lakes (December 2000), the Village of Palmetto Bay (September
2002), Miami Gardens (May 2003), and Doral (June 2003) were incorporated after the
date of the Census, April 1, 2000. They have been classified in this table as
municipalities, although they were not incorporated on the date of the Census.
Source: U.S Census Bureau. 1970-1980. Census of Population, General Population
Characteristics, Florida and General Social and Economic Characteristics. 1990. Census
of Population and Housing, Summary Tape File 1A. 2000. Census 2000 Redistricting
(Public Law 94-171) Summary File. Washington D.C.: U.S. Government Printing
Office. Miami-Dade County Department of Planning and Zoning Research Section.
2009.
Aventura
Bal Harbour
Bay Harbor Island
Biscayne Park
Coral Gables
Cutler Bay
Doral
El Portal
Miami Gardens
Florida City
Golden Beach
Hialeah
Hialeah Gardens
Homestead
Municipal Population by Percent Hispanic
1970, 1980, 1990 and 2000
Percent Hispanic2000
Hispanic
Population
Municipality
16
Page 22
I95
SR826EX
SR821ET
SW 248TH ST
SW 216TH ST
NW
27THAV
BISCAYNEBD
FLORIDATP
SW 184TH ST
SW
117THAV
SR821HY
SW 88TH ST
NW
22NDAV
SR27HY
SR 836 EX
SW
217THAV
COLLINSAV
SW 152ND ST
SW
137THAV
SW 72ND ST
SW 8TH ST
NW
7THAV
W FLAGLER ST
SW
67THAV
SR874EX
SW 264TH ST
NW
17THAV
NW 36TH ST
I75EX
SW 40TH ST
SW 288TH ST
I 95EX
SW
167THAV
SW
147THAV
SW
187THAV
ALTONRD
NE
2NDAV
NMIAMIAV
SW 24TH ST
SW 200TH ST
SW 328TH ST
PALMAV
NW 183RD ST
SW 112TH ST
NW
32NDAV
SW
162NDAV
NW 135TH ST
SW 272ND ST
W4THAV
SW
57THAV
NW 167TH STNKROMEAV
NW 199TH ST
E4THAV
E8THAV
SW 256TH ST
NE
6THAV
NE
10THAV
SW
87THAV
NW
117THAV
SW
182NDAV
SW
97THAV
SW 104TH ST
NW 58TH ST
NW 25TH ST
SW
37THAV
SDIXIE
HY
SW 320TH ST
SW
77THAV
SW 168TH ST
W12THAV
SW
42NDAV
NW
37THAV
NW
67THAV
NW
57THAV
SW 56TH ST
NW 46TH ST
SW
102NDAV
NW 79TH ST
NW 54TH ST
SW 268TH ST
NW
87THAV
W16THAV
NW 62ND ST
NW
47THAV
OLDDIXIEHY
NW
72NDAV
W
OKEECHOBEERD
SR821
NW 103RD ST
PORTBD
WDIXIE
HY
SW 32ND ST
SW 280TH ST
SW 296TH ST
NW 119TH ST
SW 47TH ST
SR9EX
SW 136TH ST
NW
2NDAV
SW 360TH ST
SW 344TH ST
SW 80TH ST
SW
27THAV
W8THAV
SW
72NDAV
NW 12TH ST
SW 26TH ST
NE 163RD ST
SW
127THAV
PINETREEDR
SW 144TH ST
NW 191ST ST
NW 175TH ST
SW
152NDAV
SW
192NDAV
SW
177THAV
NW 20TH ST
NW 95TH ST
SW 304TH ST
NW 28TH ST
JULIA TUTTLE CY
NW 215TH ST
SW 232ND ST
NW 186TH ST
W 60TH ST
SW 1ST ST
OLDCARDSOUNDRD
SW
142NDAV
SW
22NDAV
NW
42NDAV
SW 128TH ST
SW 120TH ST
OPA LOCKA BD
CARIBBEANBD
NW 14TH ST
SW
32NDAV
NW
107THAV
RICKENBACKER
CY
SR821EX
SW
17THAV
NW 106TH ST
HARDINGAV
ALI BABAAV
79TH STCY
LUDLAMDR NW
12THAV
GRANADABD
NW 71ST ST
NW
79THAV
SW
62NDAV
SW
157THAV
SW 312TH ST
SW
132NDAV
SW
107THAV
SW
112THAV
SW
122NDAV
LUCY ST
SW 96TH ST
NW
SOUTHRIVERDR
SW 392ND ST
CRANDONBD
MERIDIANAV
SW 16TH ST
E 9TH ST
SW 160TH ST
E 49TH ST
NW 143RD ST
SW 68TH ST
NW
97THAV
96TH ST
NW 207TH ST
E 17TH ST
BRICKELLAV
I 195
SW 94TH ST
OCEANBD
NW 41ST ST
LENAPEDR
SW
82NDAV
SW
92NDAV
MAIN
HY
NE 215TH ST
I 395 EX
NW 127TH ST
EASTDR
HIALEAH DR
E 65TH ST
OLDCUTLERRD
JANN
AV
NW
92NDAV
SE 24TH ST
NW 202ND ST
NE
22NDAV
NBAYRD
E 57TH ST
GRIFFINGBD
BAILESRD
NFLAGLERAV
E PALM DR
SW 62ND ST
NW 7TH ST
NE
18THAV
SW 78TH ST
NE 205TH TE
NW
36THAV
OPA LOCKAEX
NW 154TH ST
SW
197THAV
NW 169TH ST
SW
202NDAV
SW 174TH ST
W28THAV
NW 178TH ST
UNNAMED
NW 15TH ST
DEERRUN
NE 96TH ST
NW 6TH ST
NE 103RD ST
SW 240TH ST
SW 211TH ST
SW 74THST
63RDST
SW 376TH ST
GRAND CANAL DR
NE
14THAV
SW 7TH ST
SW 6TH ST
W 76TH ST
W 16TH ST
CORTEZST
NE 171ST ST
SW
157THAV
SW
137THAV
SW
147THAV
NW 207TH ST
SW
107THAV
SW
122NDAV
SW
112THAV
SW 320TH ST
SW 280TH ST
SW 328TH ST
SW
127THAV
NW 7TH ST
SW
112THAV
SW
152NDAV
UNNAMED
NE
2NDAV
NW
2NDAV NE
6THAV
NW 7TH ST
SW
62NDAV
SW 16TH ST
SW
157THAV
SW
147THAV
SW 120TH ST
SW
97THAV
NW
12THAV
SW 344TH ST
NW 215TH ST
SW 8TH ST
SW
197THAV
SW 256TH ST
SW 232ND ST
SR821ET
SW
122NDAV
NW 7TH ST
NW
57THAV
SW 112TH ST
SW
87THAV
SW
157THAV
SW
187THAV
SW 312TH ST
SW 296TH ST
SW 256TH ST
OLDCUTLERRD
SW
157THAV
SW
72NDAV
SW
107THAV
SW
117THAV
SW 328TH ST
!" !#$"$%&'()*+,-&./(0!$"
12%0%&2!34"*!'3&/!5%
! " # $
%&'()
$%4"0+ %*+&(.&4/"**!*6&7&8(*!*6
0%3%"0'2&3%'+!(*
*+,-./" 0
WHERE HISPANICS LIVE2000 Census Tract Data
Percent Hispanic
50.0% - 84.9%
UNDER 25%
85% AND OVER
25% - 49.9%
17
Page 23
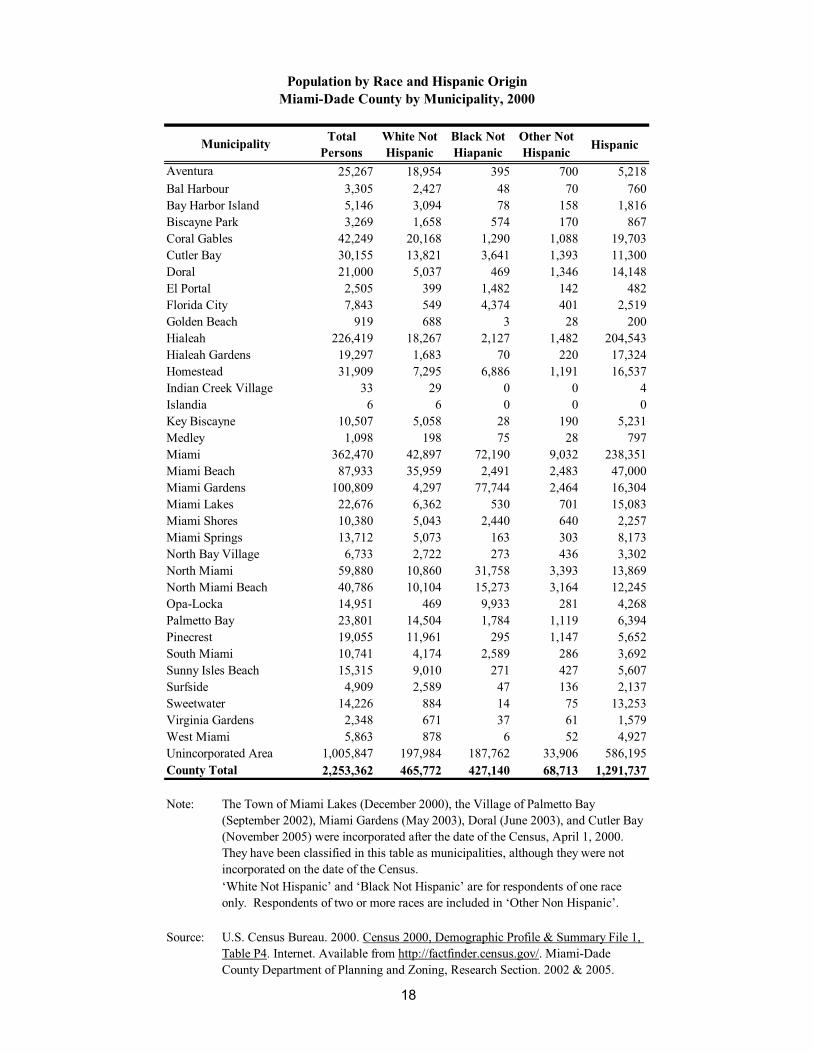
Total
Persons
White Not
Hispanic
Black Not
Hiapanic
Other Not
HispanicHispanic
25,267 18,954 395 700 5,218
3,305 2,427 48 70 760
5,146 3,094 78 158 1,816
3,269 1,658 574 170 867
42,249 20,168 1,290 1,088 19,703
30,155 13,821 3,641 1,393 11,300
21,000 5,037 469 1,346 14,148
2,505 399 1,482 142 482
7,843 549 4,374 401 2,519
919 688 3 28 200
226,419 18,267 2,127 1,482 204,543
19,297 1,683 70 220 17,324
31,909 7,295 6,886 1,191 16,537
33 29 0 0 4
6 6 0 0 0
10,507 5,058 28 190 5,231
1,098 198 75 28 797
362,470 42,897 72,190 9,032 238,351
87,933 35,959 2,491 2,483 47,000
100,809 4,297 77,744 2,464 16,304
22,676 6,362 530 701 15,083
10,380 5,043 2,440 640 2,257
13,712 5,073 163 303 8,173
6,733 2,722 273 436 3,302
59,880 10,860 31,758 3,393 13,869
40,786 10,104 15,273 3,164 12,245
14,951 469 9,933 281 4,268
23,801 14,504 1,784 1,119 6,394
19,055 11,961 295 1,147 5,652
10,741 4,174 2,589 286 3,692
15,315 9,010 271 427 5,607
4,909 2,589 47 136 2,137
14,226 884 14 75 13,253
2,348 671 37 61 1,579
5,863 878 6 52 4,927
1,005,847 197,984 187,762 33,906 586,195
2,253,362 465,772 427,140 68,713 1,291,737
Note:
Source:
‘White Not Hispanic’ and ‘Black Not Hispanic’ are for respondents of one race
only. Respondents of two or more races are included in ‘Other Non Hispanic’.
Unincorporated Area
County Total
South Miami
Sunny Isles Beach
Surfside
Sweetwater
Virginia Gardens
West Miami
Key Biscayne
Pinecrest
Miami
Miami Beach
Miami Gardens
Miami Lakes
Miami Shores
Miami Springs
North Bay Village
North Miami
North Miami Beach
Opa-Locka
Palmetto Bay
Hialeah
Hialeah Gardens
Homestead
Indian Creek Village
Islandia
Population by Race and Hispanic Origin
Miami-Dade County by Municipality, 2000
The Town of Miami Lakes (December 2000), the Village of Palmetto Bay
(September 2002), Miami Gardens (May 2003), Doral (June 2003), and Cutler Bay
(November 2005) were incorporated after the date of the Census, April 1, 2000.
They have been classified in this table as municipalities, although they were not
incorporated on the date of the Census.
U.S. Census Bureau. 2000. Census 2000, Demographic Profile & Summary File 1,
Table P4. Internet. Available from http://factfinder.census.gov/. Miami-Dade
County Department of Planning and Zoning, Research Section. 2002 & 2005.
Municipality
Aventura
Bal Harbour
Bay Harbor Island
Biscayne Park
Coral Gables
Medley
Cutler Bay
Doral
El Portal
Florida City
Golden Beach
18
Page 24
1990 2000 2001 2002 2003 2004 2005 2006 2007
Annual
Average
Change
1990-
2000
Annual
Average
Change
2000-2007
953,407 1,291,737 1,333,462 1,374,106 1,398,974 1,403,983 1,423,697 1,471,709 1,479,530 33,833 26,828
23,112 38,095 54,558 38,124 58,966 58,643 43,361 41,942 45,776 1,498 1,097
72,827 80,327 70,043 85,362 93,373 92,972 80,854 88,579 94,264 750 1,991
563,979 650,601 704,423 695,122 710,937 735,327 736,073 767,349 794,883 8,662 20,612
23,475 36,454 49,023 50,349 52,872 65,421 58,372 49,430 48,635 1,298 1,740
119,534 128,903 190,286 200,443 184,374 170,974 195,914 210,821 201,428 937 10,361
4,743 4,706 6,622 6,997 1,814 8,732 4,727 7,944 7,045 -4 334
8,242 9,676 9,183 7,197 12,046 15,234 12,018 24,292 17,843 143 1,167
18,102 26,829 43,395 35,172 57,076 44,065 51,588 47,927 49,137 873 3,187
74,244 69,257 104,776 124,198 88,588 79,896 95,745 100,258 105,415 -499 5,165
6,729 5,863 7,955 10,224 7,044 5,243 9,844 9,881 7,346 -87 212
7,339 9,115 17,041 14,421 14,448 16,642 19,914 17,556 12,615 178 500
135 3,457 1,314 2,234 3,358 1,162 2,078 2,963 2,027 332 -204
108,768 154,348 198,965 222,456 243,526 220,602 237,760 242,196 232,248 4,558 11,129
8,585 13,341 18,870 38,032 25,071 27,545 30,973 25,134 21,120 476 1,111
2,309 2,418 3,347 1,288 2,503 4,458 3,220 1,387 4,847 11 347
7,929 7,910 16,214 9,354 17,101 8,956 11,925 13,363 8,228 -2 45
53,852 70,066 94,254 95,441 96,936 85,588 90,303 102,118 94,511 1,621 3,492
7,986 10,560 7,408 8,522 24,460 19,834 12,705 16,336 19,124 257 1,223
166 434 723 2,622 1,401 237 857 506 191 27 -35
16,452 23,327 27,048 32,201 30,237 29,916 37,361 34,106 36,258 688 1,847
1,482 1,829 872 2,118 9,595 6,314 5,277 5,371 6,824 35 714
9,846 21,593 28,952 29,540 33,147 31,602 42,849 40,981 37,865 1,175 2,325
161 2,870 1,277 3,338 3,075 6,152 2,290 2,894 3,280 271 59
44,498 203,009 66,164 82,250 54,926 60,044 71,363 71,392 62,296 15,851 -20,102
Source:
Dominican
Central American
U.S. Census Bureau. 1990. Census of Population, Summary Tape File 1A & Summary Tape File 4A. 2000. Census 2000, Summary File 1. 2001 - 2003.
American Community Survey, Table PCT006. 2004 - 2007. American Community Survey, Table PCT011. Internet. Available from
http://factfinder.census.gov/. Miami-Dade County Dept. of Planning & Zoning, Research Section, 2001, 2005 & 2009.
Peruvian
Venezuelan
Argentinean
Ecuadorian
Chilean
Bolivian
Uruguayan
Paraguayan
Other South American
Other Hispanic
Colombian
Salvadoran
Panamanian
Persons of Hispanic Origin by Country of Origin
Miami-Dade County, Florida, 1990 to 2007
Total
Cuban
Puerto Rican
Mexican
Costa Rican
Other Central American
South American
Nicaraguan
Honduran
Guatemalan
19
Page 25
Number Percent
1,630,022 100.0
1,570,558 96.4
59,464 3.6
2,104 0.1
4,136 0.3
5,368 0.3
396 0.0
47,460 2.9
Source:
Number Percent
487,015 100.0
457,214 93.9
29,801 6.1
5,368 1.1
1,101 0.2
1,884 0.4
1,318 0.3
20,130 4.1
Source:
Black or African American; Asian
Black or African American; Native Hawaiian and Other Pacific Islander
All other combinations including Black or African American
U.S. Census Bureau. 2000. Census 2000, Redistricting (Public Law 94-171) Summary File, Table PL 1.
Miami-Dade County Department of Planning and Zoning, Research Section. 2001.
U.S. Census Bureau. 2000. Census 2000, Redistricting (Public Law 94-171) Summary File, Table PL 1.
Miami-Dade County Department of Planning and Zoning, Research Section. 2001.
Total Population
Black or African American Alone
Black or African American in combination with one or more races
Black or African American; White
Black or African American; American Indian and Alaska Native
Race
White Population
Miami-Dade County, 2000
Black Population
Miami-Dade County, 2000
Race
Total Population
White Alone
White in combination with one or more races
White; American Indian and Alaska Native
White; Asian
White; Black or African American
White; Native Hawaiian and Other Pacific Islander
All other combinations including White
20
Page 26
Number Percent
170,917 100.0
103,251 60.4
67,666 39.6
45,171 26.4
18,203 10.7
1,495 0.9
792 0.5
2,005 1.2
Source:
Number Percent
40,827 100.0
31,753 77.8
9,074 22.2
4,136 10.1
165 0.4
1,884 4.6
211 0.5
2,678 6.6
Source:
Asian; American Indian and Alaska Native
All other combinations including Asian
Some Other Race Population
Miami-Dade County, 2000
Asian Population
Miami-Dade County, 2000
U.S. Census Bureau. 2000. Census 2000, Redistricting (Public Law 94-171) Summary
File, Table PL 1. Miami-Dade County Department of Planning and Zoning, Research
Section. 2001.
All other combinations including Some other race
U.S. Census Bureau. 2000. Census 2000, Redistricting (Public Law 94-171) Summary
File, Table PL 1. Miami-Dade County Department of Planning and Zoning, Research
Section. 2001.
Race
Total Population
Some other race alone
Some other race in combination with one or more other races
Some other race; White
Some other race; Black or African American
Some other race; Asian
Some other race; American Indian and Alaska Native
Race
Total Population
Asian Alone
Asian in combination with one or more other races
Asian; White
Asian; Native Hawaiian and Other Pacific Islander
Asian; Black or African American
21
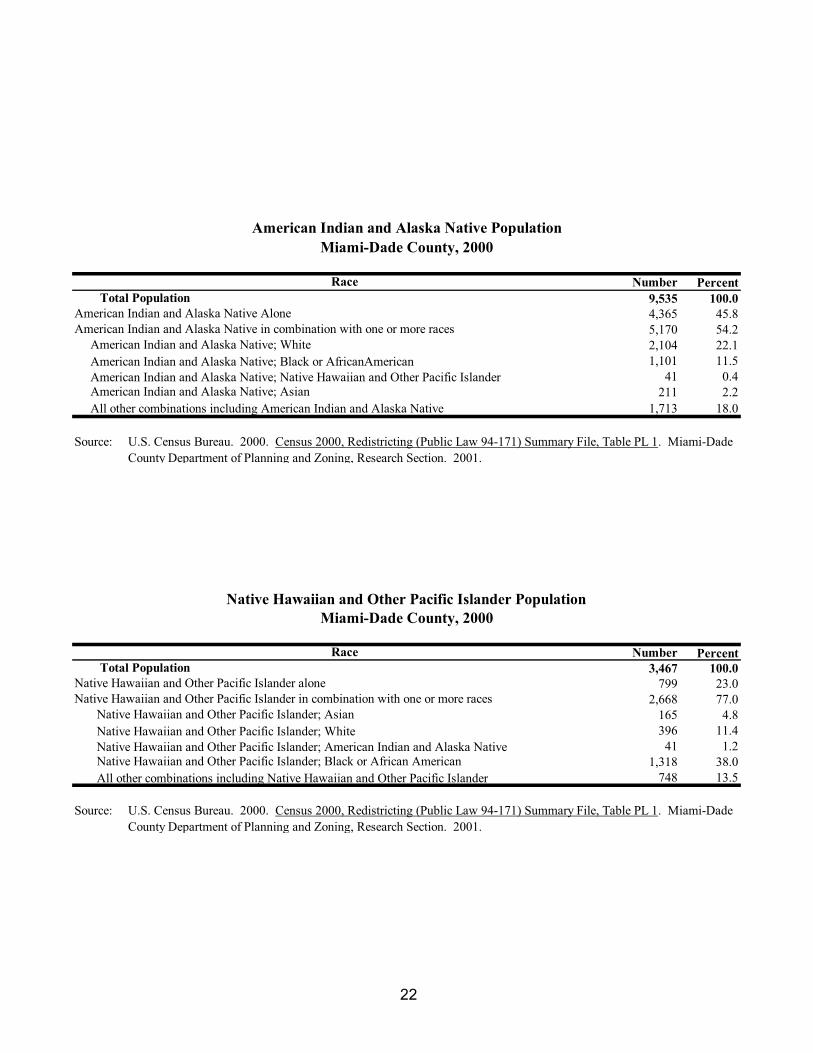
Page 27
Number Percent
9,535 100.0
4,365 45.8
5,170 54.2
2,104 22.1
1,101 11.5
41 0.4
211 2.2
1,713 18.0
Source:
Number Percent
3,467 100.0
799 23.0
2,668 77.0
165 4.8
396 11.4
41 1.2
1,318 38.0
748 13.5
Source:
Native Hawaiian and Other Pacific Islander; American Indian and Alaska Native Native Hawaiian and Other Pacific Islander; Black or African American
All other combinations including Native Hawaiian and Other Pacific Islander
U.S. Census Bureau. 2000. Census 2000, Redistricting (Public Law 94-171) Summary File, Table PL 1. Miami-Dade
County Department of Planning and Zoning, Research Section. 2001.
U.S. Census Bureau. 2000. Census 2000, Redistricting (Public Law 94-171) Summary File, Table PL 1. Miami-Dade
County Department of Planning and Zoning, Research Section. 2001.
Total Population
Native Hawaiian and Other Pacific Islander alone
Native Hawaiian and Other Pacific Islander in combination with one or more races
Native Hawaiian and Other Pacific Islander; Asian
Native Hawaiian and Other Pacific Islander; White
Race
American Indian and Alaska Native Population
Miami-Dade County, 2000
Native Hawaiian and Other Pacific Islander Population
Miami-Dade County, 2000
Race
Total Population
American Indian and Alaska Native Alone
American Indian and Alaska Native in combination with one or more races
American Indian and Alaska Native; White
American Indian and Alaska Native; Black or AfricanAmerican
American Indian and Alaska Native; Native Hawaiian and Other Pacific Islander American Indian and Alaska Native; Asian
All other combinations including American Indian and Alaska Native
22
Page 28
National Florida Miami-Dade
White; Some Other Race 32.3 35.0 52.9
Black or African American; Some Other Race 6.1 17.4 21.3
White; Asian 12.7 9.9 4.8
White; Black or African American 11.5 10.2 6.3
Note:
Source:
Percents are a result of dividing the number representing a particular race combination by the total population of
Two or More Races times 100.
U.S. Census Bureau, Census 2000 Redistricting (Public Law 94-171) Summary File, Table PL1. Miami-Dade
County Department of Planning and Zoning, 2001.
32.3
6.1
12.7
11.5
35.0
17.4
9.9
10.2
52.9
21.3
4.8
6.3
0.0 10.0 20.0 30.0 40.0 50.0 60.0
White; Some Other Race
Black or African American; Some Other Race
White; Asian
White; Black or African American
Percent
Percent Distribution of Population of Two or More Races
Miami-Dade County, Florida and the United States, 2000
Miami-Dade County
Florida
United States
23
Page 29
Total: 1,147,765
Europe: 44,067
Northern Europe: 6,696
United Kingdom 4,958
Ireland 589
Sweden 669
Other Northern Europe 480
Western Europe: 10,069
Austria 919
France 3,037
Germany 4,299
Netherlands 836
Other Western Europe 978
Southern Europe: 13,983
Greece 769
Italy 3,555
Portugal 1,081
Spain 8,546
Other Southern Europe 32
Eastern Europe: 13,256
Czechoslovakia (includes Czech Republic and Slovakia) 983
Hungary 1,246
Poland 3,459
Romania 1,190
Belarus 172
Russia 3,053
Ukraine 1,131
Bosnia and Herzegovina 82
Yugoslavia 292
Other Eastern Europe 1,648
Europe, n.e.c. 63
Asia: 28,638
Eastern Asia: 7,031
China: 4,712
China, excluding Hong Kong and Taiwan 3,106
Hong Kong 752
Taiwan 854
Japan 1,155
Korea 1,127
Other Eastern Asia 37
South Central Asia: 7,638
Afghanistan 16
Bangladesh 466
India 3,838
Iran 1,172
Pakistan 1,908
Other South Central Asia 238
Miami-Dade County, 2000
Place of Birth for the Foreign-Born Poulation
Continued on the following page. 24
Page 30
South Eastern Asia: 7,865
Cambodia 79
Indonesia 238
Laos 260
Malaysia 170
Philippines 4,290
Thailand 941
Vietnam 1,635
Other South Eastern Asia 252
Western Asia: 5,801
Iraq 188
Israel 2,361
Jordan 249
Lebanon 1,113
Syria 385
Turkey 753
Armenia 34
Other Western Asia 718
Asia, n.e.c. 303
Africa: 4,851
Eastern Africa: 501
Ethiopia 98
Other Eastern Africa 403
Middle Africa 110
Northern Africa: 1,929
Egypt 772
Other Northern Africa 1,157
Southern Africa: 514
South Africa 475
Other Southern Africa 39
Western Africa: 1,527
Ghana 113
Nigeria 1,161
Sierra Leone 47
Other Western Africa 206
Africa, n.e.c. 270
Oceania: 373
Australia and New Zealand Subregion: 349
Australia 284
Other Australian and New Zealand Subregion 65
Melanesia 8
Micronesia 0
Polynesia 16
Oceania, n.e.c. 0
Miami-Dade County, 2000 (Continued)
Place of Birth for the Foreign-Born Poulation
Continued on the following page.
25
Page 31
1,069,827
1,064,436
688,760
549
525,841
36,870
71,054
34,450
6,487
13,509
179,105
20,916
158,189
5,718
10,966
11,744
34,689
86,108
7,860
1,104
196,571
16,596
2,981
13,078
9,470
81,377
13,447
2,791
27,823
25,376
3,632
5,391
5,386
5
9
Source:
Place of Birth for the Foreign-Born Poulation
Miami-Dade County, 2000 (Continued)
U.S. Census Bureau, 2000, Census 2000, Summary File 3. Miami-Dade County
Department of Planning and Zoning, Research Section, 2003.
Americas:
Latin America:
Caribbean:
Barbados
Cuba
Dominican Republic
Haiti
Jamaica
Trinidad and Tobago
Other Caribbean
Central America:
Mexico
Other Central America:
Costa Rica
El Salvador
Guatemala
Honduras
Nicaragua
Panama
Other Central America
South America:
Argentina
Bolivia
Brazil
Chile
Colombia
Ecuador
Canada
Other Northern America
Born at sea
Guyana
Peru
Venezuela
Other South America
Northern America:
26
Page 32
Number Percent Number Percent Number Percent Number Percent
86,172 6.8 94,551 5.8 144,460 7.4 145,752 6.5
107,062 8.4 101,591 6.3 130,246 6.7 157,871 7
133,205 8.9 111,604 6.9 120,157 6.2 160,754 7.1
103,050 8.1 136,536 8.4 131,764 6.8 154,989 6.9
89,329 7 133,480 8.2 140,652 7.3 144,721 6.4
146,344 11.5 240,796 14.8 332,400 17.1 337,433 15
156,572 12.3 192,847 11.9 276,515 14.3 361,966 16.1
158,402 12.5 187,495 11.5 210,374 10.9 282,766 12.5
69,635 5.5 91,009 5.6 91,437 4.7 109,141 4.8
64,804 5.1 80,586 5 90,667 4.7 97,417 4.3
112,368 8.9 149,550 9.2 145,279 7.5 162,257 7.2
60,349 4.8 105,736 6.5 123,143 6.4 138,295 6.1
1,267,792 100 1,625,781 100 1,937,094 100 2,253,362 100
Source: U.S. Census Bureau. 1970. Census of Population. 1980. Census of Population, Summary Tape File
1-A. 1990. Census of Population, Modified Age/Race/Sex file. 2000. Census 2000, Summary File
1. Miami-Dade County Department of Planning and Zoning, Research Section. 2001.
Median Age
Population by Age
1970, 1980, 1990 and 2000
Miami-Dade County, Florida
1970 1980 1990 2000
34.2 34.7 34.2 35.6
Total
Age Group
75 plus
00-04
05-09
10-14
15-19
20-24
25-34
35-44
45-54
55-59
60-64
65-74
27
Page 33
Total
Persons
Persons
Under 18
Years
Percent
Under 18
Years
Persons 65
Years and
Over
Percent 65
Years and
Over
25,267 2,564 10.1 8,893 35.2
3,305 337 10.2 1,238 37.5
5,146 924 18.0 1,198 23.3
3,269 777 23.8 368 11.3
42,249 7,352 17.4 6,670 15.8
30,155 8,578 28.4 609 2.0
21,000 5,257 25.0 997 4.7
2,505 636 6.6 260 10.4
7,843 3,117 39.7 568 7.2
919 318 34.6 103 11.2
226,419 52,017 23.0 37,679 16.6
19,297 5,341 27.7 2,029 10.5
31,909 10,581 33.2 2,499 7.8
33 6 18.2 6 18.2
6 2 33.3 0 0.0
10,507 2,547 24.2 1,634 15.6
1,098 260 23.7 171 15.6
362,470 78,797 21.7 61,768 17.0
87,933 11,815 13.4 16,927 19.2
100,809 31,972 31.7 8,725 8.6
22,676 5,699 25.1 2,295 10.1
10,380 2,332 22.5 1,308 12.6
13,712 3,134 22.9 2,128 15.5
6,733 1,132 16.8 815 12.1
59,880 16,815 28.1 5,510 9.2
40,786 11,129 27.3 4,611 11.3
14,951 5,175 34.6 1,275 8.5
23,801 6,944 29.2 2,254 9.5
19,055 5,991 31.4 1,951 10.2
10,741 2,440 22.7 1,464 13.6
15,315 345 2.3 4,931 32.2
4,909 798 16.3 1,270 25.9
14,226 3,445 24.2 1,933 13.6
2,348 541 23.0 317 13.5
5,863 1,076 18.4 1,501 25.6
1,005,847 269,019 26.7 114,647 11.4
2,253,362 559,213 24.8 300,552 13.3
Note:
Source:
Hialeah
Hialeah Gardens
Homestead
Indian Creek Village
Municipality
Aventura
Bal Harbour
Bay Harbor Island
Biscayne Park
Coral Gables
Doral
El Portal
Population
Under 18 Years and 65 years and over
Miami-Dade County, Florida by Municipality
2000
Opa-Locka
Miami Lakes
Miami Shores
Miami Springs
North Bay Village
North Miami
North. Miami Beach
Islandia
Key Biscayne
Medley
Miami
Miami Beach
The Town of Miami Lakes (December 2000), Village of Palmetto Bay
(September 2002), Miami Gardens (May 2003), Doral (June 2003), and Cutler
Bay (November 2005) were incorporated after the date of the Census, April 1,
2000. They have been classified in this table as municipalities, although they
were not incorporated on the date of the Census.
U.S. Census Bureau. 2000. 2000 Census, Summary File 1. Internet. Available
from http://factfinder.census.gov/. Miami-Dade County Department of
Planning and Zoning, Research Section. 2003 & 2005.
Cutler Bay
Sweetwater
Virginia Gardens
West Miami
Unincorporated
County Total
Palmetto Bay
Pinecrest
South Miami
Sunny Isles Beach
Surfside
Miami Gardens
Florida City
Golden Beach
28
Page 34
Male Female Male Female Male Female Male Female
602,084 665,708 767,882 857,899 928,411 1,008,683 1,086,558 1,166,804
457,680 526,044 609,828 708,408 727,705 817,759 849,877 939,638
117,112 104,636 170,960 154,896 233,048 198,967 275,699 238,097
306,379 312,784 376,763 381,428 388,043 382,305 471,322 473,906
15,327 74,220 18,990 101,838 20,343 104,902 21,307 102,796
18,862 34,404 43,125 70,246 64,612 101,339 81,549 124,839
100 100 100 100 100 100 100 100
26 20 28 22 32 24 32 25
67 60 62 54 53 46 55 50
3 14 3 14 3 13 3 11
4 7 7 10 9 12 10 13
Note:
Source:
1980 1990 2000
609,830 692,355 776,774
422,762 481,263 548,493
270,409 342,515 370,898
127,800 178,296 175,547
142,609 164,219 195,351
91,508 103,371 133,671
51,895 64,848 70,316
39,613 38,523 63,355
N/A 35,377 43,924
N/A 17,177 16,889
N/A 18,200 27,035
28,825 38,928 47,301
62,715 72,853 82,474
95,528 99,311 98,506
Source:
Male Householder
Households and Families by Type
1980, 1990 and 2000
Married
Widowed
Divorced
Households
Family Households
Married Couple
Non-family Female Alone
U.S. Census Bureau. 1980-2000. Census of Population, Summary
File 1. Miami-Dade County Department of Planning and Zoning,
Research Section. 2001.
15 Years and Over
All Ages
Single
Married
Widowed
Divorced
15 Years and Over
Single
Figures for 1970 are for persons 14 years and older.
Marital Status groups do not add up to the total population 15 years and over because
"Married" does not include separated and other individuals.
U.S. Census Bureau. 1970. Census of Population, Detailed Population Characteristics. 1980.
Census of Population, Detailed Population Characteristics. 1990. Census of Population,
Detailed Population Characteristics. 2000. Census 2000, Summary File 3. Internet. Available
from http://factfinder.census.gov/. Miami-Dade County Department of Planning and Zoning,
Research Section. 2003 & 2005.
No Child
With Child
No Child
Non-family 2 or More Person Per Household
Non-family Male Alone
--------------------------------------------Percentages-------------------------------------------
Marital Status of Persons by Sex
Miami-Dade County, Florida
1970, 1980, 1990 & 2000
1980 1990 20001970
With Child
No Child
With Child
Female Householder
29
Page 35
2007 Acres2007 Sq.
Mile
2007
Persons Per
Acre
2007
Persons Per
Sq. Mile
30,383 1,919 3.00 15.83 10,128
3,058 249 0.39 12.28 7,841
5,148 254 0.40 20.27 12,870
3,328 407 0.64 8.18 5,200
44,604 8,903 13.91 5.01 3,207
40,468 6,547 10.23 6.18 3,956
34,472 9,563 14.94 3.60 2,307
2,523 244 0.38 10.34 6,639
9,318 3,818 5.97 2.44 1,561
951 228 0.36 4.17 2,642
228,528 14,609 22.83 15.64 10,010
20,491 2,350 3.67 8.72 5,583
57,605 9,701 15.16 5.94 3,800
59 275 0.43 0.21 137
6 3,719 5.81 0.00 1
11,433 803 1.25 14.24 9,146
1,132 3,774 5.90 0.30 192
395,434 23,363 36.50 16.93 10,834
93,721 4,968 7.76 18.86 12,077
109,200 12,161 19.00 8.98 5,747
27,027 4,153 6.49 6.51 4,164
10,323 1,591 2.49 6.49 4,146
13,643 1,920 3.00 7.11 4,548
5,736 237 0.37 24.20 15,503
60,275 5,630 8.80 10.71 6,849
40,942 3,413 5.33 12.00 7,681
15,359 2,874 4.49 5.34 3,421
25,156 5,394 8.43 4.66 2,984
19,382 4,817 7.53 4.02 2,574
10,561 1,475 2.30 7.16 4,592
18,747 646 1.01 29.02 18,561
5,775 364 0.57 15.87 10,132
14,326 506 0.79 28.31 18,134
2,354 183 0.29 12.86 8,117
5,724 454 0.71 12.61 8,062
1,095,100 1,125,092 1,757.96 0.97 623
2,462,292 1,266,606 1,979.07 1.94 1,244
Note:
Source:
County Total
SUNNY ISLES BEACH
SURFSIDE
SWEETWATER
VIRGINIA GARDENS
WEST MIAMI
UNINCORPORATED MIAMI-DADE
ISLANDIA
KEY BISCAYNE
MEDLEY
SOUTH MIAMI
MIAMI BEACH
MIAMI GARDENS
MIAMI LAKES
MIAMI SHORES
MIAMI SPRINGS
NORTH BAY VILLAGE
NORTH MIAMI
NORTH MIAMI BEACH
OPA-LOCKA
PALMETTO BAY
PINECREST
Land Area & Population Density by Acreage & Square Miles
Miami-Dade County, Florida by Municipality, 2007
NAME
AVENTURA
BAL HARBOUR
Land Area Population Density
The Town of Miami Lakes (December 2000), the Village of Palmetto Bay (September 2002),
Miami Gardens (May 2003), Doral (June 2003), and Cutler Bay (November 2005 ) were
incorporated after the date of the Census, April 1, 2000.
University of Florida. Bureau of Business and Economic Research, 2008. Miami-Dade County
Department of Planning and Zoning, Research Section, 2009.
CUTLER BAY
2007
Population
BAY HARBOR ISLANDS
BISCAYNE PARK
CORAL GABLES
MIAMI
DORAL
EL PORTAL
FLORIDA CITY
GOLDEN BEACH
HIALEAH
HIALEAH GARDENS
HOMESTEAD
INDIAN CREEK VILLAGE
30
Page 36
1996-97 1997-98 1998-99 1999-00 2000-01 2001-02 2002-03 2003-04 2004-05 2005-06 2006-07 2007-08
202 201 201 201 203 216 208 213 216 217 214 214
N/A N/A N/A N/A N/A N/A 15 13 14 15 22 27
49 52 51 51 52 59 59 63 64 68 70 75
31 31 32 33 35 36 38 39 43 47 53 62
N/A N/A N/A N/A N/A N/A N/A N/A N/A N/A 3 9
18 18 25 45 35 20 20 19 19 20 16 5
300 302 309 330 325 331 340 347 356 367 378 392
49,692 53,353 57,908 62,330 63,900 66,093 66,097 64,419 61,767 58,948 56,054 55,037
9,215 9,188 9,310 9,599 9,895 9,895 7,920 8,252 7,483 7,383 7,122 7,169
26,369 25,719 25,615 25,703 25,411 25,411 25,749 26,418 26,033 26,445 25,301 24,742
28,142 27,785 27,370 27,307 27,286 27,286 26,576 27,295 27,624 26,994 26,644 25,829
27,743 28,577 28,308 28,003 28,167 28,167 27,374 26,934 27,045 27,189 26,689 26,556
27,275 27,982 28,866 28,801 28,629 28,629 28,095 32,028 30,603 29,475 28,493 28,230
26,850 27,402 28,204 29,064 29,979 28,979 28,209 22,582 26,919 26,462 26,348 25,673
26,674 26,844 27,518 28,449 29,364 29,364 28,572 27,867 22,841 26,976 26,366 26,299
27,039 27,291 27,900 28,690 30,279 30,279 29,409 29,720 28,289 23,613 26,777 26,485
26,928 27,178 27,514 28,064 30,051 30,051 30,078 29,848 28,931 28,129 23,588 26,465
26,176 26,003 26,292 26,868 29,326 29,326 29,759 29,040 29,682 27,886 27,493 23,653
29,450 32,252 32,545 31,379 36,095 36,095 36,432 36,843 35,890 32,894 30,610 29,815
24,530 25,542 27,025 29,147 27,899 27,899 28,688 28,624 29,282 31,315 30,796 29,434
18,536 19,018 19,832 21,881 23,080 23,080 23,888 23,230 24,160 25,227 24,939 24,649
15,948 15,080 16,316 17,247 20,264 20,264 20,733 20,897 21,002 21,562 22,117 22,775
340,875 345,861 352,615 360,202 375,725 374,725 371,482 369,578 365,784 361,550 353,283 347,774
Note:
Source:
Miami-Dade County Public Schools
Enrollment by Grade
1996-97, 1997-98, 1998-99, 1999-00, 2000-01, 2001-02, 2002-03, 2003-04, 2004-05, 2005-06, 2006-07, 2007-08
Miami-Dade County Public Schools, Office of Evaluation and Research. 1989-2003. Statistical Abstracts. 2003-2008. Statistical Highlights.
Internet Available from. http://drs.dadeschools.net/. Miami-Dade County Department of Planning and Zoning, Research Section. 2009. For More
Information Call (305) 995-7503.
School Centers
Elementary
K-8 Centers*
Junior High/Middle
Senior High
Combined **
Alternative/Specialized
Total:
School Enrollment
Exceptional Education
Basic Education
Pre-Kindergarten
Kindergarten
First Grade
Second Grade
Third Grade
Fourth Grade
Fifth Grade
Sixth Grade
Twelfth Grade
Total:
"K-8 Centers" were first introduced in the 2002-03 School Year and "Combined" was first introduced in the 2006-07 School Year.
Seventh Grade
Eighth Grade
Ninth Grade
Tenth Grade
Eleventh Grade
31
Page 37
1970 1980 1990 2000
217,742 244,220 228,426 219,066
133,541 133,217 219,856 260,287
226,859 319,093 296,444 332,997
89,693 176,107 296,109 262,157
46,972 175,786 240,460 417,282
714,807 1,048,423 1,281,295 1,491,789
1970 1980 1990 2000
36,522 38,890 39,036 31,283
21,042 28,239 56,355 61,273
16,680 36,479 54,160 68,799
3,804 18,494 45,598 46,194
3,459 11,132 21,409 44,615
81,507 133,234 216,558 252,164
1970 1980 1990 2000
73,930 135,068 171,156 176,576
19,901 37,158 118,069 172,734
43,514 95,263 130,078 190,481
17,146 52,783 133,747 144,611
17,211 50,369 91,081 216,164
171,702 370,641 644,131 900,566
Note:
Source:
Educational Attainment by
Race and Hispanic Origin
Persons 25 Years Old and Over
1970, 1980, 1990, and 2000
U.S. Census Bureau. 1970-1980. Census of Population, General Social and Economic
Characteristics. 1990. Census of Population, Summary Tape File 3. 2000. Census 2000,
File 3. Internet. Available from http://factfinder.census.gov/. Miami-Dade County Department
of Planning and Zoning, Research Section. 2003 & 2005.
Data in 2000 for Blacks is for Blacks of one or more races.
College 1-3 Years includes associates degrees.
Total Persons
Elementary School
High School: 1-3 years
High School Graduate
College: 1-3 years
College Graduates
Total
Blacks
Elementary School
High School: 1-3 years
High School Graduate
College: 1-3 Years
College Graduates
Total
College Graduates
Total
Hispanics
Elementary School
High School: 1-3 years
High School Graduate
College: 1-3 Years
32
Page 38
SW 8TH ST
S D
IXIE
HW
Y
FL
OR
IDA
TP
KE
EX
T
NW
27T
H A
VE
SW
177
TH
AV
E
BIS
CA
YN
E B
LV
D
SR
82
6 E
XT
INGRAHAM HWY
CO
LL
INS
AV
E
W O
KEEC
HO
BEE R
D
I 195
SR
874 E
XT
SW
CA
RD
SO
UN
D R
D
I 95
EX
PY
I 75
EX
T
SR 836 EXT
N K
RO
ME A
VE
KR
OM
E A
VE
SR
9
SR 878
NW 36TH STSR 112
NW 119TH ST
GRATIGNY PKWY
NW
2N
D A
VE
SW
27T
H A
VE
SW 392ND ST
SW
192
ND
AV
E
ALT
ON
RD
96TH ST
BR
ICK
ELL A
VE
NE 79TH ST
SR 836 EXPY
NW 215TH ST
S D
IXIE
HW
Y
KR
OM
E A
VE
SR 826 EXT
I 95
EX
PY
N K
RO
ME
AV
E
CO
LL
INS
AV
E
Section II:
Housing
Miami-Dade County Facts
Page 39
1960 1970 1980 1990 2000
-------- -------- -------- 12,829 20,020
297 1,777 2,647 2,797 3,150
1,801 2,816 3,113 3,179 3,103
1,204 1,113 1,359 1,338 1,341
12,609 15,026 17,669 16,561 17,849
-------- -------- -------- -------- 12,413
-------- -------- -------- -------- 9,561
826 896 1,064 1,049 878
1,321 1,458 2,186 2,045 2,541
169 342 276 302 341
20,564 31,727 50,230 62,187 72,142
70 238 1,311 2,883 5,848
3,299 4,901 8,812 10,775 11,162
20 25 38 30 38
-------- 5 9 7 5
1,050 2,059 5,645 5,724 6,378
46 151 311 335 387
120,017 125,278 145,762 144,550 148,388
38,608 51,856 64,561 62,413 59,723
-------- -------- -------- -------- 30,988
-------- -------- -------- 9,016 9,000
-------- -------- 9,244 10,084 3,836
3,908 4,925 5,345 5,342 5,286
1,148 2,657 2,963 3,401 3,450
10,419 14,247 20,533 22,107 22,281
7,829 12,603 17,000 15,821 15,350
3,191 3,882 5,667 5,709 5,407
-------- -------- -------- -------- 7,913
-------- -------- -------- 5,722 6,403
3,047 7,325 4,508 4,346 4,457
-------- -------- -------- 11,772 12,946
2,151 2,288 2,441 2,814 3,059
264 1,083 2,610 4,145 4,353
643 920 917 913 925
1,771 2,023 2,186 2,082 2,112
112,674 162,287 286,975 339,010 339,244
348,946 453,908 665,382 771,288 852,278
Note:
Source:
North Miami
North. Miami Beach
Opa-locka
Palmetto Bay
Medley
Housing Units
Key Biscayne incorporated in June, 1991. Aventura incorporated in November,
1995. Pinecrest incorporated in March, 1996. Sunny Isles Beach incorporated in
June,1997. The Town of Miami Lakes (December 2000), The Village of Palmetto
Bay (September 2002), Miami Gardens (May 2003), Doral (June 2003), and
Cutler Bay (November 2005) incorporated after the date of the Census Census,
April 1, 2000. They have been classified in this table as municipalities, although
they were not incorporated on the date of the Census.
Aventura
Bal Harbour
Bay Harbor Island
Biscayne Park
Coral Gables
Cutler Bay
Doral
El Portal
Florida City
Golden Beach
Hialeah
Hialeah Gardens
Homestead
Virginia Gardens
1960, 1970, 1980, 1990 and 2000
Miami-Dade County, Florida by Municipality
Indian Creek Village
Islandia
Key Biscayne
Municipality
U.S. Census Bureau. 1960-1990. Census of Housing, Genereal Housing
Characteristics. 2000. Census 2000, Summary File PL-94-171 & Summary File
1, Table H1. Internet. Available from http://factfinder.census.gov/. Miami-Dade
County Department of Planning & Zoning, Research Section. 2003 & 2005.
Miami Springs
Miami
Miami Beach
Miami Gardens
Miami Lakes
Miami Shores
West Miami
Unincorporated Miami-Dade
County Total
Pinecrest
South Miami
Sunny Isles Beach
Surfside
Sweetwater
North Bay Village
33
Page 40
1960 1970 1980 1990 2000
348,946 453,908 665,382 771,288 852,278
308,325 428,026 609,830 692,355 776,774
183,171 231,529 332,527 375,912 449,325
125,154 196,497 277,303 316,443 327,449
3 2.91 2.63 2.75 2.84
40,621 25,882 55,552 78,933 75,504
11.6 5.7 8.3 10.2 8.9
251,357 287,095 363,982 426,959 486,641
97,097 163,024 299,811 333,598 365,637
Note:
Source:
Selected Housing Characteristics
Miami-Dade County, Florida
1960, 1970, 1980, 1990 and 2000
Single Family
Multi-Family
Structural type tabulations prior to 1990 were derived from sample data and may not sum to
complete count totals. Single-family units include 1-unit detached and attached structures,
duplexes, and mobile homes or trailers.
U.S. Census Bureau. 1960-1990 Census of Housing, General Housing Characteristics. 2000.
Census 2000 Summary File 1. Internet. Available from http://factfinder.census.gov/. Miami-Dade
County Department of Planning and Zoning, Research Section. 2003 & 2005.
Housing Characteristics
Total Housing Stock
Occupied Units
Owner Occupied
Renter Occupied
Persons Per Household
Vacant
Vacancy Rate
34
Page 41
Year UsedAverage
PriceNew
Average
PriceYear Used
Average
PriceNew
Average
Price
1980 22,449 $74,418 8,218 $81,144 1980 6,916 $77,502 12,532 $72,622
1981 18,208 $78,666 4,604 $110,531 1981 5,003 $86,392 8,496 $89,180
1982 13,282 $85,152 2,522 $105,511 1982 3,554 $83,227 5,360 $112,604
1983 18,252 $85,789 4,547 $93,353 1983 5,659 $79,286 5,446 $89,791
1984 19,149 $86,024 5,119 $91,815 1984 5,819 $74,740 5,661 $72,316
1985 19,720 $88,718 4,961 $90,037 1985 6,446 $71,580 4,910 $69,860
1986 21,719 $92,523 5,470 $91,133 1986 7,896 $70,885 4,659 $78,022
1987 23,562 $93,932 7,022 $96,669 1987 9,445 $69,208 4,702 $87,990
1988 23,770 $100,160 7,405 $102,636 1988 9,826 $70,537 4,318 $99,887
1989 22,904 $105,119 7,810 $112,213 1989 9,771 $76,653 4,224 $118,184
1990 20,482 $106,966 6,128 $120,699 1990 9,674 $75,054 4,240 $149,982
1991 18,922 $109,708 4,557 $128,700 1991 9,800 $78,908 3,325 $162,752
1992 19,912 $111,639 3,697 $128,474 1992 10,142 $80,787 2,770 $141,052
1993 24,947 $119,133 4,688 $131,061 1993 13,099 $82,057 3,204 $141,069
1994 23,448 $123,551 5,404 $130,295 1994 13,322 $85,587 3,333 $130,545
1995 21,779 $126,115 4,448 $139,910 1995 11,856 $86,939 4,504 $143,427
1996 22,465 $130,427 4,967 $144,444 1996 12,334 $89,562 4,718 $185,780
1997 22,996 $136,637 5,034 $155,544 1997 12,356 $98,396 4,460 $199,332
1998 24,868 $145,933 4,752 $152,181 1998 13,570 $104,649 4,493 $223,200
1999 27,967 $153,139 4,565 $166,410 1999 15,205 $116,394 4,767 $231,670
2000 30,338 $163,196 4,262 $188,728 2000 16,746 $133,136 4,737 $214,361
2001 31,791 $177,687 4,472 $218,965 2001 17,705 $143,753 5,974 $243,769
2002 25,294 $198,550 3,234 $233,847 2002 14,754 $164,091 3,919 $254,365
2003 35,392 $231,147 4,200 $268,734 2003 20,271 $195,186 7,210 $307,611
2004 21,708 $282,752 3,595 $253,300 2004 13,851 $234,204 4,887 $285,887
Note:
Source:
Sales SalesAverage
Price
1993 11,123 N/A N/A
1994 11,240 N/A N/A
1995 10,172 N/A N/A
1996 11,733 N/A N/A
1997 11,106 N/A N/A
1998 10,729 N/A N/A
1999 10,685 N/A N/A
2000 11,718 N/A N/A
2001 11,491 N/A N/A
2002 12,342 N/A N/A
2003 12,571 N/A N/A
2004 12,622 N/A N/A
2005 11,016 13,009 $255,100
2006 8,692 9,822 $257,500
2007 5,289 5,772 $272,000
2008 4,379 4,580 $239,400
Note:
Source:
$134,700
Florida Association of Realtors.
$375,800
$380,100
$276,600
Condominium sales were not reported prior to 2006.
$138,200
$159,600
$184,700
$223,100
$273,900
$351,200
$102,600
$107,100
$112,200$117,800
$122,400
2004 Home Sales and Condominium Counts are for sales from January through the month of June. This Data is
discontinued after 2004.
Source: Courthouse records as compiled by appraisal and Real Estate Economics Associates, Inc., (A.R.E.E.A.) Miami,
Florida, 2005.
Home Sales
Average
Price$98,300
Single Family 1980-2004 Condominiums 1980-2004
Condominiums
Year
Existing Unit Sales
Homes
35
Page 42
SW 8TH ST
S D
IXIE
HW
Y
FL
OR
IDA
TP
KE
EX
T
NW
27
TH
AV
E
SW
17
7T
H A
VE
BIS
CA
YN
E B
LV
D
SR
82
6 E
XT
INGRAHAM HWY
CO
LL
INS
AV
E
W O
KEECH
OB
EE R
D
I 195
SR
874 E
XT
SW
CA
RD
SO
UN
D R
D
I 95
EX
PY
I 75
EX
T
SR 836 EXT
N K
RO
ME A
VE
KR
OM
E A
VE
SR
9
SR 878
NW 36TH STSR 112
NW 119TH ST
GRATIGNY PKWY
NW
2N
D A
VE
SW
27
TH
AV
E
SW 392ND ST SW
19
2N
D A
VE
ALT
ON
RD
96TH ST
BR
ICK
ELL A
VE
NE 79TH ST
SR 836 EXPY
S D
IXIE
HW
Y
KR
OM
E A
VE
SR 826 EXT
I 95
EX
PY
N K
RO
ME
AV
E
CO
LL
INS
AV
E
Section III:
Labor Force and Employment
Miami-Dade County Facts
Page 43
2003 2004 2005 2006 2007
984,300 1,005,900 1,029,900 1,048,700 1,060,600
400 500 500 500 500
40,700 42,700 47,200 53,200 54,100
51,700 50,300 49,400 48,400 47,400
71,200 73,000 73,300 74,500 76,400
117,000 118,000 122,400 126,300 127,500
64,500 61,900 61,400 61,500 61,600
24,900 24,000 23,500 21,800 21,000
67,200 68,600 71,700 74,500 74,900
131,000 139,900 150,900 151,900 148,200
130,300 134,400 137,200 142,000 148,400
92,700 97,700 100,400 101,400 103,700
41,700 43,100 40,700 40,900 42,000
150,900 151,800 151,500 151,900 154,800
Source:
2003 2004 2005 2006 2007
1,097,565 1,116,533 1,142,220 1,171,423 1,190,892
64,720 61,155 51,747 44,935 44,865
5.9 5.5 4.5 3.8 3.8
Source:
Non Agricultural Employment by Industry
Miami - Miami Beach - Kendall Metro Division
2003 - 2007
Labor Force Status
Florida Agency for Workforce Innovation, Office of Workforce Innovation Services, Labor Market
Statistics, in cooperation with the U.S. Department of Labor Statistics, CES Program, Annual
Employment, 2003-2007.
Retail Trade
Transportation, Warehousing, and Utilities
Information
Financial Activities
Professional and Business Services
Education and Health Services
Leisure and Hospitality
Other Services
Total Government
Florida Agency for Workforce Innovation, Office of Workforce Innovation Services, Labor Market
Statistics, in cooperation with the U.S. Department of Labor Statistics, LAUS Program, 2003-2007.
Industry
Total Nonagricultural Employment
Mining and Logging
Construction
Manufacturing
Wholesale Trade
Civilian Labor Force
Unemployment
Unemployment Rate
Industry
Miami-Dade County, Florida
2003 - 2007
36
Page 44
Number of
Employees for
Week Including
March 12
Annual Payroll
($1,000)
Number of
Establishments
500 to 999 N/A 39
1,009 56,597 29
2,500 to 4,999 N/A 26
41,092 1,640,995 4,906
45,168 1,647,394 2,324
68,624 3,103,931 8,432
125,025 3,092,490 10,377
51,927 2,099,792 2,814
21,454 1,347,190 1,383
48,776 3,268,444 4,927
23,910 1,011,897 5,167
64,405 3,822,376 11,334
17,578 1,630,173 291
72,300 2,253,945 3,588
27,703 1,085,900 749
112,674 4,513,074 8,011
13,797 384,798 957
88,189 1,578,000 4,183
40,202 958,161 5,856
N/A N/A N/A
100 to 249 N/A 206
868,560 33,788,690 75,599
Source:
Unclassified Establishments
Total
Educational Services
Health Care and Social Assistance
Arts, Entertainment & Recreation
Accommodation & Food Services
Other Services (Except Public Administration)
Real Estate and Rental & Leasing
Professional, Scientific & Technical Services
Management of Companies & Enterprises
Admin, Support, Waste Management, Remediation Services
Auxiliaries (Except Corporate, Subsidiary & Regional Management)
Number of Employees, Establishments, and Annual Payroll
by Industry, Miami-Dade County
2006
U.S. Census Bureau, 2006. County Business Patterns, Major Industry. Internet. Available from
http://censtats.census.gov/. Miami-Dade County Department of Planning and Zoning, Research Section, 2008.
Industry
Forestry, Fishing, Hunting, and Agriculture Support
Mining
Utilities
Construction
Manufacturing
Wholesale Trade
Retail Trade
Transportation & Warehousing
Information
Finance & Insurance
37
Page 45
Employees Employees
1 12,765 54,861
2 11,760 33,653
3 11,615 17,000
4 9,000 17,000
5 8,000 11,875
6 5,144 8,500
7 5,000 5,865
8 4,500 4,600
9 4,100 2,310
10 3,952 2,044
Source:
Employees Employees
1 2,000 2,000
2 1,600 1,600
3 1,033 1,033
4 1,030 1,030
5 914 914
6 860 860
7 620 620
8 375 375
9 365 365
10 340 340
Source:
Ranking Employees
1 1,700
2 1,100
3 580
4 500
5 241
Source:
The Beacon Council, Research Department, Miami Business Profile & Relocation Guide. 2009.
The Beacon Council, Research Department, Miami Business Profile & Relocation Guide. 2009.
The Beacon Council, Research Department, Miami Business
Profile & Relocation Guide. 2009.
Company Name
University of Miami
Publix Super Markets
Baptist Health South Florida
American Airlines
Winn-Dixie Stores
United Parcel Service
Precision Response Corporation
The Home Depot
AT&T (Bell South)
Florida Power & Light Company
Miami-Dade County's Ten Largest
Financial and Telecommunication Firms in 2008
Schering-Plough
MTV Networks Latin America
Miami-Dade County's Five Largest
Biomedical Firms in 2008
HBO Latin America
Sony Broadcast Export Corporation
Telefonica Data USA
Company Name
Beckman Coulter Corporation
Boston Scientific
Teva Pharmaceuticals Industries
Noven Pharmaceuticals Incorporated
Company Name
Miami-Dade County Public Schools
Miami-Dade County
Federal Government
Florida State Government
AT&T (Bell South)
MasTec, Incorporated
Northern Trust Bank of Florida
Citigroup
Sun Trust Bank
Regions Bank
Merrill Lynch
Mellon United National Bank
Wachovia, N.A.
Bank Of America
Bank United
Ocean Bank
Terremark Worldwide, Incorporated
Discovery Networks Latin America / U.S. Hispanic
Comcast
Avaya
Miami-Dade County's Ten Largest
Private and Public Employers in 2008
Public SectorRanking
RankingFinancial Firms Telecommunication Firms
Private Sector
Homestead Airforce Base
Company NameCompany Name
Jackson Health System
Florida International University
Miami-Dade College
City of Miami
Miami VA Healthcare System
38
Page 46
1970 1980 1990
68,666 103,456 138,971
46,785 91,567 112,004
44,810 88,136 122,139
102,015 145,265 161,460
69,745 86,730 96,072
53,778 53,629 50,336
18,209 26,935 35,835
24,597 31,064 35,667
4,804 11,257 14,894
67,770 97,840 125,691
11,985 6,753 8,759
513,164 742,632 901,828
Note:
Source:
Total Male Female Total Male Female
277,979 141,669 136,310 329,536 163,946 165,590
155,842 72,505 83,337 218,805 93,557 125,248
285,279 110,059 175,220 328,516 126,213 202,303
5,427 3,688 1,739 2,244 1,103 1,141
87,382 84,593 2,789 114,016 111,328 2,688
109,299 81,010 28,289 122,990 96,265 26,725
921,208 493,524 427,684 1,116,107 592,412 523,695
Note:
Source: U.S. Census Bureau. 2000. Census 2000, Summary File 3. Internet. Available from http://factfinder.census.gov/. Miami-Dade County
Department of Planning and Zoning, Research Section. 2005.
Management, Professional, and Related Occupations
Service Occupations
Sales and Office Occupations
Farming, Fishing, and Forestry Occupations
Construction, Extration, Maintenance, and Repair Occupations
Production, Transportation, and Material Moving Occupations
Total
Classifications were substantially changed in the 2000 Census.
Employment by Occupation
Operatives, Except Transport
Transport Equipment Operatives
Laborers, Except Farm
Farm Workers
Professional, Technical, and Kindred Workers
Management and Administrators, Except Farm
Sales Workers
Clerical and Kindred Workers
Craftsmen, Foremen, and Kindred Workers
Occupation
Miami-Dade County, Florida
1970, 1980, and 1990
Service Workers
2007
Employment By Occupation and Gender
Miami-Dade County, Florida
2000 & 2007
2000Occupation
Private Household Workers
Total
Occupational titles differ somewhat between census years but groupings as shown are not seriously affected.
U.S. Census Bureau. 1970-2000. Census of Population, Summary Tape File 3-A. Miami-Dade County
Department of Planning and Zoning, Research Section. 2001.
39
Page 47
1970 1980 1990
9,682 13,708 16,926
35,648 47,414 57,017
75,763 106,607 102,372
56,202 80,804 88,273
26,788 42,254 57,029
93,600 130,509 157,772
33,816 58,761 74,499
23,191 24,759 53,884
42,186 43,270 60,317
83,565 140,344 197,100
N/A 31,959 36,189
480,441 720,389 901,378
Source:
2000 2007
6,635 5,372
63,135 99,040
65,041 67,209
55,398 58,060
113,333 132,112
69,072 87,874
28,890 22,762
73,893 93,610
106,641 133,903
165,357 210,004
84,129 95,885
51,737 66,405
37,947 43,871
921,208 1,116,107
Note:
Source:
Classifications were substantially changed in the 2000 Census.
U.S. Census Bureau. 2000. Census 2000, Summary File 3. Internet. Available from
http://factfinder.census.gov/. Miami-Dade County Department of Planning and Zoning, Research Section,
2009.
Professional and Related Services
Public Administration
Total
Employment by Industry
Miami-Dade County, Florida
2000 & 2007
Other Services (Except Public Administration)
Public Administration
Total
U.S. Census Bureau. 1970. Census of Population and Housing, Census Tract, Final Report PHC (1)-129 Miami, Florida, SMSA. 1980.
Census of Population. 1990. Census of Population, Summary Tape File 3-A. Miami-Dade County Department of Planning and Zoning,
Research Section. 2001.
Transportation, Communications, and Public Utilities
Wholesale Trade
Retail Trade
Finance, Insurance, Real Estate, and Rental & Leasing
Manufacturing
Retail Trade
Finance, Insurance, and Real Estate
Business & Repair Services
Personal Entertainment and Recreation Services
Employment by Industry
Miami-Dade County, Florida
1970, 1980, and 1990
Arts, Entertainment, Recreation, and Accommodation & Food Services
Professional, Scientific & Management, and Administrative & Waste Management Services
Industry
Agriculture, Forestry, Fisheries, and Mining
Construction
Manufacturing
Transportation, Communications and Public Utilities
Information
Educational, Health and Social Services
Wholesale Trade
Industry
Agriculture, Forestry, Fisheries, and Mining
Construction
40
Page 48
SW 8TH ST
S D
IXIE
HW
Y
FL
OR
IDA
TP
KE
EX
T
NW
27T
H A
VE
SW
177
TH
AV
E
BIS
CA
YN
E B
LV
D
SR
82
6 E
XT
INGRAHAM HWY
CO
LL
INS
AV
E
W O
KEEC
HO
BEE R
D
I 195
SR
874 E
XT
SW
CA
RD
SO
UN
D R
D
I 95
EX
PY
I 75
EX
T
SR 836 EXT
N K
RO
ME A
VE
KR
OM
E A
VE
SR
9
SR 878
NW 36TH STSR 112
NW 119TH ST
GRATIGNY PKWY
NW
2N
D A
VE
SW
27T
H A
VE
SW 392ND ST
SW
192
ND
AV
E
ALT
ON
RD
96TH ST
BR
ICK
ELL A
VE
NE 79TH ST
SR 836 EXPY
NW 215TH ST
S D
IXIE
HW
Y
KR
OM
E A
VE
SR 826 EXT
I 95
EX
PY
N K
RO
ME
AV
E
CO
LL
INS
AV
E
Part IV:
Income
Miami-Dade County Facts
Page 50
2001 2002 2003 2004 2005 2006
60,401,717 62,664,565 64,764,869 69,724,010 75,464,029 80,112,340
49,807,153 51,735,687 53,454,294 57,609,823 61,819,214 65,701,778
5,510,652 5,718,064 5,912,457 6,365,378 6,825,905 7,289,511
2,916,970 3,053,882 3,148,783 3,387,012 3,668,461 3,942,485
2,593,682 2,664,182 2,763,674 2,978,366 3,157,444 3,347,026
-5,939,536 -6,036,752 -6,140,631 -6,539,159 -6,695,408 -7,145,179
38,356,965 39,980,871 41,401,206 44,705,286 48,297,901 51,267,088
11,318,530 11,129,041 11,010,091 11,898,586 12,896,871 14,091,057
10,726,222 11,554,653 12,353,572 13,120,138 14,269,257 14,754,195
37,505,780 38,331,720 39,396,460 42,141,134 44,663,972 47,711,858
7,355,149 7,866,154 8,359,502 9,117,627 9,766,028 10,247,877
4,761,467 5,201,972 5,595,828 6,139,261 6,608,584 6,900,851
2,593,682 2,664,182 2,763,674 2,978,366 3,157,444 3,347,026
4,946,224 5,537,813 5,698,332 6,351,062 7,389,214 7,742,043
47,374 35,916 19,560 1,855 1,386 133
4,898,850 5,501,897 5,678,772 6,349,207 7,387,828 7,741,910
Note:
(A)
(B)
(C)
(E)
Source:
2001 2002 2003 2004 2005 2006
167,281 165,778 137,387 138,705 138,431 164,495
49,639,872 51,569,909 53,316,907 57,471,118 61,680,783 65,537,283
41,895,845 43,302,017 44,628,725 48,109,438 51,668,694 55,201,050
88,575 88,010 88,895 89,351 96,437 92,938
38,509 40,087 40,331 40,428 46,276 39,159
(D) (D) (D) (D) 346,745 335,427
2,338,089 2,641,635 2,979,044 3,457,060 4,016,036 4,364,492
2,584,067 2,615,627 2,620,982 2,816,778 2,850,778 2,935,069
4,038,921 4,083,560 4,349,900 4,729,016 5,059,636 5,351,883
3,760,853 3,721,868 3,776,628 3,869,632 4,250,502 4,570,125
(D) (D) (D) (D) 3,719,099 3,925,842
2,726,768 2,929,274 2,586,058 2,915,253 2,933,383 2,905,481
3,395,075 3,777,909 3,746,089 4,029,187 4,421,303 4,877,976
1,479,709 1,594,781 1,755,248 1,942,189 2,188,292 2,266,929
4,917,999 4,830,803 5,026,058 5,519,067 5,981,279 6,526,689
528,070 706,212 770,379 777,812 913,603 1,114,708
2,500,706 2,852,764 2,939,050 2,876,486 3,177,336 3,331,802
927,700 963,574 1,025,773 1,110,325 1,128,695 1,200,583
4,533,058 4,646,268 4,946,822 5,281,916 5,485,016 5,907,366
824,045 776,232 778,047 824,623 895,033 931,097
1,747,208 1,709,509 1,854,440 2,061,771 2,188,000 2,463,413
1,661,619 1,703,759 1,772,980 1,889,552 1,971,245 2,060,071
7,744,027 8,267,892 8,688,182 9,361,680 10,012,089 10,336,233
Note:
(D)
(F)
Source:
Personal Income by Major Source
2001 - 2006
Miami-Dade County, Florida
All state and local area dollar estimates are in current dollars (not adjusted for inflation).
Manufacturing
Wholesale trade
Retail trade
Transportation and warehousing
Forestry, fishing, related activities, and other (F)
Mining
Utilities
Construction
Income Items
Personal income
Earnings by place of work
Proprietors' income (E)
less: Contributions for government social insurance (A)
Employee and self-employed contributions for government social insurance
Employer contributions for government social insurance
plus: Adjustment for residence (B)
equals: Net earnings by place of residence
plus: Dividends, interest, and rent (C)
plus: Personal current transfer receipts
Wage and salary disbursements
Supplements to wages and salaries
Employer contributions for employee pension and insurance funds
Professional, scientific, and technical services
Management of companies and enterprises
Administrative and waste services
Employer contributions for government social insurance
Private earnings
Contributions for government social insurance are included in earnings by type and industry but they are excluded from personal income.
The adjustment for residence is the net inflow of the earnings of interarea commuters. For the United States, it consists of adjustments for border workers: Wage
and salary disbursements to U.S. residents commuting to Canada less wage and salary disbursements to Canadian and Mexican residents commuting into the
United States.
Rental income of persons includes the capital consumption adjustment.
Earnings by Broad Industrial Sector
2001 - 2006
Miami-Dade County, Florida
Farm proprietors' income
Nonfarm proprietors' income
Earning Items
Farm earnings
Nonfarm earnings
Not shown to avoid disclosure of confidential information, but the estimates for this item are included in the totals.
All state and local area dollar estimates are in current dollars (not adjusted for inflation).
The estimates of earnings for 2001-2006 are based on the 2002 North American Industry Classification System (NAICS).
U.S Department of Commerce, Bureau of Economic Analysis. 2001 - 2006. Regional Economic Information System. Miami-Dade County Department of Planning and
Zoning, Research Section. 2009.
Proprietors' income includes the inventory valuation adjustment and capital consumption adjustment.
"Other" consists of wage and salary disbursements to U.S. residents employed by international organizations and foreign embassies and consulates in the United
States.
U.S Department of Commerce, Bureau of Economic Analysis. 2001 - 2006. Regional Economic Information System. Miami-Dade County Department of Planning and
Zoning, Research Section. 2009.
Educational services
Health care and social assistance
Arts, entertainment, and recreation
Accommodation and food services
Other services, except public administration
Government and government enterprises
Information
Finance and insurance
Real estate and rental and leasing
41
Page 51
Families Households Families Households Families Households Families Households
101,275 199,375 64,710 133,212 50,303 107,901 26,375 77,825
65,564 94,822 43,142 66,434 37,093 58,409 31,879 56,003
114,520 148,212 85,548 122,785 79,544 111,649 72,949 108,269
69,503 81,587 76,174 104,118 73,953 100,833 65,773 95,560
42,800 49,040 84,266 108,950 91,092 121,780 91,422 123,729
32,858 38,201 131,193 156,738 220,499 276,806 287,286 371,813
426,520 611,237 485,033 692,237 552,484 777,378 575,684 833,199
$18,642 $15,571 $31,113 $26,900 $40,260 $35,966 $49,894 $43,650
$23,472 $20,402 $42,783 $37,903 $57,886 $52,753 $70,948 $63,863
50,555 N/A 68,679 121,979 80,108 140,569 67,931 127,479
23.7 32.6 13.3 19.2 9.1 13.9 4.6 9.3
15.4 15.5 8.9 9.6 6.7 7.5 5.5 6.7
26.8 24.2 17.6 17.7 14.4 14.4 12.7 13.0
16.3 13.3 15.7 15.0 13.4 13.0 11.4 11.5
10.0 8.0 17.4 15.7 16.5 15.7 15.9 14.8
7.7 6.2 27.0 22.6 39.9 35.6 49.9 44.6
100.0 100.0 100.0 100.0 100.0 100.0 100.0 100.0
11.9 N/A 14.2 17.6 14.5 18.1 11.8 15.3
Source:
Income Range199919891979
$15,000 to $24,999
Median Income
Mean Income
Below Poverty Level
Less than $10,000
Less than $10,000
$10,000 to $14,999
$25,000 to $34,999
$35,000 to $49,999
$50,000 or More
Total:
U.S. Census Bureau, Census of Population, 1980 and 1990. Census of Population, Summary Tape File 3a. 2000. Census 2000,
Summary File 3. 2007, American Community Survey. Internet. Available from http://factfinder.census.gov/. Miami-Dade
County, Department of Planning and Zoning, Research Section, 2009.
2007
Percent Distribution
Income Distribution
Families and Households
Miami-Dade County, Florida
1979, 1989, 1999, and 2007
Total:
Below Poverty Level
$10,000 to $14,999
$15,000 to $24,999
$25,000 to $34,999
$35,000 to $49,999
$50,000 or More
42
Page 52
Year United States Southeast Florida Miami-Dade
1980 10,114 8,649 9,933 10,437
1981 11,246 9,671 11,139 11,390
1982 11,935 10,258 11,715 11,955
1983 12,618 10,943 12,655 12,717
1984 13,891 12,094 13,782 13,706
1985 14,758 12,880 14,698 14,465
1986 15,442 13,525 15,438 15,010
1987 16,240 14,270 16,253 15,860
1988 17,331 15,276 17,376 16,664
1989 18,520 16,419 18,836 17,780
1990 19,477 17,266 19,564 18,374
1991 19,892 17,756 19,780 18,491
1992 20,854 18,679 20,417 18,831
1993 21,346 19,295 21,050 19,652
1994 22,172 20,114 21,666 20,005
1995 23,076 20,970 22,691 20,793
1996 24,175 21,904 23,655 21,360
1997 25,334 22,853 24,502 21,888
1998 26,883 24,155 25,987 23,216
1999 27,939 25,032 26,894 24,050
2000 29,845 26,483 28,508 25,631
2001 30,574 27,347 29,277 26,445
2002 30,821 27,740 29,727 27,147
2003 31,504 28,355 30,330 27,891
2004 33,123 29,935 32,618 29,817
2005 34,757 31,355 34,798 32,025
2006 36,714 33,212 36,720 33,712
Note:
Source:
All state and local area dollar estimates are in current dollars (not
adjusted for inflation).
U.S. Department of Commerce, Economics and Statistics
Administration, Bureau of Economic Analysis. Regional Economic
Information System Table CA1-3. 1969-2006. February 2009. Miami-
Dade County Department of Planning and Zoning, Research Section,
2009.
Per Capita Personal Income 1980 - 2006
(Current $)
43
Page 53
SW 8TH ST
S D
IXIE
HW
Y
FL
OR
IDA
TP
KE
EX
T
NW
27T
H A
VE
SW
177
TH
AV
E
BIS
CA
YN
E B
LV
D
SR
82
6 E
XT
INGRAHAM HWY
CO
LL
INS
AV
E
W O
KEEC
HO
BEE R
D
I 195
SR
874 E
XT
SW
CA
RD
SO
UN
D R
D
I 95
EX
PY
I 75
EX
T
SR 836 EXT
N K
RO
ME A
VE
KR
OM
E A
VE
SR
9
SR 878
NW 36TH STSR 112
NW 119TH ST
GRATIGNY PKWY
NW
2N
D A
VE
SW
27T
H A
VE
SW 392ND ST
SW
192
ND
AV
E
ALT
ON
RD
96TH ST
BR
ICK
ELL A
VE
NE 79TH ST
SR 836 EXPY
NW 215TH ST
S D
IXIE
HW
Y
KR
OM
E A
VE
SR 826 EXT
I 95
EX
PY
N K
RO
ME
AV
E
CO
LL
INS
AV
E
Part V:Other Economic Information
Miami-Dade County Facts
Page 54
YearTotal
Customers
Commercial
Customers
1972 518,406 43,882
1973 540,709 52,009
1974 557,017 52,594
1975 565,093 53,928
1976 579,932 55,774
1977 598,476 57,635
1978 619,086 60,053
1979 638,580 62,420
1980 656,302 65,118
1981 666,576 67,735
1982 675,636 70,326
1983 690,854 73,733
1984 700,156 76,843
1985 715,834 80,018
1986 734,894 83,524
1987 765,611 88,500
1988 773,277 89,265
1989 790,414 91,544
1990 805,656 93,518
1991 816,245 95,481
1992 816,213 97,007
1993 830,189 98,055
1994 839,872 99,361
1995 849,876 100,701
1996 858,103 102,026
1997 866,912 103,356
1998 874,130 103,545
1999 887,657 104,428
2000 896,736 107,897
2001 908,597 109,782
2002 920,563 111,057
2003 936,083 112,873
2004 951,090 115,789
2005 996,906 148,460
2006 979,084 119,971
2007 998,204 122,303
2008 1,008,149 122,957
Note:
Source:
Electric Customers
1972-2008
Number of Customers in December of each year.
Florida Power and Light Company, Miami, Florida.
For additional information please contact Florida
Power and Light Company at: 305-588-8359.
44
Page 55
Year All VehiclesPassenger
Vehicles
1973-74 1,012,724 815,147
1974-75 1,040,047 838,036
1975-76 1,308,216 843,124
1976-77 1,751,965 1,197,046
1977-78 1,394,579 922,829
1978-79 1,287,053 939,818
1980-81 1,288,067 1,019,642
1981-82 1,288,844 1,001,638
1982-83 1,453,991 1,132,284
1983-84 1,470,024 1,140,366
1984-85 1,589,173 1,231,195
1985-86 1,608,982 1,239,411
1986-87 1,681,087 1,306,743
1987-88 1,746,834 1,336,087
1988-89 1,753,322 1,342,816
1989-90 1,804,221 1,362,823
1990-91 1,978,169 1,215,315
1991-92 2,272,812 1,243,783
1992-93 2,284,759 1,172,260
1993-94 2,274,404 1,176,754
1994-95 2,204,356 1,164,304
1995-96 2,426,683 1,286,815
1996-97 2,421,725 1,304,411
1997-98 2,401,647 1,269,501
1998-99 2,392,339 1,290,001
1999-00 2,420,074 1,305,357
2000-01 2,533,220 1,481,239
2001-02 1,916,980 1,286,282
2002-03 2,008,064 1,351,914
2003-04 N/A N/A
2004-05 2,094,012 1,412,665
2005-06 2,183,782 1,450,420
Note:
Source:
Motor Vehicle License Tags
1973 - 2006
State of Florida, Department of Highway Safety and Motor Vehicles, Tag
and Revenue Report (Tallahassee, Florida). Miami-Dade County. 1975-
1978 Auto Tag Agency estimate. Bureau of Economic Research and
Business Research (BEBR) 2002-2007. Florida Statistical Abstract.
Miami-Dade County Department of Planning & Zoning 2009.
Decrease in passenger vehicle for the years 92-95 is due to the effects
of Hurricane Andrew as well as an increase in tags for jeeps and small
trucks not classified as passenger cars.
Tags are not Just for motor vehicles. The Department of Highway
Safety and Motor Vehicles is unable to disaggregate vehicle by type.
Number of vehicles is also a count of any type of transaction, i.e. initial
issue, renewal, cancellation, voids, etc. For additional information
contact David Perryman at (850) 488-6710.
The U.S. Census Bureau (Census 2000, Summary File 3, Table H46)
Estimates the aggregate number of vehicles available for households in
Miami-Dade County to be 1,169,401.
45
Page 56
YearPort of Miami
Passengers
Cargo
Tonnage
Miami
International
Airport
Passengers
Freight
Tonnage
1971 685,990 ---------- 11,176,739 ----------
1972 678,397 ---------- 12,266,378 ----------
1973 851,164 ---------- 12,722,239 ----------
1974 728,201 ---------- 12,443,885 ----------
1975 804,926 ---------- 12,068,118 372,727
1976 1,029,687 1,540,000 12,884,153 403,896
1977 947,093 1,710,000 13,736,483 493,999
1978 982,275 1,922,864 16,500,738 513,296
1979 1,328,816 2,251,958 19,627,851 533,622
1980 1,546,230 2,485,791 20,506,760 567,914
1981 1,547,137 2,760,000 19,848,593 589,582
1982 1,760,255 2,665,921 19,387,619 576,367
1983 2,002,654 2,305,645 19,321,718 541,734
1984 2,217,065 2,287,281 19,328,057 511,480
1985 2,326,685 2,333,026 19,853,352 510,164
1986 2,520,571 2,406,084 21,947,368 553,123
1987 2,633,041 2,425,937 23,966,825 619,135
1988 2,502,411 2,602,556 24,525,302 757,217
1989 3,100,055 3,206,417 23,385,010 818,978
1990 2,734,816 3,590,937 25,837,445 966,443
1991 2,928,532 3,882,284 26,591,415 902,767
1992 3,095,487 4,596,481 26,483,717 1,037,599
1993 3,049,838 5,264,795 28,660,396 1,221,712
1994 2,967,081 5,574,242 30,203,269 1,390,067
1995 2,974,703 5,840,815 33,235,658 1,668,308
1996 3,052,450 5,859,538 33,504,579 1,799,511
1997 3,191,885 7,078,028 34,533,268 1,855,922
1998 2,960,264 7,199,531 33,935,491 1,885,229
1999 3,112,355 6,930,372 33,899,332 1,727,353
2000 3,364,643 7,804,946 33,621,273 1,717,511
2001 3,391,091 8,247,004 31,668,450 1,729,052
2002 3,642,990 8,681,735 30,060,241 1,747,399
2003 3,960,614 9,002,359 29,595,618 1,757,098
2004 3,499,584 9,230,036 30,165,197 1,912,217
2005 3,605,201 9,473,852 31,008,453 1,894,241
2006 3,731,459 8,654,371 32,533,974 1,975,764
2007 3,787,410 7,835,132 33,740,416 2,076,898
2008 4,218,847 7,353,841 34,063,531 1,944,879
Source:
Passengers and Cargo / Freight Tonnage - Port of Miami and Miami International Airport
1971-2008
Miami-Dade County Seaport Department, Port of Miami Office of the Port Director. 1950-1975. Operating
Statistics & Performance(Statistical) Report. 1976-2002. Fiscal Year Reports, 2004-2007. Port of Miami
Statistics, 2008. Miami-Dade County Aviation Department, Miami International Airport, Marketing Division.
1971-2008. Miami International Airport Traffic Report. Miami-Dade County Department of Planning &
Zoning, Research Section. 2009.
46
Page 57
Index Ranking Index Ranking Index Ranking Index Ranking Index Ranking Index Ranking
Collier 104.47 1 104.81 1 106.84 1 106.50 1 106.52 1 107.01 1
Palm Beach 103.61 2 103.39 2 104.52 2 104.63 2 104.50 2 105.48 2
Broward 102.96 4 103.11 3 103.76 3 103.26 3 103.46 3 103.29 3
Lee 100.24 11 100.25 10 101.40 8 101.76 6 101.80 5 102.06 4
Duval 102.95 5 102.29 5 101.95 6 101.79 5 101.74 7 101.93 5
Hillsborough 101.18 8 101.06 8 101.69 7 102.13 4 102.10 4 101.71 6
Sarasota 98.45 26 98.56 18 99.32 14 100.44 11 100.50 11 101.71 7
Orange 101.63 7 101.17 7 100.99 9 101.19 8 101.20 9 101.13 8
Miami-Dade 100.34 9 102.03 6 102.00 5 101.64 7 101.79 6 101.06 9
Monroe 101.66 6 103.06 4 103.32 4 100.96 9 101.32 8 100.85 10
Note:
Source:
Florida Price Level Index
2003 - 2008
Table shows comparative price level differentials for Miami-Dade County among the counties of the State of Florida.
Office of Planning and Budgeting, State of Florida. 1981-2008. Florida Price Level Index. Bureau of Economic and Business
Research, Warrington College of Business Administration. 2002-2008. Florida Statistical Abstract. Miami-Dade County
Department of Planning and Zoning, Research Section. 2009.
200820072006200520042003County
for Selected Counties
47
Page 58
Year
Annual Average of CPI-u
Index-Miami (1982-
1984=100) Unadjusted
CPI-U Percent
Change to Current
Year From Year Ago
1977 62.1
1978 64.8 4.2
1979 71.2 9.9
1980 81.1 13.9
1981 90.5 11.6
1982 96.7 6.9
1983 99.9 3.3
1984 103.5 3.6
1985 106.5 2.9
1986 107.9 1.3
1987 111.8 3.6
1988 116.8 4.5
1989 121.5 4.0
1990 128.0 5.3
1991 132.3 3.4
1992 134.5 1.7
1993 139.1 3.4
1994 143.6 3.2
1995 148.9 3.7
1996 153.7 3.2
1997 158.4 3.1
1998 160.5 1.3
1999 162.4 1.2
2000 167.8 3.3
2001 173.0 3.1
2002 175.5 1.4
2003 180.6 2.9
2004 185.6 2.8
2005 194.3 4.7
2006 203.9 4.9
2007 212.4 4.2
2008 222.1 4.6
Note:
Source:
Miami CMSA
Consumer Price Index
1977-2008
CPI-U Consumer Price Index for all Urban
Consumers.
Department of Labor, Bureau of Labor Statistics.
1977-2008. Computations by Miami-Dade County,
Department of Planning and Zoning, Research
Section, 2009.
48
Page 59
All - Items
Index
224.2
146.5
115.3
137.4
173.6
125.8
132.3
100.9
92.6
90.9
97.5
116.3
124.6
101.1
112.1
Note:
Source:
All - Items
Index
146.5
115.3
90.9
101.1
152.2
136.1
116.3
92.6
156.2
100.9
125.8
118.1
124.6
122.7
157.4
Note:
Source:
Cost of Living Comparisons for the 15 Largest Metropolitan Areas
Third Quarter 2008
Metropolitan Areas
Metropolitan Areas are based on 2000 Census guidelines.
New York--Northern New Jersey--Long Island, NY--NJ--CT--PA CMSA
Los Angeles--Riverside--Orange County, CA CMSA
Chicago--Gary--Kenosha, IL--IN--WI CMSA
Washington--Baltimore, DC--MD--VA--WV CMSA
San Francisco--Oakland--San Jose, CA CMSA
Philadelphia--Wilmington--Atlantic City, PA--NJ--DE--MD CMSA
Boston--Worcester--Lawrence, MA--NH--ME--CT CMSA
Detroit--Ann Arbor--Flint, MI CMSA
Dallas--Fort Worth, TX CMSA
Houston--Galveston--Brazoria, TX CMSA
Atlanta, GA MSA
Miami--Fort Lauderdale, FL CMSA
Broward (Fort Lauderdale), FL
Santa Clara (San Jose), CA
Seattle--Tacoma--Bremerton, WA CMSA
Phoenix--Mesa, AZ MSA
Minneapolis--St. Paul, MN--WI MSA
County
Los Angeles, CA
American Chamber of Commerce Researchers Association. 2008. ACCRA Cost of Living
Index, Third Quarter.
American Chamber of Commerce Researchers Association. 2008. ACCRA Cost of Living
Index, Third Quarter.
Cost of Living Comparisons for the 15 Largest Counties
Third Quarter 2008
Queens (New York), NY
Wayne (Detroit), CA
San Bernandino, CA
Riverside, CA
King (Seattle), WA
Orange (Anaheim), CA
San Diego, CA
Miami-Dade (Miami), FL
Dallas, TX
New York City comprises of the following Counties (Burroughs): New York (Manhattan),
Bronx, Kings (Brooklyn), Queens, and Richmond (Staten Island).
Cook (Chicago), IL
Harris (Houston), TX
Maricopa (Phoenix), AZ
49
Page 60
SW 8TH ST
S D
IXIE
HW
Y
FL
OR
IDA
TP
KE
EX
T
NW
27T
H A
VE
SW
177
TH
AV
E
BIS
CA
YN
E B
LV
D
SR
82
6 E
XT
INGRAHAM HWY
CO
LL
INS
AV
E
W O
KEEC
HO
BEE R
D
I 195
SR
874 E
XT
SW
CA
RD
SO
UN
D R
D
I 95
EX
PY
I 75
EX
T
SR 836 EXT
N K
RO
ME A
VE
KR
OM
E A
VE
SR
9
SR 878
NW 36TH STSR 112
NW 119TH ST
GRATIGNY PKWY
NW
2N
D A
VE
SW
27T
H A
VE
SW 392ND ST
SW
192
ND
AV
E
ALT
ON
RD
96TH ST
BR
ICK
ELL A
VE
NE 79TH ST
SR 836 EXPY
NW 215TH ST
S D
IXIE
HW
Y
KR
OM
E A
VE
SR 826 EXT
I 95
EX
PY
N K
RO
ME
AV
E
CO
LL
INS
AV
E
Part VI:
Other Information
Miami-Dade County Facts
Page 61
Other
City /
UMSA
Millage
Debt
Service
Misc.
Millage
Operating
Millage
Debt
ServiceEvr Proj.
So Fla Wtr
MgmtFIND
County
Millage
Debt
Service
Fire &
RescueFire Debt Library
Children's
Trust
0100 Miami 7.6740 0.5803 7.5330 0.2640 4.8379 0.5346 0.0345 4.8379 0.2850 0.3822 0.4212 22.6361 22.1551
0101 Miami (DDA) 0.5803 0.5000 7.5330 0.2640 4.8379 0.5346 0.0345 4.8379 0.2850 0.3822 0.4212 23.1361 22.6551
0200 Miami Beach 0.2375 7.5330 0.2640 4.8379 0.5346 0.0345 4.8379 0.2850 0.3822 0.4212 20.2748 20.1746
0201 Miami Beach 0.2375 0.7227 7.5330 0.2640 4.8379 0.5346 0.0345 4.8379 0.2850 0.3822 0.4212 20.9975 21.2109
0300 Coral Gables 7.5330 0.2640 4.8379 0.5346 0.0345 4.8379 0.2850 0.3822 0.4212 19.6318 19.5276
0400 Hialeah 7.5330 0.2640 4.8379 0.5346 0.0345 4.8379 0.2850 0.4212 20.5396 20.4334
0500 Miami Springs 0.3687 7.5330 0.2640 4.8379 0.5346 0.0345 4.8379 0.2850 2.1851 0.0420 0.3822 0.4212 23.4081 23.1842
0600 North Miami 0.1376 7.5330 0.2640 4.8379 0.5346 0.0345 4.8379 0.2850 2.1851 0.0420 0.4212 23.2838 23.0739
0700 North Miami Beach 0.8139 7.5330 0.2640 4.8379 0.5346 0.0345 4.8379 0.2850 2.1851 0.0420 0.4212 23.6642 23.6215
0701 North Miami Beach 0.8139 7.5330 0.2640 4.8379 0.5346 0.0345 4.8379 0.2850 2.1851 0.0420 0.4212 17.0406 16.9310
0800 Opa-Locka 7.5330 0.2640 4.8379 0.5346 0.0345 4.8379 0.2850 2.1851 0.0420 0.3822 0.4212 24.8173 24.5347
0801 Opa-Locka 7.5330 0.2640 4.8379 0.5346 0.0345 4.8379 0.2850 2.1851 0.0420 0.3822 0.4212 16.6089 16.5263
0900 South Miami 7.5330 0.2640 4.8379 0.5346 0.0345 4.8379 0.2850 2.1851 0.0420 0.3822 0.4212 21.8879 21.3443
1000 Homestead 7.5330 0.2640 4.8379 0.5346 0.0345 4.8379 0.2850 2.1851 0.0420 0.3822 0.4212 21.9499 21.6848
1100 Miami Shores 0.6578 7.5330 0.2640 4.8379 0.5346 0.0345 4.8379 0.2850 2.1851 0.0420 0.4212 24.5196 23.9585
1200 Bal Harbour 7.5330 0.2640 4.8379 0.5346 0.0345 4.8379 0.2850 2.1851 0.0420 0.4212 18.5352 18.4616
1300 Bay Harbor Islands 7.5330 0.2640 4.8379 0.5346 0.0345 4.8379 0.2850 2.1851 0.0420 0.4212 20.2017 19.7986
1400 Surfside 7.5330 0.2640 4.8379 0.5346 0.0345 4.8379 0.2850 2.1851 0.0420 0.4212 20.9599 20.3921
1500 West Miami 7.5330 0.2640 4.8379 0.5346 0.0345 4.8379 0.2850 2.1851 0.0420 0.3822 0.4212 23.3465 23.2639
1600 Florida City 7.5330 0.2640 4.8379 0.5346 0.0345 4.8379 0.2850 2.1851 0.0420 0.3822 0.4212 24.3589 24.2763
1700 Biscayne Park 7.5330 0.2640 4.8379 0.5346 0.0345 4.8379 0.2850 2.1851 0.0420 0.3822 0.4212 25.4992 24.8663
1800 El Portal 7.5330 0.2640 4.8379 0.5346 0.0345 4.8379 0.2850 2.1851 0.0420 0.3822 0.4212 24.4531 23.5575
1900 Golden Beach 0.8950 7.5330 0.2640 4.8379 0.5346 0.0345 4.8379 0.2850 2.1851 0.0420 0.3822 0.4212 25.1089 25.0263
2000 Pinecrest 7.5330 0.2640 4.8379 0.5346 0.0345 4.8379 0.2850 2.1851 0.0420 0.3822 0.4212 18.5898 18.4763
2100 Indian Creek 0.4500 7.5330 0.2640 4.8379 0.5346 0.0345 4.8379 0.2850 2.1851 0.0420 0.3822 0.4212 23.5589 23.4763
2200 Medley 7.5330 0.2640 4.8379 0.5346 0.0345 4.8379 0.2850 2.1851 0.0420 0.3822 0.4212 22.3089 22.2776
2300 North Bay Village 0.1290 7.5330 0.2640 4.8379 0.5346 0.0345 4.8379 0.2850 2.1851 0.0420 0.3822 0.4212 21.4076 21.3250
2400 Key Biscayne 7.5330 0.2640 4.8379 0.5346 0.0345 4.8379 0.2850 0.3822 0.4212 17.5818 17.4776
2500 Sweetwater 7.5330 0.2640 4.8379 0.5346 0.0345 4.8379 0.2850 2.1851 0.0420 0.3822 0.4212 20.0126 19.8049
2600 Virginia Gardens 7.5330 0.2640 4.8379 0.5346 0.0345 4.8379 0.2850 2.1851 0.0420 0.3822 0.4212 20.6997 20.6073
2700 Hialeah Gardens 7.5330 0.2640 4.8379 0.5346 0.0345 4.8379 0.2850 2.1851 0.0420 0.3822 0.4212 21.5089 21.4353
2800 Aventura 7.5330 0.2640 4.8379 0.5346 0.0345 4.8379 0.2850 2.1851 0.0420 0.3822 0.4212 18.3350 18.2524
2900 Islandia 7.5330 0.2640 4.8379 0.5346 0.0345 4.8379 0.2850 2.1851 0.0420 0.3822 0.4212 23.4132 24.4934
3000 Unincorporated County 7.5330 0.2640 4.8379 0.5346 0.0345 4.8379 0.2850 2.1851 0.0420 0.3822 0.4212 18.6172 18.5679
3100 Sunny Isles 7.5330 0.2640 4.8379 0.5346 0.0345 4.8379 0.2850 2.1851 0.0420 0.3822 0.4212 19.0931 18.9242
3200 Miami Lakes 7.5330 0.2640 4.8379 0.5346 0.0345 4.8379 0.2850 2.1851 0.0420 0.3822 0.4212 19.0884 19.0058
3300 Palmetto Bay 7.5330 0.2640 4.8379 0.5346 0.0345 4.8379 0.2850 2.1851 0.0420 0.3822 0.4212 19.0565 18.8999
3400 Miami Gardens 7.5330 0.2640 4.8379 0.5346 0.0345 4.8379 0.2850 2.1851 0.0420 0.3822 0.4212 21.7491 21.6751
3500 Doral 7.5330 0.2640 4.8379 0.5346 0.0345 4.8379 0.2850 2.1851 0.0420 0.3822 0.4212 19.0559 18.9733
3600 Cutler Bay 7.5330 0.2640 4.8379 0.5346 0.0345 4.8379 0.2850 2.1851 0.0420 0.3822 0.4212 19.0559 18.9733
Source: Miami-Dade County Property Tax Appraiser, 2008. For more information contact the Miami-Dade County Property Appraiser at 305-375-4099.
This chart shows in dollars and cents the amount paid to each taxing body for every $1,000 of assessed value. Refer to "Mill Code" on this chart to determine rates applicable. Where street lighting
and improvement districts are involved, the code number identifying the district is shown on your Tax Bill.
Millages Applicable to Property Tax Assessments
2008 Adopted Millage Chart
Millage Code Municipalities or County Areas
City / Unincorporated
Millages
School Millages Regional Millages County Wide Millages
Total Millage 2008 Total Millage 2007
50
Page 62
Hospital Beds
1 Anne Bates Leach Eye Hospital 100
2 Aventura Hospital and Medical Center 407
3 Baptist Hospital of Miami 584
4 Coral Gables Hospital 256
5 Doctors Hospital Inc 281
6 Douglas Gardens Hospital 32
7 HealthSouth Rehabilitation Hospital of Miami 60
8 Hialeah Hospital 378
9 Homestead Hospital 142
10 Jackson Memorial Hospital 1,498
11 Jackson Memorial Hospital - North 60
12 Jackson North Medical Center (PRMC) 382
13 Jackson South Community Hospital 199
14 Kendall Regional Medical Center 412
15 Kindred Hospital South Florida Coral Gables 53
16 Larkin Commity Hospital 132
17 Mercy Hospital 473
18 Metropolitan Hospital of Miami (PAH) 146
19 Miami Children's Hospital 289
20 Mount Sinai Medical Center 955
21 North Shore Medical Center 357
22 Palm Springs General Hospital 247
23 Palmetto General Hospital 360
24 Select Specialty Hospital - Miami 47
25 Sister Emmanuel Hospital for Continuing Care 29
26 South Beach Community Hospital (SSHMC) 131
27 South Florida Evaluation and Treatment Center 238
28 South Miami Hospital 445
29 Southern Winds Hospital 72
30 St. Catherine's Rehabilitation Hospital 60
31 University of Miami Hospital (CMC) 560
32 University of Miami Hospital and Clinics 40
33 West Gables Rehabilitation Hospital (MRHWG) 60
34 Westchester General Hospital 125
Total Licensed Beds: 9,610
Source:
Miami-Dade County Hospitals and Licensed Beds
2008
Agency for Health Care Administration (AHCA), Certificate of Need Office.
http://floridahealthfinder.gov/. 2008.
51
Page 63
1999 2000 2001 2002 2003 2004 2005 2006 2007
6,179 6,025 6,236 6,168 6,356 6,371 6,361 6,346 6,451
228 231 257 259 269 274 307 305 163
1,389 1,317 1,369 1,337 1,391 1,355 1,417 1,415 1,443
610 623 731 792 865 876 944 961 1,022
N/A N/A N/A N/A N/A 1,893 2,025 3,992 4,217
301 296 334 334 339 335 353 353 353
227 210 205 215 219 216 230 232 221
169 167 190 187 205 190 191 192 190
455 498 486 538 531 566 578 595 601
1,124 804 813 844 904 865 899 838 924
N/A 1,770 1,702 2,015 1,928 2,251 2,597 2,463 3,143
102 88 81 77 83 88 81 84 84
559 550 588 588 635 619 673 679 689
13,412 13,295 13,243 13,270 13,972 14,302 14,797 15,125 15,969
3,531 3,780 3,440 3,803 3,711 4,069 3,861 4,091 4,748
542 501 496 460 473 478 457 459 465
1,547 1,559 1,513 1,585 1,531 1,607 1,710 1,658 1,754
N/A N/A N/A N/A N/A 402 437 503 550
30,375 31,714 31,684 32,472 33,412 36,757 37,918 40,291 42,987
Note:
Source:
Nursing Home Administrators
Psychologists
Registered Nurses
Total:
Massage Therapists were not counted before the year 2000 , Dental Radiographers and Pharmacist Interns were not counted before the
year 2005.
Practical Nurses
Dispensing Opticians
Pharmacists
Pharmacist Interns*
Licensed Health Professionals
1999 - 2007
Bureau of Economic and Business Research. 1999-2007. Florida Statistical Abstract.
Occupation
Medical Doctors
Osteaopathic Doctors
Dentists
Dental Hygienists
Dental Radiographers*
Chiropractors
Optometrists
Podiatrists
Occupational Therapists
Physical Therapists
Massage Therapists*
52
Page 64
Subtropical Marine
76.7 Degrees
69.1 Degrees
84.2 Degrees
98 Degrees
30 Degrees
68
58.53 Inches
70 Percent
Morning: 83 Percent
Afternoon: 61 Percent
9.2
12
Source: Bureau of Economic and Business Research. 2007. Florida Statistical Abstract.
Elevation (feet)
Number of 90 Degree Days
Average Annual Precipitation
Average Annual Percentage Probability of Sunshine
Average Annual Relative Humidity
Annual Average Low Temperature
Annual Average High Temperature
Highest Temperature of Record
Lowest Temperature of Record
Average Annual Wind Speed (mph)
Climate Characteristics
Miami-Dade County, Florida
2006
Climate
Annual Average Temperature
53
Page 65
Total
NumberTotal Acres
Everglades National Park 1 521,591.00
Biscayne National Park 1 181,000.00
Total 2 702,591.00
Everglades Wildlife Management Area 1 223,827.00
Southern Glades Wildlife & Environmental Areas 1 25,894.00
Biscayne Bay State Aquatic Preserve 1 227,000.00
Turkey Point Wilderness Area 1 2,505.00
Dade Erosion Control Line Beach 1 363.64
Bal Harbor Erosion Control Line 1 4.10
Key Biscayne Erosion Control Line 1 14.72
40 - Mile Bend Boat Ramp 1 0.50
Black Canal Boat Ramp 1 0.50
Canal 111 Access Area 1 1.00
Glenn Garret Memorial Day-Use Area 1 10.00
S-12C Access Area Boat Ramp 1 5.00
S-12D Access Area Boat Ramp 1 5.00
Tamiami Boat Ramp Site #2 1 2.00
Trinity Mile Bend Recreation Area 1 8.00
Total 15 479,640.46
Bill Baggs Cape Florida 1 756.00
Oleta State Recreational Area 1 853.06
Julia Tuttle Causeway 1 30.00
The Barnacle State Historic Site 1 10.00
Total 4 1,649.06
District 1 102.83
Greenways 22 426.40
Greenways - Right of Way 2 16.42
Metropolitan 15 4,357.13
Natural Area Preserve 12 1,763.86
Single Purpose 1 49.13
Special Activity 24 3,435.04
Total 77 10,150.81
Community 52 1,037.48
District 7 1,550.90
Mini-Park 33 20.53
Neighborhood 78 427.50
Single Purpose 10 124.10
Total 180 3,160.51
257 13,311.32
Greenways 6 10.30
Metropolitan 2 47.32
Mini-Park 1 0.15
Nature 3 35.85
Special Activity 26 1,242.30
Special Tax 1 0.74
Total 39 1,336.66
Community/Neighborhood 224 1,594.61
District 2 751.01
Metropolitan 1 0.50
Mini-Park 179 99.92
Nature 3 15.16
Single Purpose 26 485.21
Special Activity 4 39.31
Specialized 2 23.08
N/A 1 0.24
Total 442 3,009.04
Greenways 1 0.57
Single Purpose 2 10.49
N/A 1 2.43
4 13.49
485 4,359.19
Note:
Source:
State Parks
National Parks
State Water Conservation and Wildlife Mgmt. Areas
Parks and Recreational Areas
Miami-Dade County, Florida 2009
Categories
Municipal Area-Wide Parks
Numbers for Federal and State Parks/Properties have not been changed/updated since 2001.
Miami-Dade County Park and Recreation Department Planning and Research Division, 2009.
County Local Parks
County Area-Wide Parks
County (Area -Wide and Local) Parks Total
Municipal Parks Total
Municipal Local Parks
Municipal Unclassified Parks
54
Page 66
Land Use
CodesLand Use 2004 Acres 2006 Acres 2008Acres
Acres in 2004
Within UDB
Acres in 2006
Within UDB
Acres in 2008
Within UDB
Acres in 2004
Outside UDB
Acres in 2006
Outside UDB
Acres in 2008
Outside UDB
0 RESIDENTIAL 101,900.45 107,593.28 109,432.37 97,184.87 101,619.09 101,794.20 4,715.58 5,974.19 7,638.17
100 COMMERCIAL & OFFICE 13,295.84 14,024.21 14,012.94 13,167.78 13,889.48 13,826.79 128.06 134.74 186.15
200 HOTELS, MOTELS, & OTHER TRANSIENT RESIDENTIAL 742.72 750.76 740.69 725.19 733.23 723.29 17.53 17.53 17.40
300 INDUSTRIAL 16,573.49 16,655.35 17,374.49 11,979.06 12,156.20 12,346.44 4,594.43 4,499.15 5,028.05
400 INSTITUTIONAL 13,123.46 13,511.31 13,952.47 12,404.26 12,754.02 13,139.48 719.21 757.28 813.00
500 PARKS & RECREATIONAL OPEN SPACE 789,943.63 789,543.76 786,694.59 21,436.53 21,292.98 22,024.22 768,507.10 768,250.78 764,670.37
600 TRANSPORTATION, COMMUNICATIONS, UTILITIES 87,250.13 86,592.96 87,243.26 66,221.42 67,403.04 68,325.46 21,028.71 19,189.92 18,917.80
700 AGRICULTURE 73,598.32 68,918.56 62,187.39 11,087.94 7,804.09 6,105.17 62,510.38 61,114.47 56,082.22
800 UNDEVELOPED 135,691.75 133,844.74 138,160.65 20,642.77 16,970.22 17,157.76 115,048.97 116,874.53 121,002.90
900 INLAND WATER 25,541.62 39,273.71 40,910.53 12,381.80 13,117.99 13,591.17 13,159.82 26,155.72 27,319.36
930 COASTAL WATER, BAY & OCEAN 291,080.83 278,002.96 278,003.20 34,096.72 0.00 0.00 256,984.11 278,002.96 278,003.20
Total For All Land Uses 1,548,742.23 1,548,711.58 1,548,712.59 301,328.33 267,740.32 269,033.97 1,247,413.91 1,280,971.26 1,279,678.62
Inventory Of Land Uses In Miami-Dade County
Inside and Outside the Urban Development Boundary (UDB)
2004, 2006, and 2008
Source: Miami-Dade County Department Of Planning and Zoning, Planning Division, Research Section, 2009.
55
Page 67
Federal
Federal Information Center 1-800-688-9889
Consumer Product Safety Commission 1-800-638-2772
Department of Education 1-800-872-5327
U.S. Department of Housing and Urban Development 1-800-225-5342
Food and Drug Administration 305-526-2919
U.S. Citizenship and Immigration Services 1-800-375-5283
U.S. Department of Labor 305-596-9874
Social Security Administration 1-800-772-1213
U.S. Census Bureau 1-800-424-6974
U.S. Census Bureau (2010 Census Employment Hotline) 1-866-861-2010
or 954-302-3972
U.S. Department of Health and Human Services 1-877-696-6775
State
State of Florida Information 1-866-693-6748
Bureau of Economic and Business Research 352-392-0171
Florida Department of Children & Families 850-494-5769
Department of Highway Safety & Motor Vehicles 850-617-2000
South Florida Regional Planning Council 1-800-985-4416
South Florida Water Management District 305-592-5680
State Attorney's Office 305-530-2600
University of Florida 352-392-0171
Utility Concerns (Public Service Comm.) 1-800-342-3552
County
Government Information Center (Formerly Handled by Team Metro) 305-468-5900
or 311
Animal Care and Control 305-884-1101
Auto Tag Agency 305-375-5678
Center for the Fine Arts 305-375-3000
Clerk of Courts 305-275-1155
County Manager 305-375-5311
Elections Department (Voter's Information) 305-375-5553
Environmental Management (DERM) 305-372-6789
Human Resources 305-375-5416
Job Information Hotline 305-375-1871
Library Systems 305-375-2665
Public Works 305-375-2694
Viscaya Museum and Gardens 305-250-9133
Water and Sewer Authority (Customer Service) 305-665-7471
Planning & Zoning Information 305-375-2800
Zoo (Metrozoo) 305-251-0403
Local and Private
Alliance for Aging 305-670-6500
The Beacon Council 305-579-1300
Greater Miami Convention & Visitor's Bureau 305-539-3000
League of Cities, Dade County 305-557-1722
United Way of Dade County 305-860-3000
Chambers of Commerce
Miami-Dade 305-751-8648
Greater Miami 305-350-7700
Latin American (CAMACOL) 305-642-3870
Directory of Federal, State, County, Local and Private Agencies
56