2011 Storm Effects Update: briefing for STAR
Apr 19 2012
Michael Ford NOAA
Michael Ford, Oceanographer, NOAA , SSMC3 RM 12523 1315 East-West Hwy Silver Spring, MD [email protected] 301.427.8010
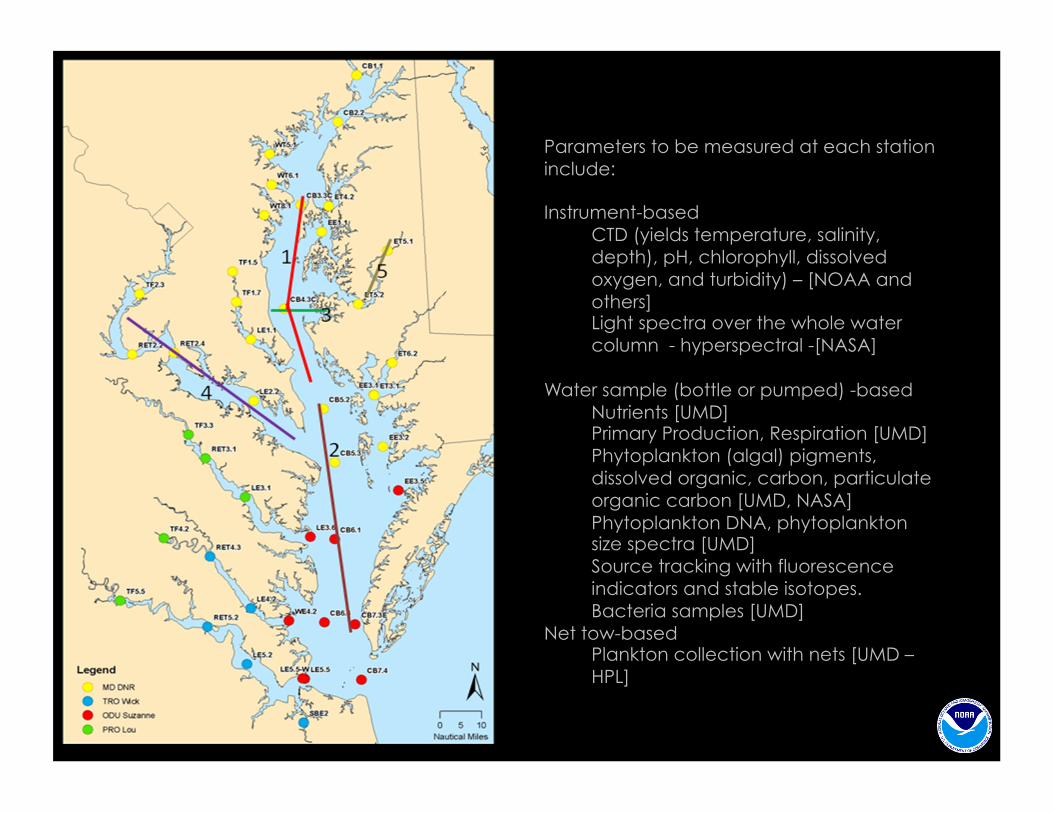
Parameters to be measured at each station include:
Instrument-based CTD (yields temperature, salinity, depth), pH, chlorophyll, dissolved oxygen, and turbidity) – [NOAA and others] Light spectra over the whole water column - hyperspectral -[NASA]
Water sample (bottle or pumped) -based Nutrients [UMD] Primary Production, Respiration [UMD] Phytoplankton (algal) pigments, dissolved organic, carbon, particulate organic carbon [UMD, NASA] Phytoplankton DNA, phytoplankton size spectra [UMD] Source tracking with fluorescence indicators and stable isotopes. Bacteria samples [UMD]
Net tow-based Plankton collection with nets [UMD – HPL]
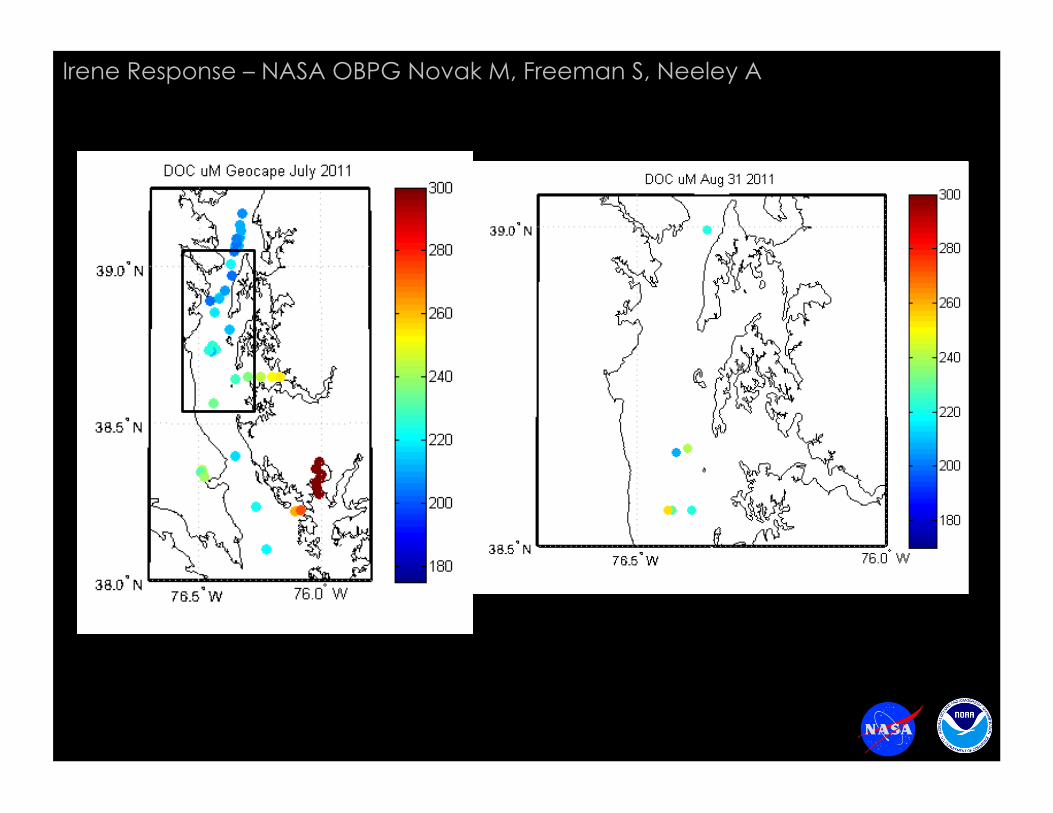
Irene Response – NASA OBPG Novak M, Freeman S, Neeley A
Irene Response – NASA OBPG Novak M, Freeman S, Neeley A
Irene Response -Turbidity, CBIBS Gooses Reef Aug 31
6
Irene Response – Chlorophyll, CBIBS Gooses Reef Aug 31
7
Irene Response - DO, CBIBS Gooses Reef Aug 31
8
Irene Response –Temperature, CBIBS Gooses Reef Aug 31
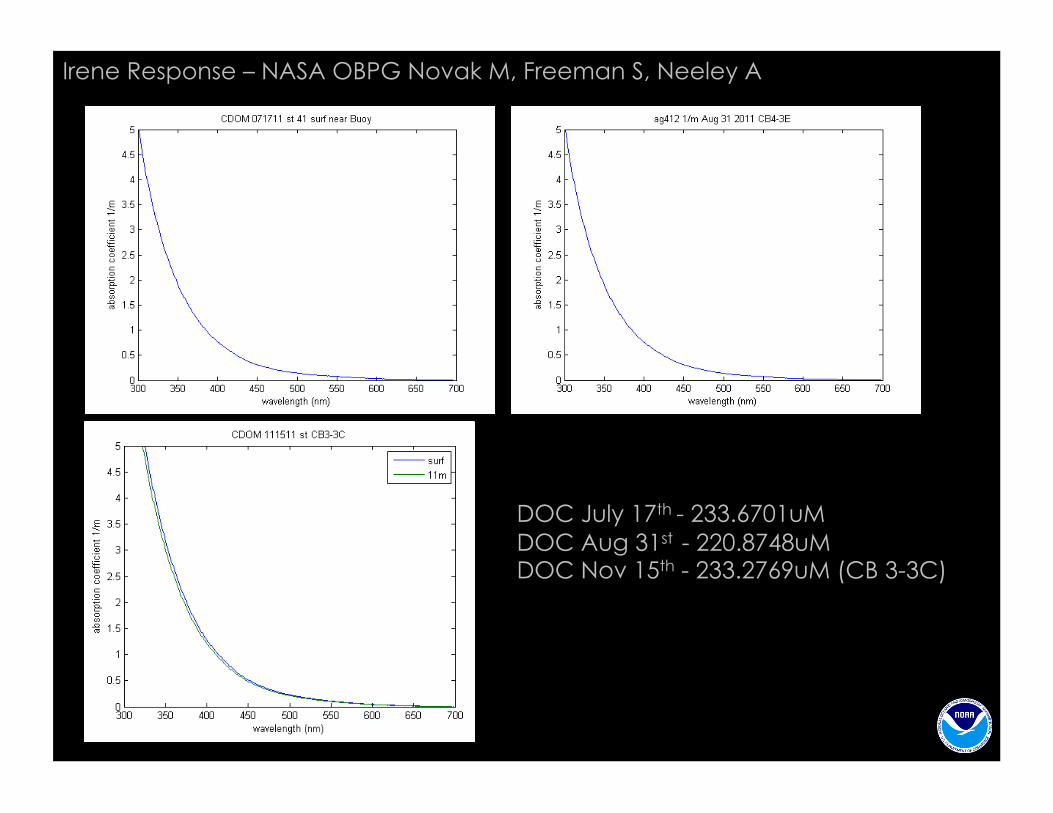
DOC July 17th - 233.6701uM DOC Aug 31st - 220.8748uM DOC Nov 15th - 233.2769uM (CB 3-3C)
Irene Response – NASA OBPG Novak M, Freeman S, Neeley A
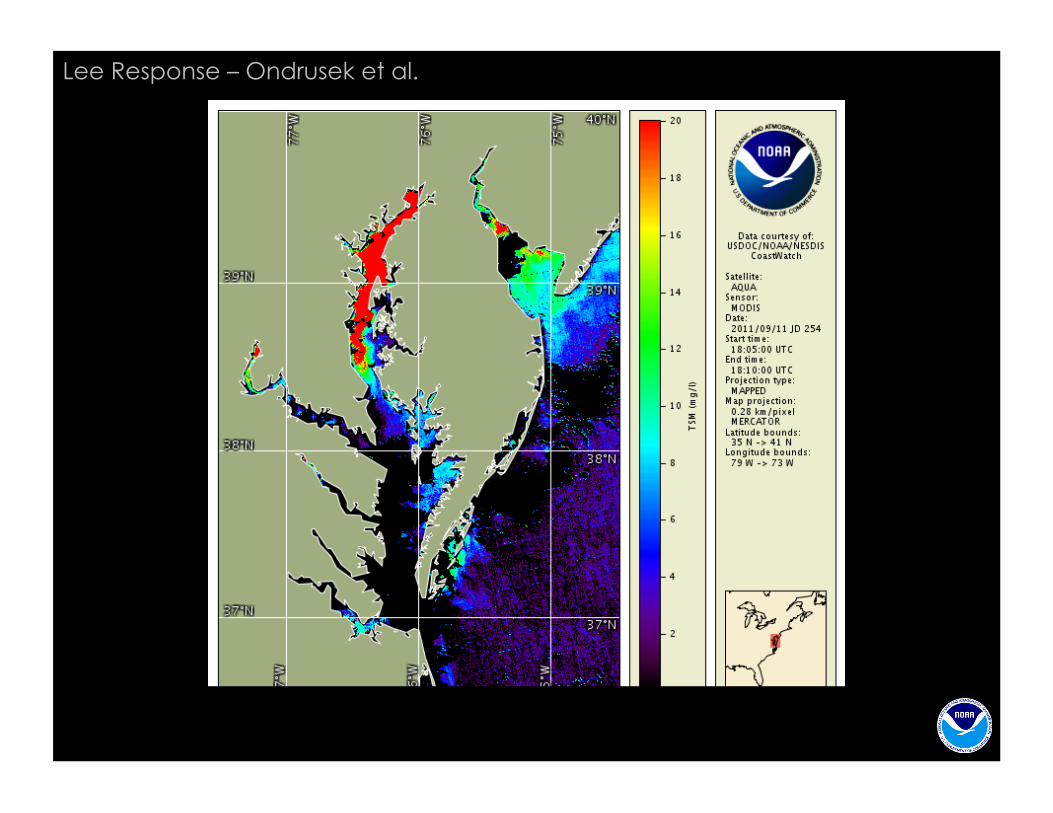
Lee Response – Ondrusek et al.
Lee Response – Ondrusek et al.
Imagery available daily at NOAA Coastwatch East Coast Node
Lee Response – Ondrusek et al.
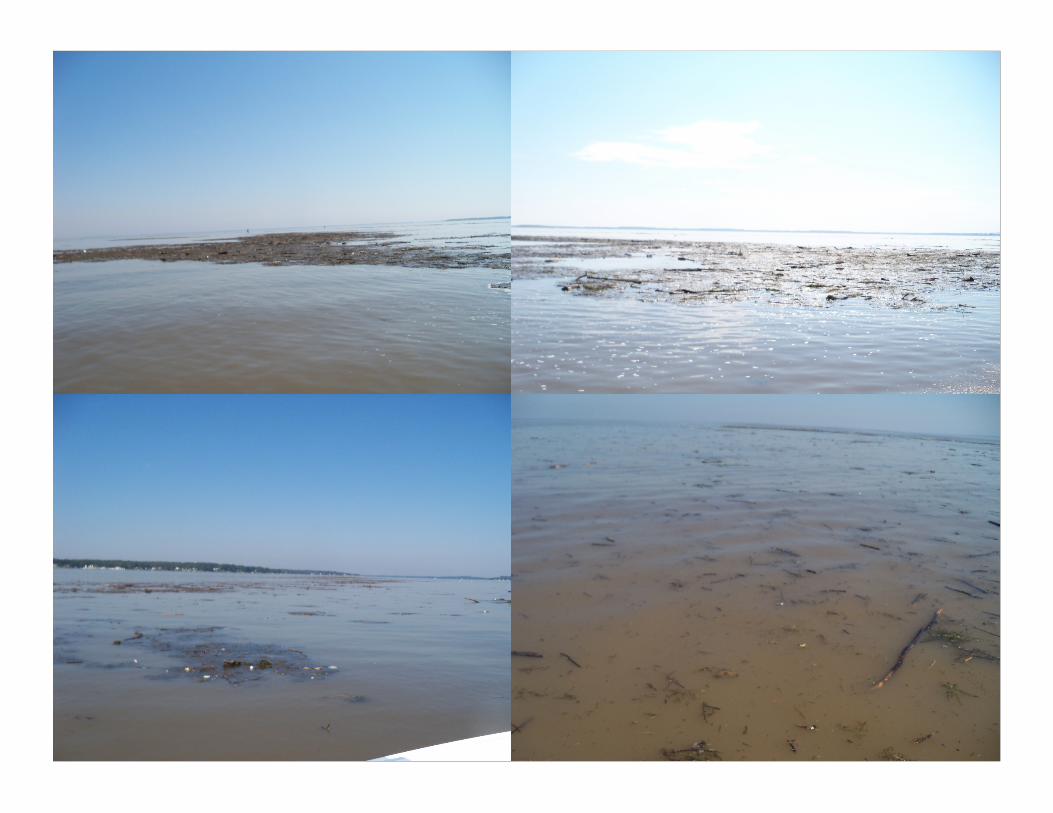
Lee Response – Ondrusek et al.
Lee Response – Ondrusek et al.
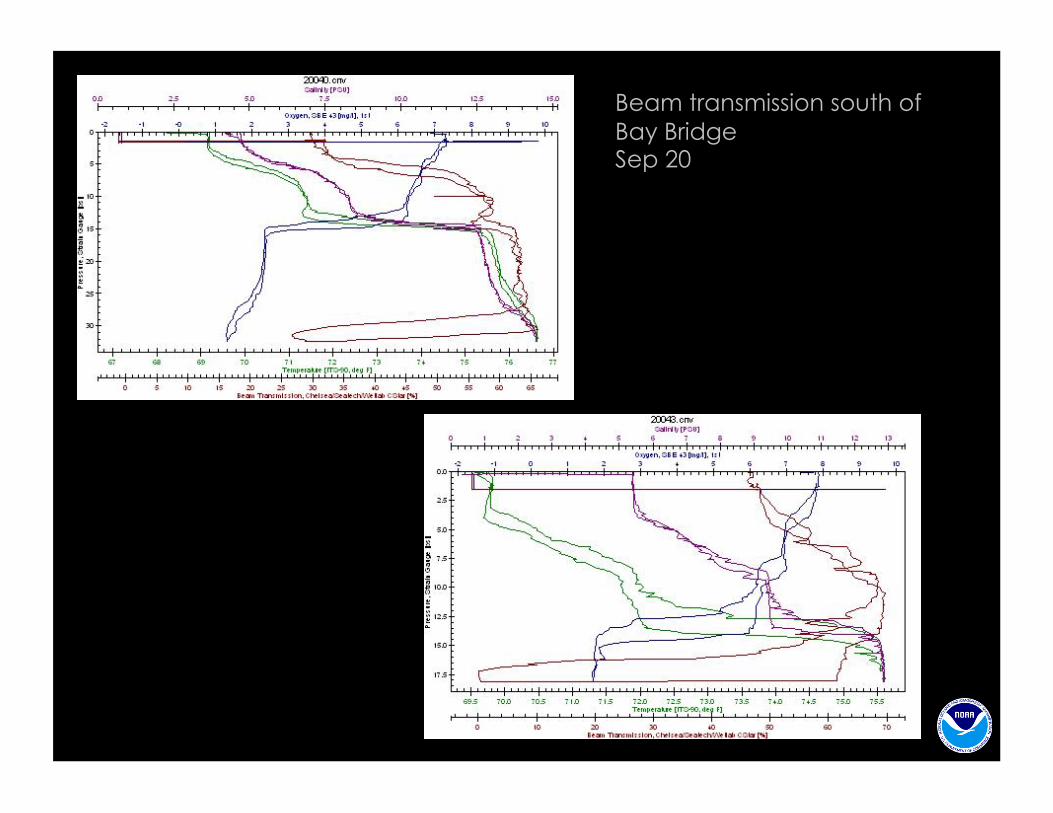
Beam transmission south of Bay Bridge Sep 13
Beam transmission south of Bay Bridge Sep 20
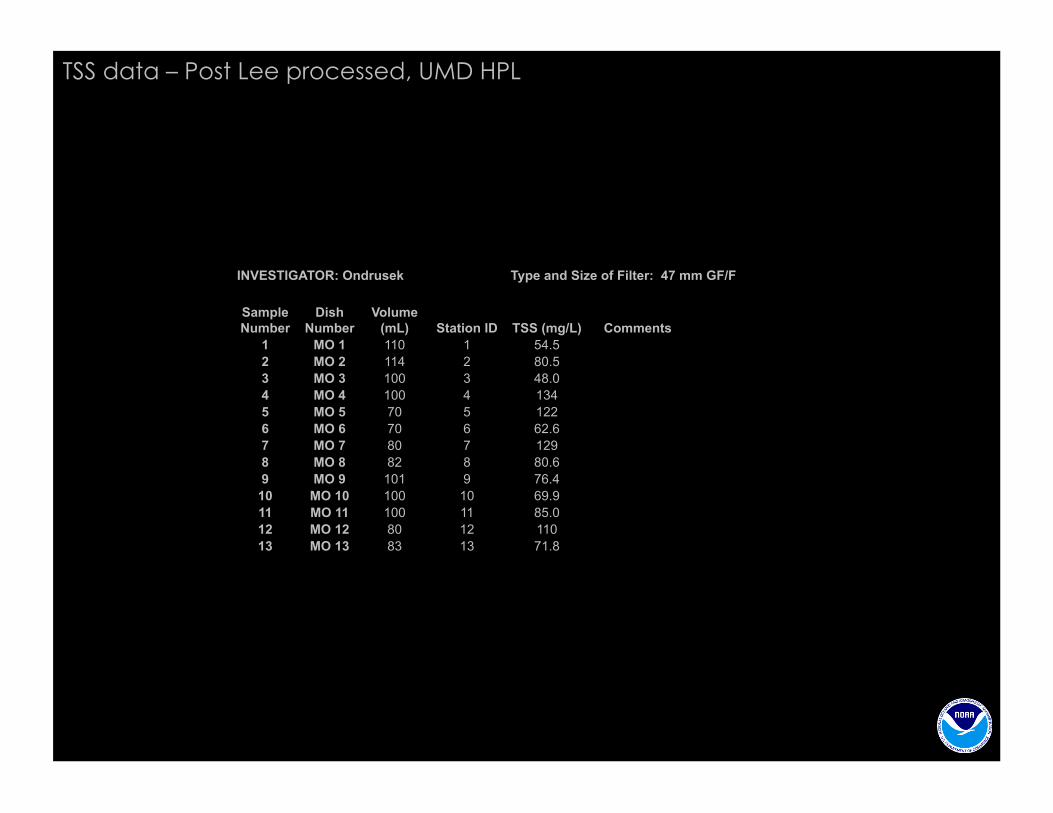
INVESTIGATOR: Ondrusek Type and Size of Filter: 47 mm GF/F
Sample Number
Dish Number
Volume (mL) Station ID TSS (mg/L) Comments
1 MO 1 110 1 54.5 2 MO 2 114 2 80.5 3 MO 3 100 3 48.0 4 MO 4 100 4 134 5 MO 5 70 5 122 6 MO 6 70 6 62.6 7 MO 7 80 7 129 8 MO 8 82 8 80.6 9 MO 9 101 9 76.4
10 MO 10 100 10 69.9 11 MO 11 100 11 85.0 12 MO 12 80 12 110 13 MO 13 83 13 71.8
TSS data – Post Lee processed, UMD HPL
Some samples filtered, see ID worksheet for details
Sample Date Sample ID Total Nitrogen
(uM) Total Nitrogen
(mg L-1)
Total Phosphorus
(uM)
Total Phosphorus
(mg L-1)
September 2011 1 128 1.792 0.85 0.0264 September 2011 2 110 1.540 0.97 0.0301 September 2011 3 129 1.806 0.89 0.0276 September 2011 4 98.0 1.372 0.99 0.0307 September 2011 5 96.0 1.344 0.94 0.0291 September 2011 6 116 1.624 0.93 0.0288 September 2011 7 138 1.932 3.42 0.1060 September 2011 8 121 1.694 3.54 0.1097 September 2011 9 132 1.848 2.99 0.0927 September 2011 10 107 1.498 4.71 0.1460 September 2011 11 97.0 1.358 3.71 0.1150 September 2011 12 122 1.708 3.28 0.1017 September 2011 13 110 1.540 3.44 0.1066 September 2011 14 107 1.498 3.74 0.1159 September 2011 15 101 1.414 4.52 0.1401 September 2011 16 48.9 0.685 1.82 0.0564 September 2011 17 110 1.540 0.96 0.0298 September 2011 18 104 1.456 0.88 0.0273 September 2011 19 97.7 1.368 0.90 0.0279 September 2011 20 95.1 1.331 0.94 0.0291
TN, TPdata – Post Lee processed, UMD HPL
Summary
• Set timing for response operations to meet several disciplines – we may have been too early for biogeochemical signal from Irene
• More data from BC cruise Aug 31 coming
• Total Suspended Matter algorithm proved useful; now daily from NOAA; in situ sampling providing extremes for satellite product testing
• Profiles Sep 13, Sep 20 exhibit subsurface clarity and then settling of sediment plume just south of Bay Bridge
• Recommend full science team participation in Fall workshop – NASA team, Ondrusek et al.
• Recommend data manager activity to assemble special event dataset, compile literature