42
Michael P. Kilgard Sensory Experience and Cortical Plasticity University of Texas at Dallas
| Date post: | 30-Dec-2015 |
| Category: |
Documents |
| Upload: | godfrey-rogers |
| View: | 219 times |
| Download: | 2 times |
Michael P. Kilgard
Sensory Experience and Cortical Plasticity
University of Texas at Dallas

Cortical plasticity depends upon:
• Sensory experience
• Behavioral relevance
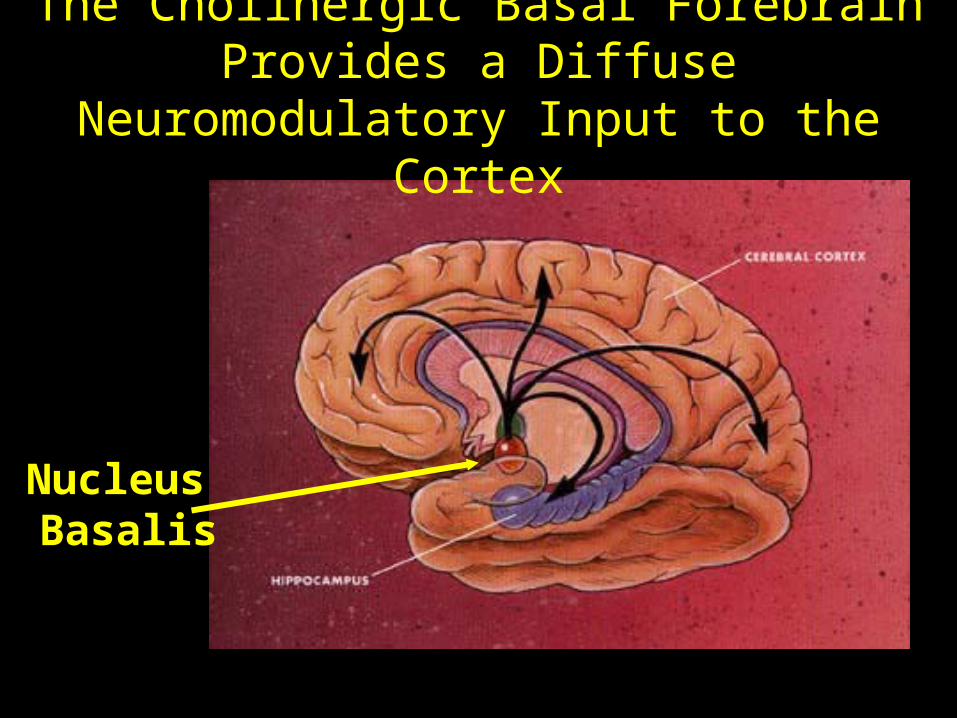
The Cholinergic Basal Forebrain Provides a Diffuse Neuromodulatory Input to the Cortex
Nucleus Basalis

Exploring the Principles of Cortical Plasticity using:• Systematic Variation of Sensory Experience
• Nucleus Basalis Stimulation to
Gate Cortical Plasticity
Experienceor Instinct
Connectivity & Dynamics
Plasticity
Neural Representation
Importance
External world
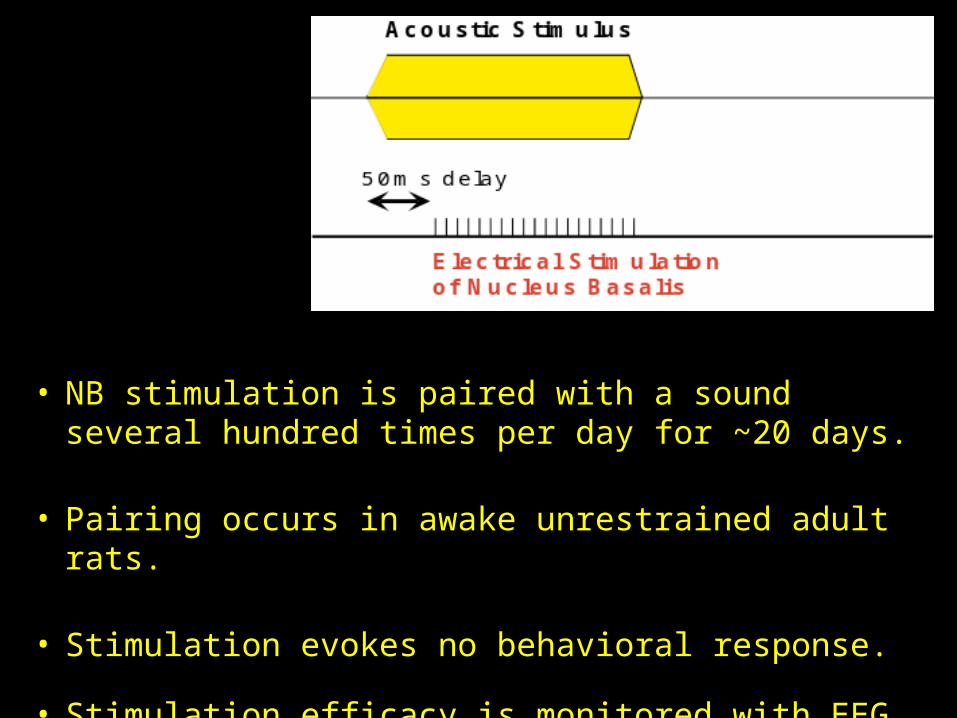
• NB stimulation is paired with a sound several hundred times per day for ~20 days.
• Pairing occurs in awake unrestrained adult rats.
• Stimulation evokes no behavioral response.
• Stimulation efficacy is monitored with EEG.

Extracellular Recordings
Detailed Reconstruction of the Distributed Cortical Response
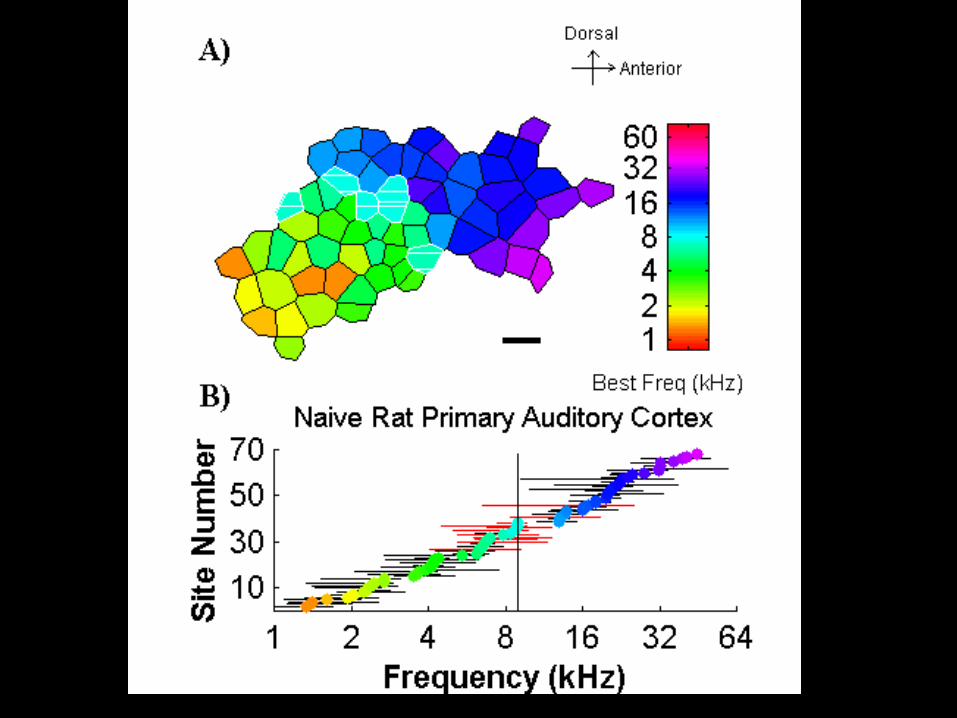

Best Frequency
Science, 1998

Tone Frequency - kHz
Nucleus Basalis Stimulation Generates Map Plasticity that is Specific to the Paired Tone
N = 20 rats; 1,060 A1 sites


Nature Neuroscience, 1998
Temporal Plasticity is Specific to the
Paired Repetition Rate
N = 15 rats, 720 sites

2 4 6 8 10 12 14 16 18 200
0.2
0.4
0.6
0.8
1
1.2
Repetition Rate (pulses/second)
Nor
mal
ized
Spi
ke R
ate
Control 15pps 9 kHz 15pps Seven Carriers
0 5 10 15 200
20
40
60
80
100
Best Repetition Rate(pulses/second)
Per
cent
of S
ites
A.
B.
Journal of Neurophysiology, 2001
Carrier frequency variability prevented map expansion and allowed temporal plasticity.
N = 13 rats, 687 sites

Stimulus Paired with NB Activation Determines
Degree and Direction of Receptive Field Plasticity
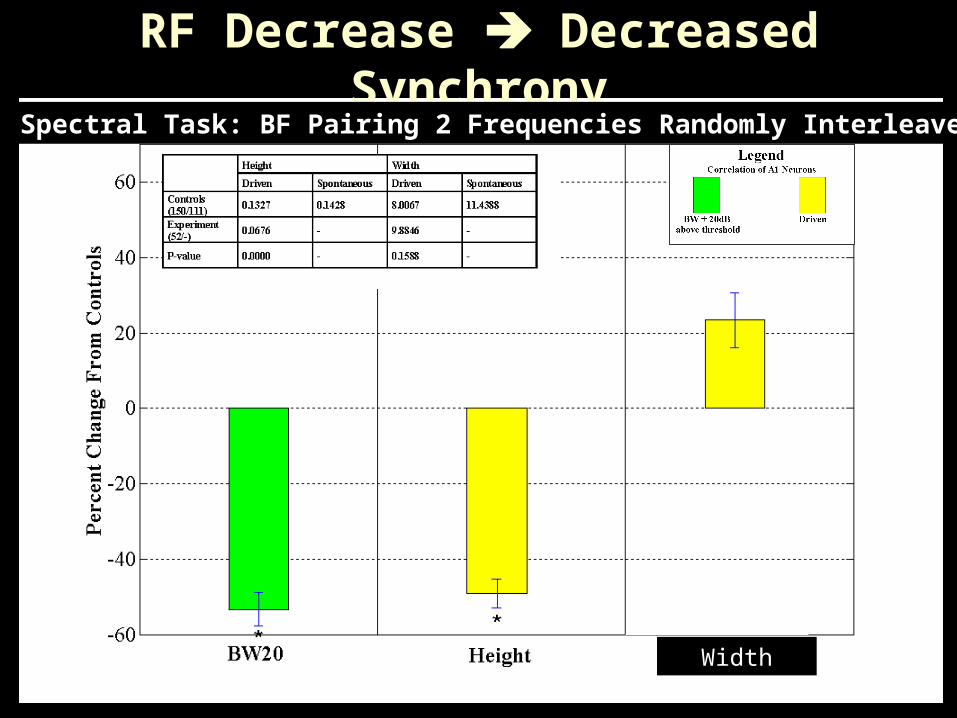
Frequency Bandwidth Plasticity N = 52 rats; 2,616 sites

Frequency Bandwidth is Shaped by Spatial and Temporal Stimulus Features
Modulation Rate (pps)0 5 10 15
Ton
e P
rob
abil
ity
15%
50 %
10
0%
Journal of Neurophysiology, 2001
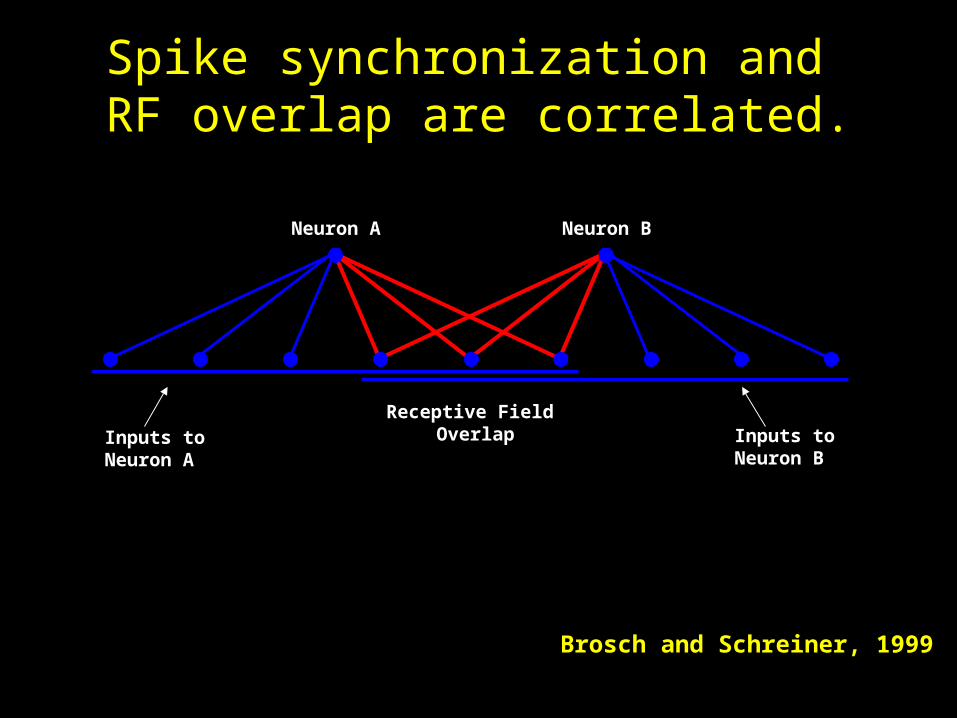
Neuron 1
Inputs to Neuron A
Neuron 2
Receptive Field Overlap
Neuron A Neuron B
Inputs to Neuron B
Spike synchronization and RF overlap are correlated.
Brosch and Schreiner, 1999

After Map Expansion: ~85% shared inputs
After Sharper Frequency Tuning: ~25% shared inputs
What is the effect of cortical plasticity on spike synchonization?
Before plasticity: ~50% shared inputsBefore Plasticity: ~50% shared inputs
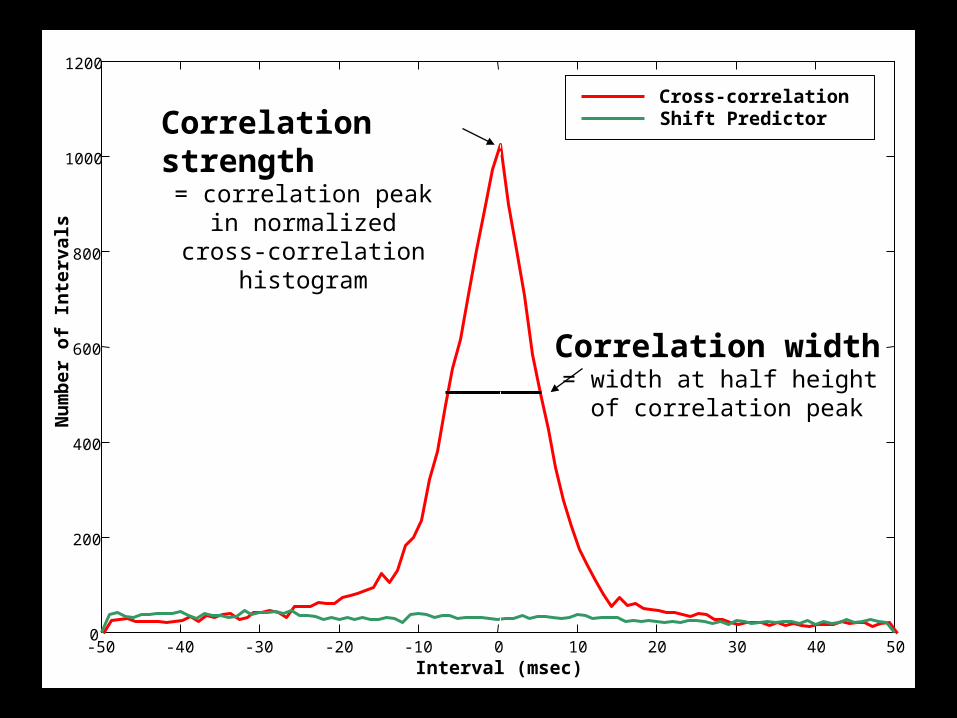
-50 -40 -30 -20 -10 0 10 20 30 40 500
200
400
600
800
1000
1200N
um
ber
of
Inte
rval
s
Interval (msec)
Cross-correlation: TC 025C1.MAT x TC025C2.MAT
Cross-correlationShift PredictorCorrelation strength
= correlation peak in normalized cross-correlation
histogram
Correlation width = width at half height
of correlation peak

Experience-Dependent Changes in Cortical Synchronization
• Map expansion sharpened synchronization– 15pps 9kHz tone trains
50% increase in cross-correlation height (p<0.0001)
17% decrease in cross-correlation width (p<0.01)
• Bandwidth narrowing smeared synchronization– Two different tone frequencies
50% decrease in cross-correlation height (p<0.0001)
22% increase in cross-correlation width (p<0.001)
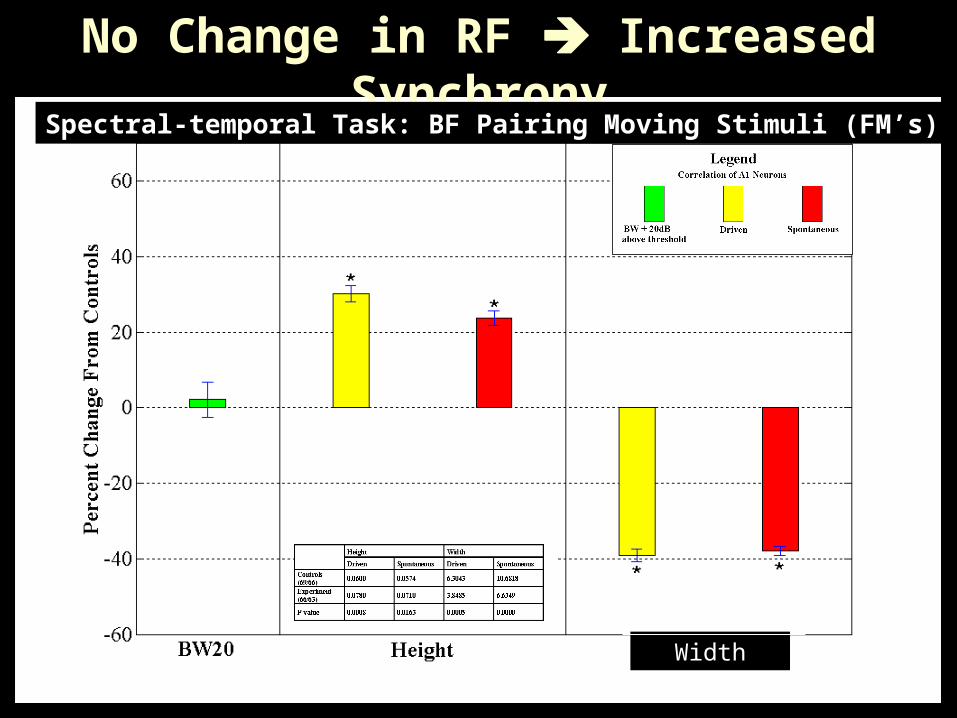
• Intermediate stimuli caused no change in synchronization– 15pps tone trains with several different carrier frequencies
No change in cross-correlation height or width
N = 23 rats; 1,129 sites; 404 pairs
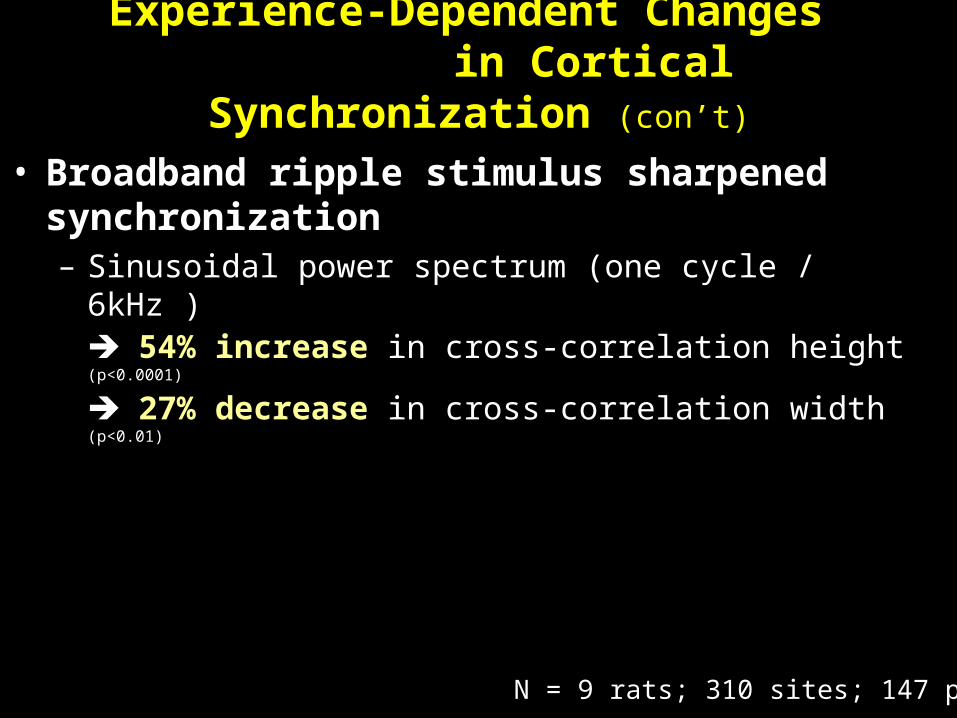
Experience-Dependent Changes in Cortical Synchronization (con’t)
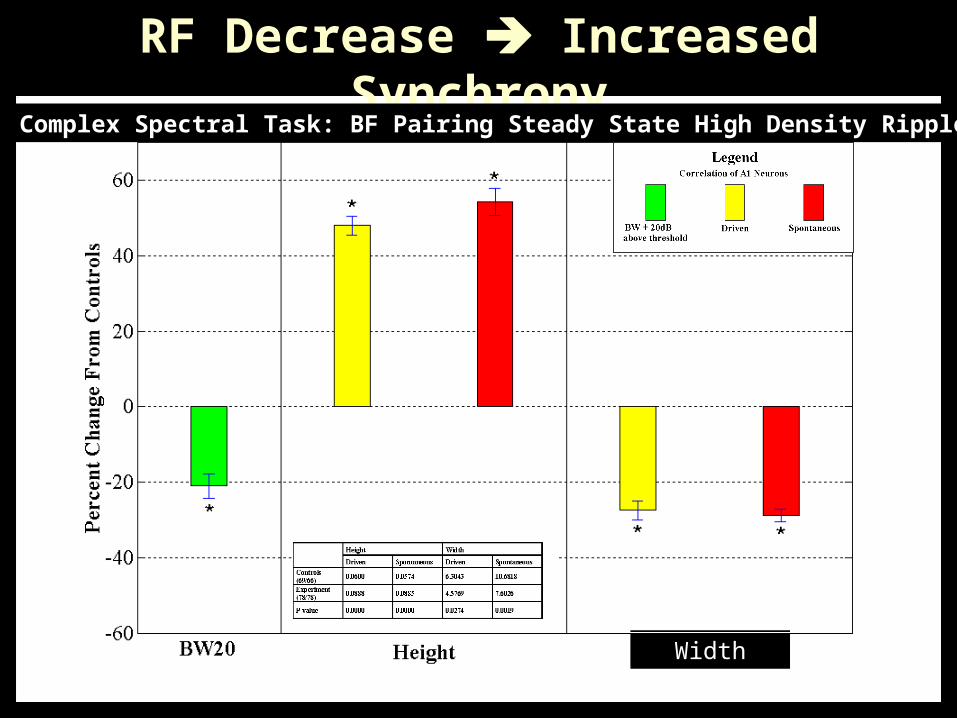
• Broadband ripple stimulus sharpened synchronization– Sinusoidal power spectrum (one cycle / 6kHz )
54% increase in cross-correlation height (p<0.0001)
27% decrease in cross-correlation width (p<0.01)
N = 9 rats; 310 sites; 147 pairs

Pairing NB stimulation with aspectrotemporal sequence sharpens
response discharge coherence.

0 10 20 100 110 120 200 210 220 230
-10
0
10
20
30
0
10
20
30
0
10
20
30
40
0
10
20
30
40P
erce
nt o
f Site
s
Time (ms)
CF < 3.2 kHz
CF 3.2-7.75 kHz
CF 7.75-18.6 kHz
CF >18.6 kHz
Sharpened Cortical Response to High-Low-Noise Sequence
// //
// //
Naive After HLN Difference
5 10 15 20 25 300
10
20
30
40
Time to Peak Response (ms)
Per
cent
of S
ites
A)
B)
0 10 20 100 110 120 200 210 220 230-10
0
10
20
30
0
10
20
30
0
10
20
30
40
0
10
20
30
40P
erce
nt o
f Site
s
Time (ms)
CF < 3.2 kHz
CF 3.2-7.75 kHz
CF 7.75-18.6 kHz
CF >18.6 kHz
Sharpened Cortical Response to High-Low-Noise Sequence
// //
// //
Naive After HLN Difference
5 10 15 20 25 300
10
20
30
40
Time to Peak Response (ms)
Per
cent
of S
ites
A)
B)
Peak Latency: 15.2 vs. 18.2 ms (p< 0.00001)
Difference
NaiveAfter HLN
N = 13 rats, 450 sites
Time to Peak Response (ms)
Time (ms)
Spi
kes
per
Sec
ond
Sharpened Cortical Response to High-Low-Noise Sequence

0 10 20 100 110 120 200 210 220 230-10
0
10
20
30
0
10
20
30
0
10
20
30
40
0
10
20
30
40
Spi
kes
per
seco
nd
Time (ms)
CF < 3.2 kHz
CF 3.2-7.75 kHz
CF 7.75-18.6 kHz
CF >18.6 kHz
Sharpened Cortical Response to High-Low-Noise Sequence
// //
// //Naive After HLN Difference
5 10 15 20 25 300
20
40
60
Minimum Latency (ms)
Per
cent
of
Si te
s
5 10 15 20 25 300
20
40
60
Time to Peak Response (ms)
Per
cent
of
Si te
s
A) B)
C)
Increased Population Discharge Coherence

1.1 0.1 2.2+42%
1 0 1.2
1 0.6 1.7
1.5 0.1 0.8
0.3 0.7 2
0.2 1.7
1.3 1.6
Spikes per Element
Stretched
Compressed
Tones Reversed
Degraded
Degraded
Paired w/ BF
Sequence Reversed
High Tone Low Tone Noise Burst
0.1 0.7 2.5+67%
0.2 0.4 2.1
0.1 0.6 2.8+87%
1.3 0.4 0.3
0.5 0.1 2.7+80%
0.6 2.3+53%
0.2 1.5
Spikes per Element
Stretched
Compressed
Tones Reversed
Degraded
Degraded
Paired w/ BF
Sequence Reversed
0 100 200 300 400
1.2 1.4+195%
2.1+35%
1.1 0-100%
1.6
1 1.3+174%
2.6+67%
1.6 1+111%
1
0.4 0.9 2.4+54%
0.5 1.6
1.2 2.1+35%
Spikes per Element
Time (ms)
Stretched
Compressed
Tones Reversed
Degraded
Degraded
Paired w/ BF
Sequence Reversed
A)
B)
C)
Context-Dependent Facilitation
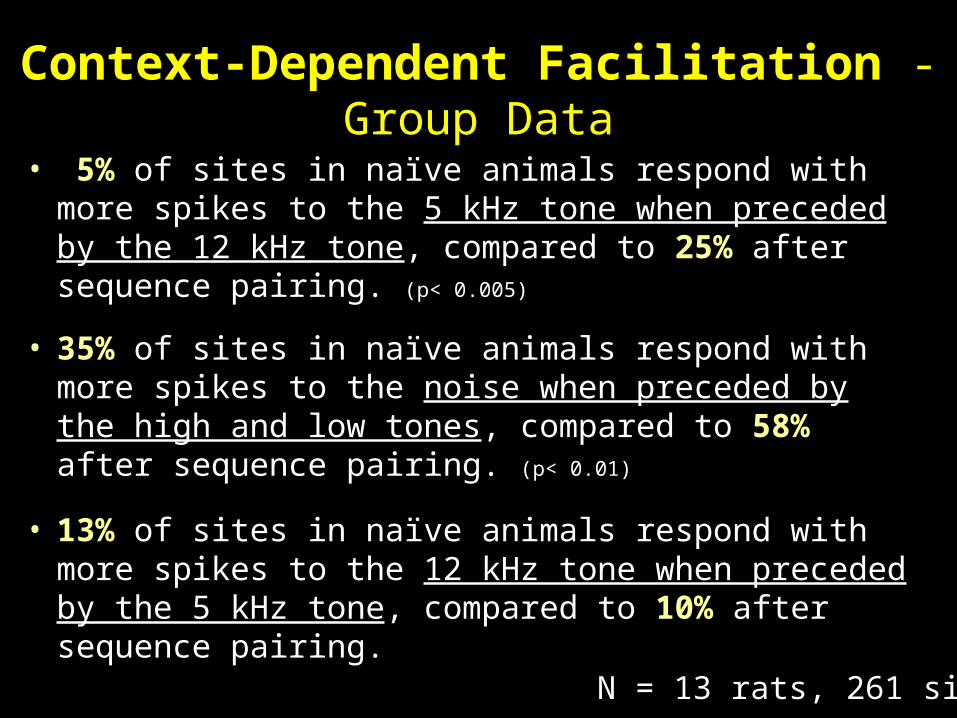
• 5% of sites in naïve animals respond with more spikes to the 5 kHz tone when preceded by the 12 kHz tone, compared to 25% after sequence pairing. (p< 0.005)
• 35% of sites in naïve animals respond with more spikes to the noise when preceded by the high and low tones, compared to 58% after sequence pairing. (p< 0.01)
• 13% of sites in naïve animals respond with more spikes to the 12 kHz tone when preceded by the 5 kHz tone, compared to 10% after sequence pairing.
Context-Dependent Facilitation - Group Data
N = 13 rats, 261 sites

Sensory Experience Controls:
• Cortical Topography
• Receptive Field Size
• Maximum Following Rate
• Spectrotemporal Selectivity
• Synchronization


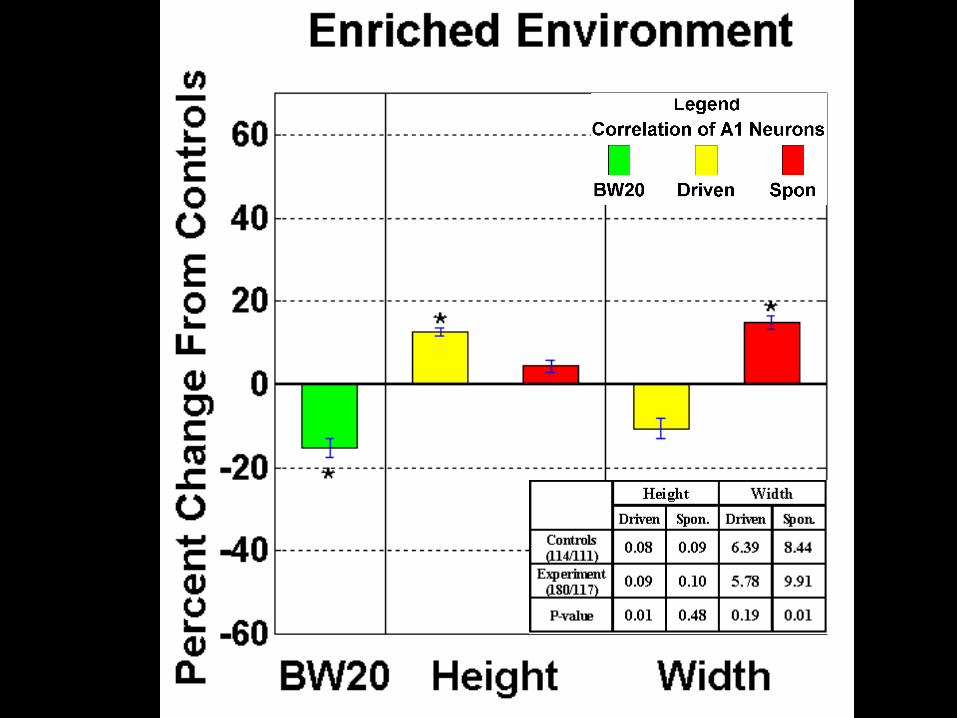
• 55% increase in response strength– 1.4 vs. 0.9 spikes per noise burst (p< 0.0001)
• 22% decrease in frequency bandwidth– 1.8 vs. 2.2 octaves at 30dB above threshold (p< 0.0001)
• One millisecond decrease in minimum latency– 15.8 vs. 16.8 ms (p< 0.005)
• Two decibel decrease in threshold– 17 vs. 19 dB ms (p< 0.01)
• Increased synchronization– 13% increase in cross-correlation height (p< 0.01)
Enrichment Effects
N = 14 rats, 738 sites

Experienceor Instinct
Connectivity & Dynamics
Plasticity
Neural Representation
Importance
External world
Rules of Cortical Plasticity

Experienceor Instinct
Connectivity & Dynamics
Plasticity
Neural Representation
Importance
External world
Experienceor Instinct
Connectivity & Dynamics
Plasticity
Behavioral Change
Neural Representation
Importance
External world


Map BW LatencyEnd of
ResponseSpontaneous
ActivityTone
ResponseRipple
Response
One Frequency 0 0 0 0
Two Frequencies 0 0 0
MultipleFrequencies
0 0 0
Spectral Ripple 0
Spectral Stimuli
Map BW LatencyEnd of
ResponseSpontaneous
ActivityTone
Response
MaximumFollowing
Rate
CombinationSensitivity
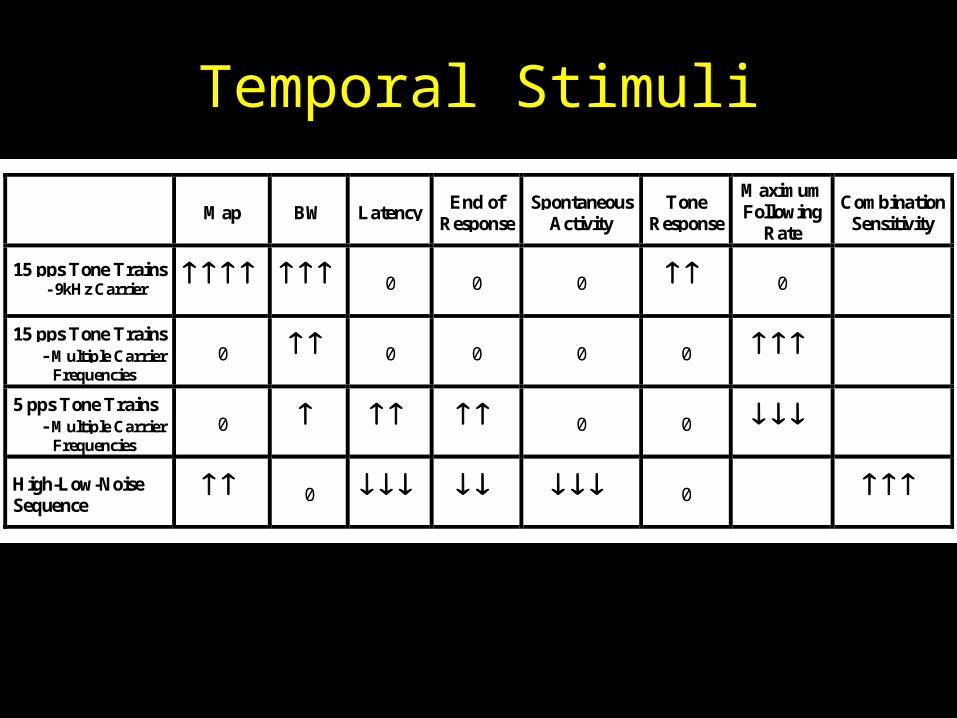
15 pps Tone Trains - 9kHz Carrier 0 0 0 0
15 pps Tone Trains - Multiple Carrier Frequencies
0 0 0 0 0
5 pps Tone Trains - Multiple Carrier Frequencies
0 0 0
High-Low-NoiseSequence
0 0
Temporal Stimuli

Rules of Cortical PlasticityMap BW Latency
End ofResponse
SpontaneousActivity
ToneResponse
MaximumFollowing
Rate
CombinationSensitivity
One Frequency 0 0 0 0
Two Frequencies 0 0 0
MultipleFrequencies
0 0
Spectral Ripple
15 pps Tone Trains - 9kHz Carrier
0 0 0 0
15 pps Tone Trains - Multiple Carrier Frequencies
0 0 0 0 0
5 pps Tone Trains - Multiple Carrier Frequencies
0 0 0
High-Low-NoiseSequence
0 0

Behavioral Relevance
Neural Activity
- Internal Representation
External World-Sensory Input
Neural Plasticity- Learning and
Memory
Plasticity Rules- Educated Guess

RF Increase Increased Synchrony
Temporal Task: BF Pairing 15 pps, 9 kHz Tone
Width
RF Decrease Decreased Synchrony
Spectral Task: BF Pairing 2 Frequencies Randomly Interleaved
Width

RF Increase No Change in Synchrony
Temporal and Spectral Task: BF Pairing 15 pps Multiple Frequencies
Width
No Change in RF Increased Synchrony
Spectral-temporal Task: BF Pairing Moving Stimuli (FM’s)
Width
RF Decrease Increased Synchrony
Complex Spectral Task: BF Pairing Steady State High Density Ripple
Width