Phase resetting in a model of sinoatria l nodal membrane: ionic and topological aspects MICHAEL R. GUEVARA AND HABO J. JONGSMA Fysiologisch Laboratorium, Universiteit van Amsterdam, 1105 AZ Amsterdam, The Netherlands GUEVARA,MICHAEL R., AND HABO J.JONGSMA.PIUS~ re- setting in a model of sinoatrial nodal membrane: ionic and topological aspects. Am. J. Physiol. 258 (Heart Circ. Physiol. 27): H734-H747,1990.-We describe the phase-resetting effect of injecting an isolated current pulse in an ionic model of a single cell of the sinoatrial node . De livery of a depolarizing pulse early (late) in the cycle results in a prolongation (abbre- viation) of the cycle lengt h. With a hyperpolarizing pulse, the effect is reversed . We determine the topological type or degree of phase resetting in two way s: 1) by analyzing interbeat interv als extracted from the voltage waveform, and 2) by ana- lyzi ng the waveform, not only of th e voltage, but of all the activation and inactivation variables. The two met hods give similar results. At low (high) pulse amplitudes, there is type 1 (0) phase resetting. When type 1 phase r esetting occurs, the new phase is a monotonically increasing function of the old phase at sufficiently low stimulus amplitudes, whereas at higher stimu lus am plitudes it is not. Leading role s in generating phase resetting are attributed to the slow inward current and to the leakage current. Comparison is made with experimental phase- resetting findings in the sinoatrial node and other cardiac oscillators. Implications for unidirectional and bidirectional synchronization are also sketched out. ionic mechanisms; graded action potentials; type 1 phase reset- ting; type 0 phase resetting; all-or-none dep olarization; anni- hilation OVER THE PAST SEVERAL DECADES, systematic phase- biological oscillators (49). In a phase-re setting experi- ment, a stimul us of duration short in comparison with the characteristic period of the oscillator, is delivered to the oscillator. This perturbation results in a transient disturbanc e in the period of the oscillation, with recovery back to the original period eventually occurring. The stimulu s, however, i n general produces a permanent re- setting of the timing or “phase” of the oscilla tor (readers unfamiliar with the concept of phase resetting should consult the APPENDIX for a brief introduction to the subject ). Wi nfree (49) has shown that there are certain qualita tive or topolog ical features common to the phase- resetting data obtained from a wide variety of biol ogica l oscillators, from isolated pacemaker cells to circadian rhythms. These topological similari ties exist even tho ugh the particular mechanisms operating in any two given oscillators might be completely different. There have been severa l experimental studies on the phase-resetting response of the sinoa trial node (SAN ) produced by stimulation with a current pulse (26, 35,45, 47). There have also been a few reports in which this response has been modeled (5,27,36,43). We investigate an ioni c model that has not previously been studied (23), concentrating on th .e ioni c mechanisms underlying phase resetting and on topologi cal aspects of phase resetting. We have three main motivation s for investig ating the phase-resetting response of the model. The first is to lay the foundations for determining the extent to which topological characteristics of the response to an isolated current pulse (i.e., the phase-resetting response) can account for coupling patterns seen when a period ic train of current pulses is delivered . We have recently shown in experiments on . embryonic chick heart cell aggregates that such topologi cal considera tions do indeed determine the various classes of patter ns seen when periodic stim- ulation is imposed (13, 15, 17, 20, 21). For example, the type of phase resetting seen with a low-amplitude stim- ulus pulse accounts for the fact that We nckeba ch-like rhythms are seen with low-amplitud e periodic stimula- tion (20). At very high stimul us amplitudes, when there is a qualitative chang e in the topological characteristics of the phase-resetting response, one no longer se es Wenckebach rhythms but rather alternans rhythms (15, 21). At intermediate stimul us ampl itudes, the topolog ical chara cteris tics are again different and account for the fact that chaotic rhythms and hysteresis can be seen (13, 15, 17, 2 1). It is thus of prim .ary importance to charac- terize th .e topolog ical features of phase resetting if one 1s to have any hope of making sense of the plethora of rhythms seen during periodic stimulation. The second motivation for studying phase resetting is to use the phase-resetting response, once characterize d, to investigate the extent to which the phasic influ ence of one spontaneously active SA N cell on another might be responsible for producing mutual synchroniza tion in a population of two or more coupled nodal cells (15, 27, 36). A wide spectrum of coupling patterns can be seen in models of just two co upled oscillators (e.g., see Refs. 27, 36). The topological characteristics of phase resetting again p lay a major role in determining which classes of coupling patterns are s een at a given leve l of ) coup1 ng Our third reason for studying phase resetting is that the study of phase resetti ng in an ionic model i s inter- esting, indeed even valuable, in itsel f, because it can be used to determine the extent to which presently known ioni c mechanisms, deduced from data obtained inde- pendently in voltage-clamp experiments, can account for experimentally observed behavior in phase-r esetting ex- H734 0363-6135/90 $1.50 Copyright 0 1990 the American Physiological Society
Transcript
8/3/2019 Michael R. Guevara and Habo J. Jongsma- Phase resetting in a model of sinoatrial nodal membrane: ionic and topol…
Phase resetting in a model of sinoatrial nodal membrane:ionic and topological aspects
MICHAEL R. GUEVARA AND HABO J. JONGSMAFysiologisch Laboratorium, Universiteit van Amsterdam, 1105 AZ Amsterdam, The Netherlands
GUEVARA,MICHAELR., AND HABO J.JONGSMA.PIUS~ re-setting in a model of sinoatrial nodal membrane: ionic andtopological aspects.Am. J. Physio l. 258 (Heart Circ. Physiol.27): H734-H747,1990.-We describe the phase-resetting effectof injecting an isolated current pulse in an ionic model of asingle cell of the sinoatrial node. Delivery of a depolarizingpulse early (late) in the cycle results in a prolongation (abbre-viation) of the cycle length. With a hyperpolarizing pulse, theeffect is reversed. We determine the topological type or degreeof phase resetting in two ways: 1) by analyzing interbeatintervals extracted from the voltage waveform, and 2) by ana-lyzing the waveform, not only of the voltage, but of all theactivation and inactivation variables. The two methods givesimilar results. At low (high) pulse amplitudes, there is type1(0) phase resetting. When type 1 phase resetting occurs, thenew phase is a monotonically increasing function of the oldphase at sufficiently low stimulus amplitudes, whereas at higherstimulus amplitudes it is not. Leading roles in generating phaseresetting are attributed to the slow inward current and to theleakage current. Comparison is made with experimental phase-resetting findings in the sinoatrial node and other cardiacoscillators. Implications for unidirectional and bidirectionalsynchronization are also sketched out.
OVER THE PAST SEVERAL DECADES,systematic phase-resetting experiments have been carried out on manybiological oscillators (49). In a phase-resetting experi-ment, a stimulus of duration short in comparison withthe characteristic period of the oscillator, is delivered tothe oscillator. This perturbation results in a transientdisturbance in the period of the oscillation, with recoveryback to the original period eventually occurring. Thestimulus, however, in general produces a permanent re-setting of the timing or “phase” of the oscillator (readersunfamiliar with the concept of phase resetting shouldconsult the APPENDIX for a brief introduction to thesubject). Winfree (49) has shown that there are certainqualitative or topological features common to the phase-resetting data obtained from a wide variety of biologicaloscillators, from isolated pacemaker cells to circadianrhythms. These topological similari ties exist even thoughthe particular mechanisms operating in any two givenoscillators might be completely different.
There have been several experimental studies on thephase-resetting response of the sinoatrial node (SAN)produced by stimulation with a current pulse (26, 35,45,
47). There have also been a few reports in which thisresponse has been modeled (5,27,36,43). We investigatean ionic model that has not previously been studied (23),concentrating on th .e ionic mechanisms underlying phaseresetting and on topological aspects of phase resetting.We have three main motivations for investigating thephase-resetting response of the model. The first is to laythe foundations for determining the extent to whichtopological characteristics of the response to an isolatedcurrent pulse (i.e., the phase-resetting response) can
account for coupling patterns seen when a periodic trainof current pulses is delivered . We have recently shownin experiments on . embryonic chick heart cell aggregatesthat such topological considerations do indeed determinethe various classes of patterns seen when periodic stim-ulation is imposed (13, 15, 17, 20, 21). For example, thetype of phase resetting seen with a low-amplitude stim-ulus pulse accounts for the fact that Wenckebach-likerhythms are seen with low-amplitude periodic stimula-tion (20). At very high stimulus amplitudes, when thereis a qualitative change in the topological characteristicsof the phase-resetting response, one no longer seesWenckebach rhythms but rather alternans rhythms (15,21). At intermediate stimulus amplitudes, the topologicalcharacteristics are again different and account for thefact that chaotic rhythms and hysteresis can be seen (13,15, 17, 2 1). It is thus of prim .ary importance to charac-terize th .e topological features of phase resetting if one1s
to have any hope of making sense of the plethora ofrhythms seen during periodic stimulation.
The second motivation for studying phase resetting isto use the phase-resetting response, once characterized,to investigate the extent to which the phasic influenceof one spontaneously active SAN cell on another mightbe responsible for producing mutual synchronization ina population of two or more coupled nodal cells (15, 27,36). A wide spectrum of coupling patterns can be seen inmodels of just two coupled oscillators (e.g., see Refs. 27,36). The topological characteristics of phase resettingagain play a major role in determining which classes ofcoupling patterns are seen at a given level of(Guevara and Lewis, u npublished data)
coup1 ng
Our third reason for studying phase resetting is thatthe study of phase resetting in an ionic model i s inter-esting, indeed even valuable, in itself, because it can beused to determine the extent to which presently knownionic mechanisms, deduced from data obtained inde-pendently in voltage-clamp experiments, can account forexperimentally observed behavior in phase-resetting ex-
H734 0363-6135/90 $1.50 Copyright 0 1990 the American Physiological Society
8/3/2019 Michael R. Guevara and Habo J. Jongsma- Phase resetting in a model of sinoatrial nodal membrane: ionic and topol…
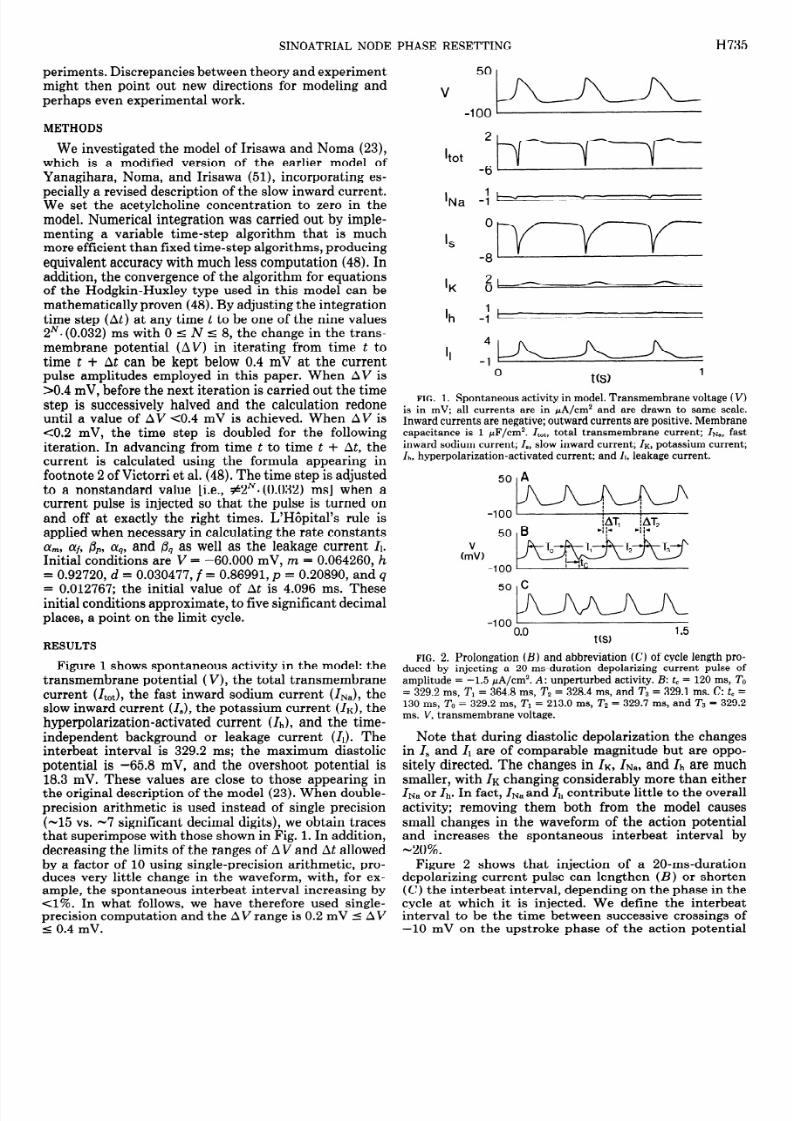
(the “event marker”). The spontaneous interbeat intervalis denoted by To, the perturbed interbeat interval by T1,and the first poststimulus interbeat interval by Z’Z (Fig.2). The coupling interval is the time from the crossing of-10 mV on the upstroke of the action potential imme-diately preceding the stimulus to the beginning of thestimulus itself and is denoted by tc . The normalizedcoupling interval t ,/To is called the old phase, and isdenoted by <p,which has the range 0 5 @c 1. All intervalsare given in milliseconds. The amplitude of the currentpulse in microamperes per centimeter squared is denotedby A, with a negative amplitude corresponding to adepolarizing stimulus. Stimulus amplitude increaseswhen the absolute value of A increases.
The temporal shifts AT1 and AT2 are defined as indi-cated in Fig. 2. Thus
AT 1 = To- 1 (1
and
AT 2= 0 - Td + (To - T2) (2
More generally1
ATi = C (TO 0 Tj) (3)j= l
Note that in Fig. 2, T2 = To, and soAT2 = AT,. Alsonote that AT1 is negative for Tl > To (“delay”) andpositive for Tl < To (“advance”). Each column of Fig. 3shows the effect of systematically increasing tc from 60to 180 ms in steps of 20 ms at a fixed amplitude of thecurrent pulse (a “phase-resetting run”). Phase-resettingruns at three different amplitudes (-1.0, -1.5, and -2.0
AA-1.0
BA-l.5
CA=-2.0
FIG. 3. Phase-resetting runs at 3 different current amplitudes (A)with tc ncremented in steps of 20 ms from60 ms (2nd row) to180 m s
(bottom row). Top row shows unperturbed activity. A: A =-1.0 ,uA/cm2; B: A =-1.5 pA/cm2; and C: A = -2.0 pA/cm2.
pA/cm2) are shown. At all three amplitudes, fortc < 60ms (not shown), Tl is slightly larger than To, whereas fortc > 180 ms (not shown), the pulse is suprathreshold, andso Tl = tc.
We have investigated in some detail the way in whichprolongation of cycle length turns into abbreviation astcis increased at each of the three amplitudes shown inFig. 3. At the two lower amplitudes, one sees a gradualsmooth transition from maximal prolongation to maxi-mal abbreviation of cycle length. However, as stimulusamplitude increases, one needs an increasingly smallerincrement in tc to demonstrate this continuity. For ex-ample, at A = -1.0 PA/cm2 (Fig. 4B), an increment intcof ~2.0 ms is sufficient to reveal the continuity, but at A= -1.5 PA/cm2 (Fig. 4C) one must employ an incrementin tc of 0.1 ms.
At the highest amplitude used in Fig. 3 (A = -2.0 PA/cm2) the current pulse is suprathreshold throughout dias-tole. Maximal prolongation of cycle length does not thenoccur via a prolongation of the duration of diastole as atthe two lower stimulus amplitudes (Fig. 4); instead, i t
occurs via a prolongation of action potential duration.Figure 5 shows voltage tracings at values of tc in theneighborhood of the transition from maximal prolonga-tion to maximal abbreviation of interbeat interval at A= -2.0 pA/cm2. These tracings highlight methodologicalproblems in determining the interbeat interval. It can beseen that the voltage tracing is changing in a nicelycontinuous manner in Fig. 5, with the amplitude of thegraded waveform smoothly increasing as tc increases.Yet, there is arbitrariness involved in deciding at whatcoupling interval the event provoked by the stimulus isto be called an action potential. One criterion might beto say that an action potential occurs when there is some
“active” response, i.e., when the membrane continues todepolarize after the termination of the current pulse. Inthat case, the transition from prolongation to abbrevia-tion of cycle length at A = -2.0 d/cm2 would occursomewhere between tc = 100 ms and tc = 102 ms in Fig.5. By our criterion of a positive-going crossing of -10mV, the transition occurs somewhere between 104 and110 ms.
We now investigate topological aspects of the phase-resetting response of the model (see APPENDIX as well as
50 ,A
V(mV)
-loo\0. 0
tw0.6
FIG. 4. Parts of phase-resetting runs s hown in Fig. 3, A and B, with finer increments in tc. A: unperturbed activity; B: amplitu-1.0 pA/cm2, with tc =146, 154, 156, 158, 162, and 180 ms ; and C:amplitude = -1.5 pA/cm2 , withtc= 126, 126.2, 126.3, 126.5 , 127, 130,and 147 ms . Smallest and largest values oftcused in B and C result in
maxima l prolongation and abbreviation of cycle length, respectivthese 2 amplitudes.
8/3/2019 Michael R. Guevara and Habo J. Jongsma- Phase resetting in a model of sinoatrial nodal membrane: ionic and topol…
wFIG. 6. Plots of normalized perturbed interbeat interval TJTo
1st transient phase # (B), 2nd transient phase ipi (C), and dircomputed new phase a’ (D) at 3 different stimulus amplitudes:
0 t(s) 0.75 0 t(s) 0.75 -1.0 (top row),-1.5 (middle row), and -2.0 (bottom row) PA/cCoupling interval is incremented in steps of1 ms ; Q, denotes the old
FIG. 5. Part of phase-resetting run shown in Fig. 3C (amplitude =phase t,/To. Labeled arrows indicate features described in text. D
-2.0 PA/c m*), but with tc changed more finely. Top left-hand tracelines in middle row indicate where data points fall when tc is ch
show s unperturbed activity; value of tc in ms is indicated on otherin steps of 0.1 ms . In D, data points were calculated from ini
traces.conditions V = -10.000 mV, rn = 0.92806, h = 0.0017017, d = 0.f = 0.76323,p = 0.17147, q = 0.015129, andAt = 0.064 m s, as described
Refs. 14,15, 18,31,49, 50 for background material). The in text*
SINOATRIAL NODE PHASE RESETTING H737
110u
A-1.0
first transient phase @$ is defined by
4!I1 = @ + ATI/To (modulo 1)
the second transient phase G+ by
+‘2 = a, + AT2/T0 (modulo 1)
and the ith transient phase @‘i by
~‘i = @ + ATJTO (modulo 1)
(4
(5
(6
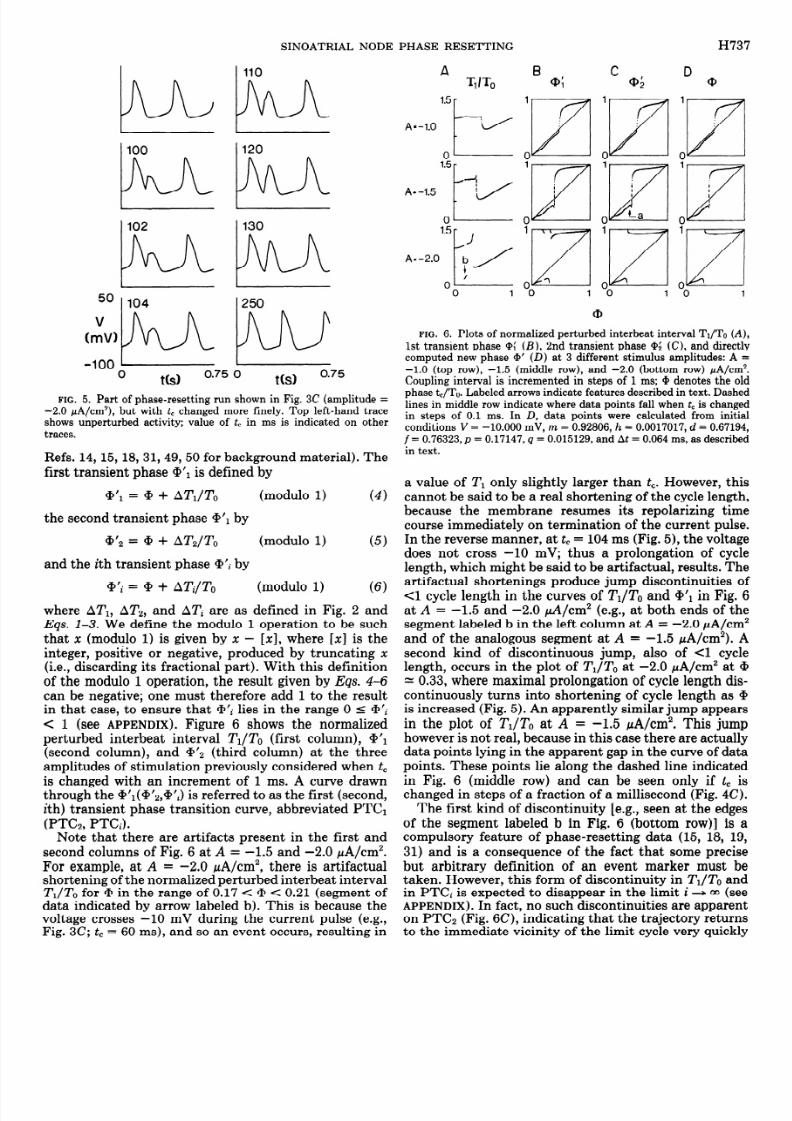
where ATI, AT,, and AT; are as defined in Fig. 2 andEqs. l-3. We define the modulo 1 operation to be suchthat x (modulo 1) is given by x - [xl, where [x] is theinteger, positive or negative, produced by truncating x(i.e., discarding its fractional part). With this definitionof the modulo 1 operation, the result given byEqs. 4-6can be negative; one must therefore add 1 to the resultin that case, to ensure that @‘i lies in the range 0 5 +‘i< 1 (see APPENDIX). Figure 6 shows the normalized
perturbed interbeat interval TI/To (first column), G+(second column), and a’2 (third column) at the threeamplitudes of stimulation previously considered when tcis changed with an increment of 1 ms. A curve drawnthrough the +‘l(@‘a,Qj’i) is referred to as the first (second,ith) transient phase transition curve, abbreviated PTCl(PTCZ, PTCi).
Note that there are artifacts present in the first andsecond columns of Fig. 6 at A = -1.5 and -2.0 pA/cm2.For example, at A = -2.0 pA/cm2, there is artifactualshortening of the normalized perturbed interbeat intervalTI/To for + in the range of 0.17< + < 0.21 (segment ofdata indicated by arrow labeled b). This is because thevoltage crosses -10 mV during the current pulse (e.g.,Fig. 3C; tc = 60 ms), and so an event occurs, resulting in
a value of TI only slightly larger than tc. However, thiscannot be said to be a real shortening of the cycle length,because the membrane resumes its repolarizing timecourse immediately on termination of the current pulse.In the reverse manner, at tc = 104 ms (Fig. 5), the voltage
does not cross -10 mV; thus a prolongation of cyclelength, which might be said to be artifactual, results. Theartifactual shortenings produce jump discontinuities of<l cycle length in the curves of TI/To and @‘I in Fig. 6atA = -1.5 and -2.0 d/cm2 (e.g., at both ends of thesegment labeled b in the left column atA = -2.0 PA/cm2and of the analogous segment at A = -1.5 pA/cm2). Asecond kind of discontinuous jump, also ofCl cyclelength, occurs in the plot ofTJTO at -2.0 PA/cm2 at QH 0.33, where maximal prolongation of cycle length dis-continuously turns into shortening of cycle length as @is increased (Fig. 5). An apparently similar jump appearsin the plot of TJTO at A = -1.5 pA/cm2. This jump
however is not real, because in this case there are actuallydata points lying in the apparent gap in the curve of datapoints. These points lie along the dashed line indicatedin Fig. 6 (middle row) and can be seen only iftc ischanged in steps of a fraction of a millisecond (Fig. 4C).
The first kind of discontinuity [e.g., seen at the edgesof the segment labeled b in Fig. 6 (bottom row)] is acompulsory feature of phase-resetting data (15, 18, 19,31) and is a consequence of the fact that some precisebut arbitrary definition of an event marker must betaken. However, this form of discontinuity inTr/To andin PTCi is expected to disappear in the limit i + 00 (seeAPPENDIX). In fact, no such discontinuities are apparenton PTC2 (Fig. 6C), indicating that the trajectory returnsto the immediate vicinity of the limit cycle very quickly
8/3/2019 Michael R. Guevara and Habo J. Jongsma- Phase resetting in a model of sinoatrial nodal membrane: ionic and topol…
in this model after a perturbation. In addition, on thescale of Fig. 6, the calculated values of @‘a (not shown)superimpose with those of @$. One can thus take PTC2as a very good approximation to PTC,, the “new phase-old phase” curve (see APPENDIX), with a’#, being termedthe new or eventual phase (49).
Note that the transient phases @‘i are calculated usingEQS. 4-6 by inspecting only the voltage waveform; no
account is taken of the activation variables m, d, p, and4 and the inactivation variables h and f. Because theseother variables are not measurable during phase-reset-ting experiments, these formulas involving only V mustof necessity be used in experimental work. However, inmodeling work we can make use of the additional infor-mation contained in these other variables, which arethen accessible, to more directly and perhaps more ac-curately compute the new phase.
We now outline this method, which has previouslybeen used in studying neural (2, 16) and simple two-dimensional (16) imit-cycle oscillators. First, starting att = 0 from init ial conditions appropriate to the point V
= -10 mV on the upstroke of the action potential, theequations of the model are numerically integrated forone full cycle of spontaneous activity. At each iteration,the values of the time t and of the variables V, m, h, d,h p, and q at that time are stored in an array. There are623 points on the limit cycle stored in this way. Second,integration is restarted from the same initial conditions,and a current pulse is injected at a coupling interval tc.The integration is then carried forward for a total timetc + To (with To = 329.2 ms as before), and the coordi-nates (V, ~2, h, d, f, p, and q) of the state point of thesystem at the end of this second integration are stored.A search is then made through the array of 623 points
stored initially to find the one that is nearest to thisterminal point. We use as our measure of the distancebetween two seven-dimensional points X1 = ( Vl, ml, hl,4, fl, PI, and 41) and x2 = ( v2, m2, h2, d2, f2, p2, an il q2)
The weighing factor of 0.01 is included because the rangeof the voltage variable is about two orders of magnitudelarger than that of the other variables, which have arange from zero to one. Once the closest point on thelimit cycle is thus found, we assign the phase of thatpoint, which is simply &/To from the first integrationcarried out, to be the new phase @’ corresponding to theold phase @ = t,lT,. This second integration and subse-quent search is then repeated for a new value of tc.
Figure 6D shows the new phase calculated in this directway at three different amplitudes of stimulation with tcchanging in steps of 1 ms. Data points superimposablewith these are found if, in the second integration stepdescribed above, the integration is carried forward for atime tc + 2To instead of tc + To. This once again indicatesthat the limit cycle is strongly attracting, and that thepoints in Fig. 6D are indeed a very good approximation
to the new phase. Note that there are negligible differ-ences between the new phase found in the direct way(D) and that computed from the voltage waveform alone(C) using Eq. 5. This indicates that the voltage waveformalone can be safely used to calculate the new phase:access to the other variables is not absolutely crucial.Note however that Q’2, and not @II, must be used toobtain a good approximation to the new phase when the
voltage waveform alone is analyzed. Note also that, whenthe direct method is used, artifactual discontinuities ofthe sort resulting when the method involving analysis ofinterevent intervals is used (Fig. 6B) do not occur.
At the lower two amplitudes of Fig. 6 (first and secondrows), type 1 phase resetting occurs, because the averageslope of PTC2, which is a good approximation to PTC,,is unity (seeAPPENDIX). Note that the simulations shownin Fig. 4C imply that data points would fall along thedashed line appearing at + = 0.4 in all panels of thesecond row of Fig. 6 where tc is changed with incrementssmaller than 1 ms. At the lowest amplitude (A = -1.0pA/cm2), +‘2 increases monotonically, whereas at theintermediate amplitude (A =-1.5 pA/cm2), it does not:a downturning in the curve appears at @ = 0.35 (arrowlabeled a). At A = -2.0 PA/cm2 (third row), the averageslope of PTC2 is zero, and type 0 phase resetting is saidto occur (see APPENDIX). The transition from type 1 totype 0 phase resetting occurs at an amplitude just belowA - -1.8 fi/cm2. At A = -1.8 pA/cm2, incrementingsmall-amplitude oscillatory activity can be seen imme-diately after delivery of the current pulse (Fig. 7B), whichis consistent with the fact that one is close to the typel/type 0 border at this amplitude (seeAPPENDIX).
We now turn to investigation of the ionic mechanismsunderlying phase resetting. Figure 8 shows the ionic basisof the lengthening (A ) and shortening (B) of cycle lengthproduced by injecting a current pulse of intermediateamplitude (A = - 1.5 pA/cm2) during diastolic depolari-zation. At tc = 120 ms (A), the total current lies justoutward at the end of the current pulse, producing anegative rate of change in transmembrane potential (dV/dt) and a prolongation of cycle length. In contrast, at tc= 130 ms (B), the total current lies just inward, produc-ing a positive dV/dt that leads to premature activationof I, and a shortening of the interbeat interval. In bothinstances, injection of the current pulse produces almost
0.0t(s)
0.6
FIG.7. Wave forms near type l/type 0 border. Amplitude = -PA/cm’ and tc = 108 ms (A), 109 ms (B), and 110 ms (C). transmembrane voltage.
8/3/2019 Michael R. Guevara and Habo J. Jongsma- Phase resetting in a model of sinoatrial nodal membrane: ionic and topol…
FIG. 8. Ionic basis of transition from prolongation to abbreviationof cycle length. Voltage V is in mV . All c urrents are in PA/cm2 anddrawn to same scale. Activation and inactivation variables d andf ofslow inward current (I,) are shown. A stimulus pulse with amplitude =-1.5 PA/cm 2 is injected at tC= 120 ms (A) and at tC= 130 ms (23).
equal, but oppositely directed, changes in IS and 11. Theincrease in 11 is simply caused by the fact that 11 isoutward and has a positive-slope current-voltage (I- V)relationship. The increase in the magnitude of IS iscaused by two factors. 1) IS is inward and its I-V curve
has a negative slope over this range of potentials (seeFig. 6B of Ref. 23). 2) There is increased activation (i.e.,increase in the activation variable d) and decreasedinactivation (i.e., increase in the inactivation variable f)of Is during the current pulse (Fig. 8). In addition, thepotential at the end of the current pulse ism-44 mV attc = 120 ms and -43 mV at tc = 130 ms, which is aboutwhere the foot of the activation curve for Is is situated(see Fig. 1 of Ref. 23). Thus the fine balance between thechanges in Is and II produced during the current pulsetogether with the setting of the voltage by the currentpulse into the region of activation of the large current Ismakes it possible for small changes in tc to result in
significant changes in the perturbed interbeat intervalT1 at this current amplitude (Fig. 4C).Note that during injection of the current pulse, the
changes in I Na, Ik, and Ih are smaller than those in IS andII; moreover, these changes are not appreciably differentwhen either prolongation or abbreviation of cycle lengthis produced. In fact, if INa and Ih are removed from themodel, traces of V, Itot, Is, IK, and II very similar to thoseshown in Fig. 8 stil l result. This indicates that in thismodel the major ionic mechanisms underlying prolon-gation and abbreviation of interbeat interval (as well asthe rapid transition from the former to the latter) involveIs, II, and, to a lesser extent, IK.
The decrease in the amplitude and the overshoot po-tential of the graded action potential of Fig. 8B islareelv
caused by the decrease in the magnitude of Is. Thisdecrease is in turn caused by the markedly decreasedrate of removal of inactivation (in fact, the inactivationvariable f is almost constant in time) produced immedi-ately after injection of the current pulse (see bottomtrace of Fig. 8B). Once again II is playing a compensatoryrole with respect to I,, with, for example, its peak valuebeing less outward than during unperturbed activity. Astc is increased beyond 130 ms, the overshoot potentialand the maximal rate of rise of the upstroke phase of theaction potential ( vma,) both gradually increase (see Fig.3B; tc = 140, 160, and 180 ms). This is primarily causedby a progressive recovery of the Is waveform back to itsnormal shape. Indeed, for tc greater than -230 ms, theovershoot potential and the peak value of the total cur-rent (and hence Vmax) actually increase beyond theirnormal values. This also occurs at higher current ampli-tudes where the pulse is suprathreshold throughout dias-tole (e.g., Fig. 5; tc = 250 ms). These increases are causedby a direct effect of the current pulse and an increase inINa; IS remains slightly depressed even for tc very close toT00
The maximum diastolic potential (MDP) of a gradedaction potential elicited early in diastole (e.g., Fig. 5;tc
= 120 ms) is slightly more negative (by -1 mV) thanthat of an action potential during unperturbed activityand is followed by a diastolic duration (i.e., time fromMDP to subsequent upstroke) of the poststimulus cyclethat is slightly longer than usual. Despite this prolonga-tion of the diastolic interval, the poststimulus interbeatinterval T2 is stil l reduced below To because the actionpotential duration is reduced much more than the dia-stolic duration is increased (e.g., T2 =316 ms at tc = 120ms in Fig. 5).
We have also investigated the ionic basis of the pro-longation of cycle length produced when a large ampli-tude pulse is delivered during the action potential (e.g.,Fig. 3C; tc = 80 ms). This prolongation is largely causedby an increase in the action potential duration; thediastolic time of the perturbed cycle is only slightlyincreased. As is the case when a very premature gradedaction potential is elicited, this increase in the diastolictime is associated with a slight increase in the negativityof the MDP. The effect of the current pulse is basical lyto reset the various activation and inactivation variablesbackwards in time; when the injection of current ends,the membrane then resumes repolarizing at more or lessthe usual rate appropriate to the voltage at that time.During the current pulse, there is an increase in Is thatis almost exactly balanced by an increase in the sum ofIK and Il.
Even though we have concentrated above on the re-sponse of the model to a depolarizing stimulus, we havealso investigated, in lesser detail, the response to a hy-perpolarizing stimulus. The motivation for doing socomes from the fact that nodal cel ls are normally subjectto vagal stimulation, which is hyperpolarizing. Also, dur-ing spontaneous activity, at any one time some cells ofthe node wil l be more depolarized than others; this
former group of cells will be subject to the hyperpolariz-ine influence of the latter (see Fig. 2-21 of Ref. 15).
8/3/2019 Michael R. Guevara and Habo J. Jongsma- Phase resetting in a model of sinoatrial nodal membrane: ionic and topol…
FIG, 9. Phase-resetting effect of injecting a hyperpolarizing currentpulse. Either shortening(truce a, tC =120 ms) or prolongation(trace c,
tC= 300 ms) of cycle length can be seen, depending on coupling interval.amplitude =4.0 pA/cm2.Trace bshows unperturbed activity.
Figure 9 shows that the response to injection of a hyper-polarizing pulse is the opposite to that of a depolarizingpulse, in that a stimulus falling early (tracea) in thecycle produces a shortening of cycle length, whereas onefalling later (trace c) produces a prolongation. The tran-sition from type 1 to type 0 phase resetting occurs at ahigher stimulus amplitude than with a depolarizing stim-ulus.
CONCLUSIONS
Comparison with experimental results. The computa-tions presented above demonstrate that the phase-reset-ting response of the model of Irisawa and Noma hasmuch in common with that experimentally observed inthe SAN. We now summarize what we see to be the fivemain correspondences, mentioning one discrepancy.
1) The response is biphasic, with a depolarizing cur-rent pulse producing a lengthening of cycle length ifapplied early in the cycle and a shortening if appliedlater (model, Figs. 2-8; see also Refs. 27,36,43 for similarresultsin other SAN models; experiment, Refs. 26, 45,47). A similar biphasic effect of ventricular systole onthe SAN cycle during complete heart block has also been
documented in human beings (data of Roth and Kisch,1948, plotted in Fig. 11-32A of Ref.1; Ref. 22) and hasbeen attributed, among other things, to the action ofventricular currents on the SAN (22). The phase in theP-P cycle at which the QRS complex must fall to producea prolongation or an abbreviation of the P-P interval isconsistent with that interpretation.
In contrast, in both experimental and modeling workon Purkinje fiber, the phase-resetting response is usuallytriphasic, because a slight shortening of action potentialduration, and hence of cycle length, is seen when arelatively large amplitude depolarizing stimulus falls veryearly in the cycle (18). It is thus perhaps not coincidencethat a similar triphasic response is also found in a modelof the SAN derived by modifying a model of Purkinjefiber (Fig. 9A of Ref. 5). In addition, a quinquephasicresponse can be seen in Purkinje fiber when supernormalexcitability occurs (18). We know of no experimentalevidence for either triphasic or quinquephasic responsesin the SAN. The biphasic response of the SAN is reversedwhen a hyperpolarizing current pulse is applied, in thata stimulus falling relatively early in the cycle producesan advance, whereas the same stimulus delivered later inthe cycle results in a delay (model, Fig. 9; see also Refs.5, 36, 43; experiment, Ref. 26). Whereas delays haveoften been seen with vagal stimulation, which is hyper-polarizing in nature, advances have been reported onlyinfrequently.
The maximal prolongation that we have seen in themodel when changing the pulse amplitude in steps of 0.1PA/cm2 and tc in steps of 1 ms occurs at tc = 109 ms andA = -1.8 pA/cm2, producing T1/TO = 1.89 (Fig. 7B).Whereas prolongations of as much as 80% (i.e., 7’JT0 =1.8) have been reported in experimental work on theSAN (26), the corresponding voltage tracings were notshown, and thus we cannot say whether small-amplitudeoscillatory activity of the type shown in Fig. 7B is asso-ciated experimentally with such long prolongations. Thisoscillatory activity is not unexpected near the type l/type 0 border and is presumably caused by the proximityof the trajectory, at the time the current pulse is turnedoff, to the stable manifold of the equilibrium point lyingat V = -34 mV (see APPENDIX). Similar behavior hasbeen previously described in ionic models of the SAN (5,43) and Purkinje fiber (18) and in experimental andmodeling work on embryonic chick ventricular heart cellaggregates (10, 15, 19). However, in the latter case, theoscillatory activity is in the pacemaker rather than theplateau range of potentials, as is an equilibrium point.
2) As the amplitude of a depolarizing stimulus is in-creased, the phase in the cycle at which lengthening ofcycle length turns into shortening decreases, and therange of + over which this transition occurs also de-creases (model, Figs. 3, 4, and 6; see also Refs. 5, 36, 43;experiment, Refs. 26, 45). Similar behavior has beenreported in Purkinje fiber (28), in ventricular heart cellaggregates (19), and in models thereof (10, 15, 18). Infact, in those cases the response can become so abruptas to be effectively discontinuous; for example, in a modelof the aggregate, intermediate responses spanning thediastolic interval (analogous to those shown in Fig. 4C)are not seen in a certain range of amplitudes when tc ischanged with an increment as small as 1 ps (Fig. 3-9 ofRef. 15). Such abrupt behavior is not seen in the SANmodel; this difference is probably connected with the factthat lNa has been implicated in generating such behavior(lo), and lNa in the SAN model is much smaller than inmodels of tissue of ventricular origin.
3) Graded action potentials are seen in response tohigh amplitude depolarizing stimulation (model, Figs. 3and 5, see also Ref. 5; experiment, Refs. 4, 11, 26, 32, 35,47). The overshoot potential and ri,,, tend to increaseas tc is increased; in fact, they exceed the control valueif tc is made sufficiently large (model, Fig. 5; experiment,Refs. 11, 35). Graded action potentials can also be seenin response to a hyperpolarizing stimulus when an ano-dal-break effect is produced. As the amplitude of thehyperpolarizing pulse is increased at fixed tc, there canbe a progressive fall in the overshoot of the action poten-tial (model, not shown; experiment, Fig.3A of Ref. 26).A rise in the overshoot can also be seen in the model(not shown) for other combinations of stimulus ampli-tude and timing (see also Fig. 6B of Ref. 5).
4) Annihilation of activity with a single current pulseis not possible in the model studied above, becauseclamping the membrane to the zero-current potential,setting all activation and inactivation variables to theasymptotic values appropriate to that potential, and thenreleasing the clamp results in the resumption of sponta-
8/3/2019 Michael R. Guevara and Habo J. Jongsma- Phase resetting in a model of sinoatrial nodal membrane: ionic and topol…
neous activity. This result also occurs in the precursorto the model studied here (Fig. 9 of Ref. 51) and is inagreement with the corresponding experimental finding(39). Note that the model studied here is formulatedusing voltage-clamp data from the same experimentalpreparations in which this behavior was found experi-mentally. There is one report of annihilation in strips oftissue taken from the kitten SAN (24); the model consid-ered in this paper (23) can be made to show annihilationif it is suitably modified (unpublished data).
5) In the model, the stimulus pulse has only a slighteffect on the poststimulus and subsequent cycles at lowerstimulus amplitudes, i.e., Ti = 7’0 for i > 2. This isreflected in Fig. 6B (A = -1.5 pA/cm2), where G+ and(P’2 are nearly identical, indicating T2 = To. At higherstimulus amplitudes (e.g.,A = -2.0 pA/cm2), T2 can beconsiderably less than To when a graded action potentialis produced (cf. VI and V2 in bottom row of Fig. 6). Thisis caused by the large decrease in action potential dura-tion, which overrides the slight increase of diastolicduration of the poststimulus cycle (Fig. 5). This increasein diastolic duration is associated in the model with aslightly more negative MDP of the graded action poten-tial. Whereas concurrent increases in the negativity ofMDP and the diastolic duration have been reported (e.g.,Fig. 70 of Ref. 26), prolongation of diastolic duration ismore often associated with an MDP depolarized beyondits usual value (e.g., Refs. 4, 11, 33). In these cases, thediastolic duration can be prolonged to the extent thatsignificant “depression of automaticity” (42) of the SANoccurs. We have not seen such effects in our modelingwork.
Ionic mechanisms underlyingphase resetting. The ionicmechanisms underlying phase resetting in the modelstudied here are similar in some instances to those re-sponsible for analogous behaviors in models of othercardiac oscillators. For example, the mechanisms respon-sible for the prolongation of action potential duration(e.g., Fig. 3C; tc = 80 ms) and for the production of gradedaction potentials (Figs. 3, 5, and 8) are similar to thoseoperating in a model of Purkinje fiber(18). In contrast,the mechanisms operative in the pacemaker range ofpotentials (illustrated in Fig. 8) are quite different fromthose operating in models of Purkinje fiber (18) andheart cell aggregates (10) when similar voltage traces areseen; in both those instances the pacemaker current 1h(or If or IK,) i s a major factor. However, a feature commonto both these classes of models is that the current pulseproduces almost equal, but oppositely directed, changesin the two major currents involved in generating diastolicdepolarization (I, and 11 n the SAN model, 1k, and 11 nthe Purkinje fiber and aggregate models).
At this point, we must stress that the SAN is aninhomogeneous structure, both histologically and elec-trophysiologically (3). For example, action potentials ofdifferent morphologies are found in different parts of thenode during spontaneous activity. Recording from smallpieces cut from the node reveals that these differencesare to a large extent intrinsic, because the morphology
of the action potentials recorded from any piece are quitesimilar to those recorded in situ at the parent location
in the intact node (34). In addition, the response toelectrical stimulation of small pieces coming from differ-ent parts of the node can be quite different (34,35). Themodel investigated above was based on data obtainedfrom voltage-clamp work on small pieces probably takenin large part from regions of the node displaying latentpacemaker activity, because pieces dissected from thedominant pacemaker region apparently only rarely re-cover their spontaneous activity (35). Thus the model ofIrisawa and Noma (23), or for that matter any othermodel of SAN cells, should not be regarded as represent-ative of the SAN as a whole, because of the abovementioned inhomogeneities. In particular, in cel ls of theSAN (6, 35) and models thereof (38, 43) in which 1h ismore implicated in generating diastolic depolarization,one would expect to have a mechanism of phase resettinginvolving 1h when a subthreshold current pulse is deliv-ered during diastole similar to that previously describedin heart cell aggregates (10). One recent modeling studyon the SAN has indeed claimed that effects caused by 1hare important in phase resetting (43). In addition, in themore peripheral regions of the node, where 1Na s presentto a greater degree, one might expect to see an abrupttransition from prolongation to abbreviation of cyclelength when a current pulse of intermediate amplitudeis delivered, similar to that recently described in heartcell aggregates (15, 19) and Purkinje fiber (18). Indeed,in a study on the precursor (51) of the model studiedhere, a more significant role was attributed to lNa whenbehavior similar to that shown in Fig. 8 was analyzed(36)
The model studied here (23) does not contain currentsincluded in other models, e.g., the Na+-K+ pump current(38), the Na+-Ca2+ exchange current (38), and the tran-sient-type calcium current (37), which can have an effecton the beat rate; nor are the various ionic concentrationsallowed to fluctuate as in one other model (38). Althoughpreliminary calculations performed by us on both of thesemodels (37, 38) show no major changes in the phase-resetting characteristics, we cannot rule out at this timethe possibility that there might be one or more aspectsof phase resetting that would be influenced by thesemodifications.
The topology of phase resetting. In many experimentaland modeling studies, plots of TJTO similar to thatshown in Fig. 6 (top row) have been found; these findingsare consistent with the existence of type 1 phase reset-ting. In fact, for any limit-cycle oscillator, type 1 phaseresetting is obligatory at a sufficiently low stimulus am-plitude (see APPENDIX). Patterns of activity very similarto that shown in Fig. 3C have also been seen many timesin the SAN (e.g., Refs. 4, 11, 32, 33). We have identifiedsuch behavior, in which graded action potentials areproduced by stimuli falling relatively early in the cycle,as corresponding to type 0 phase resetting (Fig. 6, bottomrow). Similar voltage waveforms showing graded actionpotentials are also seen during type 0 phase resetting inreaggregates of trypsin-dispersed embryonic chick ven-tricular cel ls (15, 19) and in both experimental and
modeling work on Purkinje fiber (18).The direct calculation of the new phase-old phase
8/3/2019 Michael R. Guevara and Habo J. Jongsma- Phase resetting in a model of sinoatrial nodal membrane: ionic and topol…
curve (Fig. 6D) has not previously been carried out for acardiac oscillator. Such a calculation cannot be carriedout in experimental work. Fortunately, the calculationsshow that consideration of the voltage waveform alone,which is experimentally measurable, gives results verysimilar to the full-blown seven-dimensional calculation(cf. data in C and D of Fig. 6). This finding is probablyconnected in some way with the fact that the voltagevariable plays a role disproportionate to that of any othervariable in models of the Hodgkin-Huxley type.
Our modeling work indicates that determination of Tlalone, which is the common practice, is not sufficient toascertain the type of phase resetting present near theborder between type 1 and type 0 phase resetting; forexample, the TJTO data at A = -1.5 PA/cm2 and A =-2.0 PA/cm2 in Fig. 6A look quite similar, but in theformer case type 1 phase resetting occurs, whereas in thelatter case there is type 0 phase resetting. In addition, atthese two stimulus amplitudes, changing tc in steps assmall as 1 ms is not sufficient to determine the type ofphase resetting present; increments of less than 1 ms arerequired (e.g., Fig. 4C). In all previous experimental andmodeling work on the SAN, tc was not changed suffi-ciently finely in the transitional range of coupling inter-vals (as in Fig. 4) to determine the type of phase resettingpresent. This suggests that previous identifications (24,43, 50) of phase-resetting behavior as being of type 0 inthe SAN were premature.
The transition from type 1 to type 0 phase resettingreported above is direct, in that it takes place at a singlewell-defined value of the stimulus amplitude (just belowA = -1.8 pA/cm2). Three other circumstances have re-cently been described in cardiac oscillators in which thetransition is not direct. In all three cases, type 1 phaseresetting is seen at low amplitudes, type 0 is seen at highamplitudes, and phase resetting to which a topologicaltype or degree cannot be assigned is seen over an inter-mediate range of stimulus amplitudes.
In the first case, it is possible to annihilate sponta-neous activity with a pulse of intermediate amplitude,because of the presence of at least one equilibrium pointthat is stable. This can be seen in the SAN (24), depo-larized Purkinje fiber (25, 44)) depolarized ventricularmuscle (12, 44), and ionic models thereof (unpublisheddata; Refs. 7 and 8, respectively). Note that annihilationcannot occur in the model we have studied, because thereis only one equilibrium point present (Fig 6B of Ref. 23),which numerical simulation reveals to be unstable.
In the second case, because of the presence of a saddleequilibrium point in the system, the topological degreeof the phase resetting is also indeterminate over anintermediate range of stimulus amplitudes (10, 14). Inthis case, the saddle point arises via a saddle-node bifur-cation; such a bifurcation hinges on there being a regionof negative slope in the steady-state I- V curve (10).Whereas the SAN model studied here possesses an N-shaped I-V curve, many specimens of the SAN appar-ently do not possess such an N-shaped I-V curve (e.g.,Ref. 40). In addition, because the negative resistanceregion of the N-shaped curve, when present, tends to bequite shallow in the SAN [unlike for example, in Purkinje
fiber or ventricular cells (40)], i t would be difficult,indeed perhaps even impossible, to clearly distinguishexperimentally this indeterminate case of phase resettingfrom type 1 and type 0 phase resetting. This is true evenin modeling work; in fact, in one recent study of a modelcontaining a saddle point in which type 0 phase-resettingwas said to exist (Fig. 8C of Ref. 43), it is not clear thata sufficiently high pulse amplitude was used to indeedobtain type 0 phase resetting. In addition, V1 was usedto approximate a’,, which will lead to errors of interpre-tation as outlined above.
In the third case, seen in Purkinje fiber (28) and inembryonic chick ventricular heart cell aggregates (19),there is an intermediate range of stimulus amplitude overwhich the membrane demonstrates all-or-none depolar-ization. Modeling work in both these cases suggests thatthis behavior hinges upon the presence of 1~~ (15, 18).One would therefore not expect to see such behavior incells taken from the central region of the SAN, whichpossesses little INa. However, one would expect that itmight be seen in spontaneously active cells taken frommore peripheral regions of the SAN, where INa appearsto be present in significantly larger amounts. Note thateven in the model considered above, which does notcontain much I&, the transition from maximal prolon-gation to maximal shortening of the cycle length Tl canbe very abrupt, taking place with a change in tc of a fewmilliseconds at a stimulus amplitude just below that atwhich the type l/type 0 border is attained (Fig. 4C).
Another circumstance in which a topological degreecannot be ascribed to the phase-resetting response,caused by all-or-none behavior, has recently been de-scribed in experiments on the SAN involving vagal stim-ulation (Fig. 2 of Ref. 30). It is possible that type 0resetting would also have been seen in that case if themagnitude of vagal stimulation would have been furtherincreased. However, the discontinuity seen in this in-stance might be caused by the fact that propagation ofthe cardiac impulse is all-or-none, and the phase-reset-ting response was measured at a site in the right atrium,not the sinoatrial node.
As stimulus amplitude is increased in the model, thereis a direct transition from type 1 to type 0 phase resettingatA = -1.8 pA/cm2. Before this transition occurs, thereis a change in the structure of the type 1 curve; it becomesnonmonotonic at A = -1.3 pA/cm2, and then has twoextrema, one a minimum and the other a maximum. Asimilar change is seen in response to hyperpolarizinginput. Note that this change is obligatory because, asstimulus amplitude increases, there is no way of contin-uously distorting a monotonic curve of degree one into acurve of degree zero. The existence of this nonmonoto-nicity has not previously been pointed out in modelingor experimental work on the SAN. Note that the type 0curve is also, by definition, nonmonotonic, and that at A= -2.0 PA/cm2 (Fig. 6, C and D) it also possesses twoextrema. Nonmonotonicity (also termed noninvertibil-ity) of the PTC has important consequences when alimit-cycle oscillator is periodically stimulated; for ex-ample, the existence of one extremum can result inperiod-doubling bifurcations, leading to alternans pat-
8/3/2019 Michael R. Guevara and Habo J. Jongsma- Phase resetting in a model of sinoatrial nodal membrane: ionic and topol…
terns (13, 15-17, 21); a cascade of such bifurcations canlead to “chaotic” dynamics (13, E-17, 21); and theexistence of two extrema can produce bistability, thecoexistence of two different synchronization patterns,leading to hysteresis (13, 15, 16, 21). Because there areamplitudes at which PTC, possesses four extrema (notshown), the possibil ity of quadristability is also raised.Such four-extrema PTCs have recently been describedin ionic models of Purkinje fiber (18) and depolarizedventricular muscle (29). It remains to be seen whetherthe above phenomena, predicted to exist from the phase-resetting response, are indeed present in the model whenit is subjected to periodic stimulation.
Induction of a rotor. Repetitive activity at a fast ratecan sometimes be seen in the SAN when a prematurestimulus of the correct timing is delivered to the atrium(4, 33). It is generally accepted that these nondrivenrepetitive extrasystoles are caused by reentrant activityproduced when the stimulus falls sufficiently early in thecycle so as to encounter refractoriness and produce blocksomewhere in the SAN itself or in the surroundingperinodal tissue. A theoretical mechanism for producing,de novo, a focus of activity (“rotor”) in a spatially dis-tributed, spontaneously oscillating medium by injectinga stimulus of the proper amplitude and timing has re-cently been propounded by Winfree (50). This mecha-nism hinges on the ability to obtain type 0 phase reset-ting. We have identified the waveforms in Fig. 3C ascorresponding to type 0 phase resetting. Because, aspreviously mentioned, similar waveforms can be seen inthe node in response to premature atria1 stimulation, wecan therefore conclude that the propagated atria1 impulseis sufficiently strong to produce type 0 phase resetting ofnodal cells. Thus the amplitude requirement (50) forprovoking a rotor is satisfied. The traces shown in Fig. 7indicate that the stable manifold of the only equilibriumpoint in the model studied above is encountered at acoupling interval such that the stimulus falls during thelatter part of the repolarization phase of the actionpotential. The critica l timing of the premature stimulustheoretically needed to induce a rotor coincides with thistime (Ref. 50; see also Fig. 2-26 and associated explana-tion in Ref. 15); moreover, this time coincides with the“vulnerable period” during which rapid repetitive activitycan indeed be induced experimentally. Thus both theamplitude and timing criteria for induction of a rotor ina spontaneously active medium are satisfied. Winfree’stheory for the initiation and maintenance of a rotor canalso be extended to the case of a quiescent, but excitable,medium (50); there is recent experimental evidence inquiescent ventricular muscle that lends support to thisextension of the theory (9).
In conclusion, with one major exception reported onabove, the absence of significant depression of automa-ticity, the model of Irisawa and Noma (23) replicates toa large extent the voltage waveforms seen during phase-resetting experiments. This exception might not becaused by any intrinsic shortcoming in the descriptionof a patch of isopotential SAN membrane provided by
the model but rather may be caused by propagation andelectrotonic effects (46) that are necessarily excluded in
our simulations. Indeed, some phenomena that can beseen in response to premature stimulation, such as pace-maker shift (4), will, by definition, only exist if there i sa distributed pacemaker complex. Nevertheless, we findit rather surprising that a relatively simple model, en-compassing only six currents, performs so well. BecauselNa and 1h do not play a great role in the Irisawa-Nomamodel, removal of these two currents results in almostunchanged behavior (the sole exception being that theincreases in overshoot potential and upstroke potentialbeyond the normal value by a pulse delivered late in thecycle are then absent). Thus a four-variable model ( V, d,f, and p) containing only the three currents I,, 1K, and 11would suffice to account, by and large, for the phase-resetting characteristics of the SAN
APPENDIX
A brief introduction to phase resetting, stressing topologicalconcepts, is given by the following. More detailed informationabout the concepts outlined below can be found in the textbooks
of Pavlidis (41) and Winfree (49, 50), as well as in two reviewarticles (14, 31).Phase shift, old phase, andnew phase. When a brief-duration
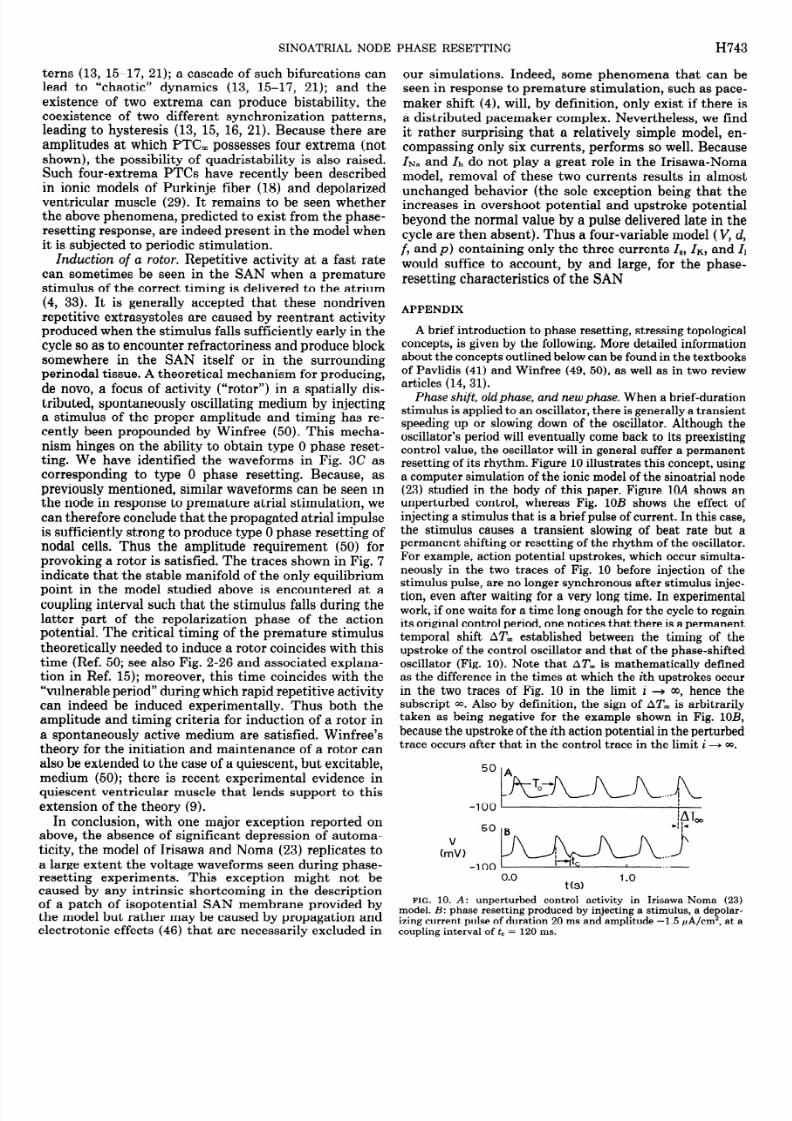
stimulus is applied to an oscillator, there i s generally a transientspeeding up or slowing down of the oscilla tor. Although theoscillato r’s period wi ll eventually come back to its preexistingcontrol value, the oscillator will in general suffer a permanentresetting of its rhythm. Figure10 illustrates this concept, usinga computer simulat ion of the ionic model of the sinoatrial node(23) studied in the body of this paper. Figure 1OAshows anunperturbed control, whereas Fig. 1OB shows the effect ofinjecting a stimulus that is a brief pulse of current. In this case,the stimulus causes a transient slowing of beat rate but apermanent shifting or resetting of the rhythm of the oscil lator.
For example, action potential upstrokes, which occur simulta-neously in the two traces of Fig. 10 before injection of thestimulus pulse, are no longer synchronous after stimulus injec-tion, even after waiting for a very long time. In experimentalwork, if one waits for a time long enough for the cyc le to regainits original control period, one notices that there is a permanenttemporal shift AT, established between the timing of theupstroke of the control oscillator and that of the phase-shiftedoscillator (Fig.10). Note that AT, is mathematically definedas the difference in the times at which the ith upstrokes occurin the two traces of Fig. 10 in the limit i + 00, hence thesubscript 00. Also by definition, the sign ofAT, is arbitrarilytaken as being negative for the example shown in Fig. lOB,because the upstroke of the ith action potential in the perturbedtrace occurs after that in the control trace in the limit i + 00.
50
-100
50v
(mV)-100
iI AT00
B4 p
#luLnAr Ii-yt, .. -
1 . . -
FIG. 10. A: unperturbed control activity in Irisawa-Noma model. B: phase resetting produced by injecting a stimulus, a dep
izing current pulse of duration 20 ms and amplitude -1.5 PA/c m*coupling interval of tC= 120 ms.
8/3/2019 Michael R. Guevara and Habo J. Jongsma- Phase resetting in a model of sinoatrial nodal membrane: ionic and topol…
Thus when AT= = 0, A@,= 0, and there i s no phase shift. ForA@ , < 0, one speaks of a “phase delay,” whereas for A@, > 0,one has a “phase advance.” Because a phase advance of one-half cycle is equivalent to a phase delay of one-half cycle, onemust restrict A@ , to the range -0.5 s A@ , < 0.5. Given that itis possible in general for AT, to exceed To in magnitude, e.g.,when a very long prolongation in cycle length is produced (e.g.,Fig. 5 of Ref. 19), the fractional part of AT,/To must be takenas indicated by the (modulo 1) operation in Eq. Al. We definethe modulo 1 operation to be such that x (modulo1) , for X, areal number (positive or negative), i s given by x - [x], where
[x] indicates the integer (positive or negative) produced bytruncating X, i.e., by removing its fractional part. Because AT,/To(modulo 1) thus gives values lying between -1 and+l,values equal to or bigger than 0.5 or more negative than -0.5must then be converted to values lying in the range -0.5 5A@ , < 0.5 by subtracting 1 or adding 1, respectively, as in Eq.Al.
One can also define the phase shift as the difference betweenthe new phase and the old phase. To do so, one must firstdefine these two phases. The phase in the cycle at which thestimulus is injected is given simply by t,/T,, where To is theintrinsic cycle length of the oscillator, and tc is the couplinginterval at which the pulse is injected (Fig. 10). This particularphase is called the old phase and is denoted by @
@ = &/To (Aa
It is termed the old phase, because it indicates the phase of theoscillator just before delivery of the phase-shifting stimulus. Asa result of its definition as the fractional part of the cycle atwhich the stimulus is injected, one has 0 5 4e) 1. For example,a stimulus pulse injected at the beginning of the cycle isdelivered at @ = 0.0, whereas one injected halfway through thecycle is delivered at Q> 0.5.
The new phase or “eventual phase” @& depends on themagnitude and sign of the phase shift A@ , produced by thestimulus, and is defined by
a; = (@ + AT,/TJ (modulo 1) + N W)
where N is the smallest positive integer ensuring @L > 0. Thesubscript 00 ndicates that the new phase is measured an infi-nitely long time after delivery of the stimulus. Thus at valuesof @where AT, = 0, @Lwill equal + (the new phase will equalthe old phase), and no phase shift will have occurred. Becausethe old phase has the range 0 5 * < 1, one allows the samerange for the new phase, i.e., 0 s a& < 1, so as to be able tocompare new phase with old phase. The fractional part of theterm @ + AT-/To appearing in the right-hand side of Eq. A3must be taken [using the modulo 1 operation], because it ispossible for this sum to equal or exceed unity if AT, is suffi-ciently large. For example, a stimulus that causes a prolonga-tion of exac tly two cyc le lengths does not produce any phaseshift by this definition, because a,& = a. Also, because (@ +
AT,/TJ(modulo 1) can be negative (e.g., if AT, is sufficientlynegative and Qi sufficiently small), onemust convert such a
negative value to a positive value by adding the sm allest positiveinteger (N) that ensures that @& s nonnegative. Fina lly, thedefinition of phase shift A%,, which must have the range -0.5< A@ , < 0.5, can now be given in terms of new phase and oldphase
Note that AT,, A@,, and +X,depend both on stimulus timing(i.e., tc or a) and the stimulus parameters, i.e., stimulus polarity,amplitude, and duration. For a given combination of stimulusparameters, one can investigate in a systematic manner theeffect of changing the old phase *. One can then measure AT,,calculate the phase shift A+ , from Eq. Al, and plot the phaseshift A@ , vs. the old phase @. This curve i s called the phaseresponse curve (PRC ). At a small stimulus strength, a plot suchas that shown in Fig. 1lA results in many biological prepara-tions (49). There is a range of 4pover which A@, < 0(i.e., theoscillator is phase delayed), whereas over another range A+, >0 (i.e., the oscillator is phase advanced). One can also calculate@L from Eq. A3, and plot the new phase a,& vs. the old phase@. This curve i s called the new phase-old phase curve or thephase transition curve (PTC). Figure 11B shows the PTCcorresponding to the PRC of Fig. 1lA. Note that in the limitof zero-stimulus strength, A@ , = 0, independent of @, and sothe PRC approaches the horizontal straight line A@, = 0inthat limit , whereas the PTC approaches the diagonal line @L=cp.
The phase shift A%, in Fig. 1lA does not span the full range-0.5 5 A@ , < 0.5. It is only at a sufficiently high stimulusamplitude that all possible values ofA@ , will be encountered.Figure 11, C and D, shows the PRC and PTC, respectively, inthis case. These two curves are not discontinuous, because aphase shift of 0.5 is equivalent to a phase shift of -0.5, and anew phase of 1.0 is equivalent to a new phase of 0.0. Note that
the old phase @ where A@ , = 0.5 is not the same as that atwhich (a; = 0.
0.5 A
A@
-051
0.5 c
A@ \%0 a, 1
..
-05 \
FIG. 11. Phase response curves (A, C) and phase transition curv(B, D) at low (top row: amplitude = -1.0 PA/cm *) and high (borow: amplitude =-2.0 PA/cm *) levels of stimulus amplitude, corsponding to type 1 and type 0 phase resetting, respectively. Sec
transient phase (B, D) and phase shift (A, C) are shown in these cu(see text).
8/3/2019 Michael R. Guevara and Habo J. Jongsma- Phase resetting in a model of sinoatrial nodal membrane: ionic and topol…
There is a qualitative difference in the two curves of Fig. 11,B and D, the first being obtained at a sufficiently low stimulusstrength and the second at a suff icient ly high strength. Theaverage slope of the PTC in Fig. 1lB is 1, the curve is oftopological degree 1, and thus type 1 phase resetting is said tooccur (49). In contrast, in Fig. llD, the average slope is zero,the curve is of topological degree 0, and so type 0 phase resettingoccurs (49).
Isochrons. These two qualitatively different kinds of PTChave been seen in phase-resetting experiments carried out onmany biological oscillators (49). Why are these two types, andno others, seen? The answer to this question, as initiallypointed out by Winfree (49), lies in the qualitative theory ofdifferential equations. The oscillation in Fig.1OA is describedby a set of differential equations; indeed, it is this set ofequations, forming a model for the sinoatrial node, that wenumerically integrate to produce the trace shown in Fig.1OA.In this model, at any time t, the state of the system is completelyspecified by the values of the seven variables of the system atthat time. These variab les are the transmembrane potential V,and the six activation and inactivation variables (m, h, d, h p,and q) that gate the various ionic currents in the model. Thestate space of the system is thus seven-dimensional, with the
state of the system at any point in time being specified by theposition of a point, the state point, in that seven-dimensionalspace. As the system evolves in time, the state point traces outa curve in the state space called a trajectory. Thus the usualcyc lic activity seen in the model and responsible for producingthe voltage trace shown in Fig. 1OA corresponds to movementof the state point along a closed trajectory called a limit cycle.
Because it is difficult to visualize events occurring in a seven-dimensional space, we use the simple two-dimensional limit-cycle oscillator shown in Fig. 12A to illustrate Winfree’s theory.The thick closed curve with the arrow i s the limit cycle itself.As time proceeds, the state point of the system moves alongthis cy cle in the direction of the arrow, generating a repetitivecyc lic waveform for both variables (X and y) of the system. Letus now perform a phase-resetting experiment by injecting astimulus when the state point is at the point labeled a on thecycle (Fig. 12A), corresponding to an old phase of, say, 0.0.During the time that the stimulus is on, the state point willmove away from its usual path along the limit cycle and willinstead move along the trajectory from point a to point b. Whenthe stimulus is turned off at point b, the trajectory will thenrelax back toward the limit cycle along the path illustrated.Mathematically, even though this trajectory approaches thelimit cycle more close ly as time goes on, it never really returnsto it in finite time. Let us assume that the corresponding newphase (%) in this example is0.1. By continuity, there will bea set of points close to b with the property that if at the end ofa stimulus pulse, the state point coinc ides with any one of thesepoints, the new phase will also be0.1. This set of points forms
a curve that will thread through the limit cyc le. Note that thiscurve, called an isochron, must intersect the limit cycle at apoint, c, where the old phase is 0.1 (Fig. 12B), because, shoulda stimulus deliver the state point to point c, one would have anew phase of 0.1. There are infinitely many isochrons, one foreach value of a&,, hreading through the limit cyc le. In Fig. l2B,we show the 0.1, 0.3, 0.5, 0.7, and 0.9 isochrons. In F ig. 12C,injection of a stimulus at an old phase of, say, 0.6, causes thestate point to move from d to e, which lies on the 0.5 isochron.By starting out from many old phases on the limit cycle, thedashed curve in Fig. 12C can be constructed. This curve is theshifted cycle, which defines the locus of the state point at theend of the stimulus pulse for any old phase, i.e., it is the locusof all points such as b and e shown as specific examples in Fig.
12C. Note that in the case of Fig. 12C, the shifted cycleintersects all isochrons between 0.0 and 1.0; thus given any
A
C
b
b
FIG. 12. Simple 2dimensional limit-cycle oscillator (A) usillustrate concept of isochron (B) and genesis of type 1 (C) and (D) phase resetting. See text for further explanation.
arbitrary isochron with a particular new phase, there is alwayssome old phase, starting from which that new phase is acces-sible. This results in a type 1 new phase-old phase curve, sim ilarto that shown in Fig. 1lB.
As stimulus amplitude is increased, the effect of the pertur-bation wil l be greater, and the shifted cyc le wil l move furtheraway from the lim it cycle. Eventually, a situation such as thatshown in Fig. 120 w ill result. Note that the shifted cycle nolonger intersects all of the isochrons. In fact, isochrons with
new phase in the range from ~0.3 to 0.9 are not accessible inthis particular case, no matter at what old phase the stimuluspulse is injected. Thus a gap will appear in the new phasevalues of the new phase-old phase curve, as in the type 0 curveof Fig. 1lD. Note also that each of the accessible isochrons(e.g., @ii = 0.1 in Fig. 120) has two intersections with theshifted cycle, meaning that any accessible new phase can bereached from two different values of the old phase (see alsoFig. 110).
At one definite stimulus amplitude somewhere between thoseused in Fig. 12 , C and D, one point on the shifted cycle willcoincide with the equilibrium point in the interior of the limitcycle (indicated by the symbol x). Because this is an equilibriumpoint, the state point w ill rest there indefinitely (in a noise-
free system) after stimulation, oscillation will cease, and thenew phase will be undefined for the corresponding old phase.It is precisely at this amplitude that the type l/type 0 borderis encountered. In a state space of dimension greater than 2,this border occurs at the amplitude where the shifted cy cleencounters the stable manifold of the equilibrium point, whichis not a point but a higher-dimensional object such as a curve(49). (Also in that case, the isochrons are not one-dimensionalcurves; for example, in the seven-dimension .a1 ionic modelstudied here, the isochrons are six-dimensional hypersurfaces.)The traces of Fig. 7 are similar to what one would expect whenthe state point of the system lies very close to the stablemanifold after stimulus injection, because they show incre-menting low-amplitude oscillatory activity; indeed the traces
are quite s imilar to what one sees if one starts the simulationwith initial conditions close to the equilibrium point in the
8/3/2019 Michael R. Guevara and Habo J. Jongsma- Phase resetting in a model of sinoatrial nodal membrane: ionic and topol…
model. This interpretation is also consistent with the fact thatthe stimulus amplitude at which these traces are found lies justabove that defining the type l/type 0 border.
Discontinuities in phase resetting.So far, we have character-ized the phase-resetting response in the limit of waiting for aninfinitely long time (Fig. lo), because it is only in that limitthat the trajectory theoretically returns to the limit cycle aftera perturbation (Fig. 12A). However, in experimental and mod-eling work, one must perforce acquire data at a finite time afterdelivery of the stimulus. In addition, real systems are “noisy,”and one can imagine that it would suffice in Fig.12A that thecorresponding noisy trajectory originating atpoint b simplyenters the region of phase space wherein the noisy limit cycleis circulating. As a rule of thumb, one can reliably estimate thenew phase once the cycle length has returned to within a fewpercent of its control value. In cardiac phase-resetting studiesinvolving current-pulse injection, this usually occurs within afew cycles (15).
However, if one does not wait for a suffic iently long time,which has been a common practice in previous experimentaland modeling work, the characteristics of the phase-resettingresponse can be quite altered. The most extreme example ofthis is perhaps seen if one considers the timing of the upstroke
immediately after delivery of the stimulus. In that case, onecan define the first transient new phase a{ in a manner anal-ogous to that in which @Lwas earlier defined in Eq.A3
@i = (@ + AT1/TO) (modulo 1) + N (A5)
where TI is as indicated in Fig. 2. Note that defining an absolutetime TI requires a precise, but arbitrary, definition of when theupstroke occurs. In the body of this paper, we have chosen apositive-going c rossing of -10 mV of the transmembrane po-tential V as our definition of this event marker. In the seven-dimensional phase space of the ionic model, an event thusoccurs when the trajectory pierces the hyperplane V = -10 mVin the direction corresponding to increasing V. One can ingeneral define the ith transient new phase Qi
a$ = (a + ATi/To) (modulo 1) + N (Aa
where the ATis are as indicated in Fig. 2. A plot of QEvs. @ scalled the ith transient phase transition curve (PTC,). Discon-tinuous jumps will exist in general (31) in all of the PTC, (e.g.,see @i in middle and bottom rows of Fig. 6). However, the sizeof these jumps will decrease as i increases. In fact, in the limiti + 00, t can be proven mathematically that these Kawato-Suzuki “discontinuities of the first kind” must heal up, resultingin a PTC, that is continuous (31). Again, the rate at which thediscontinuity heals up will depend on how quickly the trajectoryreturns to the limit cyc le after a perturbation. On the scale ofthe computations shown in this paper, no discontinuit ies are
visible in PTCz (see ‘Pi curves in Fig. 6); indeed, PTC2 issuperimposable with PT&, and so PTCz can be taken as a verygood approximation to PTC,. In fact, in Fig.11 we actuallyshow +I and the second transient phase shift A& (which isdefined as in Eq. Al, replacing A&, with A& and AT, withATZ). In situations in which the effect of the perturbation onthe oscillator is longer lasting (e.g., vagal stimulation of thesinoatrial node), one might have to examine PTCi fori > 4.The origin of the discontinuities in PTCi can be understood ifone considers how the shifted cyc le of Fig. 12, C andD,intersects the event marker surface; for a graphical illustrationof this fact in a simple two-variable model, see Fig. 5 of Ref. 31and associated explanation.
We thank Antoni van Ginneken for helpful conversations andcomm ents on the manus crint. We also thank C hristine Pamnlin. Diane
Colizza, and Sandra Jam es for typing the manusc ript, A. van Hofor drafting Fig. 12, and Martijn Overzier and Robert Thomsonphotographing the figures.
M. R. Guevara thanks the Canadian Heart Foundation and Natural Sciences and Engineering Research Council of Canadapostdoctoral fellowship support (1984-86). The study was suppby grants to H. J, Jongsm a from the Dutch Organization for Research and to M. R. Guevara from the Medical Research CouncCanada.
Address for reprint requests: M. R. Guevara, D ept. of PhysMcGill Univ., 3655 Drummond Street, Montreal, Quebec H3GCanada.
Present address of H. J. Jongsm a: Fysiologisch Laboratorium, versiteit van Amsterda m, Subfaculteit der Geneeskunde, AcademMedisch Centrum, Meibergdreef 15, 1105 AZ Amsterda m, The erlands.
Received 19 Novemb er 1987; accepted in final form 20 October
REFERENCES
1.
2.
3.
4.
5.
6.
7.
8.
9.
10 .
11 .
12 .
13 .
14 .
15 .
16 .
17 .
18 .
19 .
20.
BELLET, S. Clinical Disordersof the Heart Beat (3rd ed.). Philadel-phia, PA : Lea & Febiger, 1971, p. 386.BEST, E. N. Null space in the Hodgkin-Huxley equations: a crtest. Biophys. J. 27: 87-104, 1979.BLEEKER, W. K., A. J. C.MACKAAY, M . MASSON-P&ET, L. N.BOUMAN, ANDA. E. BECKER. Functional and morphological organization of the rabbit sinus node.Circ. Res. 46: 11-22, 1980.BONKE, F. I. M., L. N.BOUMAN, ANDF. J. G. SCHOPMAN. Effectof an early atria1 premature beat on activ ity of the sinotrial and atria1 rhy thm in the rabbit.Circ. Res. 29: 704-715, 1971.BRISTOW, D. G., AND J . W. CLARK. A mathema tical model ofprimary pacemaking cell in SA node of the heart.Am. J. Physiol.243 (Heart Circ. Physiol. 12): H207-H218, 1982.BROWN, H., J .KIMURA, ANDS. NOBLE. The relative contributionsof various time-dependent membrane currents to pacemaker aity in the sino atria1 node. In:Cardiac Rate and Rhythm, edited byL. N. Bouman and H. J. Jongsm a. The H ague: Nijhoff, 19853-68.CHAY, T. R. ,AND Y. S. LEE. Impulse responses of automaticity ithe Purkinje fiber.Biophys. J. 45: 841-869,1984.CHAY, T. R. , AND Y. S. LEE. Phase resetting and bifurcation inthe ventricular myocardium .Biophys. J. 47: 641-651, 1985.CHEN, P.-S., P. D.WOLF, E. G. DIXON, N. D.DANIELEY, D. W.FRAZIER, W. M.SMITH, ANDR. E. IDEKER. Mechan ism of ventric-ular vulnerability to single premature stimuli in open-chest Circ. Res. 62: 1191-1209, 1988.CLAY, J . R. , M. R.GUEVARA, ANDA. SHRIER. Phase resetting ofthe rhythmic activity of embryonic heart cell aggregates: exment and theory.Biophys. J. 45:699-714,1984.D~RTICOS, F. R., J. 0. BUSTAMANTE, J . ALVAREZ, ANDJ . MOR-LANS. Effects of atria1 premature stimulation on sinus node ftion in isolated rabbit atria. CorVasa 20: 417-428, 1978.GILMOUR, R. F. , JR. , J . J .HEGER, E. N. PRYSTOWSKY, ANDD. P.ZIPES. Cellular electrophysiologic abnormalities of diseased huventricular myocardium.Am. J. Cardiol. 51: 137-144,1983.GLASS, L., M. R.GUEVARA, J . BELAIR, ANDA. SHRIER. Globalbifurcatio ns of a periodically forced biological oscillato r.Phys. Reu.A 29: 1348-1357,1984.GLASS, L. , AND A. T. WINFREE. Discontinuities in phase-resettingexperiments. Am. J. Physiol. 246 (Regulatory Integrative CompPhysiol. 15): R251-R258, 1984.GUEVARA, M. R.Chaotic Cardiac Dynamics (PhD thesis). Montreal,Canada: McGill Univ., 1984.GUEVARA, M. R. , L.GLASS, M. C.MACKEY, ANDA. SHRIER. Chaosin neurobiology. IEEETrans. Syst. Man Cybern. SMC-13: 790-798,1983.GUEVARA, M. R. , L.GLASS, ANDA. SHRIER. Phase locking, period-doubling bifurcatio ns, and irregular dyn am ics in periodically ulated cardiac cells.Science Wash. DC 214: 1350-1353, 1981.GUEVARA, M. R. ,AND A. SHRIER. Phase resetting ina model ofcardiac Purkinje fibre.Biophys. J. 52: 165-175, 1987.GUEVARA, M. R. , A.SHRIER, ANDL. GLASS. Phase resetting of
spontaneously beating embryonic ventricular heart cell aggregAm. J. Physiol. 251 (Heart Circ. Physiol.20): H1298-H1305, 1986.GUEVARA, M, R. , A.SHRIER, ANDL. GLASS. Phase-locked rhythms
8/3/2019 Michael R. Guevara and Habo J. Jongsma- Phase resetting in a model of sinoatrial nodal membrane: ionic and topol…
in periodically stimulated heart cell aggregates.Am. J. Physiol. 254(Heart Circ. Physiol. 23): Hl-HlO, 1988.GUEVARA, M. R. , A.SHRIER, ANDL. GLASS. Chaotic and complexcardiac rhythms. In:Cardiac Electrophysiology: From Cell to Bed-side, edited by D. P. Zipes and J. Jalife. Philadelphia, PA: Saunders.In press.HERBERT, W. H. The effect of ventricular action currents on thesinoatrial node.J. EZectrocardioZ. San Diego 3: 121-126, 1970.IRISAWA, H., AND A. NOMA. Pacemake r mech anisms of rabbitsinoatrial nodeceils. In : Cardiac Rate and Rhythm, edited byL. N.Bouman and H. J. Jongsm a. The Hague: Nijhoff, 1982, p. 35-51.JALIFE, J., ANDC. ANTZELEVITCH, Phase resetting and annihila-tion of pacemaker activity in cardiac tissue. ScienceWash. DC 206:695-697,1979.JALIFE, J., ANDC . ANTZELEVITCH. Pacemaker annihilation: diag-nostic and therapeutic implications.Am. Heart J. 100: 128-129,1980.JALIFE, J., A. J. HAMILTON, V. R. LAMANNA, ANDG. K. MOE.Effects o f current flow on pacemaker activity of the isolated k ittensinoatrial node.Am. J. Physiol. 238 (Heart Circ. Physiol. 7): H307-H316,1980.JALIFE, J ., AND D. C.MICHAELS. Phase-dependent interactions ofcardiac pacemakers as mecha nisms of control and synchronizationin the heart. In:Cardiac Electrophysiology and Arrhythmia,editedby D. P. Zipes and J. Jalife. Orlando, FL: Grune & Stratton, 1985,
p. 109-119.JALIFE, J ., AND G. K. MOE. Effect of electrotonic potentials onpacemaker activity of canine Purkinje fibers in relation to para-systole.Circ. Res. 39: 801-808, 1976.KAPRAL, R. Stochas tic dyna mics of limit-cycle oscillators withvulnerable phases.J. Chim. Phys. 84: 1295-1303,1985.KAREMAKER, J. M. Relations between changes in cardiac parasym -pathetic ac tivity and heart rate variability. In:Cardiorespiratoryand Cardiosomatic Psychophysiology, edited by P. Grossma n, K. H.L. Janssen , and D. Vaitl. New York: Plenum, 1986, p. 55-61.KAWATO, M. Transient and steady state phase response curves oflimit cycle oscillators.J. Muth. Biol. 12: 13-30, 1981.KERR, C. R. , E. N.PRYSTOWSKY, D. J . BROWNING, ANDH. C.STRAUSS, Characterization of refractoriness in the sinus node ofthe rabbit. Circ. Res. 47: 742-756, 1980.KLEIN, H. O., D. H.SINGER, ANDB. F. HOFFMAN. Effects of atria1premature systoles on sinus rhythm in the rabbit.Circ. Res. 32:480-491,1973.KODAMA, I. , AND M. R.BOYETT. Regional differences in electricalactivity of the rabbit sinus node.PfZuegers Arch. 404: 214-226,1985.KREITNER, D. Electrophysiological study of the two main pace-
36.
37.
38.
39.
40.
41.
42.
43.
44.
45.
46.
47.
48.
49.
50.
51.
maker m echanism s in the rabbit sinus node.Cardiovasc. Res. 19:304-318,1985.MICHAELS, D. C. , E. P.MATYAS, ANDJ . JALIFE. Dynamic inter-action and mutual s ynchronization of sinoatrial node pacemcells. A mathem atical model.Circ. Res. 58: 706-720, 1986.NILIUS, B. Possible functional significance of a novel typecardiac Ca channel.Biomed. Biochim. Actu 45: K37-K45,1986.NOBLE, D., AND S. J. NOBLE. A mode l of sino-atria1 node electricaactivity based on a modification of the DiFrancesco-Noble tions. Proc. R. Sot. Land. B Biol. S ci. 222: 295-304, 1984.
NOMA, A., AND H. IRISAWA. Effects of Na’ and K+ on the restinmembrane potential of the rabbit sinoatrial node cell.Jpn. J.Physiol. 25: 287-302, 1975.NOMA, A., T.NAKAYAMA, Y. KURACHI, ANDH. IRISAWA. RestingK conductances in pacemaker and non-pacemaker heart cellthe rabbit. Jpn. J. Physiol. 34: 245-254, 1984.PAVLID IS, T. Biologi cal Oscillators: Their Mathemat ical AnalysNew York: Academic, 1973.PICK, A., R.LANGENDORF, ANDL. N.KATZ. Depression of cardiacpacema kers by premature impulses.Am. Heart J. 41: 49-57,195l.REINER, V. S., AND C. ANTZELEVITCH. Phase resetting and anni-hilation in a mathema tical model of sinus node.Am. J. Physiol.249 (Heart Circ. Physiol. 18): H1143-H1153,1985.ROSENTHAL, J. E., AND G. R. FERRIER. Contribution of variableentrance and exit block in protected foci to arrhythmogenesisisolated ventricular tissues .Circulation 67: l-8, 1983.
SANO, T., T. SAWANOBORI, ANDH. ADANIYA. Mechanism ofrhythm determination among pacemaker cells of the mamm asinus node.Am. J. Physiol. 235 (Heart Circ. Physiol. 4): H379-H384,1978.STEINBECK, G., M. A.ALLESSIE, F. I . M.BONKE, ANDW. J. E. P.LAMMERS. Sinus node response to premature atria1 stimulation the rabbit studied with multiple m icroelectrode impalements.Circ.Res. 43: 695-704, 1978.USHIYAMA, J ., AND C. McC. BROOKS. Intracellular stimulationand recording from singlecardiac cells in the rabbit atrium. J.Electrocardiol. 7: 119-126, 1974.VICTORRI, B., A.VINET, F. A. ROBERGE, ANDJ.-P. DROUHARD.Numerical integration in the reconstruction of cardiac actiontentials using Hodgkin-Huxley-type models.Comp. Biomed. Res.18: lo-23,1985.WINFREE, A. T. The Geometry of Biological Time. NewYork:Springer-Verlag, 1980.WINFREE, A. T. When Time Breaks Down: The Three-DimensionalDynamics of Electrochemical Waves and Cardiac Arrhythmias.Princeton, NJ: Princeton Univ. Press, 1987.YANIGIHARA, K., A.NOMA, ANDH. IRISAWA. Reconstruction ofsino-atria1 node pacemaker potential based on the voltage clexperiments. Jpn. J. Physiol. 30: 841-857, 1980.