68
Chapter 8 Trade © 2015 Pearson Education, Inc
| Date post: | 15-Aug-2015 |
| Category: |
Economy & Finance |
| Upload: | mrbagzis |
| View: | 34 times |
| Download: | 0 times |
© 2015 Pearson Education, Inc
Chapter 8Trade

© 2015 Pearson Education, Inc.
Chapter Outline
8.1 The Production Possibilities Curve8.2 The Basis for Trade: Comparative Advantage8.3 Trade between States8.4 Trade between Countries8.5 Arguments against Free Trade
8 Trade

© 2015 Pearson Education, Inc.
1.
Key Ideas
1. The production possibilities curve tells us how much we can produce from existing resources and technology.2. The basis for trade is comparative advantage.3. Specialization is based on comparative, not absolute, advantage.
8 Trade

© 2015 Pearson Education, Inc.
8 Trade
Key Ideas
4.There are winners and losers within trading states and countries.
5.The winners from trade can more than compensate the losers.
6.Important arguments against free trade exist.

© 2015 Pearson Education, Inc.
8 Trade
Evidence-Based Economics Example:
Will free trade cause you to lose your job?

© 2015 Pearson Education, Inc.
8.1 The Production Possibilities Curve
To understand trade between individuals,
states, or countries, you must first
understand trade with yourself.

© 2015 Pearson Education, Inc.
8.1 The Production Possibilities Curve
The Boston Red Sox had a left-handed pitcher who helped the Sox win the World Series in 1916 and 1918 and set the record for consecutive scoreless innings – a record that stood until 1961.
After 1918, he was traded, and in the 1919 season, he only pitched 17 games for his new team—he played outfield instead.
Who was he?

© 2015 Pearson Education, Inc.
8.1 The Production Possibilities Curve
Why did the Yankees put him in the outfield?

© 2015 Pearson Education, Inc.
8.1 The Production Possibilities Curve
Exhibit 8.1 Your Production Schedule

© 2015 Pearson Education, Inc.
8.1 The Production Possibilities Curve
Production possibilities curve
Shows the relationship between themaximum production of one good for a given level of production of another good

© 2015 Pearson Education, Inc.
8.1 The Production Possibilities Curve
Exhibit 8.2 The Production Possibilities Curve

© 2015 Pearson Education, Inc.
8.1 The Production Possibilities Curve
The PPC divides the space into 3 parts:
1. Points B and DThese two points (and all points on the
PPC) represent levels of production of the goods that efficiently use resources.

© 2015 Pearson Education, Inc.
8.1 The Production Possibilities Curve
2. Point AThis point (and all points below the
PPC) represents a level of production of the goods that can be achieved, but that is inefficient because it doesn’t use all resources.

© 2015 Pearson Education, Inc.
8.1 The Production Possibilities Curve
3. Point CThis point (and all points above the
PPC) represents a level of production of the goods that cannot be achieved with the current level of resources.

© 2015 Pearson Education, Inc.
8.1 The Production Possibilities Curve
Two other things about the PPC:
1. Sign of slopeWhy is the PPC negative?
2. Size of slopeWhat does the slope represent?What does one program “cost” you?What does one Web site “cost” you?

© 2015 Pearson Education, Inc.
8.1 The Production Possibilities Curve
How do you complete 240 programs AND 240 Web sites?
1 day of programming = 16, so you’ll need to work 15 days1 day of Web site design = 8, so you’ll need to work 30 days
Total of 45 days of work!

© 2015 Pearson Education, Inc.
8.1 The Production Possibilities Curve
Exhibit 8.3 Two Production Possibilities Curves

© 2015 Pearson Education, Inc.
8.1 The Production Possibilities CurveCalculating Opportunity Cost
What does one program “cost” Olivia?
What does one Web site “cost” her?
© 2015 Pearson Education, Inc.
8.2 The Basis for Trade: Comparative Advantage
Comparative advantage
The ability of one economic agent to produce at lower opportunity cost than another

© 2015 Pearson Education, Inc.
8.2 The Basis for Trade: Comparative Advantage
Web Site Opportunity Cost
Computer Program Opportunity Cost
You 2 computer programs
½ Web sites
Olivia ½ computer program
2 Web sites
Opportunity costs for Web sites and programs

© 2015 Pearson Education, Inc.
8.2 The Basis for Trade: Comparative AdvantageSpecialization
You have a lower cost of producing programs.
Olivia has a lower cost of producing Web sites.
If you each specialize and trade, more output can be produced.

8.2 The Basis for Trade: Comparative AdvantageSpecialization
Exhibit 8.4 The Gains from Specialization
© 2015 Pearson Education, Inc.

© 2015 Pearson Education, Inc.
8.2 The Basis for Trade: Comparative AdvantageAbsolute Advantage
What if you took a course on Web site design and became better than Olivia at both Web site design and computer program production?

© 2015 Pearson Education, Inc.
8.2 The Basis for Trade: Comparative AdvantageAbsolute Advantage
Exhibit 8.5 An Illustration of Absolute Advantage

© 2015 Pearson Education, Inc.
8.2 The Basis for Trade: Comparative AdvantageAbsolute Advantage
Absolute advantage
The ability of an economic agent to produce more output than another agent with the same resources

© 2015 Pearson Education, Inc.
8.2 The Basis for Trade: Comparative AdvantageAbsolute Advantage
Web Site Opportunity Cost
Computer Program Opportunity Cost
You 2/3 computer programs
3/2 Web sites
Olivia ½ computer program
2 Web sites

© 2015 Pearson Education, Inc.
8.2 The Basis for Trade: Comparative AdvantageAbsolute Advantage
Why didn’t Babe pitch again?

© 2015 Pearson Education, Inc.
8.2 The Basis for Trade: Comparative AdvantageThe Price of the Trade
What if Olivia offered to trade you 1 of her Web sites for 1 of your programs? Would you do it?
Web Site Opportunity Cost
Computer Program Opportunity Cost
You 2/3 computer programs
3/2 Web sites
Olivia ½ computer program
2 Web sites

© 2015 Pearson Education, Inc.
8.2 The Basis for Trade: Comparative AdvantageThe Price of the Trade
What if Olivia offered to trade you 2 of her Web sites for 1 of your programs? Would you do it?
Web Site Opportunity Cost
Computer Program Opportunity Cost
You 2/3 computer programs
3/2 Web sites
Olivia ½ computer program
2 Web sites

© 2015 Pearson Education, Inc.
8.2 The Basis for Trade: Comparative AdvantageThe Price of the Trade
What if you offered to trade Olivia 1 of your programs for 3 of her Web sites? Would she do it?
Web Site Opportunity Cost
Computer Program Opportunity Cost
You 2/3 computer programs
3/2 Web sites
Olivia ½ computer program
2 Web sites

© 2015 Pearson Education, Inc.
8.2 The Basis for Trade: Comparative AdvantageThe Price of the Trade
Terms of trade
The “price” of one good in terms of the other; the exchange rate between goods

© 2015 Pearson Education, Inc.
8.2 The Basis for Trade: Comparative AdvantageThe Price of the Trade
Your minimum price for a program = 3/2 Web sitesOlivia’s maximum price for a program = 2 Web sitesTherefore, the terms of trade will be between 3/2 and 2: 3/2 2
Range for terms of trade

© 2015 Pearson Education, Inc.
8.3 Trade between States
Just as individuals gain from specialization and trade, so do states.

© 2015 Pearson Education, Inc.
8.3 Trade between States
What are some sources of comparative advantage among states?

© 2015 Pearson Education, Inc.
8.3 Trade between States
ExportA good produced
domestically and shipped to another state or country
ImportA good produced in
another state or country but sold domestically

© 2015 Pearson Education, Inc.
8.3 Trade between StatesEconomy-Wide PPC
Exhibit 8.4 The Gains from Specialization

© 2015 Pearson Education, Inc.
8.3 Trade between StatesEconomy-Wide PPC
Exhibit 8.7 A Production Possibilities Curve

© 2015 Pearson Education, Inc.
8.3 Trade between StatesEconomy-Wide PPC
Exhibit 8.8 How Improved Technology Shifts the PPC

© 2015 Pearson Education, Inc.
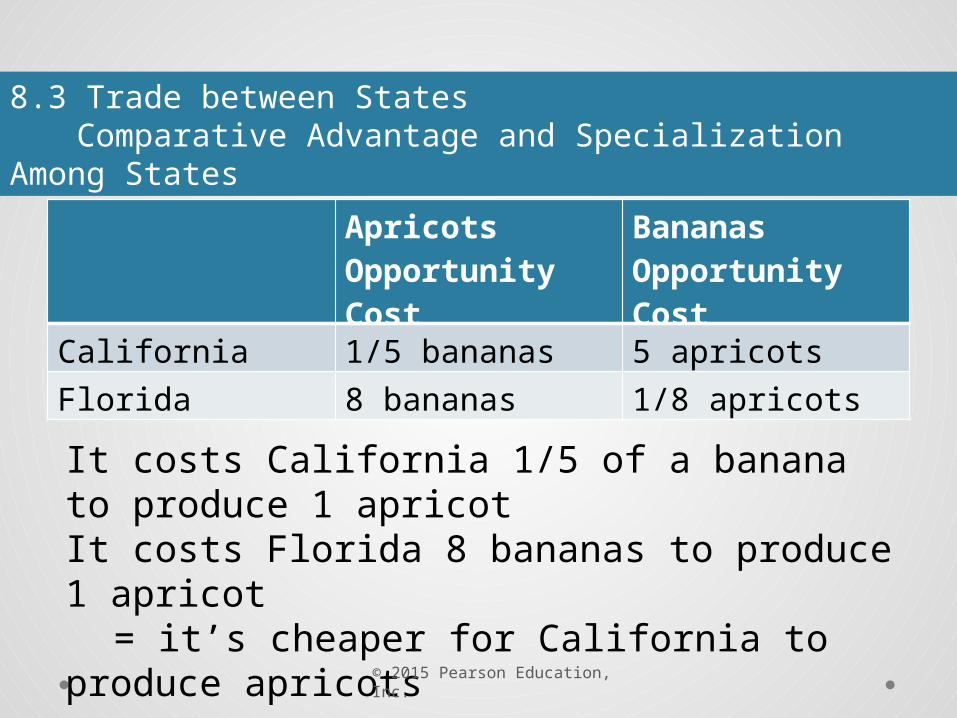
8.3 Trade between StatesComparative Advantage and Specialization Among States
Who should produce what?
Apricots Opportunity Cost
Bananas Opportunity Cost
California 1/5 bananas 5 apricots
Florida 8 bananas 1/8 apricots
© 2015 Pearson Education, Inc.
8.3 Trade between States Comparative Advantage and Specialization Among States
Apricots Opportunity Cost
Bananas Opportunity Cost
California 1/5 bananas 5 apricots
Florida 8 bananas 1/8 apricots
It costs California 1/5 of a banana to produce 1 apricotIt costs Florida 8 bananas to produce 1 apricot
= it’s cheaper for California to produce apricots
© 2015 Pearson Education, Inc.
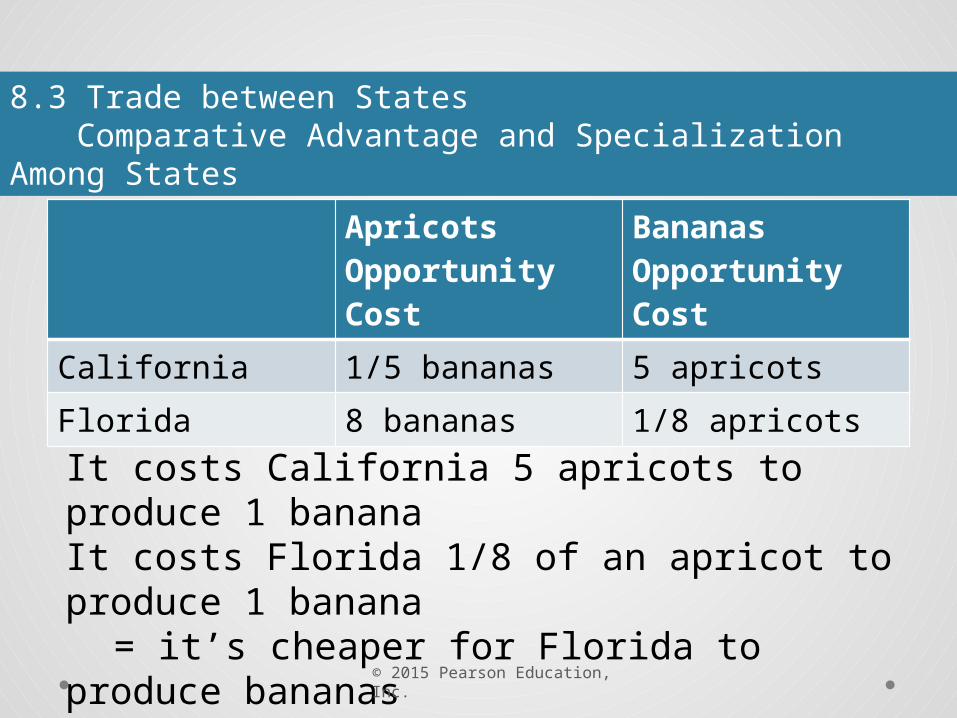
8.3 Trade between States Comparative Advantage and Specialization Among States
It costs California 5 apricots to produce 1 bananaIt costs Florida 1/8 of an apricot to produce 1 banana
= it’s cheaper for Florida to produce bananas
Apricots Opportunity Cost
Bananas Opportunity Cost
California 1/5 bananas 5 apricots
Florida 8 bananas 1/8 apricots

© 2015 Pearson Education, Inc.
8.3 Trade between States Comparative Advantage and Specialization Among States
Florida’s minimum price for a banana = 1/8 apricot
California’s maximum price to pay for a banana = 5 apricots
Therefore, the terms of trade will be between 1/8 and 5:
1/8 5
Range for terms of trade for a banana

© 2015 Pearson Education, Inc.
8.4 Trade between Countries
Exhibit 8.9 U.S. Exports and Imports Since 1960

© 2015 Pearson Education, Inc.
8.4 Trade between Countries
Exhibit 8.11 Changing Trading Patterns for Manufactured Goods

© 2015 Pearson Education, Inc.
8.4 Trade between Countries
Exhibit 8.10 U.S. Imports and Exports of Crude Oil Since 1960

© 2015 Pearson Education, Inc.
8.4 Trade between CountriesDeterminants of Trade Between Countries
The market for tennis shoes in Denmark
Assume free trade—trade with no government involvement—which leads to a world price—price on the world market.

© 2015 Pearson Education, Inc.
8.4 Trade between CountriesDeterminants of Trade between Countries
Will Denmark import or export tennis shoes?
Exhibit 8.12 Equilibrium for Tennis Shoes in Denmark

© 2015 Pearson Education, Inc.
8.4 Trade between CountriesExporting Nations: Winners and Losers
The answer? It depends!
Exhibit 8.13 Winners and Losers in an Exporting Nation

© 2015 Pearson Education, Inc.
8.4 Trade between CountriesExporting Nations: Winners and Losers
Danish consumers Less product at a higher price
Danish shoe producers More product at a higher price

© 2015 Pearson Education, Inc.
8.4 Trade between CountriesExporting Nations: Winners and Losers
Consumer surplus before trade: Area B + D
Consumer surplus after trade: Area D
Loss in consumer surplus of area B
Exhibit 8.13 Winners and Losers in an Exporting Nation

© 2015 Pearson Education, Inc.
8.4 Trade between CountriesExporting Nations: Winners and Losers
Producer surplus before trade: Area A
Producer surplus after trade: Areas A + B + C
Gain in producer surplus of Areas B + C
Exhibit 8.13 Winners and Losers in an Exporting Nation
© 2015 Pearson Education, Inc.
8.4 Trade between CountriesExporting Nations: Winners and Losers
Summary of winners and losers:
Producers gain Areas B + C
Consumers lose Area B
Net overall gain = Area C

© 2015 Pearson Education, Inc.
8.4 Trade between CountriesImporting Nations: Winners and Losers
Exhibit 8.14 Winners and Losers in an Importing Nation
© 2015 Pearson Education, Inc.
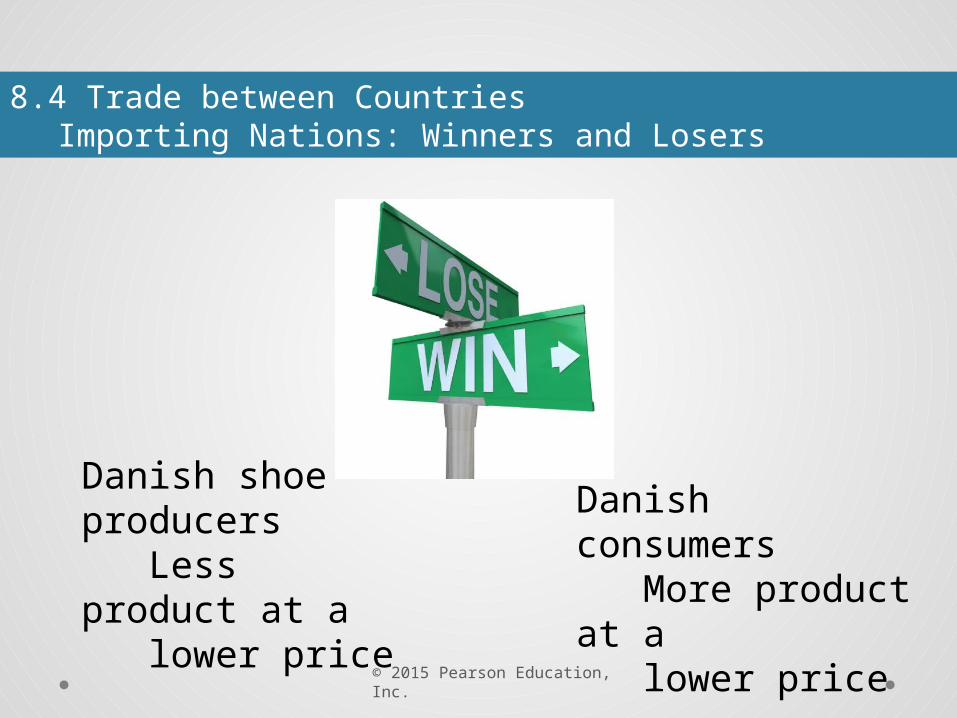
8.4 Trade between CountriesImporting Nations: Winners and Losers
Danish shoe producers Less product at a lower price
Danish consumers More product at a lower price

© 2015 Pearson Education, Inc.
8.4 Trade between CountriesImporting Nations: Winners and Losers
Consumer surplus before trade: Area B
Consumer surplus after trade: Areas B + C + D
Gain in consumer surplus of Areas C + D
Exhibit 8.14 Winners and Losers in an Importing Nation

© 2015 Pearson Education, Inc.
8.4 Trade between CountriesImporting Nations: Winners and Losers
Producer surplus before trade: Areas C + A
Producer surplus after trade: Area A
Loss of producer surplus of Area C
Exhibit 8.14 Winners and Losers in an Importing Nation

© 2015 Pearson Education, Inc.
8.4 Trade between CountriesImporting Nations: Winners and Losers
Summary of winners and losers:
Consumers gain Areas C + D
Producers lose Area C
Net overall gain = Area D

© 2015 Pearson Education, Inc.
8.4 Trade between CountriesImporting Nations: Winners and Losers
In both cases—net exporter or net importer—Denmark is made better off through trading.
The specific winners and losers change, but overall well-being is increased.
Winners could be required to compensate the losers.

© 2015 Pearson Education, Inc.
8.4 Trade between CountriesImporting Nations: Winners and Losers
Why would a domestic price be different than the world price?

© 2015 Pearson Education, Inc.
8.5 Arguments against Free TradeNational Security Concerns
1. National security concerns
Over-reliance on other countries for needed goods and services

© 2015 Pearson Education, Inc.
8.5 Arguments against Free TradeFear of Globalization
2. Effects of globalization—shift toward interdependent economies—on domestic culture
Desire to protect culture from dilution or infringement of other values
© 2015 Pearson Education, Inc.
8.5 Arguments against Free TradeResource Protection
3. Environmental and resource concerns
Countries vary by how stringent their environmental policies are. Free trade can lead to greater pollution and resource depletion in those countries with lax standards because of the increase in demand.

© 2015 Pearson Education, Inc.
8.5 Arguments against Free TradeInfant Industry Arguments
4. Infant industry arguments
When industries are first getting started, they may need some government protection from free trade until they get established.
Protectionism
the view that governments should control trade due to the harmful effects of free trade

© 2015 Pearson Education, Inc.
8.5 Arguments against Free TradeThe Effects of Tariffs
5. The Effects of Tariffs
Exhibit 8.15 The Effect of a Tariff

© 2015 Pearson Education, Inc.
8.5 Arguments against Free TradeThe Effects of Tariffs
Consumer surplus before the tariff: Areas B + F + E + G + H + I + J
Consumer surplus after the tariff: Areas B + F + H
Loss in consumer surplus: Areas E + G + I + J
Exhibit 8.15 The Effect of a Tariff

© 2015 Pearson Education, Inc.
8.5 Arguments against Free TradeThe Effects of Tariffs
Who gets the lost surplus?
Producers get Area E (higher price on more shoes)
Government gets Area I (tax on imports)
Exhibit 8.15 The Effect of a Tariff

© 2015 Pearson Education, Inc.
8.5 Arguments against Free TradeThe Effects of Tariffs
Who gets Areas G + J?
No one = deadweight loss
Exhibit 8.15 The Effect of a Tariff

© 2015 Pearson Education, Inc.
8 Trade
Evidence-Based Economics Example:
Will free trade cause you to lose your job?


![CH 8: Photosynthesis Overview - Biology Thingsbstephen.weebly.com/uploads/7/8/8/1/7881286/ch8_photosynthesis... · CH 8: Photosynthesis Overview ... [CH 2 O] (sugar) Light ... NADPH](https://static.documents.pub/doc/80x56/5afb63e67f8b9a2d5d8f88f7/ch-8-photosynthesis-overview-biology-8-photosynthesis-overview-ch-2-o.jpg)


