1 14 July 2016 Micro Focus International plc Audited preliminary results for the full year ended 30 April 2016 Micro Focus International plc ("the Company" or “the Group”, LSE: MCRO.L), the international software product group, announces audited preliminary results at the high end of management expectations for the year ended 30 April 2016, with reported operating profit doubling year-on-year and final dividend increasing by 50.7%. In September 2014 the Company announced the transformational $2.5bn acquisition of The Attachmate Group, Inc. (“TAG”) which was subsequently completed on 20 November 2014. Trading results of TAG are included for the year ended 30 April 2016 and from the date of acquisition in the figures for the year to 30 April 2015. Key highlights Reported operating profit doubles on reported revenues up 49.2%. Revenue, Underlying Adjusted EBITDA** and basic EPS*** at the top end of management expectations, driven by: o Strong performance by the SUSE Product Portfolio where revenues grew by 18.2% on a pro-forma* CCY basis, offset by anticipated reductions in the Micro Focus Product Portfolio. o Integration benefits resulting in a $75.8m decrease in Adjusted Operating Costs** on a pro-forma CCY basis. On a CCY basis: o Total revenues of $1,245.0m (2015: CCY $804.0m), an increase of 54.9%. o Adjusted EBITDA** of $546.8m (2015: CCY $344.0m), an increase of 59.0%. o Underlying Adjusted EBITDA increased by 59.1% to $532.5m (2015: CCY $334.7m), at a margin of 42.8%. On a pro-forma CCY basis to provide a better comparison of underlying performance: o Total revenues of $1,245.0m (2015: pro-forma CCY $1,270.7m), a reduction of 2.0%. o Adjusted EBITDA of $546.8m (2015: pro-forma CCY $499.3m), an increase of 9.5%. o Underlying Adjusted EBITDA of $532.5m (2015: pro-forma CCY $486.8m), an increase of 9.4%. Growth in Adjusted diluted earnings per share of 13.3% to 146.70 cents (2015: 129.43 cents)*** Acquisition of Serena Software Inc. (“Serena”) announced on 22 March 2016 for $540.0m on a cash and debt free basis, together with a share placing of 10.9m shares at a price of 1,455 pence raising £158.2m ($225.7m) gross and £156.1m ($222.7m) net. Completion of the Serena acquisition took place after the year end on 2 May 2016. Strong cash generation in the period: o Cash generated from operations was $455.7m (2015: $288.7m) representing 87.8% (2015: 110.6%) of Adjusted EBITDA less exceptional costs with second half cash generated from operations of $293.7m, 113.4% of Adjusted EBITDA less exceptional costs. o Free cash flow**** of $238.1m (2015: $173.7m). o Net debt at 30 April 2016 reduced to $1,078.0m (30 April 2015: $1,403.5m) benefiting from the net proceeds of $222.7m from the share placing announced on 22 March 2016. The Serena acquisition completed on 2 May 2016 with resulting increase in pro-forma net debt to $1,625.0m. o Net debt to pro-forma Facility EBITDA** for the year to 30 April 2016 is a multiple of 1.90 times, increasing to 2.51 times on a pro-forma basis including the acquisition of Serena Software Inc.; target remains 2.5 times. Proposed final dividend increased by 50.7% to 49.74 cents per share (2015: 33.00 cents per share) resulting in full year dividend of 66.68 cents per share (2015: 48.40 cents per share). Statutory results Operating profit of $294.9m (2015: $147.2m) Profit before tax of $195.4m (2015: $91.4m) Basic earnings per share of 74.50 cents (2015: 58.54 cents) an increase of 27.3%***
Transcript
1
14 July 2016
Micro Focus International plc Audited preliminary results for the full year ended 30 April 2016
Micro Focus International plc ("the Company" or “the Group”, LSE: MCRO.L), the international software product group, announces audited preliminary results at the high end of management expectations for the year ended 30 April 2016, with reported operating profit doubling year-on-year and final dividend increasing by 50.7%.
In September 2014 the Company announced the transformational $2.5bn acquisition of The Attachmate Group, Inc. (“TAG”) which was subsequently completed on 20 November 2014. Trading results of TAG are included for the year ended 30 April 2016 and from the date of acquisition in the figures for the year to 30 April 2015.
Key highlights
Reported operating profit doubles on reported revenues up 49.2%.
Revenue, Underlying Adjusted EBITDA** and basic EPS*** at the top end of management expectations, driven by: o Strong performance by the SUSE Product Portfolio where revenues grew by 18.2% on a pro-forma* CCY basis, offset
by anticipated reductions in the Micro Focus Product Portfolio. o Integration benefits resulting in a $75.8m decrease in Adjusted Operating Costs** on a pro-forma CCY basis.
On a CCY basis: o Total revenues of $1,245.0m (2015: CCY $804.0m), an increase of 54.9%. o Adjusted EBITDA** of $546.8m (2015: CCY $344.0m), an increase of 59.0%. o Underlying Adjusted EBITDA increased by 59.1% to $532.5m (2015: CCY $334.7m), at a margin of 42.8%.
On a pro-forma CCY basis to provide a better comparison of underlying performance: o Total revenues of $1,245.0m (2015: pro-forma CCY $1,270.7m), a reduction of 2.0%. o Adjusted EBITDA of $546.8m (2015: pro-forma CCY $499.3m), an increase of 9.5%. o Underlying Adjusted EBITDA of $532.5m (2015: pro-forma CCY $486.8m), an increase of 9.4%.
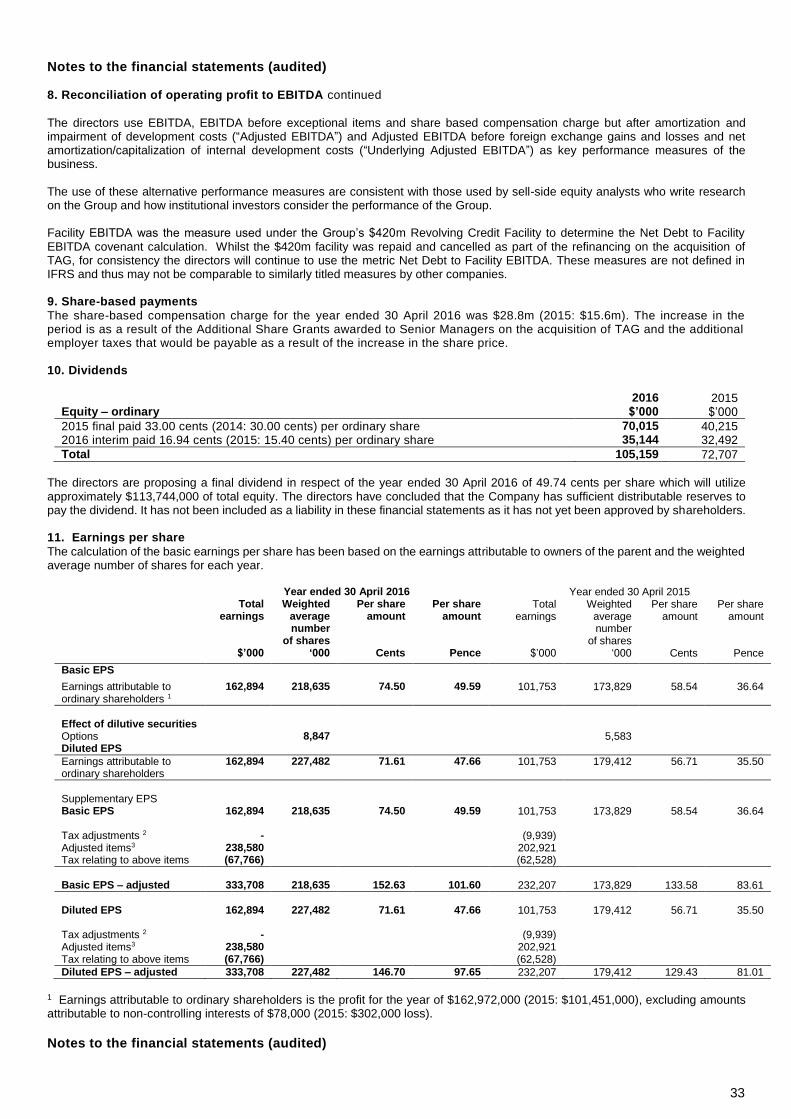
Growth in Adjusted diluted earnings per share of 13.3% to 146.70 cents (2015: 129.43 cents)***
Acquisition of Serena Software Inc. (“Serena”) announced on 22 March 2016 for $540.0m on a cash and debt free basis, together with a share placing of 10.9m shares at a price of 1,455 pence raising £158.2m ($225.7m) gross and £156.1m ($222.7m) net. Completion of the Serena acquisition took place after the year end on 2 May 2016.
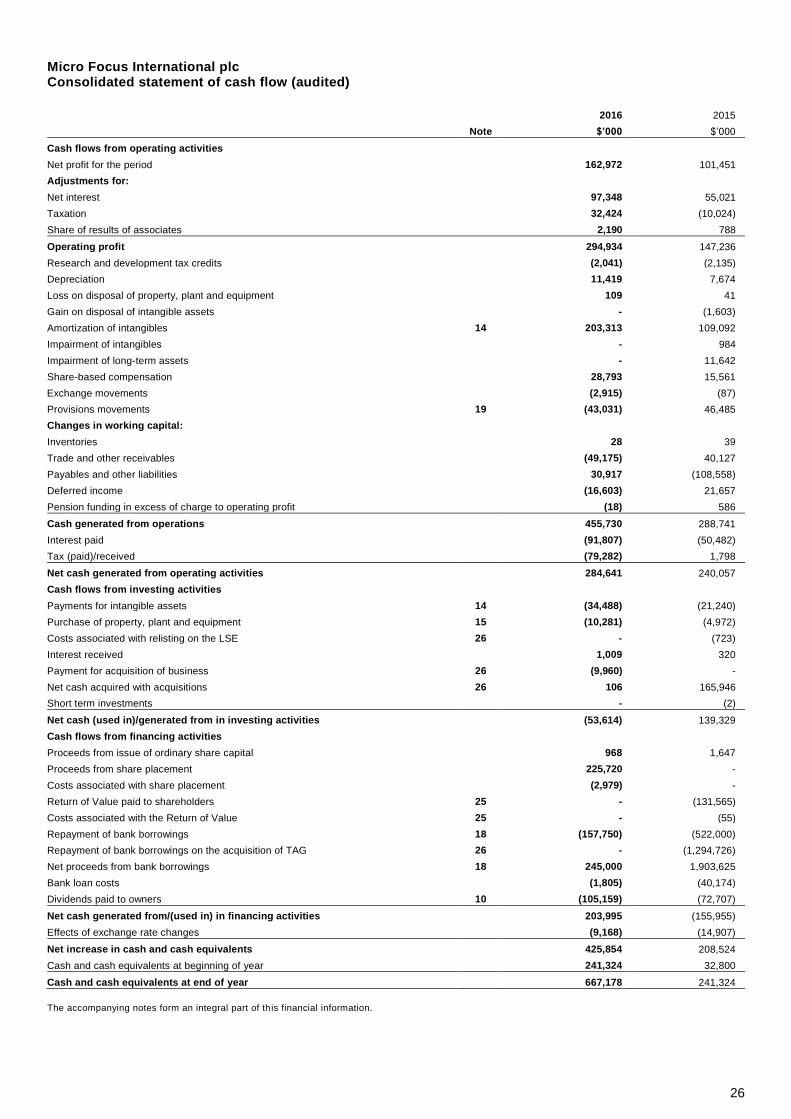
Strong cash generation in the period: o Cash generated from operations was $455.7m (2015: $288.7m) representing 87.8% (2015: 110.6%) of Adjusted
EBITDA less exceptional costs with second half cash generated from operations of $293.7m, 113.4% of Adjusted EBITDA less exceptional costs.
o Free cash flow**** of $238.1m (2015: $173.7m).
o Net debt at 30 April 2016 reduced to $1,078.0m (30 April 2015: $1,403.5m) benefiting from the net proceeds of $222.7m from the share placing announced on 22 March 2016. The Serena acquisition completed on 2 May 2016 with resulting increase in pro-forma net debt to $1,625.0m.
o Net debt to pro-forma Facility EBITDA** for the year to 30 April 2016 is a multiple of 1.90 times, increasing to 2.51 times
on a pro-forma basis including the acquisition of Serena Software Inc.; target remains 2.5 times.
Proposed final dividend increased by 50.7% to 49.74 cents per share (2015: 33.00 cents per share) resulting in full year dividend of 66.68 cents per share (2015: 48.40 cents per share).
Statutory results
Operating profit of $294.9m (2015: $147.2m)
Profit before tax of $195.4m (2015: $91.4m)
Basic earnings per share of 74.50 cents (2015: 58.54 cents) an increase of 27.3%***
2
The table below shows the reported results for the Group at actual exchange rates with CCY FY15 comparatives except where stated otherwise:
Results at a glance FY16
FY15
Change
Revenue Total Revenue Constant Currency $1,245.0m $804.0m +54.9%
* Due to the significant size of the TAG acquisition the directors believe that the full year results are better understood by comparing the results in the period
with the pro-forma CCY results of the combination of TAG and Base Micro Focus in the comparable period. In arriving at pro-forma CCY results for year ended 30 April 2015 the directors have combined the unaudited internal management information for TAG for the period from 1 May 2014 to 20 November 2014 with the audited Group results for the year ended 30 April 2015 converted at the same exchange rates as experienced in the current period.
** In assessing the performance of the business, the directors use non GAAP measures “Adjusted Operating Profit”, “Adjusted Operating Costs” and “Adjusted
earnings per share”, being the relevant statutory measures, prior to exceptional items, amortization of purchased intangibles and share based compensation. “Adjusted EBITDA” is the Adjusted Operating Profit prior to depreciation and amortization of purchased software. Underlying Adjusted EBITDA removes the impact of net capitalization/amortization of development costs and foreign currency gains and losses from Adjusted EBITDA whilst Facility EBITDA is Adjusted EBITDA before amortization and impairment of capitalized development costs. A reconciliation of these profit measures is given in note 8.
*** Earnings per share are detailed in note 11.
**** Free cash flow is cash generated from operations less net interest payments and loan costs, tax, intangible assets and purchase of property, plant and equipment.
3
Kevin Loosemore, Executive Chairman of Micro Focus, commented:
“The board is delighted with the progress that has been made with the integration of the TAG business, the acquisition of Serena and the opportunities being presented as the infrastructure software market continues to mature. Our staff continue to work diligently to realize the value opportunities from this consolidating market space.
We look forward to the coming year with optimism and excitement about the opportunities to come. We remain absolutely focused on growing shareholder returns which we see as the true measure of growth. In that context we are delighted to have announced a return to a policy of twice covered dividend.”
Enquiries: Micro Focus Tel: +44 (0) 1635 32646
Kevin Loosemore, Executive Chairman
Mike Phillips, Chief Financial Officer
Tim Brill, IR Director
Powerscourt Tel: +44 (0) 20 7250 1446
Peter Ogden
Sophie Moate
About Micro Focus
Micro Focus (LSE: MCRO.L) is a global enterprise software Company supporting the technology needs and challenges of the Global 2000. Our solutions help organizations leverage existing IT investments, enterprise applications and emerging technologies to address complex, rapidly evolving business requirements while protecting corporate information at all times. Our Product Portfolios are Micro Focus and SUSE. Within Micro Focus our solution portfolios are COBOL Development and Mainframe Solutions, Host Connectivity, Identity and Access Security, IT Development and Operations Management Tools, and Collaboration and Networking. For more information, visit: www.microfocus.com. SUSE, a pioneer in Open Source software, provides reliable, interoperable Linux, cloud infrastructure and storage solutions that give enterprises greater control and flexibility. For more information, visit: www.suse.com.
Forward-looking statements
Certain statements in this audited preliminary results statement are forward-looking. Although the Group believes that the expectations reflected in these forward-looking statements are reasonable, it can give no assurance that these expectations will prove to be correct. Because these statements involve risks and uncertainties, actual results may differ materially from those expressed or implied by these forward-looking statements. The Group undertakes no obligation to update any forward-looking statements whether as a result of new information, future events or otherwise.
2016 was the first full year of operations for the new organization formed following the acquisition of TAG. This created a Global Infrastructure Software business with revenues of c$1.25bn and EBITDA of c$530m which has since traded in line with our expectations of revenue and ahead of expectations for EBITDA. This was achieved during a year of significant change as we began implementation of the outputs from our integration review. In addition, we announced the acquisition of Serena on 22 March 2016 which was subsequently completed on 2 May 2016. Serena was acquired for an enterprise value of $540m having delivered $162.3m of revenue and $80.9m of Underlying Adjusted EBITDA in the year ended 31 January 2016. It is increasingly clear that there are significant segments of the infrastructure software market that have matured. The likely response to this is consolidation. To be successful in this stage of a market both operational effectiveness and scale are critical. We believe that Micro Focus is now well positioned to lead in this space. Like the TAG acquisition, the acquisition of Serena has clear business logic to extend Micro Focus market presence in mature infrastructure software segments; to increase the operational efficiency of the combined Group; to deliver effective product management and improve sales productivity. It is 100% consistent with the Company’s strategy which, as you will see in our Annual Report and Accounts, has not had any significant changes from the plan laid out four and a half years ago. Micro Focus sets out to deliver consistent long-term shareholder returns of between 15% and 20% per annum. The board is confident that medium-term low single digit revenue growth, industry leading margins and strong cash conversion will ensure that Micro Focus can deliver on that strategy. These returns can be further enhanced by the appropriate deployment of capital in value enhancing acquisitions. The Company has a business strategy, a financial strategy, an operating plan and an incentive strategy that all support our objective to achieve 15% to 20% compound annual return for shareholders. Since IPO in 2005 until 30 April 2016 the annual compound shareholder return over 11 years has been 26.4%. Adjusted diluted earnings per share have grown from 14.23 cents in 2006 to 146.70 cents in 2016 and dividends per share have grown from 6 cents to 66.68 cents with respective compound annual growth rates of 26.3% and 27.2% respectively. When we announced the acquisition of TAG on 15 September 2014 we set out a four phase plan for the combination of the businesses whilst continuing to deliver sustainable shareholder returns.
Financial Year
FY2015 FY2016 FY2017 FY2018
Phase Assessment Integration Stabilization Growth
Actions Deliver plans for FY15
Detailed review of combined businesses
Invigorate Product Management
Standardize systems
Rationalize Properties
Rationalize Legal entities
New Go to Market (“GTM”) model
Maintain/improve cash conversion
Rationalize underperforming elements
New market initiatives
Stabilize top line
Improve GTM productivity
Growth from new areas
Improved profitability Standardize systems Rationalize Legal
entities
Top line growth
Standardize systems
Rationalize Legal entities
The only changes to this plan are that our detailed review concluded that the integration of systems supporting the new business will extend throughout the four year period and the rationalization of legal entities will extend through FY17 and beyond. The acquisition of Serena does not change this plan but may slightly delay the return to revenue growth as we consolidate the Serena products. As with prior transactions we expect Serena’s revenue trend to continue its historic decline until significant change has been implemented. This further integration will be included in the remaining two stages of the plan that will consolidate and strengthen the combined business, with the goal of delivering modest revenue growth in the medium-term. We are building a strong platform and with the addition of Serena we have annual pro-forma cash generated from operations in the year ended 30 April 2016 of approximately $524m per annum and free cash flows of approximately $274m, from which we can achieve significant returns of value to our shareholders and/or further highly accretive acquisitions.
Our performance in the year
Following our integration review in 2015 we decided that the Group should operate two product portfolios, Micro Focus and SUSE and have reported the business this way since 1 May 2015. In December 2015 we announced that effective 1 February 2016 Stephen Murdoch would become Chief Executive Officer (“CEO”) of the Micro Focus portfolio and Nils Brauckmann CEO of the SUSE portfolio. Stephen and Nils discuss the operating performance of their respective portfolios in their CEO reports. Micro Focus Group delivered revenues and Underlying Adjusted EBITDA of $1,245.0m and $532.5m respectively which is at the top end of the guidance given at the beginning of the year. Our net debt at 30 April 2016 was $1,078.0m and once we had completed the acquisition of Serena this had increased to $1,625.0m on a pro-forma basis. We would like to thank our employees for their continued dedication, commitment and hard work in delivering the full year results.
5
For the year ended 30 April 2016 bonuses were paid to executive management and non-commissionable staff in Micro Focus in line with the improvement in Underlying Adjusted EBITDA of the Group on a constant currency (“CCY”) basis excluding the impact of in year acquisitions. Staff bonuses were paid at 100% of their on target amount reflecting a 10.0% increase in Underlying Adjusted EBITDA of Micro Focus at their budgeted exchange rates and this applied also to executive management who are capped at 100%. Non-commissioned staff fully aligned with SUSE were targeted 50% on improvement in Underlying Adjusted EBITDA of the Group and 50% on delivery of Annual Contract Value (“ACV”) growth targets in SUSE. Their bonus payment was 126% of their on target amount, reflecting stronger than targeted achievement in the ACV component. The amount charged to the consolidated statement of comprehensive income in respect of the Corporate Bonus plan in the actual results for the year ended 30 April 2016 was $45.6m. Delivering value to shareholders
The board has adopted a very clear plan of value creation.
Our priority is to improve the performance of the business in order to maximize the opportunity to generate modest revenue growth in the medium-term. At the same time we have created flexibility to allow value creation to shareholders through cash distributions or acquisitions as appropriate. We will do nothing that will constrain our ability to achieve organic growth and we are currently investing significant amounts on activities designed to enhance growth. The Company’s market capitalization at 30 April 2016 was £3,496.5m. The original Micro Focus shareholders prior to the announcement of the TAG transaction who now own 56.8% of the Company have seen their total investment increase from £1,178.6m to £1,986.0m over a period of 19 months and during that period have received a Return of Value of £83.9m and ordinary dividends of £55.0m.
The board is targeting a net debt to Facility EBITDA multiple of approximately 2.5 times. This is a modest level of gearing for a company with the cash generating qualities of Micro Focus. We are confident that this level of debt would not reduce our ability to deliver growth, invest in products and/or make appropriate acquisitions. As the integration of the businesses continues the board will keep the appropriate level of debt under review. In order to complete the acquisition of Serena the Company extended its revolving credit facility from $225.0m to $375.0m on 2 May 2016 and raised money from shareholders for the first time since the IPO in May 2005 when it placed 10.9m shares with institutional investors raising $222.7m net of expenses in March 2016. At 30 April 2016 we had net debt of $1,078.0m which was prior to the completion of the Serena acquisition. Once the transaction completed the pro-forma net debt was $1,625.0m representing a pro-forma net debt to pro-forma Facility EBITDA of 2.51 times. On completion of the TAG acquisition the board adopted a progressive dividend policy whilst the net debt to Facility EBITDA was above 2.5 times. Absent a significant acquisition, share buy-back opportunity or unforeseen circumstances the net debt to Facility EBITDA multiple will be below 2.5 times at the end of April 2017 and so the board is proposing an increase in the dividend payout such that it is 2 times covered by the adjusted earnings of the Group. This policy will take effect from the proposed final dividend of 49.74 cents (2015: 33.00 cents per share), which represents a 50.7% increase on last year’s final dividend and gives a total proposed dividend for the year of 66.68 cents per share (2015: 48.40 cents), an increase of 37.8%.
The dividend will be paid in Sterling equivalent to 37.40 pence per share, based on an exchange rate of £1 = $1.33, the rate applicable on 13 July 2016, the date on which the board resolved to propose the dividend. The dividend will be paid on 7 October 2016 to shareholders on the register at 2 September 2016. In line with our target net debt to Facility EBITDA multiple of 2.5 times and consistent with our shareholder return policy it is the board’s current intention, absent a significant acquisition, share buy-back opportunity or unforeseen circumstances, to make a further Return of Value to shareholders in calendar year 2017. Board changes and succession planning
Since April 2011 I had held the roles of both Chairman and Chief Executive. In December we announced that effective from 1 February 2016, I would be Executive Chairman and that Stephen Murdoch and Nils Brauckmann would become CEO of Micro Focus and CEO of SUSE respectively. During the year there were a number of other board changes. At the AGM in September 2015, Tom Skelton stepped down from the board after serving as a non-executive director for nine years. We would like to thank Tom for his contribution to the success of Micro Focus. Karen Geary who joined the board as a non-executive in January 2015 has now become Group HR Director and a member of the senior management team. Prescott Ashe and David Golob stepped down from the board on 1 February 2016 in anticipation of Wizard’s shareholding reducing below 15%. Stephen Murdoch and Nils Brauckmann joined the board on 1 February 2016 as CEO’s of Micro Focus and SUSE respectively whilst on the same day Steve Schuckenbrock joined as an independent non-executive director. Finally, we were delighted to welcome Amanda Brown to the board on 1 July 2016 as a non-executive director. We welcome the new members of our board and biographical details of all board members will be available in the Annual Report and Accounts.
6
Outlook
During FY17, in accordance with our four phase plan, we intend to stabilize revenues around a solid core from which we aim to grow in FY18. As a result we anticipate revenues in FY17 being in the range minus 2% and zero% on FY16 on a CCY basis, pro-forma for the acquisition of Serena as set out in the Financial Review section below. Having delivered 11 years of approximately 26.4% compound returns to investors we believe we have a strong operational and financial model that can continue to scale and provide excellent returns to our shareholders. Kevin Loosemore Executive Chairman
13 July 2016
7
Financial Review Due to the significant size of the TAG acquisition the directors believe that the full year results are better understood by comparing the actual results in the year with the pro-forma CCY results of the combination of TAG and Base Micro Focus in the comparable period. In arriving at pro-forma CCY results for the comparable period of the 12 months ended 30 April 2015 the directors have combined the unaudited internal management information for TAG for the period from 1 May 2014 to 19 November 2014 and then added in the Base Micro Focus results for the 12 months ended 30 April 2015 with the TAG audited results from 20 November 2014 to 30 April 2015 converted at the same average monthly exchange rates experienced in the year to 30 April 2016. Following our integration review in FY15 we decided that the Group should operate two product portfolios from 1 May 2015 (i) Micro Focus and (ii) SUSE. These are the reporting segments and the cash generating units for the Group going forward. The Micro Focus product portfolio contains our mature infrastructure software products that are managed on a portfolio basis akin to a “fund of funds” investment portfolio. This portfolio is being managed with a single product group that makes and maintains the software, whilst the software is sold and supported through a geographic GTM organization. As part of the integration review we have grouped the products together into five sub portfolios based on industrial logic. There was significant organizational change in the Micro Focus product portfolio in bringing together the prior organizations and we have been delighted with the progress during FY16. In comparison, the SUSE product portfolio experienced much less change at the beginning of the financial year in the way that it operated. SUSE’s characteristics are different due to the Open Source nature of its offerings and the growth profile of those offerings. Our revenue guidance at the beginning of the year and after the Interim results in December 2015 was for revenues to decline by between 2% and 4% when compared to the pro-forma CCY revenues of the comparable period with growth in SUSE expected to partially offset the anticipated decline in the Micro Focus product portfolios based on the revenue trends in the sub-portfolios. The guidance took account of the fair value deferred revenue accounting haircut of $16.6m (2015: $17.0m) taken at the time of the acquisition of TAG. The performance in the year was at the top of management’s guidance with overall revenues declining by 2.0% when compared to pro-forma CCY revenues. The breakdown in revenue within the two Product Portfolios by revenue type compared to the pro-forma CCY revenues in the year to 30 April 2016 and the year ended 30 April 2015 is shown in the table below:
The table below provides the proportion of revenue delivered during FY16 by each of the portfolios and the comparison to the pro-forma FY15 CCY revenues with Micro Focus broken out into its sub-portfolios:
Percentage of FY16
revenues
Percentage of FY15 Pro-forma CCY revenues1
COBOL Development & Mainframe Solutions 20.8% 20.1%
Host Connectivity 15.9% 16.1%
Identity, Access & Security 17.4% 17.1%
Development & IT Operations Management Tools 12.6% 14.3%
Collaboration & Networking 12.9% 15.5%
Micro Focus Portfolio 79.6% 83.1%
SUSE Portfolio 20.4% 16.9%
Micro Focus Group 100.0% 100.0% 1 unaudited
We are providing additional Key Performance Indicators ("KPIs") for the SUSE product portfolio for the first time in this set of results. Total Contract Value ("TCV") is the amount invoiced to customers (excluding sales tax) in respect of new contracts and renewals completed in the year. The weighted average contract length expressed in months, reflecting the duration of the TCV is also being provided as growth in TCV alone without this information is potentially misleading. Finally we are providing ACV which aims to normalize contract length by only including the first 12 months of each new contract or renewal included within TCV. Where the contract length is less than 12 months all of the TCV is included in ACV.
We are not providing renewal rate information for SUSE or Micro Focus within this set of results. Our methodology is still being refined in order to accommodate data from our multiple systems. Once we have a common methodology and are content with the data we will provide clear explanations of both. In the meantime we believe that following the trends on the maintenance revenue for the Micro Focus sub-portfolios and subscription revenues for SUSE provide the best guidance on performance. The table below shows revenues for the year by region and the pro-forma CCY revenue for the year to 30 April 2015 and the reported revenue for the year ended 30 April 2015:
Year ended
30 April 2016 Actual
$m
Year ended
30 April 2015 Pro-forma
CCY1
$m
Year ended
30 April 2015 Pro-forma
CCY (Decline)/Growth
%
Year ended
30 April 2015 Actual
$m
Micro Focus
North America 525.2 561.4 (6.4%) 367.3
International 377.0 395.1 (4.6%) 289.8
Asia Pacific & Japan 89.0 99.5 (10.6%) 76.3
Total 991.2 1,056.0 (6.1%) 733.4
SUSE
North America 108.6 87.4 24.3% 41.2
International 115.6 98.4 17.5% 47.2
Asia Pacific & Japan 29.6 28.9 2.4% 12.7
Total 253.8 214.7 18.2% 101.1
Group
North America 633.8 648.8 (2.3%) 408.5
International 492.6 493.5 (0.2%) 337.0
Asia Pacific & Japan 118.6 128.4 (7.6%) 89.0
Total revenue 1,245.0 1,270.7 (2.0%)
834.5 1 unaudited
Detailed analysis of the revenue performance of each of the product portfolios is provided in the CEO reports.
9
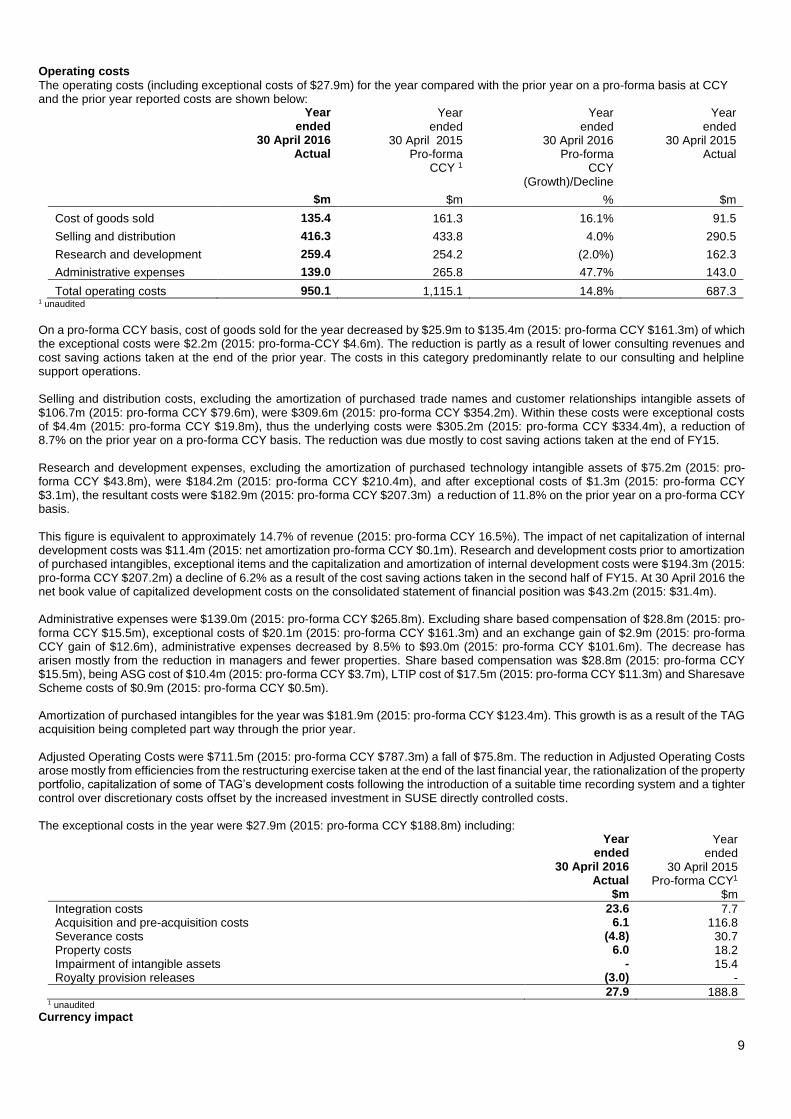
Operating costs
The operating costs (including exceptional costs of $27.9m) for the year compared with the prior year on a pro-forma basis at CCY and the prior year reported costs are shown below:
Year ended
30 April 2016 Actual
Year ended
30 April 2015 Pro-forma
CCY 1
Year ended
30 April 2016 Pro-forma
CCY (Growth)/Decline
Year ended
30 April 2015 Actual
$m $m % $m
Cost of goods sold 135.4 161.3 16.1% 91.5
Selling and distribution 416.3 433.8 4.0% 290.5
Research and development 259.4 254.2 (2.0%) 162.3
Administrative expenses 139.0 265.8 47.7% 143.0
Total operating costs 950.1 1,115.1 14.8% 687.3 1 unaudited
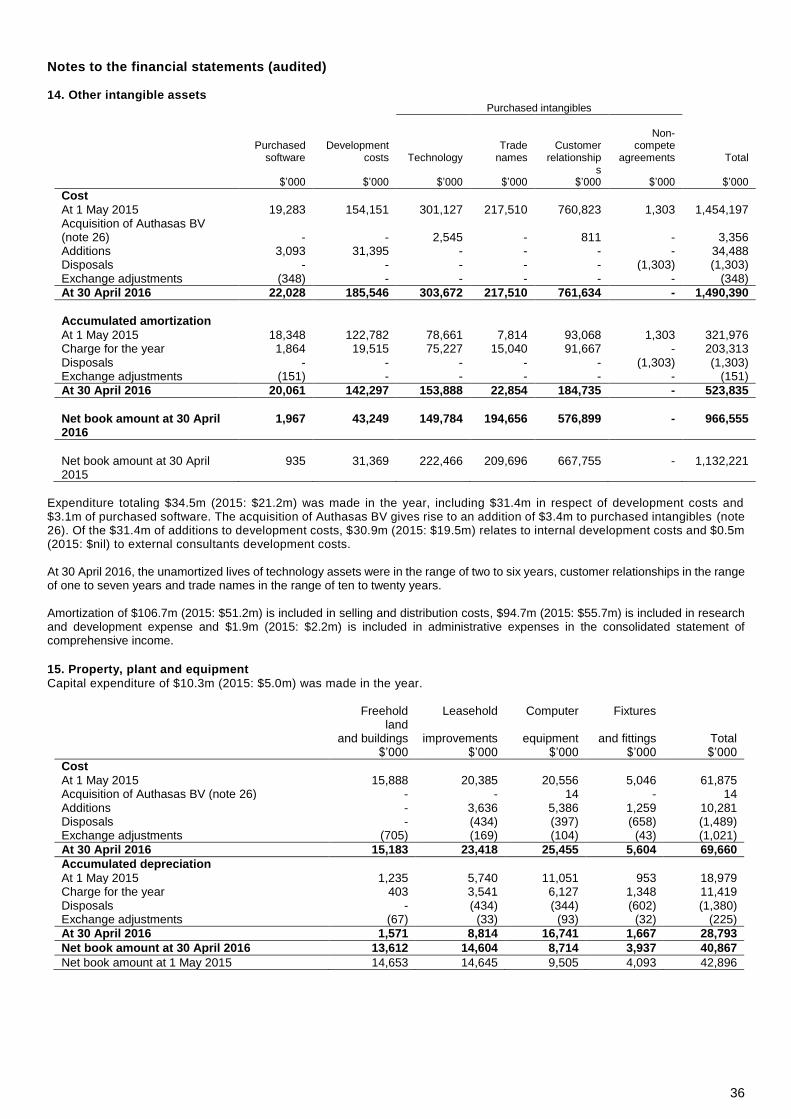
On a pro-forma CCY basis, cost of goods sold for the year decreased by $25.9m to $135.4m (2015: pro-forma CCY $161.3m) of which the exceptional costs were $2.2m (2015: pro-forma-CCY $4.6m). The reduction is partly as a result of lower consulting revenues and cost saving actions taken at the end of the prior year. The costs in this category predominantly relate to our consulting and helpline support operations. Selling and distribution costs, excluding the amortization of purchased trade names and customer relationships intangible assets of $106.7m (2015: pro-forma CCY $79.6m), were $309.6m (2015: pro-forma CCY $354.2m). Within these costs were exceptional costs of $4.4m (2015: pro-forma CCY $19.8m), thus the underlying costs were $305.2m (2015: pro-forma CCY $334.4m), a reduction of 8.7% on the prior year on a pro-forma CCY basis. The reduction was due mostly to cost saving actions taken at the end of FY15. Research and development expenses, excluding the amortization of purchased technology intangible assets of $75.2m (2015: pro-forma CCY $43.8m), were $184.2m (2015: pro-forma CCY $210.4m), and after exceptional costs of $1.3m (2015: pro-forma CCY $3.1m), the resultant costs were $182.9m (2015: pro-forma CCY $207.3m) a reduction of 11.8% on the prior year on a pro-forma CCY basis. This figure is equivalent to approximately 14.7% of revenue (2015: pro-forma CCY 16.5%). The impact of net capitalization of internal development costs was $11.4m (2015: net amortization pro-forma CCY $0.1m). Research and development costs prior to amortization of purchased intangibles, exceptional items and the capitalization and amortization of internal development costs were $194.3m (2015: pro-forma CCY $207.2m) a decline of 6.2% as a result of the cost saving actions taken in the second half of FY15. At 30 April 2016 the net book value of capitalized development costs on the consolidated statement of financial position was $43.2m (2015: $31.4m).
Administrative expenses were $139.0m (2015: pro-forma CCY $265.8m). Excluding share based compensation of $28.8m (2015: pro-forma CCY $15.5m), exceptional costs of $20.1m (2015: pro-forma CCY $161.3m) and an exchange gain of $2.9m (2015: pro-forma CCY gain of $12.6m), administrative expenses decreased by 8.5% to $93.0m (2015: pro-forma CCY $101.6m). The decrease has arisen mostly from the reduction in managers and fewer properties. Share based compensation was $28.8m (2015: pro-forma CCY $15.5m), being ASG cost of $10.4m (2015: pro-forma CCY $3.7m), LTIP cost of $17.5m (2015: pro-forma CCY $11.3m) and Sharesave Scheme costs of $0.9m (2015: pro-forma CCY $0.5m). Amortization of purchased intangibles for the year was $181.9m (2015: pro-forma CCY $123.4m). This growth is as a result of the TAG acquisition being completed part way through the prior year. Adjusted Operating Costs were $711.5m (2015: pro-forma CCY $787.3m) a fall of $75.8m. The reduction in Adjusted Operating Costs arose mostly from efficiencies from the restructuring exercise taken at the end of the last financial year, the rationalization of the property portfolio, capitalization of some of TAG’s development costs following the introduction of a suitable time recording system and a tighter control over discretionary costs offset by the increased investment in SUSE directly controlled costs. The exceptional costs in the year were $27.9m (2015: pro-forma CCY $188.8m) including:
During the year to 30 April 2016, 61.6% of our revenues were contracted in US dollars, 20.9% in Euros, 5.0% in Sterling, 3.6% in Yen and 8.9% in other currencies. In comparison, 51.9% of our costs are US dollar denominated, 12.7% in Sterling, 18.9% in Euros, 1.6% in Yen and 14.9% in other currencies. This weighting of revenue and costs means that if the US$: Euro or US$: Yen exchange rates move during the period, the revenue impact is greater than the cost impact, whilst if US$: Sterling rate moves during the period the cost impact exceeds the revenue impact. Consequently, actual US$ EBITDA can be impacted by significant movements in US$ to Euro, Yen and Sterling exchange rates. The currency movement for the US dollar against Sterling, Euro and Yen was a strengthening of 6.4%, 12.2% and 7.5% respectively when looking at the average exchange rates in the year ended 30 April 2016 compared to those in the year ended 30 April 2015. In order to provide CCY comparatives, we have restated the pro-forma results of the Group for the 12 months ended 30 April 2015 at the same average exchange rates as those used in reported results for the year ended 30 April 2016. Consequently, revenues reduce from $1,320.7m to $1,270.7m, a reduction of 3.8%, and Underlying Adjusted EBITDA reduces from $503.0m to $486.8m, a reduction of 3.2%.
The United Kingdom’s referendum vote in favour of leaving the European Union (“Brexit”) on 23 June 2016 has created significant changes in the US dollar exchange rates with sterling, Euro and Yen. Compared with the average exchange rates experienced in FY16, as at 7 July 2016 Sterling has weakened from $1.50 to $1.29, the Euro has remained at $1.11 and the Yen has strengthened from $0.0085 to $0.0099. If these exchange rates were experienced for the remainder of FY17 (“FY17 Exchange Rates”) then the CCY number for FY16 would be revenue of $1,247.1m and Underlying Adjusted EBITDA of $543.8m compared with reported revenue of $1,245.0m and reported Underlying Adjusted EBITDA of $532.5m. A 1% weakening in the exchange rate on these 7 July 2016 exchange rates would have the following impact on the FY16 CCY numbers:
Impact of a 1% movement in USD Exchange Rate
Currency
7 July 2016 USD Exchange
Rate Revenue
$m Costs
$m
Underlying Adjusted EBITDA
$m
Sterling 1.295 1.282 (0.3) 0.6 0.3 Euro 1.108 1.097 (1.2) 1.1 (0.1) Yen 0.00991 0.00981 (0.3) 0.1 (0.2)
Intercompany loan arrangements within the Group are typically denominated in the local currency of the overseas affiliate. Consequently, any movement in the respective local currency and US$ will have an impact on the converted US$ value of the loans. This foreign exchange movement is taken to the consolidated statement of comprehensive income. The Group’s UK Corporation Tax liability is denominated in Sterling and any movement of the US$: Sterling rate will give rise to a foreign exchange gain or loss which is also taken to the consolidated statement of comprehensive income. The foreign exchange gain for the period is approximately $2.9m (2015: pro-forma CCY gain of $12.6m). Adjusted EBITDA and Underlying Adjusted EBITDA
Adjusted EBITDA in the year increased by $47.5m to $546.8m (2015: pro-forma CCY $499.3m). The increase in Adjusted EBITDA is as a result of a reduction in adjusted operating costs which arose mostly from efficiencies from the restructuring exercise taken at the end of the last financial year, the rationalization of the property portfolio, capitalization of some of TAG’s development costs following the introduction of a suitable time recording system and a tighter control over discretionary costs offset by a reduction in foreign exchange credit. Underlying Adjusted EBITDA in the year increased by $45.7m to $532.5m (2015: pro-forma CCY $486.8m) at a margin of 42.8% (2015: pro-forma CCY 38.3%). The increase in Underlying Adjusted EBITDA is smaller as it does not benefit from the net capitalization of development costs nor suffer from the reduction in foreign exchange credit.
Year ended 30 April 2016
Actual
Year ended 30 April 2015
Pro-forma CCY1
Year ended
30 April 2016 Pro-forma
CCY (Decline)/Growth
Year ended
30 April 2015 Actual
$m $m % $m
Revenue 1,245.0 1,270.7 (2.0%) 834.5
Adjusted EBITDA 546.8 499.3 9.5% 357.6
Foreign exchange gain (2.9) (12.6) (9.4) Net (capitalization)/amortization of development costs (11.4) 0.1 0.1
Both revenue and EBITDA in the current period have been reduced by the unwinding of the fair value deferred revenue haircut of $16.6m (2015: pro-forma CCY $17.0m, reported $17.0m) that was applied as part of the acquisition of TAG. We are providing profitability metrics for our two product portfolios for the first time in this set of results. The portfolios have directly controlled costs and then an allocation of costs of the functions that are managed within the Micro Focus portfolio and provide services
11
to both portfolios together with centrally managed support function costs. Note 8 provides the breakdown to Adjusted Operating Profit for the period and the table below summarises the reconciliation between Adjusted Operating Profit and Adjusted EBITDA and Underlying Adjusted EBITDA and is also in note 8:
Operating profit was $294.9m (2015: pro-forma CCY $155.6m). Within the operating profit is $27.9m (2015: pro-forma CCY $188.8m) of exceptional costs. Adjusted operating profit was $533.5m (2015: pro-forma CCY $483.4m). Net finance costs
Net finance costs were $97.3m (2015: pro-forma CCY $120.6m) including the amortization of $13.8m (2015: pro-forma CCY $9.2m) of prepaid facility arrangement, original issue discounts and facility fees incurred on the Group’s loan facilities, loan interest and commitment fees of $83.5m (2015: pro-forma CCY $112.6m), interest on pension liability $0.5m (2015: pro-forma CCY $0.7m) and other interest costs of $0.5m (2015: pro-forma CCY $0.1m) offset by $1.0m (2015: pro-forma CCY $2.0m) of interest received. Net finance costs have decreased by $23.3m, mostly due to reduced loan interest and commitment fees ($29.1m) offset by an increase in the amortization of prepaid facility arrangement, original issue discounts and facility fees ($4.6m). Profit before tax and adjusted profit before tax
Profit before tax was $195.4m (2015: pro-forma CCY $48.3m). The profit before tax has primarily increased in the year when compared to the 2015 pro-forma CCY as a result of improved Adjusted EBITDA ($47.5m), a reduction in pro-forma CCY exceptional costs of $160.9m offset by an increase in the amortization of purchased intangibles following the TAG acquisition of $58.5m, lower net finance costs of $23.3m, no repeat of other income of $14.9m received by TAG prior to the acquisition date and an increase in the share based compensation charge of $13.3m. Adjusted profit before tax was $434.0m (2015: pro-forma CCY $386.2m) and the table below shows the reconciliation between profit before tax and adjusted profit before tax:
Adjusted profit before tax 434.0 386.2 12.4% 294.3 1 unaudited
Taxation
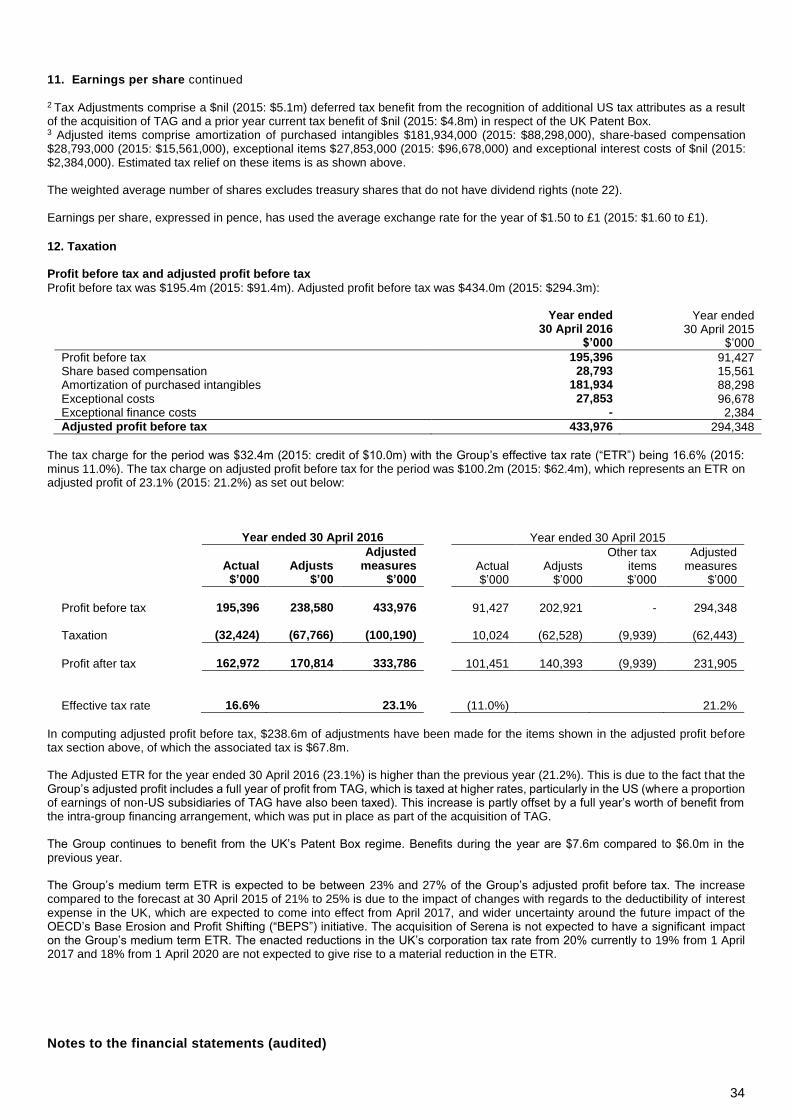
The tax charge for the period was $32.4m (2015: credit of $10.0m) with the Group’s effective tax rate (“ETR”) being 16.6% (2015: minus
12
11.0%). The ETR on adjusted profit before tax (“Adjusted ETR”) was 23.1% (2015: 21.2%) as set out in the following table:
Year ended 30 April 2016
Year ended 30 April 2015
Actual
Adjusts
Adjusted measures
Actual Adjusts
Other tax items
Adjusted measures
$m $m $m $m $m $m $m
Profit before tax
195.4
238.6
434.0
91.4 202.9
-
294.3
Taxation
(32.4)
(67.8)
(100.2)
10.0 (62.5)
(9.9)
(62.4)
Profit after tax
163.0
170.8
333.8
101.4 140.4
(9.9)
231.9
Effective tax rate
16.6%
23.1%
(11.0%)
21.2%
In computing adjusted profit before tax, $238.6m of adjustments have been made for the items shown in the adjusted profit before tax section above, of which the associated tax is $67.8m. The Adjusted ETR for the year ended 30 April 2016 (23.1%) is higher than the previous year (2015: 21.2%). This is due to the fact that the Group’s adjusted profit includes a full year of profit from TAG, which is taxed at higher rates, particularly in the US (where a proportion of earnings of non-US subsidiaries of TAG have also been taxed). This increase is partly offset by a full year’s worth of benefit from the intra-group financing arrangement, which was put in place as part of the acquisition of TAG. The Group continues to benefit from the UK’s Patent Box regime. Benefits during the year are $7.6m compared to $6.0m in the previous year. The Group’s medium-term Adjusted ETR is expected to be between 23% and 27% of the Group’s adjusted profit before tax. The increase compared to the forecast at 30 April 2015 of 21% to 25% is due to the impact of changes with regards to the deductibility of interest expense in the UK, which are expected to come into effect from April 2017, and wider uncertainty around the future impact of the OECD’s Base Erosion and Profit Shifting (“BEPS”) initiative. The acquisition of Serena is not expected to have a significant impact on the Group’s medium-term ETR. The enacted reductions in the UK’s corporation tax rate from 20% currently to 19% from 1 April 2017 and 18% from 1 April 2020 are not expected to give rise to a material reduction in the ETR. The Group’s cash taxes paid in the period were $79.3m (2015: net repayment of $1.8m) reflecting the following factors: 1. The Group paid $24.5m in respect of an Accelerated Payment notice issued by HMRC in relation to the historic tax issue disclosed
in previous years, which impacts UK tax returns from 2009 until 2015. Further details are set out below.
2. The Group paid $27.2m in respect of forecast US Federal income tax liabilities for the current and previous year. Following a recalculation of the impact of temporary differences, including the offset of brought forward deferred tax assets, these liabilities are now expected to be significantly lower than previously anticipated. This accounts for the majority of the current tax receivables shown on the balance sheet of $18.0m.
3. In the previous year, TAG received $17.0m of cash in the post-acquisition period relating to the settlement of tax audits and
historic overpayments of tax in the US. 4. As disclosed previously, the Group has benefited from a lower cash rate of tax in recent years as a result of an ongoing claim with
HMRC in the UK, based on tax legislation, impacting its tax returns for the years ended 30 April 2009 through to 2015. The Group maintains a provision for the potential liability in its consolidated financial statements. A payment of $24.5m was made in accordance with an Accelerated Payment Notice issued by HMRC which covers the years up to 30 April 2014. The remaining provision at 30 April 2016 is $5.6m (including interest on overdue tax of $3.1m) compared to $31.2m at 30 April 2015.
5. 6. The Group is one of a number of companies that have submitted similar claims. During the year, a test case chosen to establish
the correct interpretation of the legislation was heard by the First-tier Tribunal, which ruled in favour of HMRC. The precise implications for the Group’s claim are subject to further discussion with HMRC.
7. 8. When the tax position is agreed with HMRC, then to the extent that the tax liability is lower than that provided in the consolidated
statement of financial position, there would be a positive benefit to the tax charge in the consolidated statement of comprehensive income in the year of settlement and a refund of any amounts paid under the Accelerated Payment notice in excess of the agreed liability.
Profit after tax
Profit after tax increased by 60.6% to $163.0m (2015: $101.5m reported). Goodwill
The largest item on the consolidated statement of financial position is goodwill at $2,436.2m (2015: $2,421.7m) arising from acquisitions
13
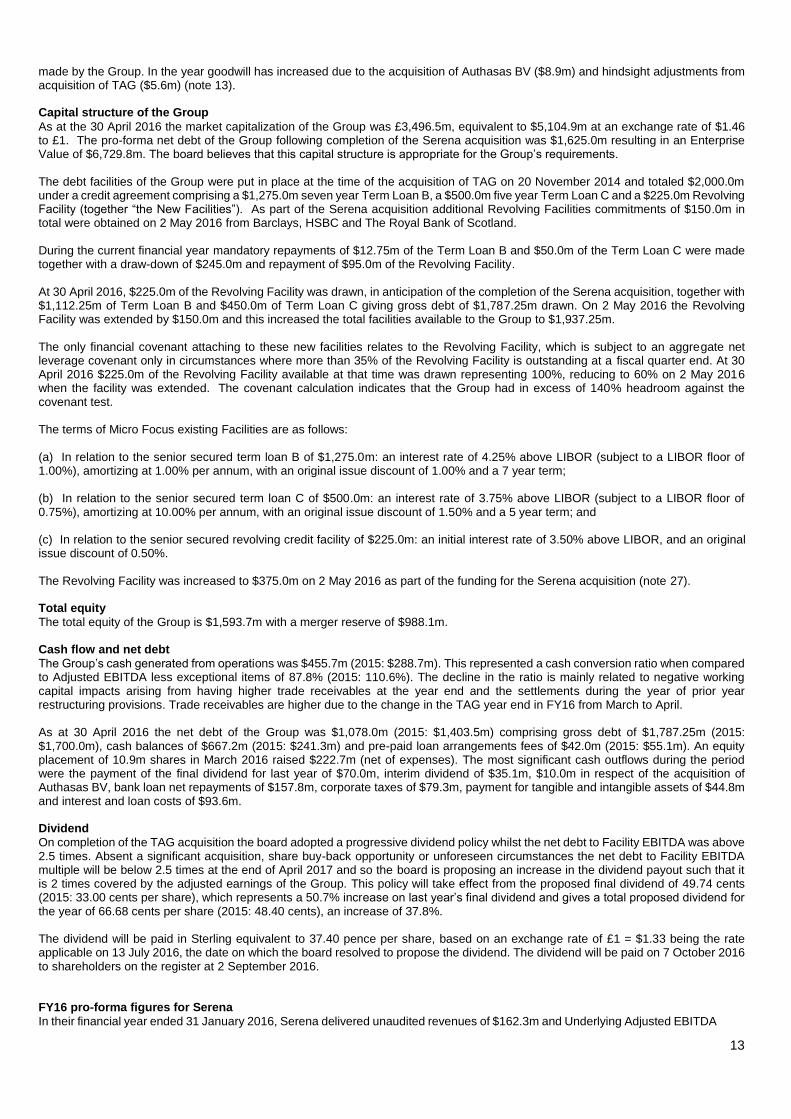
made by the Group. In the year goodwill has increased due to the acquisition of Authasas BV ($8.9m) and hindsight adjustments from acquisition of TAG ($5.6m) (note 13).
Capital structure of the Group
As at the 30 April 2016 the market capitalization of the Group was £3,496.5m, equivalent to $5,104.9m at an exchange rate of $1.46 to £1. The pro-forma net debt of the Group following completion of the Serena acquisition was $1,625.0m resulting in an Enterprise Value of $6,729.8m. The board believes that this capital structure is appropriate for the Group’s requirements. The debt facilities of the Group were put in place at the time of the acquisition of TAG on 20 November 2014 and totaled $2,000.0m under a credit agreement comprising a $1,275.0m seven year Term Loan B, a $500.0m five year Term Loan C and a $225.0m Revolving Facility (together “the New Facilities”). As part of the Serena acquisition additional Revolving Facilities commitments of $150.0m in total were obtained on 2 May 2016 from Barclays, HSBC and The Royal Bank of Scotland. During the current financial year mandatory repayments of $12.75m of the Term Loan B and $50.0m of the Term Loan C were made together with a draw-down of $245.0m and repayment of $95.0m of the Revolving Facility. At 30 April 2016, $225.0m of the Revolving Facility was drawn, in anticipation of the completion of the Serena acquisition, together with $1,112.25m of Term Loan B and $450.0m of Term Loan C giving gross debt of $1,787.25m drawn. On 2 May 2016 the Revolving Facility was extended by $150.0m and this increased the total facilities available to the Group to $1,937.25m.
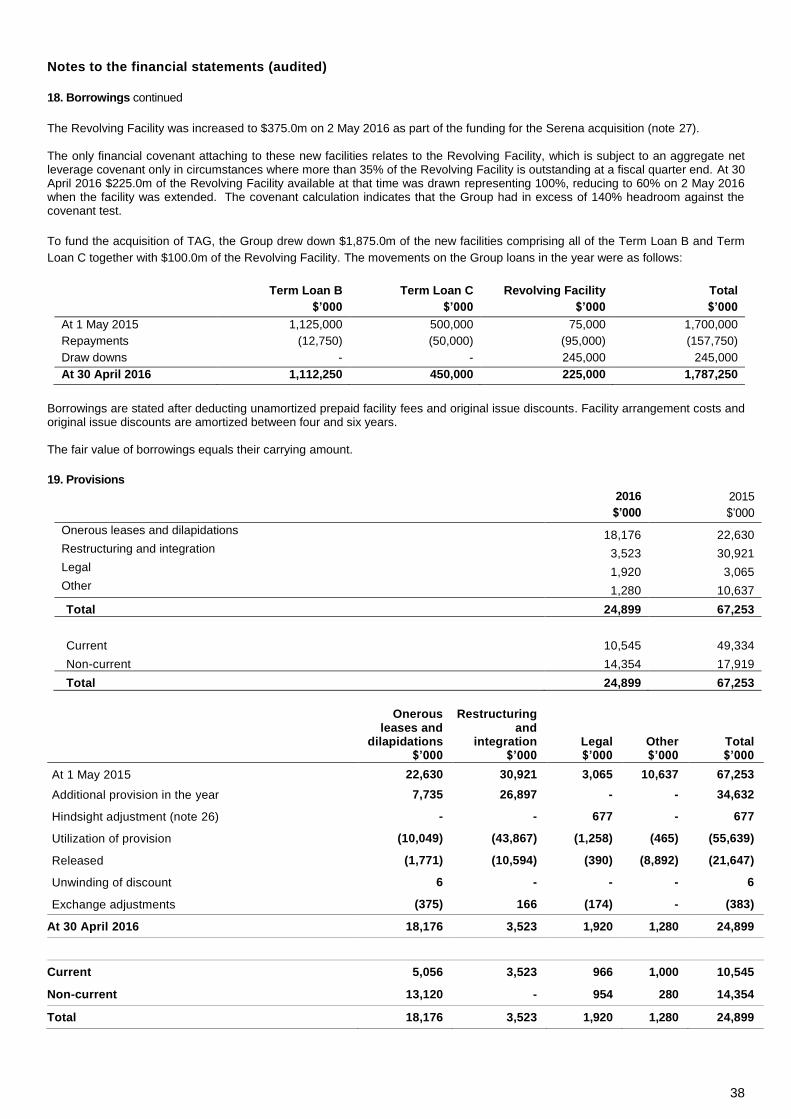
The only financial covenant attaching to these new facilities relates to the Revolving Facility, which is subject to an aggregate net leverage covenant only in circumstances where more than 35% of the Revolving Facility is outstanding at a fiscal quarter end. At 30 April 2016 $225.0m of the Revolving Facility available at that time was drawn representing 100%, reducing to 60% on 2 May 2016 when the facility was extended. The covenant calculation indicates that the Group had in excess of 140% headroom against the covenant test.
The terms of Micro Focus existing Facilities are as follows: (a) In relation to the senior secured term loan B of $1,275.0m: an interest rate of 4.25% above LIBOR (subject to a LIBOR floor of 1.00%), amortizing at 1.00% per annum, with an original issue discount of 1.00% and a 7 year term; (b) In relation to the senior secured term loan C of $500.0m: an interest rate of 3.75% above LIBOR (subject to a LIBOR floor of 0.75%), amortizing at 10.00% per annum, with an original issue discount of 1.50% and a 5 year term; and (c) In relation to the senior secured revolving credit facility of $225.0m: an initial interest rate of 3.50% above LIBOR, and an original issue discount of 0.50%.
The Revolving Facility was increased to $375.0m on 2 May 2016 as part of the funding for the Serena acquisition (note 27). Total equity
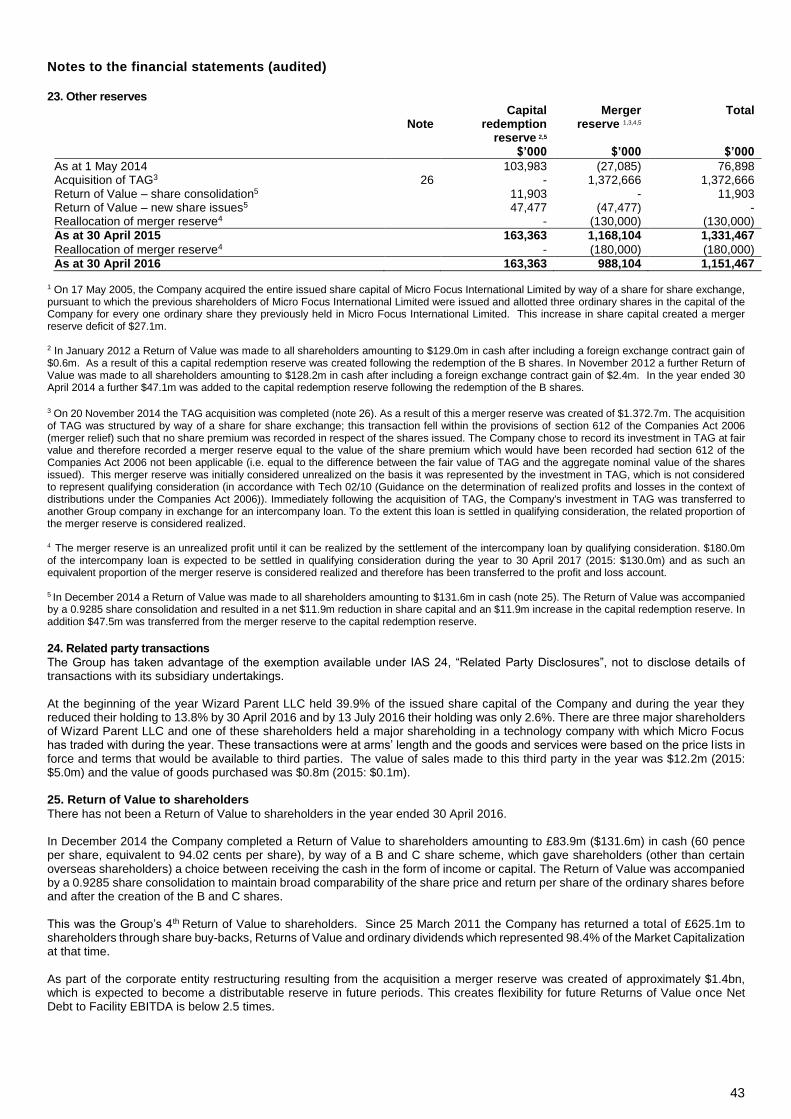
The total equity of the Group is $1,593.7m with a merger reserve of $988.1m. Cash flow and net debt
The Group’s cash generated from operations was $455.7m (2015: $288.7m). This represented a cash conversion ratio when compared to Adjusted EBITDA less exceptional items of 87.8% (2015: 110.6%). The decline in the ratio is mainly related to negative working capital impacts arising from having higher trade receivables at the year end and the settlements during the year of prior year restructuring provisions. Trade receivables are higher due to the change in the TAG year end in FY16 from March to April. As at 30 April 2016 the net debt of the Group was $1,078.0m (2015: $1,403.5m) comprising gross debt of $1,787.25m (2015: $1,700.0m), cash balances of $667.2m (2015: $241.3m) and pre-paid loan arrangements fees of $42.0m (2015: $55.1m). An equity placement of 10.9m shares in March 2016 raised $222.7m (net of expenses). The most significant cash outflows during the period were the payment of the final dividend for last year of $70.0m, interim dividend of $35.1m, $10.0m in respect of the acquisition of Authasas BV, bank loan net repayments of $157.8m, corporate taxes of $79.3m, payment for tangible and intangible assets of $44.8m and interest and loan costs of $93.6m.
Dividend
On completion of the TAG acquisition the board adopted a progressive dividend policy whilst the net debt to Facility EBITDA was above 2.5 times. Absent a significant acquisition, share buy-back opportunity or unforeseen circumstances the net debt to Facility EBITDA multiple will be below 2.5 times at the end of April 2017 and so the board is proposing an increase in the dividend payout such that it is 2 times covered by the adjusted earnings of the Group. This policy will take effect from the proposed final dividend of 49.74 cents (2015: 33.00 cents per share), which represents a 50.7% increase on last year’s final dividend and gives a total proposed dividend for the year of 66.68 cents per share (2015: 48.40 cents), an increase of 37.8%. The dividend will be paid in Sterling equivalent to 37.40 pence per share, based on an exchange rate of £1 = $1.33 being the rate applicable on 13 July 2016, the date on which the board resolved to propose the dividend. The dividend will be paid on 7 October 2016 to shareholders on the register at 2 September 2016. FY16 pro-forma figures for Serena
In their financial year ended 31 January 2016, Serena delivered unaudited revenues of $162.3m and Underlying Adjusted EBITDA
14
of $80.9m. Applying the FY17 Exchange Rates to these numbers reduces revenue to $161.1m and increases Underlying Adjusted EBITDA to $81.0m. Adding these numbers to the FY16 CCY numbers at FY17 Exchange Rates for the Group revenues of $1,247.1m and Underlying Adjusted EBITDA of $543.8m would give pro-forma FY16 CCY numbers for the Enlarged Group at FY17 Exchange Rates of revenue of $1,408.2m and Underlying Adjusted EBITDA of $624.8m. Group risk factors
As with all businesses, the Group is affected by certain risks, not wholly within our control, which could have a material impact on the Group’s long-term performance and cause actual results to differ materially from forecast and historic results. The principal risks and uncertainties facing the Group are set out in note 28. Mike Phillips Chief Financial Officer
13 July 2016
15
CEO Review – Micro Focus Product Portfolio
Introduction
The Micro Focus product portfolio represents 79.6% of total Group revenue in FY16 (2015: pro-forma CCY 83.1%). From within the Micro Focus product portfolio we also manage, for the Group overall, the corporate support functions of HR, IT, Facilities, Finance, Legal and the Project Management Office (“PMO”) for acquisitions and integration. In addition we manage the delivery of a shared service for other elements of infrastructure support to the SUSE portfolio. This enables the Group to operate effectively and SUSE to directly control what they need to execute with speed and flexibility whilst leveraging the larger Group where effective. Wherever practical the shared functions staffs are dedicated to product portfolios, including SUSE, in order to provide the additional benefit of specialization whilst leveraging the scale of the shared function. Progress in FY16
During 2016 our focus has been on integrating the different businesses into a more coherent whole. This has involved significant volumes and complexity of work spanning structure, people, processes, systems and infrastructure across multiple operational entities. Highlights include:
Completion of the initial restructuring work to ensure stability and focus on delivery of our financial commitments;
Delivery of significant levels of synergies;
Simplification of the branding to Micro Focus and SUSE from Micro Focus, SUSE, Borland, Net IQ, Attachmate and Novell underpinned by two completely new web domains of microfocus.com and suse.com;
Creation of dedicated GTM organizations for SUSE and Micro Focus focused on quarterly instead of annual performance;
Rationalization of our property portfolio from 128 offices in November 2014 to 83 offices at 30 April 2016; and
Creation of a comprehensive IT systems strategy for the Group. Much of the above is ongoing, most notably in the area of systems where our stated goal of standardizing systems will take longer to deliver than originally anticipated. Progress has been made throughout the year in our systems programme, for example reducing from five customer relationship management (“CRM”) systems to one. We now have a comprehensive plan built on detailed analysis work to define and map our processes and build target enterprise application and technical infrastructure environments. This will enable us to move to the execution phase from a much improved position in terms of clarity and stability but is still a very significant undertaking. The above touches on the breadth of work underway and there remains a huge amount to do. However, progress is encouraging and the foundations required for ongoing delivery of our business model are beginning to emerge. On 2 May 2016 we completed the acquisition of Serena. Serena is a leading provider of Application Lifecycle Management products. Its product offering will be integrated into the existing Micro Focus Development and IT Operations Management Tools (“Development & ITOM”) portfolio, further enhancing both our expertise in mainframe computing and distributed software change management. We intend to continue developing the full portfolio of Serena’s products, and we will aim to identify how additional customer value and capability can be realized for Serena customers, leveraging related Micro Focus software development and software quality solutions.
Revenue for the year by product portfolio at actual exchange rates and CCY pro-forma and reported comparatives are shown in the table below:
As anticipated Licence revenue declined by 4.8% on a pro-forma CCY basis compared with the year to 30 April 2015. There was a strong Licence revenue performance in Identity, Access & Security offset by declines in all the other portfolios. Maintenance revenues declined by 6.1% on a pro-forma CCY basis. This was primarily in Development & ITOM Tools and Collaboration & Networking which is in line with prior year trends. The fair value deferred revenue haircut reduced maintenance by $10.2m (2015: $11.9m). Excluding this, underlying maintenance revenues fell by 6.2%. Consultancy revenues declined by 15.2% on a pro-forma CCY basis as we implemented the established Micro Focus policy of focusing only on consulting business that supports our licence business. As previously mentioned there were significant changes to the organization on the Micro Focus portfolio at the beginning of the year and these can be seen to impact the performance in the year. We changed the sales compensation plan of the former TAG organization away from bookings as the primary target towards revenue and introduced quarterly targets compared to the former TAG approach of annual targets. CDMS revenues were $258.8m; a growth of 1.1% on a pro-forma CCY basis compared with the year to 30 April 2015. The reduction
in Licence revenues was 1.1% ($1.2m) offset by a growth in Maintenance revenues of 2.3% ($3.3m) and Consulting revenue growth of 9.9% ($0.8m). Visual COBOL revenues continued to grow strongly. Host Connectivity revenues declined by 3.0% in the year on a pro-forma CCY basis. Licence revenues declined by 5.0% ($4.7m).
The split of Licence revenue between the first half and second half of last year in the pro-forma CCY numbers was 28.3% and 71.7%
17
respectively whereas the performance this year was 53.9% in the first half and 46.1% in the second half and can mostly be explained by the change in compensation structure which lead to a more balanced half-on-half performance in the current year. This also reflects the generally shorter sales cycle in this portfolio. Maintenance revenues declined by 0.4% ($0.4m) and there was a decline in Consulting revenues of 27.5% ($1.1m).
Identity, Access & Security (“IAS”) revenues declined by 0.5% ($1.0m). Licence revenue grew by 21.6% on CCY basis partly due to
some significant changes in the approach to the product portfolio and the successful closure of some key transactions. There is also a longer sales cycle on these transactions. We acquired Authasas, a Dutch company, in the period for $10.0m. Authasas provides Multi Factor Authentication for the security market and TAG had previously embedded the Authasas offering in their products on an Original Equipment Manufacturer (“OEM”) basis. Micro Focus has a preference for owning its Intellectual Property wherever possible and when we had the opportunity to acquire the Authasas technology we did so. We believe that IAS has the potential for further growth as the market it operates in continues to grow. We will continue to drive for consistent and sustainable growth in this area but expect that this will take time to be delivered. Maintenance declined by 3.3% ($4.8m) because of a few contract cancellations that were known about when TAG was acquired and Consulting revenues declined by 19.9% ($5.5m) due to proactive change in direction outlined previously. Development & IT Operations Management Tools revenues were $157.4m; a 13.2% ($23.9m) decline on pro-forma CCY basis.
$15.4m of the decline was in Maintenance revenues which declined by 11.3% is in line with management expectations. Licence revenues declined in the period by $7.9m partly due to lower sales of our App Manager products which had some large licence sales in the prior year. Collaboration & Networking revenues were $160.1m; a 18.6% ($36.6m) decline on pro-forma CCY basis. Maintenance declined by
15.8% ($24.5m) in the period in line with management expectations and consistent with the prior period trend.
Regional revenue performance
Year ended
30 April 2016 Actual
$m
Year ended
30 April 2015 Pro-forma CCY1
$m
Year ended
30 April 2015 Pro-forma CCY
Decline %
Year ended
30 April 2015 Actual
$m
North America 525.2 561.4 (6.4%) 367.3
International 377.0 395.1 (4.6%) 289.8
Asia Pacific & Japan 89.0 99.5 (10.6%) 76.3
Total 991.2 1,056.0 (6.1%) 733.4 1 unaudited
Progress in North America was encouraging with execution levels improving through the strengthening of leadership talent and associated improvements in execution and discipline. Host Connectivity delivered a strong performance throughout the year and a much more balanced performance in terms of H1 and H2 phasing. IAS was challenged overall but delivered significant new customer wins and much improved alignment and engagement with partner channels. Development & ITOM suffered from significant levels of attrition that took time to stabilize and begin to correct. Collaboration and Networking was down consistent with prior performance and trends. CDMS execution improved throughout the year to deliver an acceptable performance overall with Mainframe Solutions delivering exciting new customer wins and improving pipeline. International region (EMEA and LATAM) had a challenging year. EMEA took a significant time to stabilize as the restructuring actions worked through local legislative and consultation requirements. This was compounded by attrition in the key market of Germany and some portfolios leading to increased levels of disruption overall. Despite this, IAS delivered a strong performance and there were notable wins in Development & ITOM and CDMS. LATAM was impacted by the economic situation in Brazil and in the rest of LATAM we moved to a distribution led model rather than direct sales resulting in an additional level of transition and disruption to be managed. Execution levels across International improved throughout the year. Asia Pacific & Japan was mixed. Strength in Japan broadly across the board was offset by weakness in Asia. In Australia it was necessary to rebuild the business to ensure that the correct teams were in place to execute consistently the Micro Focus approach to and improve the overall capabilities locally. There were some excellent wins in Mainframe Solutions and IAS that demonstrate what can be delivered when skill and execution levels are maintained.
Adjusted operating profit and Underlying Adjusted EBITDA
The table below shows the Adjusted Operating Profit for the portfolio together with a comparison to the pro-forma CCY figures for
18
FY15: Year
ended 30 April 2016
Actual $m
Year ended
30 April 2015 Pro-forma CCY 1
$m
Segment revenue 991.2 1,056.0 Directly managed costs (566.4) (663.4) Allocation of centrally managed costs to SUSE 28.9 32.1
Total Adjusted Operating costs (537.5) (631.3)
Adjusted Operating Profit 453.7 424.7
Margin 45.8% 40.2% 1 unaudited
The directly managed costs are those costs specifically managed by the CEOs of the Micro Focus Product Portfolio and SUSE Product Portfolio. All the Group central support costs are managed by the Micro Focus portfolio group and the allocation of these costs to SUSE is based on an appropriate methodology. The adjusted operating profit was $453.7m, delivering a margin of 45.8% which compares with the margin in the pro-forma CCY numbers for FY15 of 40.2%. The increase in margin arises because of the cost savings actions that were taken at the end of FY15 when we integrated the original Micro Focus business with TAG. These savings were mostly in staff and property costs. The table below shows the reconciliation between Adjusted Operating Profit and Underlying Adjusted EBITDA with a comparative of the Pro-forma CCY figures for FY15:
Year ended
30 April 2016 Actual
$m
Year ended
30 April 2015 Pro-forma CCY 1
$m
Adjusted Operating Profit 453.7 424.7 Depreciation of property, plant and equipment 9.7 11.4 Amortization of software intangibles 1.7 2.1
Adjusted EBITDA 465.1 438.2 Foreign exchange credit (2.6) (11.7) Net capitalization of development costs (11.4) 0.1
The Underlying Adjusted EBITDA improved by $24.5m in the year on a pro-forma CCY basis primarily due to cost saving actions taken at the end of FY15. Outlook
We have achieved a great deal over the last 12 months and enter the new financial year with stronger foundations than a year ago when the integration and change programme was just commencing. We continue to focus on improving the way in which we operate to maximise the efficiency of the organization. The Group has undergone huge change in FY16 but the one constant has been clarity of strategy and the associated focus on aligning operational execution to the delivery of that strategy. Looking forward to FY17 this focus will continue with our key priorities being:
Delivery of our financial plan;
The work to standardise systems and simplify the underlying operations of the business;
Accelerating progress on improving the effectiveness of our go to market teams; and
Continuing to operationalize the FOUR-BOX MODEL (New Models, Growth Drivers, Optimize and Core) to better align resources to optimize the performance of each sub-portfolio.
Stephen Murdoch Chief Executive Officer Micro Focus
13 July 2016
19
CEO Review – SUSE Product Portfolio Introduction
The SUSE product portfolio represented 20.4% of the total Group revenue in FY16 (2015: pro-forma CCY revenue 16.9%). Following the acquisition of TAG by Micro Focus the SUSE product portfolio was given a mandate to deliver “accelerated, sustainable and profitable revenue growth” and was provided with the support and initial investments to support this vision. FY16 was a successful year for SUSE with growth in revenue, ACV, TCV and Adjusted Operating Profit. To create additional capacity to grow we expanded the SUSE headcount across different business functions and geographies and aligned the critical supporting organizations of customer care, renewals and sales operations much more tightly with the SUSE business. This will continue in FY17 as SUSE assumes the execution responsibility for sales and marketing in APAC and for the SUSE channel. In FY16 we broadened and deepened our Alliance, OEM, Business Partner and cloud service provider relationships and see ongoing strong contribution from these routes to market to our overall success. We also extended SUSE’s presence and contribution in key Open Source projects and relevant industry groups both in support of strengthening our contribution to Open Source innovation and development efforts as well as in support of our partner and enterprise customer relationships.
SUSE – Key Financial Metrics
SUSE provides technical support together with rights to updates, patches and security fixes for its Open Source solutions on a subscription basis with revenues being recognised rateably over the period of the contract. The key metrics are Revenue, TCV and ACV of the TCV. The ACV represents the value of the first 12 months of each contract reported as TCV. Revenue
The table below provides a breakdown of the revenue for the year and a comparison to FY15 on a pro-forma CCY basis and as reported.
The SUSE product portfolio revenue increased by 18.2% to $253.8m compared with the pro-forma CCY revenues for FY15 of $214.7m, with the Subscription revenue increasing by 18.2% to $248.9m (2015: pro-forma CCY $210.5m). The Subscription revenue is net of the fair value deferred revenue haircut of $6.4m (2015: $5.1m). Prior to this adjustment Subscription revenue grew by 18.4%.
Regional Revenue Performance
Year ended
30 April 2016 Actual
$m
Year ended
30 April 2015 Pro-forma CCY 1
$m
Year ended
30 April 2015 Pro-forma
CCY (Decline)/Growth
%
North America 108.6 87.4 24.3%
International 115.6 98.4 17.5%
Asia Pacific & Japan 29.6 28.9 2.4%
Total 253.8 214.7 18.2% 1 unaudited
North America and International have had successful years in terms of subscription revenue, growing at 24.3% and 17.5% respectively compared with the pro-forma CCY revenues for FY15. Asia Pacific & Japan, whilst showing a small increase of 2.4% compared with the pro-forma CCY revenues for FY15, has a solid foundation to grow from in the coming years. SUSE, now with a dedicated GTM sales organization in this region, is already starting to show promise evidenced by strong TCV and ACV performance as referenced below.
TCV and ACV
20
TCV represents the gross billings for the year of $301.3m, an increase of 14.3% from the pro-forma CCY for FY15. The weighted average contract duration decreased from 33 months to 28 months. This has resulted in the ‘in fiscal year yield’ from TCV to revenue to increase from 32% in FY15 to 34% in FY16. ‘In fiscal year yield’ represents the proportion of TCV generated in the fiscal year that can be recognized as SFR in the same fiscal year. As the weighted average contract duration reduces, we would expect to get a higher ‘in fiscal year yield’. Net new subscription TCV increased by 9.6% year-on-year and renewal subscriptions TCV grew by 22.7% year-on-year. Net new subscription contracts are derived from sale of subscriptions to new logo customers and existing customers expanding footprint of existing product portfolio or subscribing to new product solutions. ACV measures the first 12 months duration equivalent of TCV. ACV grew to $174.8m, an increase of 17.9% from the pro-forma CCY for FY15. ACV removes the impact of multi-year TCV and is a cleaner KPI on the performance of the business. Where subscription term is less than 12 months, all of the subscription TCV billing is included in the ACV measure.
Regional TCV performance
Year ended
30 April 2016 Actual
$m
Year ended
30 April 2015 Pro-forma
CCY1
$m
Year ended
30 April 2015 Pro-forma
CCY (Decline)/Growth
%
North America 137.3 103.3 32.9%
International 128.9 132.5 (2.7%)
Asia Pacific & Japan 35.1 27.7 26.7%
Total 301.3 263.5 14.3% 1 unaudited
Regional ACV performance
Year ended
30 April 2016 Actual
$m
Year ended
30 April 2015 Pro-forma
CCY1
$m
Year ended
30 April 2015 Pro-forma
CCY Growth
%
North America 81.7 62.9 29.9%
International 67.8 63.7 6.4%
Asia Pacific & Japan 25.3 21.6 17.1%
Total 174.8 148.2 17.9% 1 unaudited
North America had very strong performance in TCV and ACV for the year, growing by 32.9% and 29.9% respectively. International, whilst showing a 2.7% decline in TCV, has shown 6.4% growth in ACV and as referenced above has grown revenues by 19.4% compared with the pro-forma CCY FY15 revenues. International TCV and ACV performance was lower as a strong performance in the prior year gave a tough compare. Asia Pacific & Japan had very strong performance in TCV and ACV, growing by 26.7% and 17.1% respectively. We continue to have strong performance in China and Japan, and are also winning new accounts in some of the other key markets in the region. The region is also starting to get good traction by leveraging the global agreements we have in place with key independent hardware vendors and cloud service providers.
ACV contribution by route to market
Year ended
30 April 2016 Actual
Year ended
30 April 2015 Pro-forma
CCY1
Year ended
30 April 2016 Pro-forma
CCY Growth/(Decline)
$m $m %
Direct 37.2 32.8 13.4%
Indirect 61.8 47.1 31.2%
Global Service Partners 63.8 54.2 17.7%
OEM (Embedded Systems) 12.0 14.1 (14.9%)
Total 174.8 148.2 17.9% 1 unaudited
Direct represents customers that have a master licence agreement with SUSE and subscribe directly with SUSE or via authorized
21
fulfillment partners. Indirect represents customers that subscribe via the SUSE Value Added Reseller network and predominantly through a two tier
distribution model. Global Service Partners represents primarily Independent Hardware Vendors who sell SUSE subscriptions alongside the sale of their
respective hardware and subscriptions generated from cloud service providers. OEM (Embedded Systems) represents entities that embed SUSE subscriptions within the sale of their respective specialized appliance
offerings. We continue to see significant growth in Direct, Indirect and Global Service Partners routes to market, growing by 13.4%, 31.2% and 17.7% respectively. We also see a trend of customers, who purchased subscriptions direct, subsequently subscribing through Global Service Partners. This partially contributes to ACV from Global Service Partners growing more significantly relative to Direct and Indirect. We continue to see strength in the Value Added Reseller network, where we have seen significant growth in ACV during the fiscal year. OEM (Embedded Systems) transactions tend to be large, custom, specialized and binary in nature, and thus year on year fluctuations in ACV generated are to be expected. The table below shows the percentage share of ACV by the different routes to market in FY16 compared to FY15.
In aggregate the ACV mix by route to market remains stable in FY16 compared to FY15 as we saw homogenous contribution to SUSE’s growth from the various routes to market. SUSE Adjusted Operating Profit and Adjusted EBITDA
The table below shows the Adjusted Operating Profit for the SUSE product portfolio and compares it against the pro-forma CCY numbers for FY15:
Year
ended 30 April 2016
Actual $m
Year ended
30 April 2015 Pro-forma CCY 1
$m
Revenue 253.8 214.7 Directly managed costs (145.1) (123.9) Allocation of centrally managed costs from Micro Focus (28.9) (32.1)
Total Adjusted Operating costs (174.0) (156.0)
Adjusted Operating Profit 79.8 58.7
Margin 31.4% 27.3% 1 unaudited
SUSE Adjusted Operating Profit for the year was $79.8m at a profit margin of 31.4%. Compared to the pro-forma CCY FY15, this is an increase of $21.1m (35.9%) and a profit margin improvement of 4.1%. We have seen a significant increase in directly managed costs in SUSE that is consistent with the investment being made to deliver the SUSE growth charter. We are also seeing the benefit of a reduced allocation of centrally managed costs which is being delivered from the efficiencies in the Micro Focus product portfolio. The table below shows the reconciliation between Adjusted Operating Profit and Underlying Adjusted EBITDA for SUSE:
22
Year ended
30 April 2016 Actual
$m
Year ended
30 April 2015 Pro-forma CCY 1
$m
Adjusted Operating Profit 79.8 58.7 Depreciation of property, plant and equipment 1.7 2.0 Amortization of software intangibles 0.2 0.4
Adjusted EBITDA 81.7 61.1 Foreign exchange credit (0.3) (0.9) Net capitalization of development costs - -
Underlying Adjusted EBITDA 81.4 60.2 1 unaudited
Deferred revenue
We continue to have year on year steady growth in the deferred revenue balance. At 30 April 2016 SUSE’s total deferred revenue balance was $326.8m (2015: $265.0m), an increase of $61.8m year-on-year. 60.8% of this increase in deferred revenue balance is recognizable revenue in the next 12 months and 88.7% recognizable in 24 months. Headcount
At the end of April 2015, direct headcount in SUSE was 522 increasing to 641 by 30 April 2016 SUSE, a net increase of 119 in the fiscal year. The increased investment in direct headcount is primarily in Engineering, Product Management, Sales, Marketing, Product Marketing and Alliances to address the opportunity we see in the market for SUSE’s existing offerings together with new opportunities in OpenStack IaaS, Software Defined Distributed Storage based on Ceph technology and with public cloud service providers. In addition to the direct headcount, the SUSE portfolio received in FY16 support from SUSE dedicated employees, who are organizationally aligned in the shared service functions of the Group. Most prominently in APJ Sales, Renewal Sales, Consulting, Customer Care, Sales Operations and other corporate operations functions. These add up to approximately 224 full-time equivalents (“FTEs”), which brings the total SUSE dedicated headcount supporting the SUSE business and customers to approximately 865 FTEs at the end of April 2016. Outlook “Sustainable, Profitable Revenue Growth”
For FY17 SUSE will focus on the successful execution of SUSE’s mandate for sustainable, profitable revenue growth. The objective is to grow revenue ahead of growth rates for relevant markets.
Nils Brauckmann Chief Executive Officer SUSE
13 July 2016
23
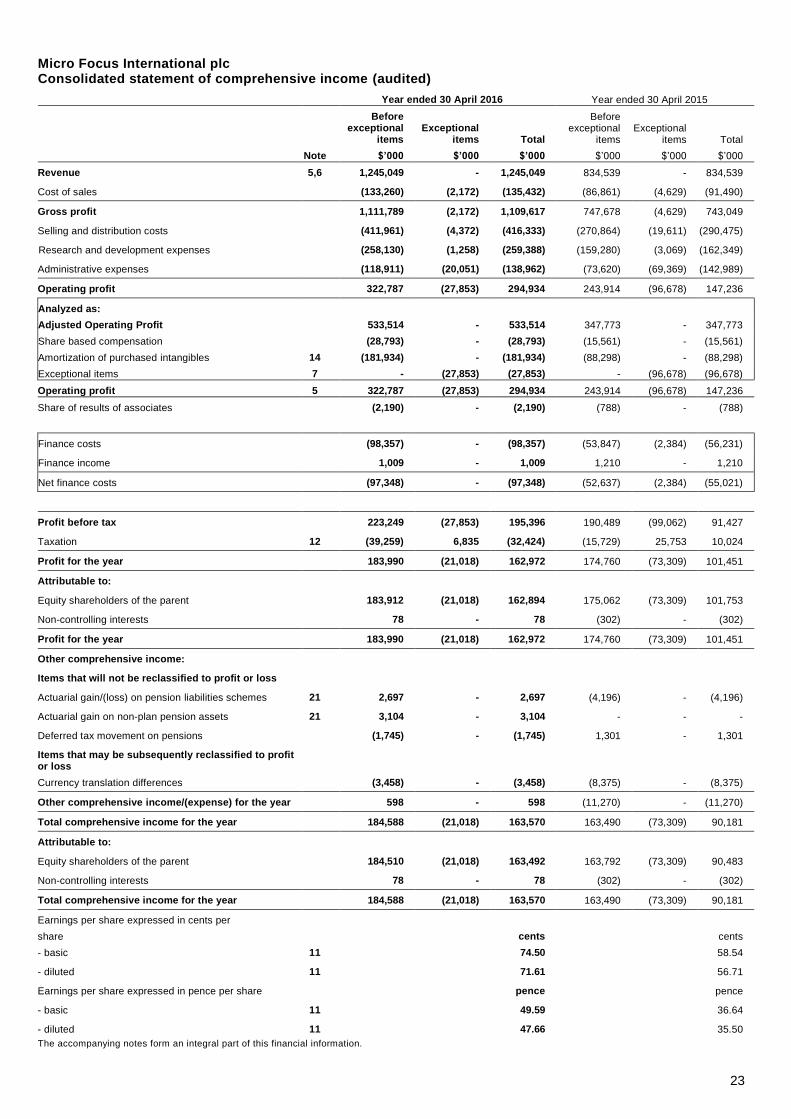
Micro Focus International plc Consolidated statement of comprehensive income (audited)
Total movements for the year 18 174,206 324,823 (3,458) - (180,000) 315,589 78 315,667
Balance as at 30 April 2016 39,573 190,293 228,344 (17,006) 163,363 988,104 1,592,671 1,057 1,593,728
The accompanying notes are an integral part of this financial information.
28
Micro Focus International plc
Notes to the financial statements (audited)
1. General
Micro Focus International plc (“the Company”) is a public limited Company incorporated and domiciled in the UK. The address of its registered office is, The Lawn, 22-30 Old Bath Road, Newbury, RG14 1QN, UK. Micro Focus International plc and its subsidiaries (together “the Group”) provide innovative software to clients around the world enabling them to dramatically improve the business value of their enterprise applications. The Group has a presence in 39 countries worldwide and employs approximately 4,200 people. Following the completion of the acquisition of Serena on 2 May 2016 headcount had increased to approximately 4,600.
The Company is listed on the London Stock Exchange.
The statutory accounts of the Company for the year ended 30 April 2016 which include the Group’s consolidated financial statements for that year were audited at the date of this announcement. These financial results do not comprise statutory accounts within the meaning of Section 435 of the Companies Act 2006. Statutory accounts for the year ended 30 April 2015 were approved by the board of directors on 7 July 2015 and delivered to the Registrar of Companies. The report of the auditors on those accounts was unqualified and did not contain any statement under Section 498 of the Companies Act 2006.
This preliminary announcement was approved by the board of directors on 13 July 2016.
2. Basis of preparation
This audited preliminary consolidated financial information for the year ended 30 April 2016, has been prepared in accordance with the Disclosure and Transparency Rules of the UK Financial Conduct Authority and International Financial Reporting Standards (‘IFRSs’) as endorsed by the European Union and those parts of the Companies Act 2006 that remain applicable to companies reporting under IFRS.
The consolidated financial statements have been prepared on a going concern basis under the historical cost convention. 3. Accounting policies
Other than as described below, the accounting policies adopted are consistent with those of the Annual Report and Accounts for the year ended 30 April 2015, as described in those financial statements.
(a) The following standards, interpretations and amendments to existing standards are now effective and have been adopted by
the Group: - Annual Improvements 2013 includes amendments to IFRS 1 ‘First Time Adoption’, IFRS 3 ‘Business Combinations’,
IFRS 13 ‘Fair Value Measurement’ and IAS 40 ‘Investment Property’ applies for periods beginning on or after 1 July 2014.
- Amendment to IAS 19 regarding defined benefit plans applies for periods beginning on or after 1 July 2014. These
narrow scope amendments apply to contributions from employees or third parties to defined benefit plans. - Annual Improvements 2012 includes amendments to IFRS 2 ‘Share-based Payment’, IFRS 3 ‘Business Combinations’,
IFRS 8 ‘Operating Segments’, IFRS 13 ‘Fair Value Measurement’, IAS 16 ‘Property, Plant and Equipment’, IAS 38 ‘Intangible Assets’, IFRS 9 ‘Financial Instruments’, IAS 37 ‘Provisions, Contingent Liabilities and Contingent Assets’ and IAS 39 ‘Financial Instruments - Recognition and Measurement’ applies for periods beginning on or after 1 July 2014.
(b) The following standards, interpretations and amendments to existing standards are not yet ef fective and have not been adopted
early by the Group: - Amendment to IAS 16, 'Property, plant and equipment' and IAS 38,'Intangible assets', on depreciation and amortization
applies for periods beginning on or after 1 January 2016 subject to EU endorsement. In this amendment the IASB has clarified that the use of revenue based methods to calculate the depreciation of an asset is not appropriate because revenue generated by an activity that includes the use of an asset generally reflects factors other than the consumption of the economic benefits embodied in the asset.
- Amendments to IAS 27, ‘Separate financial statements’ on the equity method applies to periods beginning on or after
1 January 2016. These amendments allow entities to use the equity method to account for investments in subsidiaries, joint ventures and associates in their separate financial statements.
29
Notes to the financial statements (audited)
3. Accounting policies continued
- Amendments to IFRS 10, ‘Consolidated financial statements’ and IAS 28, ‘Investments in associates and joint
ventures’. These amendments address an inconsistency between the requirements in IFRS 10 and those in IAS 28 in dealing with the sale or contribution of assets between an investor and its associate or joint venture. The main consequence of the amendments is that a full gain or loss is recognized when a transaction involves a business (whether it is housed in a subsidiary or not). A partial gain or loss is recognized when a transaction involves assets that do not constitute a business, even if these assets are housed in a subsidiary. The effective date of this change is to be determined.
- Annual Improvements 2014 includes amendments to IFRS 5, ‘Non-current Assets Held For Sale and Discontinued
Operations’, IFRS 7, ‘Financial Instruments: Disclosures’, IAS 19, ‘Employee Benefits’ and IAS 34, ‘Interim Financial Reporting’ applies for periods beginning on or after 1 January 2016.
- Amendment to IAS 1, ‘Presentation of financial statements’ as part of the IASB initiative to improve presentation and
disclosure in financial reports, effective for annual periods beginning on or after 1 January 2016.
(c) The following standards, interpretations and amendments to existing standards are not yet effective, have not yet been endorsed by the EU and have not been adopted early by the Group:
- Amendments to IAS 7, Statement of cash flows on disclosure initiative 1988 are effective on periods beginning on or
after 1 January 2017, subject to EU endorsement. This amendment introduces an additional disclosure that will enable users of financial statements to evaluate changes in liabilities arising from financing activities and is part of the IASB’s Disclosure Initiative, which continues to explore how financial statement disclosure can be improved.
- Amendments to IAS 12,'Income taxes' on Recognition of deferred tax assets for unrealized losses are effective on
periods beginning on or after 1 January 2017, subject to EU endorsement. These amendments relate to the recognition of deferred tax assets for unrealized losses clarify how to account for deferred tax assets related to debt instruments measured at fair value.
- IFRS 9 ‘Financial instruments’. This standard replaces the guidance in IAS 39 and applies to periods beginning on or
after 1 January 2018, subject to EU endorsement. It includes requirements on the classification and measurement of financial assets and liabilities; it also includes an expected credit losses model that replaces the current incurred loss impairment model.
- IFRS 16, ‘Leases’ addresses the definition of a lease, recognition and measurement of leases and establishes
principles for reporting useful information to users of financial statements about the leasing activities of both lessees and lessors. A key change arising from IFRS 16 is that most operating leases will be accounted for on balance sheet for lessees. The standard replaces IAS 17 ‘Leases', and related interpretations. The standard is effective for annual periods beginning on or after 1 January 2019 and earlier application is permitted subject to EU endorsement and the entity adopting IFRS 15 'Revenue from contracts with customers' at the same time. The Group is currently assessing the impact of IFRS 16.
- IFRS 15 ‘Revenue from Contracts with Customers’ establishes the principles that an entity shall apply to report useful
information to users of financial statements about the nature, amount, timing, and uncertainty of revenue and cash flows arising from a contract with a customer. Application of the standard is mandatory for annual reporting periods starting from 1 January 2018 onwards (pending EU endorsement). Earlier application is permitted. The standard replaces IAS 18 ‘Revenue’ and IAS 11 ‘Construction contracts’ and related interpretations. The Group is currently assessing the impact of IFRS 15 but it is too early to determine how significant the effect on reported results and financial position will be.
Apart from IFRS 15 and FRS 16, where it is too early to determine how significant the effect on reported results and financial position will be, the directors anticipate that the future introduction of those standards, amendments and interpretations listed above will not have a material impact on the consolidated financial statements. 4. Functional currency
The presentation currency of the Group is US dollars. Items included in the financial statements of each of the Group’s entit ies are measured in the functional currency of each entity. The Group uses the local currency as the functional currency, except for two entities based in Ireland (Novell Ireland Software Limited and Novell Ireland Real Estate Limited), where the functional currency is the US dollar.
30
Notes to the financial statements (audited) 5. Segmental reporting
In accordance with IFRS 8, “Operating Segments”, the Group has derived the information for its operating segments using the information used by the Chief Operating Decision Maker (“the Executive Committee”). Following the Company reorganization on 1 May 2015, the Group has changed its operating segments to be: Micro Focus and SUSE as set out in the Executive Chairman’s Statement. Operating segments are consistent with those used in internal management reporting and the profit measure used by the Executive Committee is the Adjusted Operating Profit for the Group as a whole as set out in note 8.
Operating segments for the year ended 30 April 2016:
The operating segment split of depreciation on property, plant and equipment and the amorti zation of purchased software intangibles is reported in note 8.
31
Notes to the financial statements (audited) 6. Analysis of revenue by product
Set out below is an analysis of revenue recognized between the principal product portfolios for the year ended 30 April 2016.
Total 270,026 128,955 100,149 94,340 139,965 733,435 101,104 834,539
7. Exceptional items
The exceptional costs of $27.9m (2015: $99.1m) shown in the consolidated statement of comprehensive income relate to costs incurred as part of the integration of TAG, which was an acquisition completed on 20 November 2014, the acquisition of Authasas BV on 17 July 2015 (note 26) and pre-acquisition costs relating to Serena (note 27). The total cash outflow of exceptional items during the year was $19.7m (2015: $34.6m).
27,853 96,678 Reported within finance costs: Accelerated amortization of facility fees - 2,384
- 2,384
27,853 99,062
Integration costs of $23.6m (2015: $7.6m) arose from the work done in bringing together the Base Micro Focus and TAG organizations into one organization. This includes, amongst other activities; email migration, system integration and legal entity reorganization. The acquisition costs of $0.5m are external costs in evaluating and completing the acquisition of Authasas BV in July 2015 (2015: acquisition of TAG $26.9m). The costs mostly relate to due diligence work, legal work on the acquisition agreements and professional advisors on the transaction. The pre-acquisition costs of $5.6m (2015: $nil) relate to evaluating the acquisition of Serena which was completed on the 2 May 2016 (note 27). The costs mostly relate to due diligence work, legal work on the acquisition agreements and professional advisors on the transaction.
32
Notes to the financial statements (audited) 7. Exceptional items continued
The property costs of $6.0m (2015: $18.2m) relate to the cost of exiting entire buildings or floors of buildings which the Group are leasing following the integration of the TAG business. The majority of the costs relate to TAG properties in North America. Severance costs releases of $4.8m (2015: $30.7m charge) relate to the reassessment of provisions made for integrating the TAG business in the year ended 30 April 2015, including the redeployment of staff previously notified of redundancy. Royalty provision releases of $3.0m (2015: $nil) relate to provisions no longer required as a result of new contracts being concluded with a third party. The one-off impairment of intangible assets of $11.6m and prepayments of $1.7m in the year ended 30 April 2015 related mostly to the write off of TAG computer systems and applications that had no future value for the Group. The one-off accelerated amortization of facility fees of $2.4m in the year ended 30 April 2015 related to costs that were expensed early as a result of taking on new borrowings to finance the acquisition of TAG.
The estimated total tax effect of exceptional items is a credit to the income statement of $6.8m (2015: $25.8m). 8. Reconciliation of operating profit to EBITDA
Adjusted Operating Profit 533,514 347,773 Depreciation of property, plant and equipment 15 11,419 7,674 Amortization of purchased software intangibles 14 1,864 2,189
Adjusted EBITDA 546,797 357,636 Amortization and impairment of development costs 14 19,515 19,589
Facility EBITDA 566,312 377,225
Operating profit 5 294,934 147,236 Amortization of intangible assets 14 203,313 110,076 Depreciation of property, plant and equipment 15 11,419 7,674
EBITDA 509,666 264,986 Amortization and impairment of development costs 14 (19,515) (19,589) Share-based compensation charge 28,793 15,561 Exceptional items 7 27,853 96,678
Adjusted EBITDA 546,797 357,636 Foreign exchange credit (2,915) (9,445) Net (capitalization)/amortization of internal development costs* 14 (11,362) 99
Underlying Adjusted EBITDA 532,520 348,290
*Net capitalization of internal development costs of $11.4m (2015: $0.1m amortization) is calculated as additions to intangible development costs of $31.4m (2015: $19.5m), excluding external consultants development costs of $0.5m (2015: $nil) less amortization and impairment of the development costs intangibles in the year of $19.5m (2015: $19.6m). The table below provides the operating segments split for the year ended 30 April 2016 and 30 April 2015:
2016 2015
Micro Focus
SUSE Total Micro Focus
SUSE Total
$’000 $’000 $’000 $’000 $’000 $’000
Adjusted Operating Profit 453,710 79,804 533,514 321,703 26,070 347,773 Depreciation of property, plant and equipment
9,736
1,683
11,419
6,886
788
7,674
Amortization of purchased software intangibles
1,679 185 1,864 1,834 355 2,189
Adjusted EBITDA 465,125 81,672 546,797 330,423 27,213 357,636 Foreign exchange credit (2,584) (331) (2,915) (9,358) (87) (9,445) Net (capitalization)/amortization of development costs
Notes to the financial statements (audited) 8. Reconciliation of operating profit to EBITDA continued
The directors use EBITDA, EBITDA before exceptional items and share based compensation charge but after amortization and impairment of development costs (“Adjusted EBITDA”) and Adjusted EBITDA before foreign exchange gains and losses and net amortization/capitalization of internal development costs (“Underlying Adjusted EBITDA”) as key performance measures of the business.
The use of these alternative performance measures are consistent with those used by sell-side equity analysts who write research on the Group and how institutional investors consider the performance of the Group. Facility EBITDA was the measure used under the Group’s $420m Revolving Credit Facility to determine the Net Debt to Facility EBITDA covenant calculation. Whilst the $420m facility was repaid and cancelled as part of the refinancing on the acquisition of TAG, for consistency the directors will continue to use the metric Net Debt to Facility EBITDA. These measures are not defined in IFRS and thus may not be comparable to similarly titled measures by other companies. 9. Share-based payments
The share-based compensation charge for the year ended 30 April 2016 was $28.8m (2015: $15.6m). The increase in the period is as a result of the Additional Share Grants awarded to Senior Managers on the acquisition of TAG and the additional employer taxes that would be payable as a result of the increase in the share price.
10. Dividends
2016 2015 Equity – ordinary $’000 $’000
2015 final paid 33.00 cents (2014: 30.00 cents) per ordinary share 70,015 40,215 2016 interim paid 16.94 cents (2015: 15.40 cents) per ordinary share 35,144 32,492
Total 105,159 72,707
The directors are proposing a final dividend in respect of the year ended 30 April 2016 of 49.74 cents per share which will utilize approximately $113,744,000 of total equity. The directors have concluded that the Company has sufficient distributable reserves to pay the dividend. It has not been included as a liability in these financial statements as it has not yet been approved by shareholders. 11. Earnings per share
The calculation of the basic earnings per share has been based on the earnings attributable to owners of the parent and the weighted average number of shares for each year.
Year ended 30 April 2016 Year ended 30 April 2015 Total
1 Earnings attributable to ordinary shareholders is the profit for the year of $162,972,000 (2015: $101,451,000), excluding amounts attributable to non-controlling interests of $78,000 (2015: $302,000 loss).
Notes to the financial statements (audited)
34
11. Earnings per share continued
2 Tax Adjustments comprise a $nil (2015: $5.1m) deferred tax benefit from the recognition of additional US tax attributes as a result of the acquisition of TAG and a prior year current tax benefit of $nil (2015: $4.8m) in respect of the UK Patent Box. 3 Adjusted items comprise amortization of purchased intangibles $181,934,000 (2015: $88,298,000), share-based compensation $28,793,000 (2015: $15,561,000), exceptional items $27,853,000 (2015: $96,678,000) and exceptional interest costs of $nil (2015: $2,384,000). Estimated tax relief on these items is as shown above.
The weighted average number of shares excludes treasury shares that do not have dividend rights (note 22). Earnings per share, expressed in pence, has used the average exchange rate for the year of $1.50 to £1 (2015: $1.60 to £1).
12. Taxation Profit before tax and adjusted profit before tax
Profit before tax was $195.4m (2015: $91.4m). Adjusted profit before tax was $434.0m (2015: $294.3m):
Year ended 30 April 2016
Year ended 30 April 2015
$’000 $’000
Profit before tax 195,396 91,427 Share based compensation 28,793 15,561 Amortization of purchased intangibles 181,934 88,298 Exceptional costs 27,853 96,678 Exceptional finance costs - 2,384
Adjusted profit before tax 433,976 294,348
The tax charge for the period was $32.4m (2015: credit of $10.0m) with the Group’s effective tax rate (“ETR”) being 16.6% (2015: minus 11.0%). The tax charge on adjusted profit before tax for the period was $100.2m (2015: $62.4m), which represents an ETR on adjusted profit of 23.1% (2015: 21.2%) as set out below:
Year ended 30 April 2016
Year ended 30 April 2015
Actual
Adjusts
Adjusted measures
Actual Adjusts
Other tax items
Adjusted measures
$’000 $’00 $’000 $’000 $’000 $’000 $’000
Profit before tax
195,396
238,580
433,976
91,427 202,921
-
294,348
Taxation
(32,424)
(67,766)
(100,190)
10,024 (62,528)
(9,939)
(62,443)
Profit after tax
162,972
170,814
333,786
101,451 140,393
(9,939)
231,905
Effective tax rate
16.6%
23.1%
(11.0%)
21.2%
In computing adjusted profit before tax, $238.6m of adjustments have been made for the items shown in the adjusted profit before tax section above, of which the associated tax is $67.8m. The Adjusted ETR for the year ended 30 April 2016 (23.1%) is higher than the previous year (21.2%). This is due to the fact that the Group’s adjusted profit includes a full year of profit from TAG, which is taxed at higher rates, particularly in the US (where a proportion of earnings of non-US subsidiaries of TAG have also been taxed). This increase is partly offset by a full year’s worth of benefit from the intra-group financing arrangement, which was put in place as part of the acquisition of TAG. The Group continues to benefit from the UK’s Patent Box regime. Benefits during the year are $7.6m compared to $6.0m in the previous year. The Group’s medium term ETR is expected to be between 23% and 27% of the Group’s adjusted profit before tax. The increase compared to the forecast at 30 April 2015 of 21% to 25% is due to the impact of changes with regards to the deductibility of interest expense in the UK, which are expected to come into effect from April 2017, and wider uncertainty around the future impact of the OECD’s Base Erosion and Profit Shifting (“BEPS”) initiative. The acquisition of Serena is not expected to have a significant impact on the Group’s medium term ETR. The enacted reductions in the UK’s corporation tax rate from 20% currently to 19% from 1 April 2017 and 18% from 1 April 2020 are not expected to give rise to a material reduction in the ETR.
Notes to the financial statements (audited)
35
12. Taxation continued
The Group’s cash taxes paid in the period were $79.3m (2015: net repayment of $1.8m) reflecting the following factors: a) The Group paid $24.5m in respect of an Accelerated Payment notice issued by HMRC in relation to the historic tax issue
disclosed in previous years, which impacts UK tax returns from 2009 until 2015. Further details are set out below. b) The Group paid $27.2m in respect of forecast US Federal income tax liabilities for the current and previous year. Following a
recalculation of the impact of temporary differences, including the offset of brought forward deferred tax assets, these liabilities are now expected to be significantly lower than previously anticipated. This accounts for the majority of the current tax receivables shown on the balance sheet of $18.0m.
c) In the previous year, TAG received $17.0m of cash in the post-acquisition period relating to the settlement of tax audits and
historic overpayments of tax in the US.
As disclosed previously, the Group has benefited from a lower cash rate of tax in recent years as a result of an ongoing claim with HMRC in the UK, based on tax legislation, impacting its tax returns for the years ended 30 April 2009 through to 2015. The Group maintains a provision for the potential liability in its consolidated financial statements. A payment of $24.5m was made in accordance with an Accelerated Payment Notice issued by HMRC on 26 November 2015 which covers the years up to 30 April 2014. The remaining provision at 30 April 2016 is $5.6m (including interest on overdue tax of $3.1m) compared to $31.2m at 30 April 2015. The Group is one of a number of companies that have submitted similar claims. During the year, a test case chosen to establish the correct interpretation of the legislation was heard by the First-tier Tribunal, which ruled in favour of HMRC. The precise implications for the Group’s claim are subject to further discussion with HMRC. When the tax position is agreed with HMRC, then to the extent that the tax liability is lower than that provided in the consolidated statement of financial position, there would be a positive benefit to the tax charge in the consolidated statement of comprehensive income in the year of settlement and a refund of any amounts paid under the Accelerated Payment notice in excess of the agreed liability.
13. Goodwill
2016 2015 $’000 $’000
Cost and net book amount At 1 May 2,421,745 308,182 Hindsight adjustment 5,583 213 Acquisitions 8,840 2,113,350
At 30 April 2,436,168 2,421,745
A segment-level summary of the goodwill allocation is presented below:
Following the Company reorganization on 1 May 2015, the Group has two operating segments: Micro Focus product portfolio and SUSE product portfolio and previously it had Base Micro Focus (North America, International and Asia Pacific and Japan) and TAG. Comparatives have been restated accordingly.
The additions to goodwill in the year relate to the acquisition of Authasas BV and hindsight period adjustments for the TAG acquisition (note 26). Of the additions to goodwill, there is no amount that is expected to be deductible for tax purposes.
36
Notes to the financial statements (audited) 14. Other intangible assets
Purchased intangibles
Purchased software
Development costs
Technology
Trade names
Customer relationship
s
Non-
compete agreements
Total
$’000 $’000 $’000 $’000 $’000 $’000 $’000
Cost At 1 May 2015 19,283 154,151 301,127 217,510 760,823 1,303 1,454,197 Acquisition of Authasas BV (note 26)
At 30 April 2016 22,028 185,546 303,672 217,510 761,634 - 1,490,390
Accumulated amortization At 1 May 2015 18,348 122,782 78,661 7,814 93,068 1,303 321,976 Charge for the year 1,864 19,515 75,227 15,040 91,667 - 203,313 Disposals - - - - - (1,303) (1,303) Exchange adjustments (151) - - - - - (151)
At 30 April 2016 20,061 142,297 153,888 22,854 184,735 - 523,835
Net book amount at 30 April 2016
1,967
43,249
149,784
194,656
576,899
-
966,555
Net book amount at 30 April 2015
935
31,369
222,466
209,696
667,755
-
1,132,221
Expenditure totaling $34.5m (2015: $21.2m) was made in the year, including $31.4m in respect of development costs and $3.1m of purchased software. The acquisition of Authasas BV gives rise to an addition of $3.4m to purchased intangibles (note 26). Of the $31.4m of additions to development costs, $30.9m (2015: $19.5m) relates to internal development costs and $0.5m (2015: $nil) to external consultants development costs.
At 30 April 2016, the unamortized lives of technology assets were in the range of two to six years, customer relationships in the range of one to seven years and trade names in the range of ten to twenty years. Amortization of $106.7m (2015: $51.2m) is included in selling and distribution costs, $94.7m (2015: $55.7m) is included in research and development expense and $1.9m (2015: $2.2m) is included in administrative expenses in the consolidated statement of comprehensive income.
15. Property, plant and equipment
Capital expenditure of $10.3m (2015: $5.0m) was made in the year.
Freehold land
Leasehold Computer Fixtures
and buildings improvements equipment and fittings Total $’000 $’000 $’000 $’000 $’000
The terms of the Micro Focus existing debt facilities are as follows:
Syndicated senior secured tranche B term loan facility of $1,275.0m (“Term Loan B”), with an interest rate of 4.25% above
LIBOR (subject to a LIBOR floor of 1.00%), amortizing at 1.00% per annum, with an original issue discount of 1.00% and a
seven year term;
A syndicated senior secured tranche C term loan facility of $500.0m (“Term Loan C”), with an interest rate of 3.75% above
LIBOR (subject to a LIBOR floor of 0.75%), amortizing at 10.00% per annum, with an original issue discount of 1.5% and a
five year term; and
A senior secured revolving credit facility of $225.0m, (“Revolving Facility”), with an interest rate of 3.50% above LIBOR on
amounts drawn (and 0.50% on amounts undrawn) thereunder and an original issue discount of 0.50%.
38
Notes to the financial statements (audited)
18. Borrowings continued
The Revolving Facility was increased to $375.0m on 2 May 2016 as part of the funding for the Serena acquisition (note 27).
The only financial covenant attaching to these new facilities relates to the Revolving Facility, which is subject to an aggregate net leverage covenant only in circumstances where more than 35% of the Revolving Facility is outstanding at a fiscal quarter end. At 30 April 2016 $225.0m of the Revolving Facility available at that time was drawn representing 100%, reducing to 60% on 2 May 2016 when the facility was extended. The covenant calculation indicates that the Group had in excess of 140% headroom against the covenant test.
To fund the acquisition of TAG, the Group drew down $1,875.0m of the new facilities comprising all of the Term Loan B and Term
Loan C together with $100.0m of the Revolving Facility. The movements on the Group loans in the year were as follows:
Term Loan B Term Loan C Revolving Facility Total
$’000 $’000 $’000 $’000
At 1 May 2015 1,125,000 500,000 75,000 1,700,000
Repayments (12,750) (50,000) (95,000) (157,750)
Draw downs - - 245,000 245,000
At 30 April 2016 1,112,250 450,000 225,000 1,787,250
Borrowings are stated after deducting unamortized prepaid facility fees and original issue discounts. Facility arrangement costs and original issue discounts are amortized between four and six years.
The fair value of borrowings equals their carrying amount.
19. Provisions
2016 2015
$’000 $’000
Onerous leases and dilapidations 18,176 22,630 Restructuring and integration 3,523 30,921 Legal 1,920 3,065 Other 1,280 10,637
Total 24,899 67,253
Current 10,545 49,334
Non-current 14,354 17,919
Total 24,899 67,253
Onerous leases and
dilapidations
Restructuring and
integration
Legal
Other
Total $’000 $’000 $’000 $’000 $’000
At 1 May 2015 22,630 30,921 3,065 10,637 67,253
Additional provision in the year 7,735 26,897 - - 34,632
Hindsight adjustment (note 26) - - 677 - 677
Utilization of provision (10,049) (43,867) (1,258) (465) (55,639)
Released (1,771) (10,594) (390) (8,892) (21,647)
Unwinding of discount 6 - - - 6
Exchange adjustments (375) 166 (174) - (383)
At 30 April 2016 18,176 3,523 1,920 1,280 24,899
Current 5,056 3,523 966 1,000 10,545
Non-current 13,120 - 954 280 14,354
Total 18,176 3,523 1,920 1,280 24,899
39
Notes to the financial statements (audited)
19. Provisions continued
Onerous leases and
dilapidations
Restructuring and
integration
Legal
Other
Total $’000 $’000 $’000 $’000 $’000
At 1 May 2014 2,252 107 - 6,943 9,302
Acquisition of TAG (note 26)
GGroup
3,957 650 3,859 3,000 11,466
Additional provision in the year 18,872 31,329 83 3,200 53,484
Utilization of provision (2,211) (1,053) (601) (1,790) (5,655)
Released (153) (77) - (716) (946)
Unwinding of discount 42 - - - 42
Exchange adjustments (129) (35) (276) - (440)
At 30 April 2015 22,630 30,921 3,065 10,637 67,253
Current 9,979 30,090 3,065 6,200 49,334
Non-current 12,651 831 - 4,437 17,919
Total 22,630 30,921 3,065 10,637 67,253
The onerous lease and dilapidations provision relates to leased Group properties and this position is expected to be fully utilized within nine years. The provision was increased by $7.7m due to a lengthening in the estimated time to sublease certain properties and reduced by $1.8m due to the shortening in the estimated time to sublease two properties. Restructuring and integration provisions relate mostly to severance and integration work undertaken during the year ended 30 April 2016. Integration provisions arose from the work done in bringing together the Base Micro Focus and TAG organizations into one organization. This includes, amongst other activities; email migration, system integration and legal entity reorganization. Severance releases relate to the change in estimates made for integrating the TAG business in the year ended 30 April 2015, including the redeployment of staff previously notified of redundancy. The provisions are expected to be fully utilized within 12 months. Legal provisions include management’s best estimate of the likely outflow of economic benefits associated with ongoing legal matters. Other provisions include primarily:
Potential liabilities acquired with the Iona acquisition of $nil as no longer required (2015: $3.8m); $0.2m relating to tax due for pension and bonus payments prior to July 2011 for a subsidiary in Brazil (2015: $0.6m); Provision that was inherited relating to potential software licencing issues of $nil as no longer required (2015: $3.0m); and $1.0m remaining provision for potential customer claims (2015: $3.2m).
Of the net additions and releases to provisions in the year, $19.3m (2015: $50.2m) was included in exceptional items.
20. Deferred income - current
2016 2015 $’000 $’000
Deferred income 565,480 583,703
Revenue not recognized in the consolidated statement of comprehensive income under the Group’s accounting policy for revenue recognition is classified as deferred income in the consolidated statement of financial position to be recognized in future periods. 21. Retirement benefit obligations 2016
$’000
2015
$’000
Within non-current assets :
Long term pension assets 22,272 14,076
Within non-current liabilities:
Retirement benefit obligations (31,669) (32,742)
40
Notes to the financial statements (audited) 21. Retirement benefit obligations continued
There are three defined benefit plans in Germany under broadly similar regulatory frameworks. All of the plans are final salary pension plans, which provide benefits to members in the form of a guaranteed level of pension payable for life in the case of retirement, disability and death. The level of benefits provided depends not only on the final salary but also on member’s length of service, social security ceiling and other factors. Final pension entitlements are calculated by our Actuary in Swiss Life. They also complete calculations for cases of death in service and disability. There is no requirement for the appointment of Trustees in Germany. The schemes are administered locally with the assistance of German pension experts. All three plans were closed for new membership.
Long-term pension assets
Certain long-term pension assets do not meet the definition of plan assets as they have not been pledged to the plan and are subject to the creditors of the Group. Such assets as follows are recorded separately in the consolidated statement of financial position as long-term pension assets. The movement on the long-term pension asset is as follows:
2016 2015 $’000 $’000
As at 1 May 14,076 - Acquisition of TAG (note 26) - 15,472 Hindsight adjustment (note 26) 3,917 - Return on non-plan assets 333 - Benefits paid (8) - Contributions 475 Actuarial gain on non-plan assets included within other comprehensive income 3,104 - Foreign currency exchange changes 375 (1,396)
As at 30 April 22,272 14,076
The long-term pension asset was acquired as part of the acquisition of TAG. The non-plan assets were not subject to an actuarial revaluation until after 30 April 2015 and therefore a hindsight adjustment has been made in respect of this and reflected in this year’s consolidated statement of comprehensive income. Retirement benefit obligations
The net liability included in the consolidated statement of financial position arising from obligations in respect of defined benefit schemes is as follows:
2016 2015 $’000 $’000
Present value of funded obligations 37,524 38,224 Fair value of plan assets (5,855) (5,482)
31,669 32,742
The retirement benefit obligation has moved as follows:
2016 2015
Defined benefit
obligations
Scheme assets
Retirement benefit
obligations
Defined benefit
obligations
Scheme assets
Retirement benefit
obligations
$’000 $’000 $’000 $’000 $’000 $’000 At 1 May 38,224 (5,482) 32,742 - - - Acquisition of TAG - - - 37,128 (5,871) 31,257 Current service cost 760 - 760 330 - 330 Benefits paid (100) 84 (16) (68) 16 (52) Contributions by plan participants - (126) (126) - (81) (81) Interest cost/(income) 546 (79) 467 320 (59) 261 Remeasurements - actuarial losses:
At 30 April 37,524 (5,855) 31,669 38,224 (5,482) 32,742
41
Notes to the financial statements (audited) 21. Retirement benefit obligations continued
$1.2m (2015: $0.6m) is included in the consolidated statement of comprehensive income in respect of the German defined benefit pension arrangements being a current service charge of $0.8m (2015: $0.3m) and a net finance charge of $0.5m (2015: $0.3m).
The contributions for the year ended 30 April 2017 is expected to be broadly in line with the current year. The amounts recognized as movements in equity included $0.1m (2015: $0.2m) of actuarial return on assets excluding amounts included in interest and $2.6m (2015: $4.4m loss) of experience gains arising on scheme liabilities. The key assumptions used for the German scheme were:
2016 2015
Rate of increase in final pensionable salary 2.60% 2.60% Rate of increase in pension payments 2.00% 2.00% Discount rate 1.70% 1.45% Inflation 2.00% 2.00%
The mortality assumptions for the German scheme are set based on actuarial advice in accordance with published statistics and experience in the territory, specifically German pension table ‘Richttafeln 2005 G’ by Prof. Dr. Klaus Heubeck. This is unchanged from that reported as at 30 April 2015.
Sensitivities
The table below provides information on the sensitivity of the defined benefit obligation to changes to the most significant actuarial assumptions. The table shows the impact of changes to each assumption in isolation, although, in practice, changes to assumptions may occur at the same time and can either offset or compound the overall impact on the defined benefit obligation. These sensitivities have been calculated using the same methodology as used for the main calculations. The weighted average duration of the defined benefit obligation is 25 years.
An increase of one year in the assumed life expectancy for both males and females would increase the defined benefit obligation by 2.9% (2015: 2.9%). The methods and types of assumptions used in preparing the sensitivity analysis did not change compared to previous years.
22. Share capital Ordinary shares at 10 pence each (2015: 10 pence each)
2016 2015
Shares $’000 Shares $’000
Issued and fully paid At 1 May 228,587,397 39,555 152,419,885 37,802 Shares issued to satisfy option awards 118,313 18 494,709 106 Share placement issues 500 - - - Shares issued on the acquisition of TAG - - 86,595,711 13,550 Share reorganization - - (10,922,908) (11,903)
At 30 April 228,706,210 39,573 228,587,397 39,555
Share issued during the year
During the year, 118,313 ordinary shares of 10 pence each (2015: 464,919 ordinary shares of 1313/24 pence each and 29,790 ordinary shares of 10 pence) were issued by the Company to settle exercised share options. The gross consideration received was $1.0m (2015: $1.5m). On the 22 March 2016, the Group announced its intention to conduct a placing with institutional investors to raise approximately £150m in order to partially fund the acquisition of Serena Software Inc. which was completed on 2 May 2016 (note 27). 500 new ordinary 10 pence shares and 10,872,680 treasury shares were issued at a price of £14.55 resulting in gross proceeds of £158.2m ($225.7m) and incurring costs of $3.0m. A $49.5m retained reserves movement relating to the issue of treasury shares reflecting their original issue costs, $176.2m of share premium and transaction costs of $3.0m were recorded. At 30 April 2016 a total of 29,924 treasury shares were held (2015: 11,339,583) such that the voting rights and number of listed shares at 30 April 2016 were 228,676,286 (2015: 217,247,764).
42
Notes to the financial statements (audited) 22. Share capital continued Potential issues of shares
Certain employees hold options to subscribe for shares in the Company at prices ranging from nil pence to 1,334.0 pence under the following share option schemes approved by shareholders in 2005 and 2006: the Long-Term Incentive Plan 2005, the Additional Share Grants, the Sharesave Plan 2006 and the Employee Stock Purchase Plan 2006. The number of shares subject to options at 30 April 2016 was 9,264,743 (2015: 8,919,079).
‘B’ shares at 60 pence each
2016 2015 Shares $’000 Shares $’000
Issued and fully paid At 1 May - - - - Issue of ‘B’ shares - - 50,568,360 47,477 Redemption of ‘B’ shares - - (50,568,360) (47,477)
At 30 April - - - -
On 20 November 2014, 50,568,360 ‘B’ shares were issued at 60 pence each, resulting in a total of $47.5m being credited to the ‘B’ share capital account. On 20 November 2014, 50,568,360 ‘B’ shares were redeemed at 60 pence each and an amount of $47.5m was deducted from the ‘B’ share capital account. ‘C’ shares at 0.0000001 pence each
2016 2015 Shares $’000 Shares $’000
Issued and fully paid At 1 May - - - - Issue of ‘C’ shares - - 89,328,151 - Cancellation of ‘C’ shares - - (89,328,151) -
At 30 April - - - -
On 20 November 2014, 89,328,151 ‘C’ shares were issued at 0.0000001 pence each, resulting in a total of 14 cents being credited to the ‘C’ share capital account. On 20 November 2014 a dividend of 60 pence per C share was declared and was payable on 20 November 2014. The ‘C’ shares were subsequently reclassified as Deferred Shares and repurchased by the Company for an aggregate consideration of 1 pence and then subsequently cancelled and an amount of 14 cents was deducted from the ‘C’ share capital account.
Deferred D Shares at 0.041667 pence each
2016 2015 Shares $’000 Shares $’000
Issued and fully paid At 1 May - - - - Issue of ‘Deferred ’ shares - - 15,606,772,650 11,903 Cancellation of ‘Deferred’ shares - - (15,606,772,650) (11,903)
At 30 April - - - -
On 20 November 2014, as a consequence of the share consolidation, 15,606,772,650 deferred D shares were issued at 0.041667 pence each, resulting in a total of $11.9m being credited to the 'Deferred D share capital account. The deferred D shares were repurchased by the Company for an aggregate consideration of 1 pence and cancelled. An amount of $11.9m was deducted from the 'Deferred D' share capital account.
43
Notes to the financial statements (audited) 23. Other reserves
Note
Capital redemption
reserve 2,5
Merger reserve 1,3,4,5
Total
$’000 $’000 $’000
As at 1 May 2014 103,983 (27,085) 76,898 Acquisition of TAG3 26 - 1,372,666 1,372,666 Return of Value – share consolidation5 11,903 - 11,903 Return of Value – new share issues5 47,477 (47,477) - Reallocation of merger reserve4 - (130,000) (130,000)
As at 30 April 2015 163,363 1,168,104 1,331,467
Reallocation of merger reserve4 - (180,000) (180,000)
As at 30 April 2016 163,363 988,104 1,151,467
1 On 17 May 2005, the Company acquired the entire issued share capital of Micro Focus International Limited by way of a share for share exchange, pursuant to which the previous shareholders of Micro Focus International Limited were issued and allotted three ordinary shares in the capital of the Company for every one ordinary share they previously held in Micro Focus International Limited. This increase in share capital created a merger reserve deficit of $27.1m. 2 In January 2012 a Return of Value was made to all shareholders amounting to $129.0m in cash after including a foreign exchange contract gain of $0.6m. As a result of this a capital redemption reserve was created following the redemption of the B shares. In November 2012 a further Return of Value was made to all shareholders amounting to $128.2m in cash after including a foreign exchange contract gain of $2.4m. In the year ended 30 April 2014 a further $47.1m was added to the capital redemption reserve following the redemption of the B shares.
3 On 20 November 2014 the TAG acquisition was completed (note 26). As a result of this a merger reserve was created of $1.372.7m. The acquisition of TAG was structured by way of a share for share exchange; this transaction fell within the provisions of section 612 of the Companies Act 2006 (merger relief) such that no share premium was recorded in respect of the shares issued. The Company chose to record its investment in TAG at fair value and therefore recorded a merger reserve equal to the value of the share premium which would have been recorded had section 612 of the Companies Act 2006 not been applicable (i.e. equal to the difference between the fair value of TAG and the aggregate nominal value of the shares issued). This merger reserve was initially considered unrealized on the basis it was represented by the investment in TAG, which is not considered to represent qualifying consideration (in accordance with Tech 02/10 (Guidance on the determination of realized profits and losses in the context of distributions under the Companies Act 2006)). Immediately following the acquisition of TAG, the Company's investment in TAG was transferred to another Group company in exchange for an intercompany loan. To the extent this loan is settled in qualifying consideration, the related proportion of the merger reserve is considered realized. 4 The merger reserve is an unrealized profit until it can be realized by the settlement of the intercompany loan by qualifying consideration. $180.0m of the intercompany loan is expected to be settled in qualifying consideration during the year to 30 April 2017 (2015: $130.0m) and as such an equivalent proportion of the merger reserve is considered realized and therefore has been transferred to the profit and loss account. 5 In December 2014 a Return of Value was made to all shareholders amounting to $131.6m in cash (note 25). The Return of Value was accompanied by a 0.9285 share consolidation and resulted in a net $11.9m reduction in share capital and an $11.9m increase in the capital redemption reserve. In addition $47.5m was transferred from the merger reserve to the capital redemption reserve.
24. Related party transactions
The Group has taken advantage of the exemption available under IAS 24, “Related Party Disclosures”, not to disclose details o f transactions with its subsidiary undertakings. At the beginning of the year Wizard Parent LLC held 39.9% of the issued share capital of the Company and during the year they reduced their holding to 13.8% by 30 April 2016 and by 13 July 2016 their holding was only 2.6%. There are three major shareholders of Wizard Parent LLC and one of these shareholders held a major shareholding in a technology company with which Micro Focus has traded with during the year. These transactions were at arms’ length and the goods and services were based on the price l ists in force and terms that would be available to third parties. The value of sales made to this third party in the year was $12.2m (2015: $5.0m) and the value of goods purchased was $0.8m (2015: $0.1m). 25. Return of Value to shareholders
There has not been a Return of Value to shareholders in the year ended 30 April 2016. In December 2014 the Company completed a Return of Value to shareholders amounting to £83.9m ($131.6m) in cash (60 pence per share, equivalent to 94.02 cents per share), by way of a B and C share scheme, which gave shareholders (other than certain overseas shareholders) a choice between receiving the cash in the form of income or capital. The Return of Value was accompanied by a 0.9285 share consolidation to maintain broad comparability of the share price and return per share of the ordinary shares before and after the creation of the B and C shares. This was the Group’s 4th Return of Value to shareholders. Since 25 March 2011 the Company has returned a total of £625.1m to shareholders through share buy-backs, Returns of Value and ordinary dividends which represented 98.4% of the Market Capitalization at that time.
As part of the corporate entity restructuring resulting from the acquisition a merger reserve was created of approximately $1.4bn, which is expected to become a distributable reserve in future periods. This creates flexibility for future Returns of Value once Net Debt to Facility EBITDA is below 2.5 times.
44
Notes to the financial statements (audited) 26. Business combinations
Summary of acquisitions in the year ended 30 April 2016
Consideration
Carrying value at
acquisition Fair value
adjustments
Hindsight
adjustments Goodwill
Shares Cash
Total $’000 $’000 $’000 $’000 $’000 $’000 $’000
Acquisitions in the year ended 30 April 2016:
Authasas BV 1,110 10 - 8,840 - 9,960 9,960 Acquisitions in the year ended 30 April 2015:
TAG (501,338) (225,796) (5,583) 2,118,933 1,386,216 - 1,386,216
On the 17 July 2015, the Group acquired the entire share capital of Authasas BV, a company registered in The Hague, the Netherlands. The activities of Authasas BV mainly consist of the developing, producing and publishing/selling of authentication software. The consideration was $10.0m and was satisfied using Micro Focus’ existing bank facilities. The acquisition costs incurred of $0.5m were expensed as exceptional items through administrative expenses in the consolidated statement of comprehensive income. A fair value review was carried out on the assets and liabilities of the acquired business, resulting in the identification of intangible assets.
Details of the net assets acquired and goodwill are as follows:
Carrying value at acquisition
Fair value adjustments
Fair value
$’000 $’000 $’000
Intangible assets - purchased 1 - 3,356 3,356 Intangible assets - other 2 1,973 (1,973) - Property, plant and equipment 14 - 14 Inventory 11 - 11 Deferred tax asset 3 339 (339) - Trade and other receivables 463 - 463 Cash and cash equivalent 106 - 106 Trade and other payables 4 (1,796) (68) (1,864) Deferred tax liabilities 5 - (966) (966)
Net assets 1,110 10 1,120 Goodwill (note 13) 8,840
Consideration 9,960
Consideration satisfied by :
Cash 9,960
Trade and other receivables is net of a bad debt provision of $16,000. The fair value adjustments relate to: 1 Purchased intangible assets have been valued based on a market participant point of view and the fair value has been based
on various characteristics of the product lines and intangible assets of Authasas BV; 2 Other intangible assets relating to development costs have been written down to nil; 3 The deferred tax asset on acquisition has been written down to nil; 4 Deferred income has been valued taking account of the remaining performance obligations; 5 A deferred tax liability has been established relating to the purchase of intangibles.
The purchased intangible assets acquired as part of the acquisition can be analyzed as follows (note 14):
Fair value
$’000
Technology 2,545
Customer relationships 811
3,356
45
Notes to the financial statements (audited) 26. Business combinations continued
Acquisition of Authasas BV continued
The value of the goodwill represents the value of the assembled workforce at the time of the acquisition with specific knowledge and technical skills. It also represents the prospective future economic benefits that are expected to accrue from enhancing the portfolio of products available to the Company’s existing customer base with those of the acquired business. The Group has used acquisition accounting for the purchase and the goodwill arising on consolidation of $8.8m has been capitalized. From the date of acquisition, 17 July 2015 to 30 April 2016, the acquisition contributed $0.1m to revenue and a loss of $0.6m to Adjusted EBITDA. The estimated results of the above acquisition, excluding intercompany royalties, if it had been made at the beginning of the accounting year, 1 May 2015 to 30 April 2016 would have been as follows:
Pro-forma $m
Revenue 0.1
Loss for the year (1.0)
Adjusted EBITDA (0.8)
Underlying Adjusted EBITDA (1.3)
The estimated results of the Enlarged Group if the acquisition had been made at the beginning of the accounting year, 1 May 2015 to 30 April 2016 would have been as follows:
Pro-forma $m
Revenue 1,245.0
Profit for the year 162.8
Adjusted EBITDA 546.6
Underlying Adjusted EBITDA 532.2
The above figures are based on information provided to Micro Focus by Authasas BV and the results since acquisition. Acquisition of TAG
On 20 November 2014, the Group acquired from Wizard Parent LLC (“Wizard”), TAG, a US Company based in Houston. The acquisition of TAG was made as this presented a rare opportunity to achieve a significant increase in the scale and breadth of Micro Focus, with the potential to deliver Total Shareholder Returns that are superior to those likely to be achieved on an organic basis. The Company acquired the entire share capital of TAG, in exchange for the issue of 86.6m Consideration Shares to TAG’s parent Company, Wizard. The value of the Consideration Shares allotted to Wizard was $1,386.2m.
Of the consideration of $1,386.2m, $13.5m was credited to share capital and $1,372.7m was credited to the merger reserve. The Group qualifies for merger accounting under S612 of the Companies Act 2006. The acquisition of TAG was classified as a reverse takeover under the London Stock Exchange Listing Rules. Under the completion of the acquisition the listing on the premium listing segment of the Official List of all the Existing Ordinary Shares was cancelled and application was made for the immediate readmission of those Existing Ordinary Shares and the admission of the Consideration Shares to the premium listing segment of the Official List and to trading on the London Stock Exchange’s main market for listed securities. The relisting fees incurred by the Group were $723,000.
A fair value review was carried out on the assets and liabilities of the acquired business, resulting in the identification of intangible assets.
46
Notes to the financial statements (audited) 26. Business combinations continued
Acquisition of TAG continued
Details of the net liabilities acquired and goodwill are as follows:
Net liabilities acquired (501,338) (225,796) (5,583) (732,717)
Goodwill (note 13) 2,118,933
Consideration 1,386,216
Consideration satisfied by :
Shares 1,386,216
Trade and other receivables is net of a bad debt provision of $124,000. The fair value adjustments relate to: 1 Purchased intangible assets have been valued based on a market participant point of view and the fair value has been based
on various characteristics of the product lines and intangible assets of TAG; 2 Deferred income has been valued taking account of the remaining performance obligations; 3 Other intangible assets relating to development costs have been written down to nil; 4 Deferred rent within ‘Trade and other payables’ has been reassessed; and 5 A deferred tax liability has been established relating to the purchased intangibles.
As at 30 April 2016 the hindsight adjustments that have been identified to finalize the acquisition fair value, are long-term pension assets, accruals and legal provisions. The valuation of long-term pension assets was reassessed, additional accruals were identified and additional legal provisions were made relating to a claim. The tax impact of these adjustments has been included. The valuation of current and deferred tax balances has also been reassessed.
47
Notes to the financial statements (audited) 27. Post balance sheet events
Acquisition of Serena Software Inc.
On 2 May 2016, the Group acquired the entire share capital of Spartacus Acquisition Holdings Corp. the holding company of Serena Software Inc. (“Serena”) and its subsidiaries at an enterprise value of $540m, payable in cash at completion. The acquisition is highly consistent with the Group’s established acquisition strategy and focus on the efficient management of mature infrastructure software products. Serena is a leading provider of enterprise software focused on providing Application Lifecycle Management products for both mainframe and distributed systems. Whilst Serena is headquartered in San Mateo, California the operations are effectively managed from offices in Hillsboro, Oregon and St. Albans in the United Kingdom. It operates in a further 10 countries. The Serena Group’s customers are typically highly regulated large enterprises, across a variety of sectors including banking, insurance, telco, manufacturing and retail, healthcare and government. Like Micro Focus, Serena benefits from high levels of recurring maintenance revenues and high EBITDA margins, with consistently strong cash generation and no significant customer concentration. Serena’s position in the Source Code Change Management (SCCM) segment complements the Micro Focus product portfolio in COBOL Development, Host Connectivity, and CORBA.
Serena will be integrated into the Micro Focus product portfolio and the revenues will be reported in the Development and IT Operations Management Tools sub-portfolio and, consequently, it will give rise to operational efficiencies. The transaction is expected to enhance the Group’s adjusted earnings in the year ending 30 April 2017.
The Group acquired the Serena Group on a cash and debt free basis for an enterprise value of $540m in cash, to be settled through the repayment of the Serena Group’s net indebtedness at completion (estimated at approximately $252m) and the purchase of Serena’s entire share capital from the vendors (being principally funds managed by US private equity firm HGGC and a trust related to Serena’s founder) for the balance of approximately $288m, subject to customary working capital and other adjustments.
The transaction has been funded through the Group’s existing cash resources together with additional debt and equity finance arranged through Barclays, HSBC and Numis Securities. On the 2 May 2016, the Group’s existing revolving credit facility were extended from $225m to $375m and the Group raised approximately £158.2m (approximately $225.7m) through a Placing underwritten by Numis Securities incurring $3.0m of costs associated with the Placing in March 2016 (note 22). The last period for which audited results (KPMG Auditors) are available for the Serena Group is the year ended 31 January 2015. For this period the Serena Group reported revenues of $176.2m (of which licence, maintenance and professional services represented approximately 19%, 73% and 8% respectively) and profit before tax of $30.3m. The Group expects that Underlying Adjusted EBITDA (as reported on the same basis as Micro Focus) is $87.0m for the Serena Group for the year ended 31 January 2015. As at 31 January 2015 the gross assets of the Serena Group amounted to $558.4m. These figures are audited under US GAAP.
The Group has not yet presented the full IFRS3 “Business Combinations” disclosures as it is not yet practicable to do so.
As part of its due diligence process Micro Focus has also reviewed unaudited management accounts information for the Serena Group’s financial year ended 31 January 2016, presented under US GAAP, which shows revenues of $162.3m and Underlying Adjusted EBITDA of $80.9m. Approximately $8m of the decrease in revenues and $3m of the decrease in Underlying Adjusted EBITDA between FY15 and FY16 are attributable to foreign exchange movements, notably the strengthening of the US dollar. 28. Principal risks and uncertainties
Risk management overview
The board is responsible for ensuring the effective identification, assessment and management of risk across the Group. As the Group has grown following the transformational acquisition of TAG in November 2014, so the board has enhanced the risk management process to ensure that it is robust. Underpinning the operation of, and central to, the risk management process is the culture of the Group, led by the board, of openness, transparency, trust and accountability. On behalf of the board the Audit Committee reviews and challenges the effectiveness of the risk management process. A review of the Group’s overall risk management framework was undertaken at the start of the year. In the year the board put in place a new Risk Management Policy and Procedure which included a revised Risk Management Framework (“RMF”). A key component of the RMF for the board was that, whilst the RMF enables a robust assessment of risk, it is also practical and proportionate. This ensures that the RMF is embedded into the day to day business processes across the Group, to drive risk awareness and risk culture. Going forward the board will continue to build upon the RMF to respond to any future change in the Group’s risk profile. As part of the assurance for the board the operation of the RMF is facilitated by an independent Internal Risk Management function. Individual risks are also mapped onto the Internal Audit plan for the year. The RMF is also subject to an annual review by Internal Audit.
48
Notes to the financial statements (audited) 28. Principal risks and uncertainties continued
Risks are identified, assessed and recorded by the Micro Focus and SUSE businesses and the Group functions. Each business area director and Group function head is responsible for the identification, assessment and management of risk in their area. Each risk is owned by an individual in that area. The process includes the use of risk registers, one to one interviews with business area directors, Group function heads and board members. Risks are assessed on a gross and net basis against a consistent set of criteria defined by the board. The criteria measures likelihood of occurrence against potential impact to the Group including financial results, strategic plans, operations and reputation. Each risk is given a risk tolerance. The assessment includes current and emerging risks, as well as internal and external threats. The board takes a balanced approach to risk to ensure an appropriate position between risk aversion, opportunities and gains in pursuit of its strategic objectives when setting the risk appetite for the Group. Existing controls and improvement actions are recorded on the risk register for each risk.
The RMF contains a continuous cycle of review and reporting over the year. No fewer than five times a year, following one to one interviews with the business area directors and Group Function heads, the individual risk registers are consolidated to form the Group risk profile. The Group risk profile is reported to the Executive Directors for monitoring, review and challenge. A report is made to every Audit Committee meeting in the year for review and to challenge the effectiveness of the RMF, and then approval by the board. As part of the RMF an annual review of risk is also undertaken, this is aligned with the annual review of Internal Audit. These annual reviews focus on areas for improvement in the process, as well as the key emerging areas of risk for the Group in the year ahead. An area of focus in the forthcoming year is to strengthen the approach to risk appetite and so ensure a consistent risk based decision making process across the Group.
Principal risks and uncertainties
The Group, in common with all businesses, could be affected by risks and uncertainties that may have a material effect on its business operations and achieving its strategic objectives including its business model, future performance, solvency or liquidity. These risks could cause actual results to differ materially from forecasts or historic results. The board is mindful of the interdependencies of some risks. Where possible, the Group seeks to mitigate these risks through its RMF and internal controls, but this can only provide reasonable assurance and not absolute assurance against material losses. Following the UK vote on the 23 June 2016 to leave the EU there is likely to be a protracted period for many months of uncertainty and negotiation whilst the political and legal issues are resolved. We have put in place a Brexit Working Group and have processes in place to assess, respond, monitor and track the impact of Brexit on our businesses and associated risks as matters progress and how the business can seek to mitigate these risks. The uncertainty has created an immediate impact on the financial markets in currency fluctuations and this is reflected in our Treasury risk below.
The following are the principal risks and uncertainties, potential impacts and mitigations that are relevant to the Group as a provider of software products and associated services at this time. The list of principal risks includes risks reported in FY15 and the FY16 interims relating to Products, Go to Market models, Competition, Employees and Macro-economic environment as well as newly reported risks in relation to Change Management, IT Systems and Information, Legal and Regulatory Compliance, Intellectual Property, Treasury and Tax as part of the new RMF referred to under the Risk management overview above. There may be other risks which could emerge in the future. Products
Risk
To remain successful the Group must ensure that its products continue to meet the requirements of customers. Investment in research and innovation in product development is essential to meet customer and partner requirements in order to maximize revenues and corporate performance. The Group has a large number of products, at differing stages of their life cycle. The extent of investment in each product set needs to be managed and prioritized considering the expected future prospects, to ensure an effective balance between growth and legacy products. Potential impact
If products do not meet the requirements of customers they will seek alternative solutions, resulting in the loss of new revenue opportunities and the cancellation of existing contracts. Insufficient focus on key research and development projects may damage the long-term growth prospects of the Group. Poor cross-selling of Micro Focus and SUSE products could reduce the prospects for additional revenue streams going forward. Mitigation
The Group continued to improve the interaction between Product Management, Product Development, Sales and Marketing. The Group’s structured approach to managing its products was further enhanced during the year. Following the TAG acquisition, to build a strong plan and foundation on which to deliver the Group’s potential, the Group carried out a detailed analysis of the individual products, their markets, customers and growth potential. As from the start of the year the Group has operated as two product portfolios Micro Focus and SUSE. All of the Group’s products are managed through the global product management and development organization, with a geographic Go to Market organization. The Micro Focus, NetIQ, Attachmate and Novell products are managed as a portfolio under Micro Focus, with a defined strategy, target market and growth profile for each product. To capitalize on the growth potential of the SUSE product portfolio these are managed separately and dedicated resources concentrate on the development, customer care and sales, marketing and engineering.
49
Notes to the financial statements (audited) 28. Principal risks and uncertainties continued
To ensure appropriate leadership and the continued evolution of the two product portfolios, on 1 February 2016 Chief Executive Officers for Micro Focus and SUSE were appointed to the board. On 17 July 2015 the Group acquired Authasas BV a Dutch entity proving Multi Factor Authentication for the security market which is embedded in TAG products. On 22 March 2016 the board announced the acquisition of Spartacus Acquisition Holdings Corp, the holding company of Serena Software Inc. (“Serena”), which will become part of the Micro Focus product portfolio, to further enhance the strategy of efficient management of mature infrastructure software products. Serena’s position in the Source Code Change Management segment will be integrated into the IT development and operational management tools sub-portfolio of Micro Focus, which will complement the Micro Focus product portfolio in COBOL Development, Host Connectivity and CORBA. At SUSE there was an increase in headcount in the year focused on the development, customer care and sales, marketing and engineering of the SUSE portfolio.
Go to Market (“GTM”) models
Risk
For the Group to succeed in meeting revenue and growth targets it requires successful GTM models across the full product portfolio, with effective strategies and plans to exploit channel opportunities and focus the sales force on all types of customer categories. In addition, effective GTM models will be more successful if accompanied by compelling Micro Focus and SUSE brand awareness programmes. Potential impact
Poor execution of GTM plans may limit the success of the Group by targeting the wrong customers through the wrong channels and using the wrong product offerings. Mitigation
Following the integration review the Group undertook a major restructuring to create a global product group with geographic GTM sales organizations. Revenue plans are supported by a range of measures to monitor and drive improvements in GTM operating models in both Micro Focus and SUSE. To ensure appropriate leadership and the continued evolution of the two businesses, on 1 February 2016 Chief Executive Officers for Micro Focus and SUSE were appointed to the board. The dedicated sales teams operate by portfolio but management are targeted on the sales of both Micro Focus and SUSE product portfolios. Operationally there are quarterly business reviews with all geographies and monthly reviews with regional presidents, the President of Sales for Micro Focus and SUSE participate in their respective weekly management team meetings to review sales performance and GTM priorities.
Customer sales cycles are reviewed regularly and a bid review process is in place to monitor and maximize customer revenue opportunities. In addition to sales performance reviews, marketing and product development programmes are assessed regularly to optimize levels of qualified pipeline and ensure that marketing programmes are supported by appropriate product offerings. A series of measures are in place to focus the direction of the sales force towards a broad range of customer categories. These measures include detailed bid management, tailored quota targets and robust pre-sales management. In addition, brand awareness programmes are in place and reviewed on an on-going basis to draw on differentiated and consistent PR plans across key geographies. These are supported by targeted industry analyst relations to reach and raise Micro Focus and SUSE brand awareness through key marketplace influencers. Brand building is also supported by growing a customer reference programme and online programmes such as effective search engine optimization, use of social media and improved corporate websites. In the year the Product to Market process was standardized so that execution was on a more consistent basis. Micro Focus continued to run the internal sales certification programme, to improve the level of expertise across the sales force and the Micro Focus Sales Academy, the initiative through which it hires graduate sales representatives to enhance the sales capability and train up new talent with the potential to progress within the sales organization.
Competition
Risk
Comprehensive information about the markets in which Micro Focus and SUSE operate is required for the Group to assess competitive risks effectively and to perform successfully. Potential impact
Failure to understand the competitive landscape adequately and thereby identify where competitive threats exist may damage the successful sales of the Group’s products.
50
Notes to the financial statements (audited) 28. Principal risks and uncertainties continued
Mitigation
Group product plans contain analysis of competitive threats and subscriptions to industry analyst firms are leveraged to better understand market dynamics and competitor strategies. In addition, customer contact programmes are analyzed for competitive intelligence. Micro Focus and SUSE continue to monitor and review intelligence on market threats to focus on offering best in class service to customers.
Employees
Risk
The retention and recruitment of highly skilled and motivated employees, at all levels of the Group, is critical to the success and future growth of the Group in all countries in which it operates. Employees require clear business objectives, and a well communicated vision and values, for the Group to achieve alignment and a common sense of corporate purpose among the workforce. Potential impact
Failure to retain and develop skill sets, particularly in sales and research and development may hinder the Group’s sales and development plans. Weak organizational alignment and inadequate incentivization may lead to poor performance and instability. It could also have an adverse impact on the realization of strategic plans. Mitigation
The Group has policies in place to help ensure that it is able to attract and retain employees of a high caliber with the required skills. These policies include training, career development and long-term financial incentives. Leadership training schemes are in place to support management development and succession plans. The Group also has in place a performance management and appraisal system. The measures for talent management will continue to be enhanced to ensure a rigorous recruitment and retention process which is aligned to business as usual as well as the strategic plans for the Group. Succession plans have been developed and are in place for key leadership positions within the Company.
In the year the Group took significant action to develop its management capability both internally, by training and promotions, and through external hires. On 1 March 2016 the Group appointed a dedicated Group Human Resources Director, previously the role had been combined with business operations.
Change management
Risk
The Group is engaged in a number of major change projects including acquisitions to grow the business by strengthening the portfolio of products and capabilities, and projects to standardize systems and processes. The successful integration of businesses will build a solid base for further expansion. These projects expose the Group to transformation risks. Potential Impact
Failure to analyze, execute and co-ordinate the various projects successfully may result in the disruption of the ongoing business without delivering the benefits of the operational efficiencies and/or commensurate increase in revenues. In addition this may affect the ability to execute strategic plans for growth. Mitigation
The Group has an established acquisition strategy and focus on efficient execution in the mature infrastructure software products. The Group undertook the transformational acquisition of TAG which was followed by the comprehensive Integration Review. In March 2016 the Group announced the acquisition of Serena. All projects are run in a dedicated Programme Management Office by an appropriately experienced team, utilizing external resources as required. There are detailed and robust governance disciplines around each project. The board monitors and reviews progress against all of the projects. On 1 March 2016 the Group appointed a dedicated Group Business Operations and Integration Director (previously the role had been combined with Group HR) to ensure that execution of the various projects are successfully aligned so as to minimize any disruption to business as usual.
IT systems and information
Risk
The Group’s operations, as most businesses, are dependent on maintaining and protecting the integrity and security of the IT systems and management of information. The Group may experience a major breach of system security or cyber-attack. Potential Impact
Disruption to the IT systems could adversely affect business and Group operations in a variety of ways, which may result in an adverse impact on revenues and reputational damage.
51
Notes to the financial statements (audited) 28. Principal risks and uncertainties continued
Mitigation
The Group has in place a highly skilled technology team which constantly monitors and reviews the performance and availability of the Group IT systems including any risk of cyber-attack. In the year the Group enhanced this team and reviewed the IT Security Management System. Policies and processes are in place for the protection of business and personal information. The Group has in place well established and tested business continuity plans.
Legal and regulatory compliance
Risk
The Group operates across a number of jurisdictions. Compliance with national and regional laws and regulations is essential to successful business operations. Potential impact
Failure to comply could result in civil or criminal sanctions as well as possible fines and reputational damage. Mitigation
The Group has in place policies and procedures to mitigate these risks. The Group’s legal and regulatory team, enhanced by specialist external advisors as required, monitor and review compliance. There is a Compliance Committee and a Market Abuse and Insider Dealing Committee which report into the board. All staff are subject to mandatory compliance training.
Intellectual property
Risk
Failure to adequately protect the Group’s Intellectual Property and brands. Potential Impact
Failure could adversely affect the ability of the Group to compete in the market place and affect the Group’s revenue and reputation. Mitigation
There are procedures in place across the Group to ensure the appropriate protection and use of the Group’s brands and intellectual property, which are monitored by the IP Panel and Legal team.
Treasury
Risk
The Group operates across a number of jurisdictions and so is exposed to currency fluctuations. The risk of foreign exchange fluctuations may be increased as a result of Brexit. The Group targets a Net Debt to Facility EBITDA ratio of 2.5 times and may require additional debt funding in order to execute its acquisition strategy. Potential Impact
The relative values of currencies can fluctuate and may have a significant impact on business results. Insufficient access to funding could limit the Group’s ability to achieve its desired capital structure or to complete acquisitions. Mitigation
The Group’s operations are diversified across a number of currencies. Changes in foreign exchange rates are monitored and exposures regularly reviewed and actions taken to reduce exposures where necessary. The Group provides extensive constant currency reporting to enable investors to better understand the underlying business performance. The Group has significant committed facilities in place, the earliest of which matures in November 2019 and sufficient headroom to meet its operational requirements. The Group seeks to maintain strong relationships with its key banking partners and lenders and to proactively monitor the loan markets. The Group also has strong engagement with the providers of equity capital, which represents an alternative source of capital.
52
Notes to the financial statements (audited) 28. Principal risks and uncertainties continued
Tax
Risk
The tax treatment of the Group’s cross-border operations is subject to the risk of challenge under tax rules and initiatives targeting multinationals’ tax arrangements, including the OECD’s Base Erosion and Profit Shifting project and EU state aid rules.
Potential Impact
Tax liabilities in various territories in which the Group operates could be significantly higher than expected. Mitigation
Tax laws, regulations and interpretations are kept under ongoing review by the Group and its advisors. The Group reviews its operations, including the structuring of intra-group arrangements, on a periodic basis to ensure that risks are identified and mitigated accordingly. External professional advice is obtained to support positions taken in financial statements and local tax returns where there is significant uncertainty or risk of challenge.
Macro-economic environment
Risk
The Group operates a global business and is exposed to a variety of external economic and political risks which may affect the Group’s business operations and execution of the strategy. Potential Impact
Adverse economic conditions could affect sales, and other external economic or political matters, such as price controls, could affect the business and revenues. Mitigation
The spread of jurisdictions allows the Group to be flexible to adapt to changing localized risk to a certain extent. The Group has business continuity plans and crisis management procedures in place in the event of political events or natural disasters.