1 MICRO-MODELING OF TESTED FRAMED-WALL WITH OPENINGS Davorin PENAVA 1 , Vladimir SIGMUND 2 and Ivica KOŽAR 3 ABSTRACT This paper uses micro modelling as a substitute for missing tests of reinforced concrete frames with openings but one cannot just use material data resulting from simple tests performed on a single material. Material behaviour in composite structures like reinforced concrete frames depends on their interaction that cannot be analysed in single material tests so the model parameters have to be calibrated on tests on structures. The model is then used to extrapolate results on other cases of interest but without any guarantee that the obtained results would be safe. In this paper we report on difficulties and obstacles found in this process. The analysed cases comprise the window and door openings of medium size, centrically or eccentrically positioned within unreinforced masonry infill made of clay hollow masonry units and general purpose mortar. We discuss the physical meaning of material properties used in the model and limitations of the model extrapolation. INTRODUCTION Structural unreinforced infill wall within reinforced concrete frame or as together framed-wall, with or without unconfined or confined openings, are difficult to model. This is primarily because of the lack of knowledge about their interaction, complex failure mechanisms and the vast material properties needed, yet impossible to include (or known) them all. Methodology called micro-modelling works by defining each element i.e. brick and joint individually, compared to equivalent diagonal strut i.e. macro-model which replaces the complete infill wall (Stafford-Smith, 1966). The need for material data exceeds standard properties that can be determined by simple tests thus the scientist (rather than engineer) must seek for theoretical sources to complete his task. Another, but not less important, is the computational demand which limits this type of analysis on a frame or two. Even if previous is arranged one cannot just proceed with the analysis since results will surely not be adequate i.e. not real. This is primary the reason for the usage of this method only and if only tests are provided first. In this paper we report on the encountered problems with non-linear finite element analysis of previously tested framed-walls with window or door opening, centrically or eccentrically positioned. The idea was to show the differences in results between two approaches. The first was by taking simplest (naive) approach of input the material properties and obtaining results and the second is by so-called calibration. We found that certain effects that are not usually taken into account e.g. inclination of the mortar in masonry unit hollows can influence the results significantly. The modelling of bedjoint after the initial shear strength was reached was crucial for the calibration. Framed-wall's cyclic response description using the micro-modelling approach demands good experimental background of the whole model and its constituents especially in nonlinear range (initial values were proven not to be enough). 1 Assistant Professor, Josip Juraj Strossmayer University of Osijek, Osijek, [email protected]2 Full Professor, Josip Juraj Strossmayer University of Osijek, Osijek, [email protected]3 Full Professor, University of Rijeka, Rijeka, [email protected]
Transcript
1
MICRO-MODELING OF TESTED FRAMED-WALL WITH OPENINGS
Davorin PENAVA1, Vladimir SIGMUND
2 and Ivica KOŽAR
3
ABSTRACT
This paper uses micro modelling as a substitute for missing tests of reinforced concrete frames with
openings but one cannot just use material data resulting from simple tests performed on a single
material. Material behaviour in composite structures like reinforced concrete frames depends on their
interaction that cannot be analysed in single material tests so the model parameters have to be
calibrated on tests on structures. The model is then used to extrapolate results on other cases of interest
but without any guarantee that the obtained results would be safe. In this paper we report on
difficulties and obstacles found in this process. The analysed cases comprise the window and door
openings of medium size, centrically or eccentrically positioned within unreinforced masonry infill
made of clay hollow masonry units and general purpose mortar. We discuss the physical meaning of
material properties used in the model and limitations of the model extrapolation.
INTRODUCTION
Structural unreinforced infill wall within reinforced concrete frame or as together framed-wall, with or
without unconfined or confined openings, are difficult to model. This is primarily because of the lack
of knowledge about their interaction, complex failure mechanisms and the vast material properties
needed, yet impossible to include (or known) them all.
Methodology called micro-modelling works by defining each element i.e. brick and joint
individually, compared to equivalent diagonal strut i.e. macro-model which replaces the complete
infill wall (Stafford-Smith, 1966). The need for material data exceeds standard properties that can be
determined by simple tests thus the scientist (rather than engineer) must seek for theoretical sources to
complete his task. Another, but not less important, is the computational demand which limits this type
of analysis on a frame or two. Even if previous is arranged one cannot just proceed with the analysis
since results will surely not be adequate i.e. not real. This is primary the reason for the usage of this
method only and if only tests are provided first.
In this paper we report on the encountered problems with non-linear finite element analysis of
previously tested framed-walls with window or door opening, centrically or eccentrically positioned.
The idea was to show the differences in results between two approaches. The first was by taking
simplest (naive) approach of input the material properties and obtaining results and the second is by
so-called calibration. We found that certain effects that are not usually taken into account e.g.
inclination of the mortar in masonry unit hollows can influence the results significantly. The
modelling of bedjoint after the initial shear strength was reached was crucial for the calibration.
Framed-wall's cyclic response description using the micro-modelling approach demands good
experimental background of the whole model and its constituents especially in nonlinear range (initial
values were proven not to be enough).
1 Assistant Professor, Josip Juraj Strossmayer University of Osijek, Osijek, [email protected] 2 Full Professor, Josip Juraj Strossmayer University of Osijek, Osijek, [email protected] 3 Full Professor, University of Rijeka, Rijeka, [email protected]
2
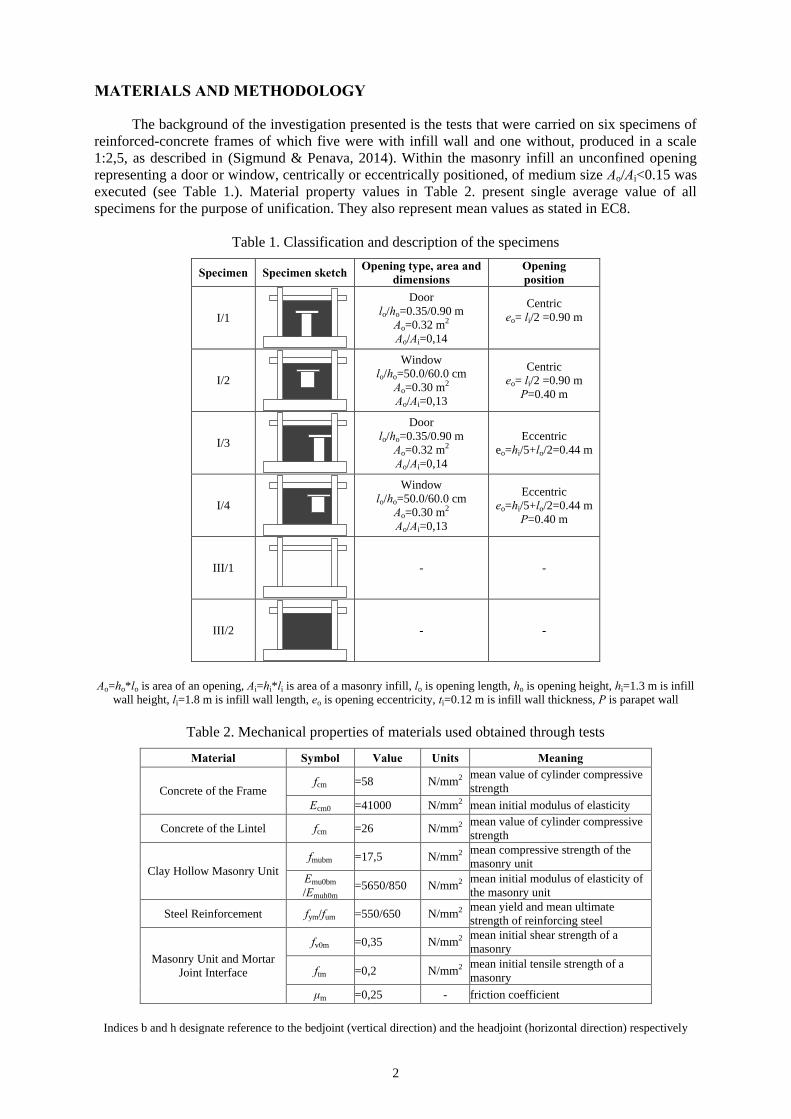
MATERIALS AND METHODOLOGY
The background of the investigation presented is the tests that were carried on six specimens of
reinforced-concrete frames of which five were with infill wall and one without, produced in a scale
1:2,5, as described in (Sigmund & Penava, 2014). Within the masonry infill an unconfined opening
representing a door or window, centrically or eccentrically positioned, of medium size Ao/Ai<0.15 was
executed (see Table 1.). Material property values in Table 2. present single average value of all
specimens for the purpose of unification. They also represent mean values as stated in EC8.
Table 1. Classification and description of the specimens
Specimen Specimen sketch Opening type, area and
dimensions
Opening
position
I/1
Door
lo/ho=0.35/0.90 m
Ao=0.32 m2
Ao/Ai=0,14
Centric
eo= li/2 =0.90 m
I/2
Window
lo/ho=50.0/60.0 cm
Ao=0.30 m2
Ao/Ai=0,13
Centric
eo= li/2 =0.90 m
P=0.40 m
I/3
Door
lo/ho=0.35/0.90 m
Ao=0.32 m2
Ao/Ai=0,14
Eccentric
eo=hi/5+lo/2=0.44 m
I/4
Window
lo/ho=50.0/60.0 cm
Ao=0.30 m2
Ao/Ai=0,13
Eccentric
eo=hi/5+lo/2=0.44 m
P=0.40 m
III/1
- -
III/2
- -
Ao=ho*lo is area of an opening, Ai=hi*li is area of a masonry infill, lo is opening length, ho is opening height, hi=1.3 m is infill
wall height, li=1.8 m is infill wall length, eo is opening eccentricity, ti=0.12 m is infill wall thickness, P is parapet wall
Table 2. Mechanical properties of materials used obtained through tests
Material Symbol Value Units Meaning
Concrete of the Frame fcm =58 N/mm2 mean value of cylinder compressive
strength
Ecm0 =41000 N/mm2 mean initial modulus of elasticity
Concrete of the Lintel fcm =26 N/mm2 mean value of cylinder compressive
strength
Clay Hollow Masonry Unit
fmubm =17,5 N/mm2 mean compressive strength of the
masonry unit
Emu0bm
/Emuh0m =5650/850 N/mm2 mean initial modulus of elasticity of
the masonry unit
Steel Reinforcement fym/fum =550/650 N/mm2 mean yield and mean ultimate
strength of reinforcing steel
Masonry Unit and Mortar
Joint Interface
fv0m =0,35 N/mm2 mean initial shear strength of a
masonry
ftm =0,2 N/mm2 mean initial tensile strength of a
masonry
μm =0,25 - friction coefficient
Indices b and h designate reference to the bedjoint (vertical direction) and the headjoint (horizontal direction) respectively
D.Penava, V.Sigmund & I.Kožar 3
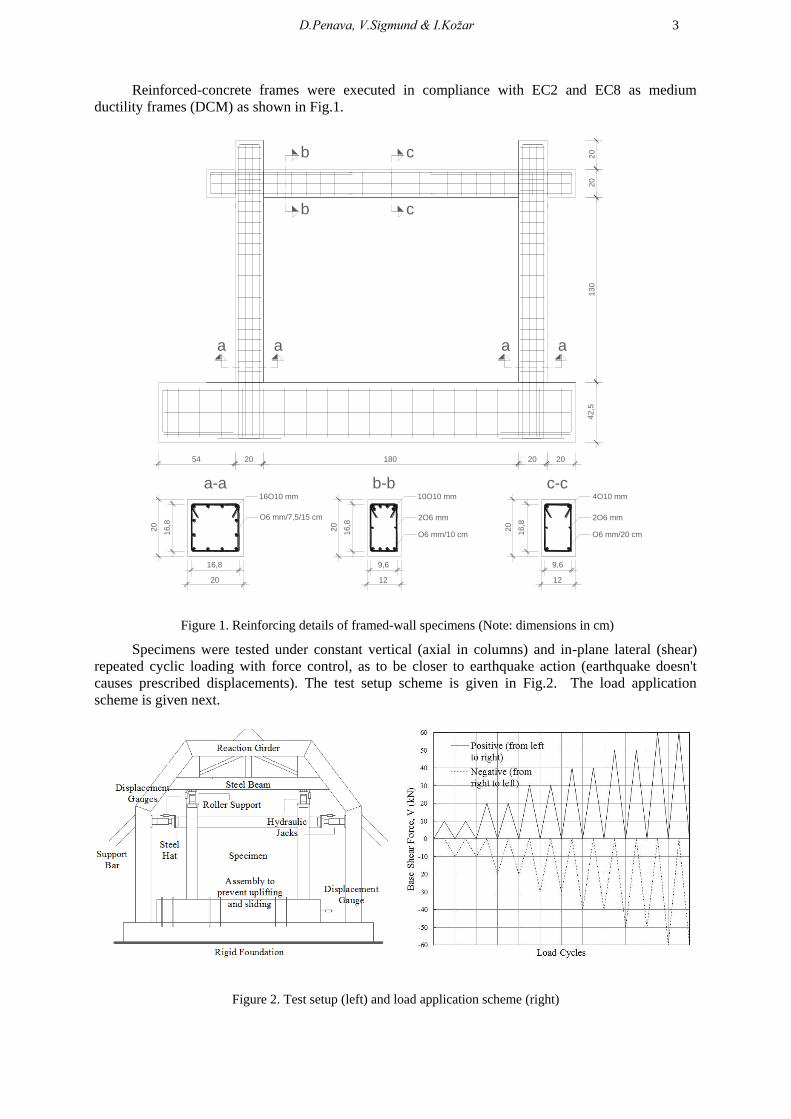
Reinforced-concrete frames were executed in compliance with EC2 and EC8 as medium
ductility frames (DCM) as shown in Fig.1.
b
b
a aa a
c
c
54 20 180 20 20
42,5
130
20
20
16,8
20
20
16,8
16O10 mm
O6 mm/7,5/15 cm
20
16,8
12
9,6
4O10 mm
O6 mm/20 cm
2O6 mm
20
16,8
12
9,6
10O10 mm
O6 mm/10 cm
2O6 mm
a-a b-b c-c
Figure 1. Reinforcing details of framed-wall specimens (Note: dimensions in cm)
Specimens were tested under constant vertical (axial in columns) and in-plane lateral (shear)
repeated cyclic loading with force control, as to be closer to earthquake action (earthquake doesn't
causes prescribed displacements). The test setup scheme is given in Fig.2. The load application
scheme is given next.
Figure 2. Test setup (left) and load application scheme (right)
4
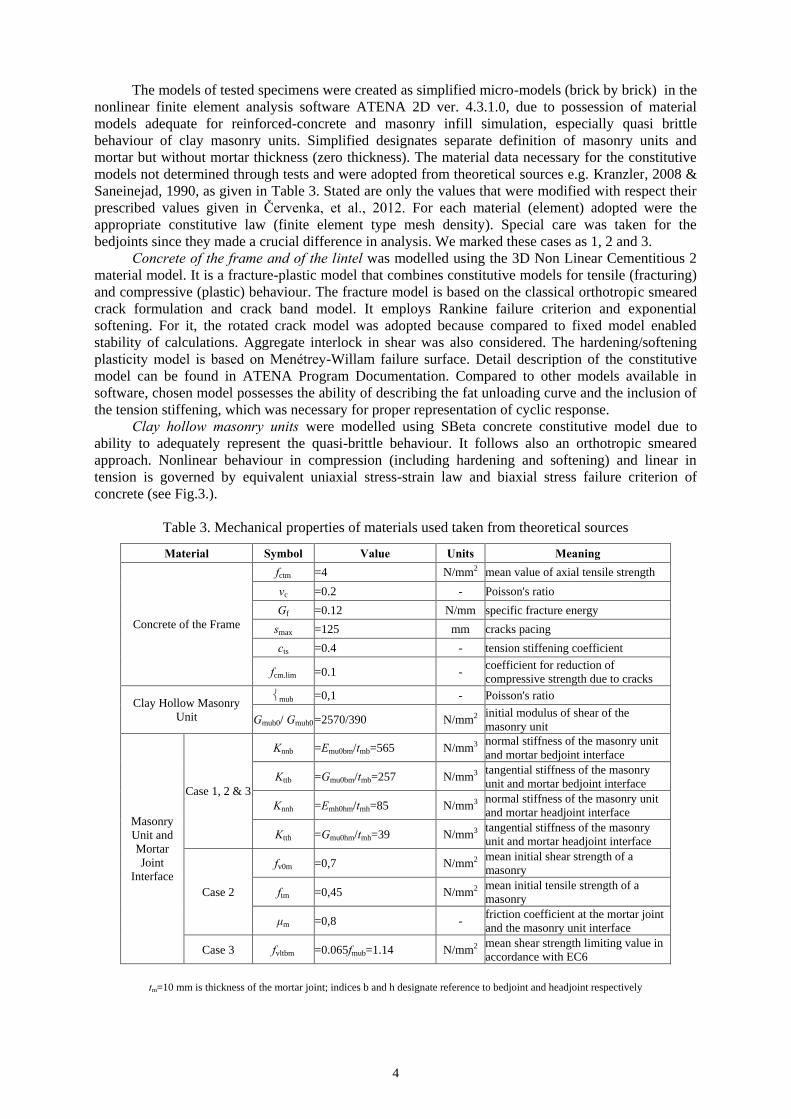
The models of tested specimens were created as simplified micro-models (brick by brick) in the
nonlinear finite element analysis software ATENA 2D ver. 4.3.1.0, due to possession of material
models adequate for reinforced-concrete and masonry infill simulation, especially quasi brittle
behaviour of clay masonry units. Simplified designates separate definition of masonry units and
mortar but without mortar thickness (zero thickness). The material data necessary for the constitutive
models not determined through tests and were adopted from theoretical sources e.g. Kranzler, 2008 &
Saneinejad, 1990, as given in Table 3. Stated are only the values that were modified with respect their
prescribed values given in Červenka, et al., 2012. For each material (element) adopted were the
appropriate constitutive law (finite element type mesh density). Special care was taken for the
bedjoints since they made a crucial difference in analysis. We marked these cases as 1, 2 and 3.
Concrete of the frame and of the lintel was modelled using the 3D Non Linear Cementitious 2
material model. It is a fracture-plastic model that combines constitutive models for tensile (fracturing)
and compressive (plastic) behaviour. The fracture model is based on the classical orthotropic smeared
crack formulation and crack band model. It employs Rankine failure criterion and exponential
softening. For it, the rotated crack model was adopted because compared to fixed model enabled
stability of calculations. Aggregate interlock in shear was also considered. The hardening/softening
plasticity model is based on Menétrey-Willam failure surface. Detail description of the constitutive
model can be found in ATENA Program Documentation. Compared to other models available in
software, chosen model possesses the ability of describing the fat unloading curve and the inclusion of
the tension stiffening, which was necessary for proper representation of cyclic response.
Clay hollow masonry units were modelled using SBeta concrete constitutive model due to
ability to adequately represent the quasi-brittle behaviour. It follows also an orthotropic smeared
approach. Nonlinear behaviour in compression (including hardening and softening) and linear in
tension is governed by equivalent uniaxial stress-strain law and biaxial stress failure criterion of
concrete (see Fig.3.).
Table 3. Mechanical properties of materials used taken from theoretical sources
Material Symbol Value Units Meaning
Concrete of the Frame
fctm =4 N/mm2 mean value of axial tensile strength
νc =0.2 - Poisson's ratio
Gf =0.12 N/mm specific fracture energy
smax =125 mm cracks pacing
cts =0.4 - tension stiffening coefficient
fcm.lim =0.1 - coefficient for reduction of
compressive strength due to cracks
Clay Hollow Masonry
Unit
mub =0,1 - Poisson's ratio
Gmub0/ Gmuh0 =2570/390 N/mm2 initial modulus of shear of the
masonry unit
Masonry
Unit and
Mortar
Joint
Interface
Case 1, 2 & 3
Knnb =Emu0bm/tmb=565 N/mm3 normal stiffness of the masonry unit
and mortar bedjoint interface
Kttb =Gmu0bm/tmb=257 N/mm3 tangential stiffness of the masonry
unit and mortar bedjoint interface
Knnh =Emh0hm/tmh=85 N/mm3 normal stiffness of the masonry unit
and mortar headjoint interface
Ktth =Gmu0hm/tmh=39 N/mm3 tangential stiffness of the masonry
unit and mortar headjoint interface
Case 2
fv0m =0,7 N/mm2 mean initial shear strength of a
masonry
ftm =0,45 N/mm2 mean initial tensile strength of a
masonry
μm =0,8 - friction coefficient at the mortar joint
and the masonry unit interface
Case 3 fvltbm =0.065fmub=1.14 N/mm2 mean shear strength limiting value in
accordance with EC6
tm=10 mm is thickness of the mortar joint; indices b and h designate reference to bedjoint and headjoint respectively
D.Penava, V.Sigmund & I.Kožar 5
Figure 3. Biaxial failure function (left) and uniaxial stress-strain law (right) for SBeta constitutive model
In tension after cracking an exponential crack opening law is adopted together with rotated
crack model. In compression post peak the end point of the softening curve is defined by means of the
plastic displacement. The model can produce crack but not discrete i.e. the unit cannot break. The clay
hollow masonry units were modelled as solid, using the properties of material perpendicular to
bedjoints (vertical direction). Model doesn’t allow taking the orthotropic properties that exist in
different directions due to units hollows (see Table 1). The lack of modelling the orthotropic
properties was compensated by defining mortar bedjoints and headjoints differently and by using
interface normal and tangential stiffness.
Mortar headjoints and bedjoints were modelled using the Interface material model (see Fig.4.).
It is a model based on Mohr-Coulomb criterion with tension cut off. The model is elastic in
compression. Three approaches i.e. cases for the modelling of mortar joints have been set. In the first
used were the material properties obtained from tests. In the second case instead of tested, the
theoretical values from literature sources were introduced, while in the third case the values from first
case i.e. original tests. The difference in-between the first and the third case is the user defined
function (shear stress-displacement) for softening or hardening after the failure of the initial shear
strength for the bedjoints. This had to be done due to inclination of mortar in hollows of masonry
units, as occurred in tests. The highest value of the function was defined as the failure of the unit (see
Table 2.) i.e. by using the limit value for shear from EC6. Corresponding displacements have been
established through trial and error process (see Fig.5.). The tensile strength is assumed as immediate
loss as soon as the strength value was reached i.e. the default value was not modified.
Figure 4. Mohr-Coulomb criterion for Interface material model
In all cases properties obtained for bedjoints were assigned equal for the bedjoints and
headjoints. On the other hand, also in all cases, normal and also tangential stiffness was different. This
is the result of their estimation on the basis of initial modulus of elasticity of neighbouring elements
i.e. masonry units. At the contact with the concrete frame or lintel the joint stiffness was assumed as in
other places in the infill wall. Due to zero thickness of the interface material model masonry units
were expanded to supplement it.
6
Figure 5. User defined function for shear (left) and failed masonry unit with inclined mortar (right)
Longitudinal and transversal steel reinforcement was modelled using the Menegoto-Pinto
cyclic reinforcement material model defined by bilinear with hardening stress-strain law. It was
adopted that the reinforcement is active in compression and that perfect bond between the
reinforcement and the concrete exists. In order to compensate the lack of bending and shear stiffness
(dowel action) for the discrete reinforcement bars in longitudinal direction, transversal bars were
supplied with additional area (Pryl & Červenka, 2013). This area was equal to area of longitudinal
reinforcement at observed plane. Also, the transversal bars at the beam and column ends had to be
moved from the exact crossing line in between the different structural parts. This was especially at the
column ends to prevent extensive concrete cracking (softening) in that region. It was observed on the
numerical model that at higher cycles of loading that the crack influence becomes higher than in
reality.
Steel pad was modelled using the Plane Stress Elastic Isotropic constitutive law. Its idea was to
take the point loads and transmit them equally to the beam and column ends, which would otherwise
cause inappropriate response. It was also used as the place where the applied loads and observed
displacements were monitored.
Frame, lintel, steel pad and masonry units were modelled using plane quadrilateral and
triangular finite elements, CCIsoQuad and CCIsoTriangle, respectively. Longitudinal and transversal
reinforcement was modelled using the discrete bars with the help of CCIsoTruss elements. Interface
was modelled using the nonlinear geometry CcIsoGap elements. The size of the elements set to 5 cm
was proven to be adequate for accuracy and time of calculations. The elements are shown in Fig.6.
a) CCIsoTriangle b) CCIsoQuad
c) CCIsoGap d) CCIsoTruss
Figure 6. Geometry of the finite elements used
D.Penava, V.Sigmund & I.Kožar 7
Boundary conditions of the model were built to match those from tests, as shown in Fig.2. Fixed
supports were added to the bottom line of foundation beam while sliding supports were placed on
column tops. Additionally, support was assigned to the beam left and right end to prevent vertical
movement. The last two were set to be active after vertical constant load on columns tops was applied.
In horizontal direction load was applied in cycles according to Fig.2 at left and right beam end i.e.
positive and negative direction. Both loads were applied as point loads on steel pads.
For the solution of the nonlinear equations the Full Newton-Rapshon method was employed
because of the loading and response characteristics of tests specimen.
CALCULATIONS AND RESULTS
The calculations were carried out in full accordance with the tests and description above to
obtain equal response. For the control of calculations primary (envelope) curves and crack (damage)
pattern as visual identification were used (see Fig.7,8 and 10.). The graphs show relation in-between
the average displacement d (mm) and applied base shear force V (kN) on primary axes, and drift
(dr=d/(hi+db/2) in % and base shear ratio (ratio of shear towards total axial loading) on secondary axes.
The frame without infill wall was calibrated first to eliminate one unknown from the framed-
wall system (establish a foothold). Then the analyses on frame with complete infill wall were
employed. In this step three approaches were exercised with the difference in the definition of mortar
joints as described earlier. These were necessary to obtain the satisfactory coincidence with the test
results. After obtaining good correlation with the tests (cases 2 and 3) the same material data were
used for the infill wall with opening cases. After unsuccessful attempt using the case 2 approaches, the
case 3, provided unique solution for all the specimens. Results are given separately for each case
previously described and compared to the ones from corresponding test.
Figure 7. Comparison of response obtained by tests and calculations for frame without and with infill wall
8
Figure 8. Comparison of response obtained by tests and calculations for frame without and with infill wall
D.Penava, V.Sigmund & I.Kožar 9
In Fig.9. shown are the cracked specimens at the breaking stage of the infill wall. The finite
element mesh is also visible. The frame without infill wall is not shown, since cracks obtained are
coincidental with other specimens i.e. bending tensile cracks.
Test Calcuations: 2nd
case Calcuations: 3rd
case
Figure 9. Cracks at break point of the infill wall
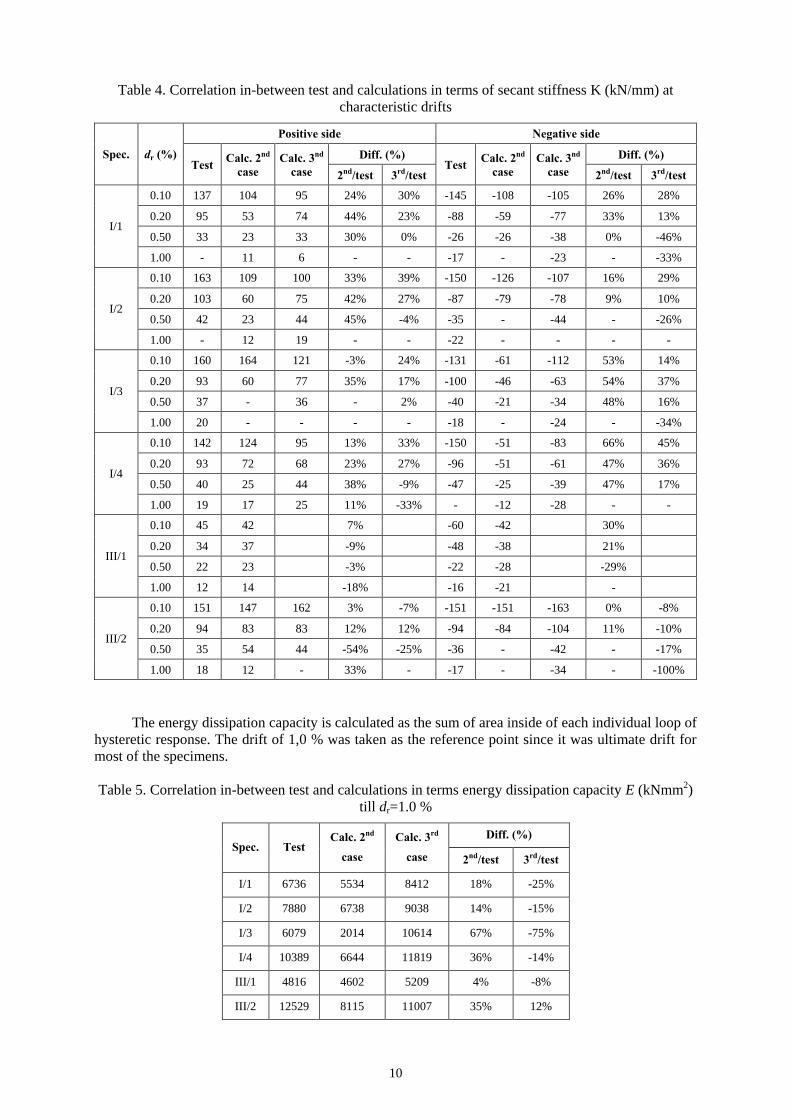
In Tables 4. and 5., shown are the differences in-between tests and calculations in terms of
secant stiffness K (kN/mm) and energy dissipation capacity E (kNmm2).
The secant stiffness was calculated as base shear force divided with corresponding displacement
at four characteristic drift points. These refer to slight (dr≈0,10%), medium (dr≈0,25%), heavy
(dr≈0,50%) and pre-collapse damage states (dr≈1,00%), as described in Sigmund & Penava, 2014.
10
Table 4. Correlation in-between test and calculations in terms of secant stiffness K (kN/mm) at
characteristic drifts
Spec. dr (%)
Positive side Negative side
Test Calc. 2
nd
case
Calc. 3nd
case
Diff. (%) Test
Calc. 2nd
case
Calc. 3nd
case
Diff. (%)
2nd
/test 3rd
/test 2nd
/test 3rd
/test
I/1
0.10 137 104 95 24% 30% -145 -108 -105 26% 28%
0.20 95 53 74 44% 23% -88 -59 -77 33% 13%
0.50 33 23 33 30% 0% -26 -26 -38 0% -46%
1.00 - 11 6 - - -17 - -23 - -33%
I/2
0.10 163 109 100 33% 39% -150 -126 -107 16% 29%
0.20 103 60 75 42% 27% -87 -79 -78 9% 10%
0.50 42 23 44 45% -4% -35 - -44 - -26%
1.00 - 12 19 - - -22 - - - -
I/3
0.10 160 164 121 -3% 24% -131 -61 -112 53% 14%
0.20 93 60 77 35% 17% -100 -46 -63 54% 37%
0.50 37 - 36 - 2% -40 -21 -34 48% 16%
1.00 20 - - - - -18 - -24 - -34%
I/4
0.10 142 124 95 13% 33% -150 -51 -83 66% 45%
0.20 93 72 68 23% 27% -96 -51 -61 47% 36%
0.50 40 25 44 38% -9% -47 -25 -39 47% 17%
1.00 19 17 25 11% -33% - -12 -28 - -
III/1
0.10 45 42 7% -60 -42 30%
0.20 34 37 -9% -48 -38 21%
0.50 22 23 -3% -22 -28 -29%
1.00 12 14 -18% -16 -21 -
III/2
0.10 151 147 162 3% -7% -151 -151 -163 0% -8%
0.20 94 83 83 12% 12% -94 -84 -104 11% -10%
0.50 35 54 44 -54% -25% -36 - -42 - -17%
1.00 18 12 - 33% - -17 - -34 - -100%
The energy dissipation capacity is calculated as the sum of area inside of each individual loop of
hysteretic response. The drift of 1,0 % was taken as the reference point since it was ultimate drift for
most of the specimens.
Table 5. Correlation in-between test and calculations in terms energy dissipation capacity E (kNmm2)
till dr=1.0 %
Spec. Test Calc. 2
nd
case
Calc. 3rd
case
Diff. (%)
2nd
/test 3rd
/test
I/1 6736 5534 8412 18% -25%
I/2 7880 6738 9038 14% -15%
I/3 6079 2014 10614 67% -75%
I/4 10389 6644 11819 36% -14%
III/1 4816 4602 5209 4% -8%
III/2 12529 8115 11007 35% 12%
D.Penava, V.Sigmund & I.Kožar 11
DISCUSSION AND CONCLUSIONS
Framed-wall models were created using the material models and finite elements that could
describe their structural behaviour the best. Afterwards, they were calibrated with the test results.
When concerning these results it should be noted that the properties of materials were taken as average
of all specimens and also as mean values. These properties were obtained by simple tests that could
not fully describe the actual situation in the structure.
Regarding the frame without infill wall specimen, the lack of bending and shear (dowel effect)
stiffness for the discrete reinforcement, could lead to inappropriate model, especially in the case of
dominant shear. This was compensated by increase of area of transversal reinforcement for assumed
quantity.
Framed-wall models of the case 3 provided the most acceptable solution in terms of primary
curves and cracks and applicability to all specimens as shown in Figs. 7., 8. and 9. The case 1 model
was not able to simulate exactly the complete infill wall specimen and thus the analysis was not
continued to other specimens. It was proven from this that initial values from simple tests were not
sufficient. The case 2 was applicable and its accuracy was limited only to complete infill wall case.
Case 3 had a user defined function for the bedjoint post-peak while others had just initial values
defined.
Difficulties for case 2 and also case 3 came from inability to model the orthotropic masonry unit
which was modelled as solid concrete object. Because of this, masonry units were rather pushed than
crushed as it was observed in tests, due to low horizontal compressive strength (Fig.5.). In other
words, model was more subdued to bejdoint sliding. This effect was not visible for complete infill
wall case since the wall was framed with stronger elements. It affected the specimens with openings
mostly. In Fig.5. also shown is the inclination of mortar in to holes of masonry units. This enabled for
the bedjoint to hold shear till the masonry unit fails. This property was the reason for use of the post-
peak function since it allowed for the shear strength to be increased for about three times with respect
to initial value.
Another problem, concerning the modelling of masonry units is in inability to break due to
smeared approach. The crack created in masonry unit could only lower its strength. In interaction with
the interface element this had led to numerical instabilities and computational effort was implemented
to find the proper post-peak curve. The concentration of stresses due to opening corners, especially
windows was also one of the reasons for the poor representation of the case 2. It influenced also, but
not in such quantity the results from case 3.
The stiffness values from Table 4. show that in general all models of the case 3 had somewhat
lower stiffness values for the cases with openings, yet again better than compared to the case 2.
Dissipated energy values from Table 5. were mostly influenced by high cycles. They showed good
resemblance towards tests except for the model with eccentric door.
It can be concluded that regarding the test uncertainties, that the results of the case 3 are
comparable with test results.
REFERENCES
Červenka V, Jendele L and Červenka J (2012) ATENA Program Documentation Part 1 Theory, Cervenka
Consulting Ltd., Prague
Kranzler T (2008) Trägfahigkeit überwiegend horizontal beanspruchter Aussteifungsscheiben aus unbewehrtem
Mauerwerk, Ph.D. Thesis, Technische Universität Darmstadt, Germany
Pryl D and Červenka J (2013) ATENA Program Documentation, Part 1 of 1, Troubleshooting Manual, Cervenka
Consulting Ltd., Prague
Saneinejad A (1990) Non-linear analysis of infilled frames. Ph.D. Thesis, University of Sheffield, England
Sigmund V and Penava D (2014) "Influence of Openings, With and Without Confinement, on Cyclic Response
of Infilled R-C Frames — An Experimental Study," Journal of earthquake engineering, 18(1):113-146
Stafford-Smith BS (1966) "Behavior of square infilled frames," Journal of Structural Division, 92(1):381-403